

Abstract
Background
Mesenchymal stem cells (MSCs) are capable of secreting different substances, including the anti-inflammatory protein TSG-6, which can be useful in the treatment of diseases with inflammatory reactions. The main aim of this study was to evaluate the expression of the TSG-6 gene in MSCs derived from the umbilical cord. For better understanding of the anti-inflammatory properties of MSCs, we additionally assessed the expression of some interleukins (ILs).
Material/Methods
The study group included 45 patients after delivery, aged from 21 to 46 years; the average patient age was 33 years. MSCs were isolated enzymatically from umbilical cord Wharton’s jelly, in vitro cultured, and characterized using flow cytometry; qPCR was performed to assess expression of the studied genes. The expression of genes of a number of pro-inflammatory ILs in MSCs was investigated in relation to the health of patients (coexistence of hypertension), the level of leukocytes, pCO2, and hemoglobin in the blood.
Results
Our research showed that the expression of the TSG-6 gene in MSCs depends on coexisting diseases in the patient and the biochemical parameters of umbilical cord blood, including the important role of cord blood pH. We found that the levels of IL2 and IL6 expression were correlated with pCO2, and IL6 expression were correlated with pO2.
Conclusions
Our study suggests that maternal health status and cord blood biochemical parameters could affect the anti-inflammatory properties of MSCs; however, this needs to be confirmed in a future study.
Keywords: Gene Expression; Mesenchymal Stem Cells; MSC 127; TNFAIP6 Protein, Human
Background
Mesenchymal stem cells (MSCs) are multipotential cells. According to the International Society for Cell and Gene Therapy, the correct name is “multipotent mesenchymal stromal cells”. The term “mesenchymal cells” is synonymous with embryonic connective tissue, which, as the name suggests, only occur in the dividing embryo [1]. MSCs are derived from the third germ layer, the mesoderm, which makes the production of the cells that ultimately make up the connective tissue in the body possible [1].
Clinically, human MSCs are derived from adult bone marrow, adipose tissue, dental pulp, and peripheral blood. The MSCs extracted from perinatal tissues (such as the placenta, umbilical cord, or amnion) in newborns have characteristics that make them superior to cells obtained from adults. These characteristics include proliferative capacity, capability for differentiation, cell longevity (and growth), and a reduced capacity to provoke an immune response (lower immunogenicity) [2,3].
The features that are particularly related to MSCs are a high differentiation potential, especially toward bone tissue, cartilage tissue, and adipose tissue, and the ability of the MSCs to renew themselves. Visually, they are fusiform in shape and resemble fibroblasts. In vitro they show adhesion to plastic, and in regards to human phenotype, they also possess human surface antigens, which are also MSC markers: CD73, CD90, and CD105. Negative MSC markers, which do not show expression in these cells, are CD11b, CD14, CD19, CD34, CD45, and CD79a. It is significant that there are no class II histocompatibility antigens on the MSC surface [1,4,5].
Apart from differentiation potential, MSCs have many other properties. MSCs are capable of secreting substances such as growth factors, angiogenesis stimulation factors, and anti-apoptotic factors [6]. Moreover, MSCs show anti-inflammatory effects, which are mainly caused by the tumor necrosis factor (TNF)-stimulated gene-6 (TSG-6) protein secreted by these cells [7].
TSG-6 is a multifunctional protein with anti-inflammatory and tissue protective properties that mediate the beneficial effects of MSCs. In recent years, the potential of TSG-6 as a therapeutic agent has been emphasized in a wide range of indications [8].
Expression of the TSG-6 gene is stimulated as a result of pro-inflammatory cytokines and results in the increase of the TSG-6 protein level. This protein stimulates transforming pro-inflammatory M1 macrophages to anti-inflammatory M2 macrophages [9], inhibits NF-κB factor [10], and limits the activity of the body’s immune cells [11–12], which as a whole translates into a strong anti-inflammatory effect.
It was observed that TSG-6 can be used in the therapy of inflammatory diseases. It was shown that TSG-6 has a positive effect on neural system inflammation [13], reduces swelling in arthritis [14], and also limits the size of a myocardial infarction [7]. Moreover, the latest studies report the possible use of TSG-6 in the diagnosis of acute ischemic stroke [15] and rheumatoid arthritis [16]. It has been shown that the use of MSCs to induce neuroprotection and the lasting alleviation of neuropathic pain is dependent on the secretion of TSG-6 by these cells [13]. Additionally, Li et al indicated the potential use of MSCs in clinical recurrent miscarriages is possible due to the TSG-6-dependent mechanisms [17].
Because numerous studies have shown that the immunomodulatory properties of MSCs are dependent on TSG-6, we speculated that the level of TSG-6 expression in MSCs will influence their clinical utility and therapeutic potential. Owing to the significant role of the TSG-6 protein in suppressing the inflammatory reaction and potential use of MSCs in therapy, the aim of our study was to evaluate the expression of the TSG-6 gene in MSCs derived from the Wharton’s jelly of the umbilical cord. The study assessed the level of expression depending on the health of the mother, type of delivery, use of oxytocin, and cord blood parameters.
The anti-inflammatory activity of MSCs mediated by the TSG-6 protein has already been proven, but no studies indicate which sources of MSCs are the most optimal in this regard. There is no information of laboratory parameters affecting expression of that gene. To the best of our knowledge, the present study is the first to evaluate the level of TSG-6 expression in MSCs obtained from the umbilical cord in relation to the biochemical parameters of cord blood and health status of the cell donor.
Our study will provide new information about TSG-6, and therefore about the anti-inflammatory properties of MSCs, what may be crucial for further use of MSCs and TSG-6 in therapy.
Material and Methods
Sample Collection and Ethics Approval
The material used for the research was the umbilical cord, which was collected shortly after delivery from 45 patients hospitalized at the Department of Obstetrics and Pathology of Pregnancy of the Independent Public Clinical Hospital No. 1 in Lublin. The research was conducted with the consent of the Bioethics Committee at the Medical University of Lublin (KE-0254/128/2014).
The age of the patients ranged from 21 to 46 years; the average patient age was 33 years. A total of 6 patients (13%) had a vaginal delivery, while 37 patients had a cesarean section. Ten patients (22%) out of 45 patients were treated with oxytocin during labor.
Eleven patients gave birth before 37 weeks of pregnancy, and 22 patients gave birth for the first time (18 of them were pregnant for the first time). The women gave birth to 25 boys and 20 girls. Gestational diabetes was diagnosed in 13 patients, hypertension in 8 patients, and hypothyroidism in 14 patients; 3 patients had diabetes and hypertension at the same time, and 4 patients had diabetes and hypothyroidism at the same time. A total of 17 patients had no comorbidities and had healthy babies born full term (control group). Patient characteristics are shown in Tables 1 and 2.
Table 1.
Characteristics of the study group (n=45) in terms of: mother’s age, number of pregnancies, number of deliveries, weeks of gestation, newborn’s weight, and cord blood parameters.
| Parameter | n | Mean | Median | Minimum | Maximum | SD | SE |
|---|---|---|---|---|---|---|---|
| Mother’s age | 45 | 33.11 | 33.00 | 21.00 | 46.00 | 5.26 | 0.78 |
| Number of pregnancies | 2.02 | 2.00 | 1.00 | 5.00 | 1.06 | 0.16 | |
| Number of deliveries | 1.73 | 2.00 | 1.00 | 5.00 | 0.91 | 0.14 | |
| Weeks of gestation | 38.29 | 38.00 | 34.00 | 41.00 | 1.42 | 0.21 | |
| Newborn’s weight | 3230.67 | 3240.00 | 2460.00 | 4060.00 | 387.48 | 57.76 | |
| Cord blood parameters | |||||||
| pH | 7.33 | 7.34 | 7.03 | 7.45 | 0.07 | 0.01 | |
| PO2 | 29.16 | 29.30 | 16.00 | 52.90 | 8.06 | 1.20 | |
| pCO2 | 44.73 | 41.90 | 30.40 | 77.60 | 8.96 | 1.34 | |
| WBC | 10.65 | 9.89 | 5.14 | 18.73 | 2.81 | 0.42 | |
| RBC | 4.05 | 4.03 | 2.79 | 4.83 | 0.42 | 0.06 | |
| HGB | 12.14 | 12.30 | 9.40 | 14.10 | 1.08 | 0.16 | |
| HCT | 35.48 | 35.80 | 27.50 | 41.30 | 2.93 | 0.44 | |
| MCV | 87.90 | 89.10 | 77.40 | 98.60 | 4.95 | 0.74 | |
| MCH | 30.09 | 30.60 | 25.40 | 34.40 | 2.23 | 0.33 | |
| MCHC | 34.20 | 34.30 | 31.70 | 36.60 | 1.07 | 0.16 | |
| PLT | 205.44 | 199.00 | 121.00 | 324.00 | 46.44 | 6.92 |
pH – potential of hydrogen; pO2 – partial pressure of oxygen; pCO2 – partial pressure of carbon dioxide; WBC – white blood cell count; RBC – red blood cell count; HGB – hemoglobin; HCT – hematocrit; MCV – mean corpuscular volume; MCH – mean corpuscular hemoglobin; MCHC – mean corpuscular hemoglobin concentration; PLT – platelet count; SD – standard deviation; SE – standard error.
Table 2.
Characteristics of the control group (n=17), patients with gestational diabetes (n=13), patients with hypertension (n=8), and patients with hypothyroidism (n=14) in terms of mother’s age, number of pregnancies, number of deliveries, weeks of gestation, newborn’s weight, and cord blood parameters.
| Parameter | n | Mean | Median | Minimum | Maximum | SD | SE |
|---|---|---|---|---|---|---|---|
| Control group | |||||||
| Mother’s age | 17 | 32.412 | 32.000 | 23.000 | 39.000 | 4.388 | 1.064 |
| Number of pregnancies | 2.059 | 2.000 | 1.000 | 4.000 | 0.966 | 0.234 | |
| Number of deliveries | 1.824 | 2.000 | 1.000 | 4.000 | 0.883 | 0.214 | |
| Weeks of gestation | 38.471 | 39.000 | 34.000 | 41.000 | 1.700 | 0.412 | |
| Newborn’s weight | 3337.059 | 3300.000 | 2660.000 | 4060.000 | 396.701 | 96.214 | |
| Cord blood parameters | |||||||
| pH | 7.308 | 7.340 | 7.030 | 7.380 | 0.097 | 0.024 | |
| pCO2 | 46.847 | 42.200 | 35.300 | 77.600 | 11.601 | 2.814 | |
| pO2 | 28.035 | 29.100 | 18.000 | 42.100 | 7.713 | 1.871 | |
| cHCO3 | 22.300 | 22.600 | 17.000 | 24.600 | 2.004 | 0.486 | |
| WBC | 10.763 | 10.460 | 5.140 | 16.930 | 2.992 | 0.726 | |
| RBC | 4.089 | 4.020 | 3.580 | 4.830 | 0.348 | 0.084 | |
| HCT | 35.482 | 35.300 | 29.800 | 41.300 | 3.058 | 0.742 | |
| HGB | 12.153 | 12.100 | 10.000 | 14.100 | 1.203 | 0.292 | |
| MCV | 86.818 | 87.100 | 79.800 | 92.400 | 3.450 | 0.837 | |
| MCH | 29.735 | 30.000 | 25.800 | 31.800 | 1.771 | 0.429 | |
| MCHC | 34.241 | 34.400 | 31.700 | 36.100 | 1.157 | 0.281 | |
| PLT | 194.000 | 195.000 | 121.000 | 268.000 | 41.195 | 9.991 | |
| Gestational diabetes | |||||||
| Mother’s age | 13 | 36.462 | 36.000 | 29.000 | 46.000 | 4.630 | 1.284 |
| Number of pregnancies | 2.462 | 2.000 | 1.000 | 5.000 | 1.198 | 0.332 | |
| Number of deliveries | 2.000 | 2.000 | 1.000 | 5.000 | 1.155 | 0.320 | |
| Weeks of gestation | 37.846 | 38.000 | 37.000 | 40.000 | 0.899 | 0.249 | |
| Newborn’s weight | 3140.000 | 2910.000 | 2460.000 | 3950.000 | 470.266 | 130.428 | |
| Cord blood parameters | |||||||
| pH | 7.344 | 7.340 | 7.300 | 7.390 | 0.028 | 0.008 | |
| pCO2 | 42.500 | 41.900 | 36.700 | 50.700 | 3.711 | 1.029 | |
| pO2 | 31.777 | 31.000 | 21.600 | 52.900 | 9.270 | 2.571 | |
| cHCO3 | 22.615 | 22.200 | 19.700 | 24.900 | 1.332 | 0.369 | |
| WBC | 9.719 | 9.390 | 5.970 | 18.730 | 3.152 | 0.874 | |
| RBC | 3.876 | 3.850 | 2.790 | 4.690 | 0.568 | 0.157 | |
| HCT | 34.431 | 35.700 | 27.500 | 38.200 | 3.591 | 0.996 | |
| HGB | 11.738 | 12.100 | 9.400 | 13.200 | 1.194 | 0.331 | |
| MCV | 89.454 | 90.500 | 79.300 | 98.600 | 5.950 | 1.650 | |
| MCH | 30.554 | 30.700 | 25.400 | 34.400 | 2.540 | 0.704 | |
| MCHC | 34.115 | 34.200 | 32.000 | 35.400 | 0.958 | 0.266 | |
| PLT | 206.077 | 209.000 | 126.000 | 283.000 | 50.454 | 13.993 | |
| Hypertension | |||||||
| Mother’s age | 8 | 32.400 | 33.000 | 24.000 | 39.000 | 6.066 | 2.713 |
| Number of pregnancies | 2.400 | 2.000 | 1.000 | 5.000 | 1.517 | 0.678 | |
| Number of deliveries | 2.400 | 2.000 | 1.000 | 5.000 | 1.517 | 0.678 | |
| Weeks of gestation | 38.400 | 38.000 | 37.000 | 40.000 | 1.140 | 0.510 | |
| Newborn’s weight | 3092.000 | 3240.000 | 2460.000 | 3410.000 | 372.250 | 166.475 | |
| Cord blood parameters | |||||||
| pH | 7.320 | 7.310 | 7.300 | 7.370 | 0.028 | 0.013 | |
| pCO2 | 46.844 | 47.700 | 38.900 | 50.820 | 4.875 | 2.180 | |
| pO2 | 28.040 | 26.600 | 21.800 | 38.800 | 6.722 | 3.006 | |
| cHCO3 | 23.500 | 23.400 | 22.000 | 25.000 | 1.428 | 0.639 | |
| WBC | 10.138 | 10.070 | 5.970 | 13.720 | 3.422 | 1.530 | |
| RBC | 4.406 | 4.500 | 3.970 | 4.740 | 0.346 | 0.155 | |
| HCT | 36.280 | 36.400 | 35.000 | 37.500 | 0.968 | 0.433 | |
| HGB | 12.300 | 12.400 | 12.000 | 12.400 | 0.173 | 0.077 | |
| MCV | 82.640 | 83.300 | 77.400 | 89.900 | 5.281 | 2.362 | |
| MCH | 28.060 | 27.600 | 25.500 | 31.200 | 2.522 | 1.128 | |
| MCHC | 33.920 | 33.400 | 33.000 | 35.400 | 1.071 | 0.479 | |
| PLT | 222.000 | 196.000 | 172.000 | 324.000 | 62.221 | 27.826 | |
| Hypothyroidism | |||||||
| Mother’s age | 14 | 32.429 | 33.000 | 21.000 | 41.000 | 5.667 | 1.514 |
| Number of pregnancies | 2.071 | 2.000 | 1.000 | 4.000 | 1.141 | 0.305 | |
| Number of deliveries | 1.571 | 1.000 | 1.000 | 3.000 | 0.756 | 0.202 | |
| Weeks of gestation | 38.286 | 39.000 | 34.000 | 40.000 | 1.437 | 0.384 | |
| Newborn’s weight | 3125.714 | 3110.000 | 2590.000 | 3500.000 | 309.260 | 82.653 | |
| Cord blood parameters | |||||||
| pH | 7.359 | 7.355 | 7.240 | 7.450 | 0.056 | 0.015 | |
| pCO2 | 42.921 | 41.150 | 30.400 | 63.400 | 8.374 | 2.238 | |
| pO2 | 30.343 | 31.200 | 16.000 | 41.200 | 8.306 | 2.220 | |
| cHCO3 | 23.279 | 22.950 | 20.700 | 26.200 | 1.524 | 0.407 | |
| WBC | 10.623 | 9.835 | 8.130 | 14.820 | 2.030 | 0.542 | |
| RBC | 4.044 | 4.100 | 3.460 | 4.690 | 0.333 | 0.089 | |
| HCT | 35.864 | 36.500 | 31.600 | 38.900 | 2.499 | 0.668 | |
| HGB | 12.221 | 12.300 | 10.800 | 13.600 | 0.928 | 0.248 | |
| MCV | 88.857 | 90.800 | 79.300 | 92.600 | 4.111 | 1.099 | |
| MCH | 30.336 | 30.700 | 25.400 | 32.800 | 2.228 | 0.595 | |
| MCHC | 34.079 | 33.900 | 32.000 | 36.600 | 1.260 | 0.337 | |
| PLT | 221.357 | 211.500 | 158.000 | 286.000 | 47.020 | 12.567 | |
pH – potential of hydrogen; pO2 – partial pressure of oxygen; pCO2 – partial pressure of carbon dioxide; WBC – white blood cell count; RBC – red blood cell count; HGB – hemoglobin; HCT – hematocrit; MCV – mean corpuscular volume; MCH – mean corpuscular hemoglobin; MCHC – mean corpuscular hemoglobin concentration; PLT – platelet count; SD – standard deviation; SE – standard error.
Isolation of MSCs from Umbilical Cord
MSCs were isolated using an enzymatic digestion method. Immediately after delivery, the umbilical cord (10-cm piece) was placed in a culture medium containing Dulbecco’s Modified Eagle Medium (DMEM) with L-glutamine (584 mg/L) and glucose (4.5 g/L; Corning, Manassas, VA, USA) with 10% fetal bovine serum (FBS; ATCC, Teddington, UK) and 1% addition of antibiotic (penicillin-streptomycin, 10000 U and 10 mg/mL, respectively; Sigma-Aldrich, Israel). The umbilical cord was then rinsed several times in sterile phosphate buffered saline (PBS; Biomed Lublin, Poland) containing the antibiotic and cut into smaller pieces with a scalpel under aseptic conditions. Fragments of umbilical cord (2–5 mm) were digested in a sterile type I collagenase solution (1 mg/mL; Gibco by Life Technologies, Grand Island, NY, USA) for 2 to 3 h, while maintaining a temperature of 37°C at 300 rpm (Eppendorf Thermomixer comfort). After this, the sample was washed twice with warm PBS buffer (21°C, 128 g; Eppendorf Centrifuge 5810 R). The last step was to filter the sample after it was rinsed through a 100-μm sieve to clean the mixture for further testing. After the cells were filtered, they were rinsed in warm PBS with 1% antibiotic, the collagenase was stopped by adding FBS, the sample was centrifuged with warm PBS buffer (21°C, 128 g, 10 min Eppendorf Centrifuge 5810R), and the cell pellet was transferred to a culture vessel. The procedure of cell isolation and cell culture was done as described in a previous study [18].
Cell Culture
The isolated umbilical cord cells were cultured in vitro for up to 14 days in adherent conditions in a tissue incubator (New Brunswick Galaxy 170 R). Incubation conditions were as follows: temperature 37°C, O2 concentration 15%, CO2 concentration 5%, and moisture 95%. The culture medium (10 mL) consisted of DMEM medium with L-glutamine and glucose, with 10% FBS and a 1% addition of antibiotic (penicillin-streptomycin). The bottle for cell culture had bottom surface area of 25 cm2 (TC Flask T 25, Cell+; Sarsted, Germany). The cultures were observed every few days, and the medium was changed every 3 days. After successful in vitro culture, the isolated MSCs were detached from the surface of the culture vessel using a sterile cell scraper (Corning). Finally, these cells were washed in PBS buffer. Cells after culture were divided and some were used for cytometric analysis, some for RNA isolation.
Cytometric Analysis
Cytometric analysis was performed using a Navios flow cytometer (Beckman Coulter) to assess cell phenotype. The analysis was performed according to protocols presented in previous studies [19–21]. In vitro cultured umbilical cord MSCs, at a concentration of about 106/mL, were taken and suspended in a volume of 100 μL and added to a DuraClone SC Mesenchymal Tube antibodies panel (Beckman Coulter, Bangalore, Karnataka, India), then shaken for 6 s. Subsequently, the cells were incubated in the dark for 15 min at room temperature. The following DuraClone MSCs containing a lyophilisate set of fluorescently labeled monoclonal antibodies against MSC surface antigens were used: CD45-APC, CD73-PE, CD90-FITC, CD105-PC7, CD146-PC 5.5, CD31-PBE, CD14/CD19-Krome Orange, dedicated to the determination of characteristic MSC antigens. After incubation, 2 mL of PBS without calcium and magnesium ions (Biomed, Lublin, Poland) was added. Then, they were centrifuged at 200 g for 5 min. After centrifugation, the cell pellet was dissolved in 400 μL PBS without calcium and magnesium ions. The labeled cells were placed on a Navios flow cytometer carousel and subjected to cytometric analysis. Typically, an analysis of 10 000 events was recorded for the assays. Cells without any staining were used as a negative control, and an isotype control was performed. Single-stained samples were used for compensation. Fluorescence minus one (FMO) samples were used to determine the gating.
RNA Isolation
Total cellular RNA of the obtained umbilical cord MSCs was isolated by the modified method of Chomczyński and Sacchi [22], using TRIzol (Thermo Fisher Scientific, USA), chloroform (Sigma), isopropanol (Sigma), and 75% ethanol (Poch).
After culture, the cell sample was homogenized in 0.5 mL of TRIzol, then incubated for 5 min at room temperature; 0.1 mL of chloroform was successively added, and the sample was shaken for 15 s, incubated for 15 min at room temperature, then centrifuged for 15 min at 4°C, at a speed of 12000 g (Eppendorf Centrifuge 5415 R). After centrifugation, the aqueous phase was withdrawn into a new tube. An amount of 0.25 mL of isopropanol was added to the aqueous phase, incubated for 20 min at room temperature, and then centrifuged for 20 min at 4°C, at 12 000 g (Eppendorf Centrifuge 5415 R). After centrifugation, the supernatant was discarded and the RNA pellet was purified in 75% ethanol, then dissolved in ultrapure water, free of RNase and DNase. Before the next stages of research with the use of isolated RNA, qualitative and quantitative analysis of these isolates was performed using the spectrophotometric method (Nanodrop 2000 c) at wavelengths 260 nm and 280 nm.
Reverse Transcription
The cDNA synthesis was performed using the High-Capacity cDNA Transcription Kit from Applied Biosystems (Thermo Fisher Scientific, Lithuania) and 1 μg of test RNA isolated in the previous step, according to the manufacturer’s protocol.
The reverse transcription reaction was carried out in a volume of 20 μL, consisting of: 1 μL (RNase 40 U/μL); 1 μL (reverse transcriptase 50 U/μL); 2 μL (10xRT Buffer); 3.2 μL (Ultrapure water); 0.8 μL (10 xdNTPs (100 mM); 2 μL (10 xRT Random Primer); and 10 μL (1 μg RNA dissolved in 10 μL ultrapure water). The reaction was conducted in a Verit Thermal Cycler (Life Technologies); the reaction mixture was incubated at 25°C for 10 min, then at 37°C for 2 h, and then at 95°C for 5 min. The obtained cDNA was used for real-time PCR.
Evaluation of the Expression Level of the Studied Genes
To assess the expression level of the studied genes, IL1A, IL1B, IL1R, IL2, IL6, IL6R, and TSG-6, the real-time PCR method was used. Real-time PCR reactions were performed in 0.1-mL 96-well plates (Applied Biosystems, USA) using cDNA reverse transcription as a template, in a volume of 10 μL/well consisting of 0.5 μL gene-specific primers and probe, 4.5 μL cDNA synthesized by reverse transcription with ultrapure RNAse- and DNAse-free water, and 5 μL TaqMan Gene Expression Master Mix (Applied Biosystems, USA). The reaction, after an initial 10-min denaturation at 95°C, was conducted for 40 cycles according to the following scheme: 15 s at 95°C, then 60 s at 60°C. mRNA expression was detected using the StepOnePlus System (Applied Biosystems, USA). The level of relative expression (RQ) was assessed according to the formula proposed by Livak, where RQ=2−ddCt [23]. To normalize the expression of the tested genes, the cycle threshhold value was determined for each sample against the reference gene that showed the greatest stability in the tested material, namely, the glyceraldehyde 3-phosphate dehydrogenase (GAPDH) gene. In the study, B2M and ACTB were also considered as endogenous controls, but GAPDH turned out to be the best control. Final gene expression was determined relative to the sample used to calibrate the entire experiment. The expression of the studied genes was analyzed using ExpressionSuite Software v.1.0.3. (Life Technologies). The following TaqMan primers and probes were used for the genes tested: (for TSG-6: NM_007115.3 and Hs00200180_m1, for IL6: NM_000600.4 and Hs00174131_m1, for ILR6: NM_000565.3 and Hs00169842_m1, for Il1A: NM_000575.4 and Hs00174092_m1, for IL1B: NM_000576.2 and Hs00174097_m1, for Il1R: NM_000877.3 and Hs00168392_m1, for Il2: NM_000586.3 and Hs00174114_m1). The reference gene for endogenous control was the GAPDH gene (NM_001289746.1 and Hs99999905_m1). Three technical repetitions were performed on each test sample. The procedure for RNA isolation and evaluation of gene expression is described in the work of Gil-Kulik et al [24,25].
Statistical Analysis
The results of statistical analyzes were obtained with the Statistica v.13 program, using the Mann-Whitney U test and the Spearman’s rank correlation coefficient. Statistical significance was established at the level of P<0.05.
Evaluation of Clinical Data
In taking the medical history of patients, doctors of the Department of Obstetrics and Pathology of Pregnancy assessed the age and comorbidities of the patients, weeks of gestation, weight of the newborn, sex of the newborn, and patient’s past illnesses. The biophysical parameters of umbilical cord blood were assessed in the Department of Obstetrics just after delivery on an ABL90 FLEX gas analyzer (Radiometer, Denmark).
Results
Cytometric analysis and cell culture confirmed that MSCs were isolated from the umbilical cord. The ability of adherence to the plastic walls and the fibroblast-like shape of cells were confirmed (Figure 1), and antigens characteristic for MSCs, such as CD73, CD90, CD105, and CD146, and lack of CD45, CD31, CD19, and CD14 were demonstrated on the surface of the cells (Figure 2). High expression of SOX2, POU5F,1 and NANOG genes, which are the main factors of stem cell pluripotency, was observed in the examined cells (expression results of POU5F1, NANOG, and SOX2 were not published in this report). Researchers are also looking to the potential of multi-lineage differentiation to characterize MSCs; however, in this study, we did not test the differentiation potential.
Figure 1.
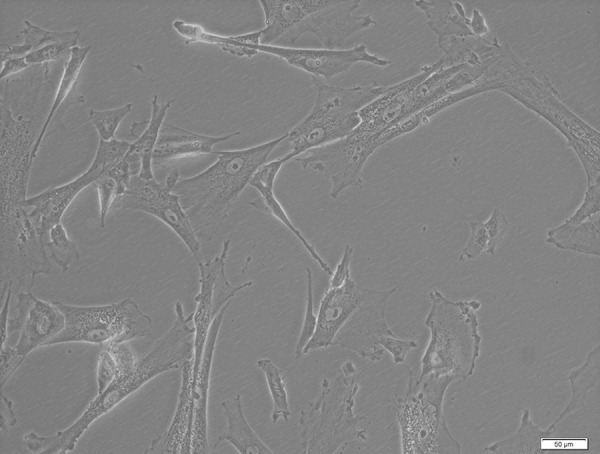
Mesenchymal stem cells from a 5-day culture. Bright field microscopy (BF), 200× magnification, using Xcellence RT system with an IX81 inverted microscope (Olympus).
Figure 2.

Cytometric evaluation of the expression of CD146, CD73, CD90, and CD105 surface antigens on the tested cells. DuraClone SC Mesenchymal Tube antibodies, Navios cytometer (Beckman Coulter). Sample immunophenotype analysis of umbilical cord-derived mesenchymal stem cells (MSCs) after in vitro culture. (A) Cytogram: cell population negative for CD45 antigen (CD45−). (B) Cytogram: percentage of CD31-negative and CD146-positive cells (CD146+CD31−). (C) Cytogram: percentage of cell population expressing CD90 antigen and CD73 antigen (CD90+CD73+). (D) Cytogram: percentage of umbilical cord MSCs positive for CD90, CD105, CD73 (CD90+CD105+CD73+). (E) MSC positive for CD90, CD105, CD73 and negative for CD14 and CD19 (CD90+CD105+CD73+CD14−CD19−).
Molecular analysis showed the presence at the mRNA level of all tested genes in umbilical cord MSCs. We assessed the dependence of the expression of tested genes (TSG-6, IL1A, IL1B, IL2, IL6, IL6R) on patient age, comorbidities, gestation period, newborn’s weight, sex of the newborn, and the following biophysical parameters of umbilical cord blood: partial pressure of hydrogen (pH), partial pressure of oxygen (pO2), partial pressure of carbon dioxide (pCO2), white blood cell count (WBC), red blood cell count (RBC), hemoglobin (HGB), hematocrit (HCT), mean corpuscular volume (MCV), mean corpuscular hemoglobin (MCH), mean corpuscular hemoglobin concentration (MCHC), and platelet count (PLT).
Influence of pH
Analyzing the expression of genes tested from umbilical cord blood pH, we observed that the expression of the TSG-6 gene in MSCs was statistically significantly nearly 5 times higher (P=0.032) at umbilical cord blood pH greater than or equal to 7.35, compared with at lower pH values (Figure 3A). Spearman’s rank correlation analysis showed that the level of TSG-6 gene expression in MSCs was statistically significantly positively correlated with cord blood pH (r=0.402, P<0.05; Figure 3B, Table 3). Moreover, the analysis of the correlation of the expression of the studied genes with the cord blood pH in MSCs collected from healthy women showed a negative correlation with the expression of IL1A (r=−0.625, P<0.05) and with the expression of IL6 (r=us;0.638, P<0.05; Table 4). There was no significant correlation between the expression levels of IL1B, IL1R, IL2, and IL6R genes with cord blood pH.
Figure 3.

(A) Mean TSG-6 gene expression (relative level of expression±standard error [RQ±SE]) in tested mesenchymal stem cells (MSCs) depending on umbilical cord blood pH. * P<0.05 Mann-Whitney U test. (B) Graph of distribution TSG-6 gene expression in tested MSCs and umbilical cord blood pH. Spearman’s rank factor r=0.402, P<0.05. (C) Mean IL2 and IL6 gene expression (relative level of expression±standard error [RQ±SE]) in tested MSCs, based on the umbilical cord blood pCO2. * P<0.05 Mann-Whitney U test. (D) Mean IL1A and IL1B gene expression (RQ±SE) in tested MSCs depending on umbilical cord blood white blood cell count. * P<0.05 Mann-Whitney U test. (E) Mean IL6 gene expression (RQ±SE) in tested MSCs, based on umbilical cord blood hemoglobin level. * P<0.05 Mann-Whitney U test.
Table 3.
Correlations between the parameters studied in the entire study group (n=45).
| Parameter | RQ IL1A | RQ IL1B | RQ IL1R1 | RQ IL2 | RQ IL6 | RQ IL6R | RQ TSG-6 |
|---|---|---|---|---|---|---|---|
| RQ IL1A | 1.000 | 0.635 * | 0.328 * | −0.585* | 0.606 * | −0.280 | 0.235 |
| RQ IL1B | 0.635 * | 1.000 | 0.074 | −0.190 | 0.473 | −0.291 | 0.514 * |
| RQ IL1R1 | 0.328 * | 0.074 | 1.000 | −0.194 | 0.396 | 0.370 * | 0.511 * |
| RQ IL2 | −0.585* | −0.190 | −0.194 | 1.000 | −0.286 | 0.260 | 0.149 |
| RQ IL6 | 0.606 * | 0.473 * | 0.396 * | −0.286 | 1.000 | −0.337* | 0.305 |
| RQ IL6R | −0.280 | −0.291 | 0.370 * | 0.260 | −0.337* | 1.000 | 0.034 |
| RQ TSG-6 | 0.235 | 0.514 * | 0.511 * | 0.149 | 0.305 | 0.034 | 1.000 |
| Mother’s age | 0.366 * | 0.256 | −0.008 | −0.265 | 0.233 | −0.322* | 0.183 |
| Number of pregnancies | −0.211 | 0.102 | −0.151 | 0.184 | −0.165 | −0.078 | 0.015 |
| Number of deliveries | −0.161 | 0.124 | −0.075 | 0.224 | −0.058 | −0.179 | 0.183 |
| Weeks of gestation | 0.114 | 0.153 | −0.119 | −0.117 | 0.168 | −0.280 | −0.141 |
| Newborn weight | 0.073 | 0.143 | −0.010 | −0.023 | 0.183 | −0.243 | −0.167 |
| pH | −0.045 | −0.086 | 0.123 | 0.362 | −0.054 | 0.084 | 0.402 * |
| pCO2 | 0.139 | 0.116 | −0.062 | −0.494* | 0.470 * | −0.119 | −0.280 |
| PO2 | −0.096 | 0.065 | −0.165 | 0.207 | −0.441* | 0.072 | 0.151 |
| cHCO3 | 0.166 | 0.027 | 0.118 | −0.008 | 0.248 | −0.208 | 0.176 |
| WBC | 0.163 | 0.123 | −0.084 | 0.032 | 0.026 | −0.013 | 0.002 |
| RBC | −0.005 | 0.142 | −0.188 | −0.130 | 0.012 | −0.076 | −0.242 |
| HGB | 0.285 | 0.152 | 0.233 | −0.262 | 0.361 * | −0.134 | 0.132 |
| HCT | 0.076 | 0.150 | 0.100 | −0.178 | 0.178 | −0.056 | −0.022 |
| MCV | 0.197 | −0.009 | 0.314 | −0.265 | 0.219 | −0.048 | 0.260 |
| MCH | 0.277 | 0.015 | 0.277 | −0.179 | 0.317 * | −0.344* | 0.323 * |
| MCHC | 0.359 * | 0.005 | 0.320 * | 0.042 | 0.287 | −0.327* | 0.308 * |
| PLT | 0.126 | 0.226 | −0.077 | 0.454 * | −0.138 | 0.451 * | 0.363 |
P<0.05 Spearman’s rank factor.
pH – potential of hydrogen; pO2 – partial pressure of oxygen; pCO2 – partial pressure of carbon dioxide; WBC – white blood cell count; RBC – red blood cell count; HGB – hemoglobin; HCT – hematocrit; MCV – mean corpuscular volume; MCH – mean corpuscular hemoglobin; MCHC – mean corpuscular hemoglobin concentration; PLT – platelet count; RQ – level of relative expression; SD – standard deviation; SE – standard error.
Table 4.
Correlations between clinical parameters and expression of genes in the group of healthy women (n=17), patients with gestational diabetes (n=13), patients with hypertension (n=8), and patients with hypothyroidism (n=14).
| Parameter | RQ IL1A | RQ IL1B | RQ IL1R1 | RQ IL2 | RQ IL6 | RQ IL6R | RQ TSG-6 |
|---|---|---|---|---|---|---|---|
| Control group | |||||||
| RQ IL1A | 1.000 | 0.940 * | 0.009 | −0.636* | 0.848 * | −0.420 | 0.090 |
| RQ IL1B | 0.940 * | 1.000 | −0.081 | −0.269 | 0.632 * | −0.390 | 0.859 * |
| RQ IL1R1 | 0.009 | −0.081 | 1.000 | 0.392 | 0.364 | 0.784 * | −0.087 |
| RQ IL2 | −0.636* | −0.269 | 0.392 | 1.000 | −0.336 | 0.898 * | 0.019 |
| RQ IL6 | 0.848 * | 0.632 * | 0.364 | −0.336 | 1.000 | −0.019 | 0.031 |
| RQ IL6R | −0.420 | −0.390 | 0.784 * | 0.898 * | −0.019 | 1.000 | −0.162 |
| RQ TSG-6 | 0.090 | 0.859 * | −0.087 | 0.019 | 0.031 | −0.162 | 1.000 |
| Mother’s age | 0.010 | 0.074 | −0.316 | −0.367 | −0.056 | −0.502 | −0.066 |
| Number of pregnancies | −0.436 | 0.147 | 0.052 | 0.035 | −0.289 | 0.089 | 0.322 |
| Number of deliveries | −0.356 | 0.338 | −0.026 | 0.120 | −0.267 | 0.071 | 0.527 * |
| Weeks of gestation | 0.210 | 0.118 | 0.066 | −0.314 | 0.188 | −0.231 | −0.027 |
| Newborn’s weight | 0.270 | 0.079 | 0.318 | −0.135 | 0.200 | 0.091 | −0.049 |
| pH | −0.625* | −0.104 | −0.028 | 0.466 | −0.638* | 0.186 | 0.012 |
| pCO2 | 0.594 * | 0.104 | 0.104 | −0.458 | 0.628 * | −0.116 | 0.037 |
| PO2 | −0.226 | 0.154 | −0.676* | 0.026 | −0.538 | −0.364 | 0.198 |
| cHCO3 | −0.512 | 0.117 | 0.318 | 0.352 | −0.463 | 0.366 | 0.267 |
| WBC | 0.104 | 0.058 | −0.124 | 0.303 | −0.010 | 0.003 | 0.033 |
| RBC | 0.493 | −0.071 | −0.040 | −0.081 | 0.590 * | −0.146 | −0.226 |
| HGB | 0.402 | 0.055 | 0.094 | 0.001 | 0.599 * | −0.029 | −0.109 |
| HCT | 0.492 | 0.080 | 0.032 | −0.199 | 0.627 * | −0.170 | −0.087 |
| MCH | 0.025 | 0.205 | 0.209 | 0.067 | 0.129 | 0.128 | 0.150 |
| MCV | 0.066 | 0.334 | 0.156 | −0.277 | 0.156 | −0.079 | 0.305 |
| MCHC | −0.027 | −0.034 | 0.209 | 0.491 | 0.057 | 0.353 | −0.100 |
| PLT | 0.312 | 0.603* | −0.514 | 0.027 | 0.058 | −0.593* | 0.767 * |
| Gestational diabetes | |||||||
| RQ IL1A | 1.000 | 0.143 | 0.390 | −0.762* | 0.533 | 0.000 | 0.467 |
| RQ IL1B | 0.143 | 1.000 | −0.302 | 0.214 | 0.242 | −0.214 | −0.192 |
| RQ IL1R1 | 0.390 | −0.302 | 1.000 | −0.714* | 0.236 | 0.363 | 0.582 * |
| RQ IL2 | −0.762* | 0.214 | −0.714* | 1.000 | −0.548 | −0.048 | −0.190 |
| RQ IL6 | 0.533 | 0.242 | 0.236 | −0.548 | 1.000 | −0.505 | 0.231 |
| RQ IL6R | 0.000 | −0.214 | 0.363 | −0.048 | −0.505 | 1.000 | −0.011 |
| RQ TSG-6 | 0.467 | −0.192 | 0.582 * | −0.190 | 0.231 | −0.011 | 1.000 |
| Mother’s age | 0.468 | 0.108 | −0.158 | −0.470 | 0.119 | −0.376 | 0.177 |
| Number of pregnancies | −0.162 | 0.102 | −0.045 | 0.218 | −0.142 | −0.171 | 0.102 |
| Number of deliveries | −0.085 | 0.295 | −0.160 | 0.075 | 0.096 | −0.475 | 0.111 |
| Weeks of gestation | −0.182 | 0.367 | −0.098 | −0.282 | −0.283 | 0.042 | −0.498 |
| Newborn’s weight | −0.099 | 0.060 | −0.121 | 0.310 | −0.099 | −0.269 | −0.363 |
| pH | −0.463 | 0.064 | −0.105 | 0.764 * | −0.225 | −0.155 | −0.022 |
| pCO2 | 0.676 * | 0.038 | 0.236 | −0.667 | 0.253 | −0.011 | 0.368 |
| PO2 | −0.388 | 0.187 | −0.061 | 0.262 | −0.325 | 0.294 | −0.025 |
| cHCO3 | 0.633 * | 0.052 | 0.305 | −0.503 | 0.319 | −0.157 | 0.575 * |
| WBC | −0.159 | 0.005 | −0.236 | −0.405 | −0.181 | 0.104 | −0.440 |
| RBC | 0.137 | 0.374 | −0.110 | 0.048 | 0.033 | 0.088 | −0.088 |
| HGB | 0.171 | 0.011 | 0.094 | −0.415 | 0.017 | −0.182 | 0.039 |
| HCT | −0.044 | 0.231 | −0.170 | −0.095 | −0.066 | 0.000 | −0.242 |
| MCH | −0.165 | −0.527 | 0.170 | −0.429 | −0.170 | −0.038 | −0.209 |
| MCV | −0.154 | −0.437 | 0.052 | −0.357 | −0.223 | −0.135 | −0.275 |
| MCHC | 0.270 | −0.278 | 0.190 | −0.119 | −0.094 | −0.253 | 0.273 |
| PLT | −0.170 | 0.313 | 0.181 | 0.476 | −0.176 | 0.379 | 0.038 |
| Hypertension | |||||||
| RQ IL1A | 1.000 | 0.392 | 0.413 | 0.231 | −0.030 | 0.467 | 0.298 |
| RQ IL1B | 0.392 | 1.000 | −0.123 | −0.766 | −0.005 | 0.982 * | 0.046 |
| RQ IL1R1 | 0.413 | −0.123 | 1.000 | 0.142 | 0.841 | 0.067 | 0.962 * |
| RQ IL2 | 0.231 | −0.766 | 0.142 | 1.000 | −0.296 | −0.748 | −0.129 |
| RQ IL6 | −0.030 | −0.005 | 0.841 | −0.296 | 1.000 | 0.159 | 0.942 |
| RQ IL6R | 0.467 | 0.982 * | 0.067 | −0.748 | 0.159 | 1.000 | 0.232 |
| RQ TSG-6 | 0.298 | 0.046 | 0.962 * | −0.129 | 0.942 | 0.232 | 1.000 |
| Mother’s age | 0.628 | 0.658 | 0.666 | −0.451 | 0.620 | 0.788 | 0.779 |
| Number of pregnancies | 0.035 | −0.109 | 0.904 | −0.148 | 0.988 * | 0.067 | 0.892 * |
| Number of deliveries | 0.035 | −0.109 | 0.904 | −0.148 | 0.988 * | 0.067 | 0.892 * |
| Weeks of gestation | −0.555 | −0.234 | −0.936 | 0.124 | −0.815 | −0.414 | −0.934* |
| Newborn’s weight | −0.261 | −0.982* | 0.075 | 0.867 | −0.131 | −0.974* | −0.344 |
| pH | 0.619 | −0.434 | 0.250 | 0.906 | −0.296 | −0.396 | 0.086 |
| pCO2 | −0.750 | 0.022 | 0.068 | −0.654 | 0.590 | 0.043 | −0.015 |
| PO2 | 0.871 | 0.130 | 0.058 | 0.538 | −0.463 | 0.135 | −0.055 |
| cHCO3 | −0.652 | −0.441 | 0.420 | −0.169 | 0.749 | −0.357 | 0.056 |
| WBC | 0.825 | 0.159 | −0.063 | 0.509 | −0.562 | 0.140 | −0.452 |
| RBC | −0.693 | 0.223 | −0.864 | −0.525 | −0.456 | 0.063 | −0.776 |
| HGB | 0.813 | 0.429 | 0.787 | −0.084 | 0.546 | 0.579 | 0.665 |
| HCT | 0.883 | 0.002 | 0.722 | 0.473 | 0.253 | 0.135 | 0.685 |
| MCH | 0.705 | −0.211 | 0.859 | 0.524 | 0.445 | −0.052 | 0.785 |
| MCV | 0.171 | −0.563 | 0.889 | 0.477 | 0.698 | −0.396 | 0.832 |
| MCHC | −0.064 | 0.676 | −0.815 | −0.542 | −0.637 | 0.523 | −0.626 |
| PLT | 0.433 | −0.557 | 0.054 | 0.959 * | −0.451 | −0.556 | −0.549 |
| Hypothyroidism | |||||||
| RQ IL1A | 1.000 | 0.302 | 0.547 | −1.000 | 0.555 * | −0.423 | 0.385 |
| RQ IL1B | 0.302 | 1.000 | 0.154 | 0.600 | 0.108 | −0.007 | −0.020 |
| RQ IL1R1 | 0.547 | 0.154 | 1.000 | −0.800 | 0.392 | 0.110 | 0.618 * |
| RQ IL2 | −1.000 | 0.600 | −0.800 | 1.000 | −0.700 | 0.600 | −0.500 |
| RQ IL6 | 0.555 * | 0.108 | 0.392 | −0.700 | 1.000 | −0.587* | 0.433 |
| RQ IL6R | −0.423 | −0.007 | 0.110 | 0.600 | −0.587* | 1.000 | −0.134 |
| RQ TSG-6 | 0.385 | −0.020 | 0.618 * | −0.500 | 0.433 | −0.134 | 1.000 |
| Mother’s age | 0.342 | 0.139 | 0.126 | −0.500 | 0.220 | −0.678* | 0.097 |
| Number of pregnancies | −0.361 | 0.282 | −0.333 | 0.527 | −0.370 | −0.155 | −0.356 |
| Number of deliveries | −0.377 | 0.148 | −0.275 | 0.632 | −0.119 | −0.237 | −0.089 |
| Weeks of gestation | 0.740 * | 0.176 | 0.161 | −0.707 | 0.464 | −0.338 | 0.169 |
| Newborn’s weight | 0.275 | 0.059 | −0.250 | −0.616 | 0.400 | −0.570* | −0.310 |
| pH | 0.006 | −0.228 | 0.323 | 0.205 | 0.104 | 0.299 | 0.675 * |
| pCO2 | 0.044 | 0.086 | −0.238 | −0.300 | −0.033 | −0.336 | −0.578* |
| PO2 | −0.110 | 0.160 | 0.319 | 0.300 | −0.407 | 0.635 * | 0.314 |
| cHCO3 | 0.377 | 0.004 | −0.117 | −0.300 | 0.363 | −0.705* | −0.101 |
| WBC | 0.033 | −0.112 | −0.176 | 0.500 | 0.130 | −0.029 | 0.169 |
| RBC | −0.503 | 0.042 | −0.439 | 0.700 | −0.414 | 0.137 | −0.344 |
| HGB | 0.152 | 0.214 | 0.119 | −0.500 | 0.293 | −0.284 | 0.247 |
| HCT | −0.154 | 0.187 | 0.070 | −0.200 | 0.024 | −0.037 | 0.073 |
| MCH | 0.501 | 0.113 | 0.684 * | −0.900* | 0.325 | −0.102 | 0.356 |
| MCV | 0.619 * | 0.145 | 0.483 | −0.975* | 0.535 * | −0.334 | 0.433 |
| MCHC | 0.634 * | 0.143 | 0.471 | −0.900* | 0.491 | −0.337 | 0.372 |
| PLT | −0.082 | 0.345 | −0.062 | 0.700 | −0.609* | 0.459 | −0.002 |
P<0.05 Spearman’s rank factor.
pH – potential of hydrogen; pO2 – partial pressure of oxygen; pCO2 – partial pressure of carbon dioxide; WBC – white blood cell count; RBC – red blood cell count; HGB – hemoglobin; HCT – hematocrit; MCV – mean corpuscular volume; MCH – mean corpuscular hemoglobin; MCHC – mean corpuscular hemoglobin concentration; PLT – platelet count; RQ – level of relative expression; SD – standard deviation; SE – standard error.
Influence of pCO2
The analysis of the dependence of the expression of the studied genes on the pCO2 level in the umbilical blood, including the entire study group, showed that the level of IL2 expression was significantly negatively correlated with pCO2 (r=−0.494 P<0.05), while the level of IL6 expression was significantly positively correlated with pCO2 (r= 0.470 P<0.05; Table 3). Moreover, it was observed that with a pCO2 in the umbilical blood above 45 mm Hg, the expression of IL2 was statistically significantly 22 times lower (P=0.024) than the pCO2 in the range of 35 to 45 mm Hg. On the other hand, the level of IL6 expression at pCO2 above 45 mm Hg was statistically significantly more than 2.5 times higher (P=0.016) than the range of 35 to 45 mm Hg (Figure 3C). The analysis in the group of healthy women showed a positive correlation of pCO2 with the level of IL6 (r=0.628, P<0.05) and the level of IL1A (r=0.594 P<.05; Table 4). There was no significant dependence of TSG-6, IL1B, IL1R, and IL6R gene expression on the pCO2 in the umbilical cord blood.
Influence of pO2
The analysis of the dependence of the expression of studied genes in MSCs on pO2 showed a statistically significant negative correlation with the level of IL6 expression (r=−0.441, P<0.05) (Table 3). In the group of healthy women, the level of IL1R was negatively correlated with pO2 (r=−0.676, P<0.05; Table 4). There was no significant relationship between the expression of TSG-6, IL1A, IL1B, IL2, and IL6R genes in the MSCs from umbilical cord blood pO2.
Influence of the Parameters of Cord Blood Morphology
Considering the parameters of cord blood morphology, it was noted that the expression of IL1A (P=0.044) and IL1B (P=0.04) in MSCs was more than 2 times higher when the level of WBC in cord blood was in the range of 10 to 15×109/L, compared with levels of WBC lower than 10×109/L (Figure 3D), and this result was statistically significant. There were no relationships between the other genes tested and the level of WBC in the umbilical blood.
A number of correlations between the expression of genes under study and the RBC parameters of umbilical blood have been demonstrated. Among other things, we observed that the level of IL6 gene expression depended on the hemoglobin level. When HGB values exceeded 11.5 g/dL, the expression of IL6 in the MSCs was statistically significantly 2.5 times higher (P=0.041) than that of lower hemoglobin levels (Figure 3E). Correlation analysis in the entire study group showed a positive relationship between the level of IL6 expression and the level of hemoglobin (r=0.361, P<0.05; Table 3). Correlation analysis in the group of healthy women also showed a significant positive relationship between the level of IL6 expression and HGB (r=0.599, P<0.05). Moreover, it was noted that IL6 was positively correlated with RBC (r=0.590, P<0.05) and HCT (r=0.627, P<0.05; Table 4).
The relationship between the expression of the tested genes and the number of platelets was also noted. During the correlation analysis of the whole study group, we found the level of IL2 expression (r=0.545, P<0.05) and IL6R (r=0.451, P<0.05) were positively correlated with PLT (Table 3). During the analysis, in the group of healthy women, a positive relationship between TSG-6 expression and PLT (r=0.767, P<0.05) and IL1B with PLT (r=0.603, P<0.05) and a negative relationship between the expression of IL6R and PLT (r=−0.593, P<0.05) were observed (Table 4).
Influence of Patients’ Diseases
The analysis of the dependence of the expression of genes in the examined patients with comorbidities showed that the expression of IL1A in the MSCs of the umbilical cord obtained from patients with hypertension was statistically significantly 4 times higher (P=0.004) than that in healthy patients. In turn, the expression of the gene encoding IL6R in MSCs obtained from healthy patients was statistically significantly 3.5 times higher (P=0.037) than in patients with hypertension (Figure 4A). The other tested genes did not differ significantly depending on the presence of hypertension.
Figure 4.

(A) Mean IL1A and IL6R gene expression (relative level of expression±standard error [RQ±SE]) in tested mesenchymal stem cells (MSCs) depending on hypertension in patients. (B) Mean TSG-6 gene expression (RQ±SE) in tested MSCs depending on the hypothyroidism in patient. * P<0.05 Mann-Whitney U test.
The expression of the TSG-6 gene was statistically significantly 5 times higher (P=0.026) in the umbilical cord MSCs obtained from women with hypothyroidism (Figure 4B). In the case of other tested genes, no significant relationships with the occurrence of hypothyroidism were found.
The analysis of the correlation between the studied genes in the whole study group showed a significant positive relationship between the expression of the TSG-6 gene and IL1B (r=0.514, P<0.05) and between TSG-6 and IL1R (r=0.511, P<0.05). Also, the level of IL1A expression in MSCs was positively correlated with patient age (r=0.366, P<0.05), while the level of IL6R in MSCs was negatively correlated with patient age (r=−0.322, P<0.05; Table 3).
It was also shown that the expression of the TSG-6 gene in a group of healthy women was positively correlated with the number of deliveries (r=0.527, P<0.05; Table 4).
Analysis of the correlation between the expression of the studied genes and clinical parameters in MSCs from patients with hypertension showed the existence of several strong relationships: IL1B expression was positively correlated with IL6R expression (r=0.982, P<0.05), IL1R expression was positively correlated with TSG-6 expression level (r=0.962, P<0.05), IL6 expression was positively correlated with the number of pregnancies and deliveries (r=0.988, P<0.05), TSG-6 expression in hypertensive patients was positively correlated with the number of pregnancies and deliveries (r=0.892, P<0.05), TSG-6 expression was negatively correlated with the gestational week of delivery (r=−0.934, P<0.05), IL1B expression was negatively correlated with newborn weight (r=−0.982, P<0.05), IL6R expression was negatively correlated with newborn weight (r=−0.974, P<0.05), and a positive relationship between IL2 expression and PLT was noted (r=0.959, P<0.05) (Table 4). It should be mentioned here that the study group with hypertension consisted of only 8 patients; moreover, 3 of them also had diabetes, and therefore the obtained results need to be confirmed in a larger group of patients.
The evaluation of the correlation between the tested genes and clinical data in MSCs collected from patients with hypothyroidism showed the following: the level of IL6 expression was positively correlated with the level of IL1A expression (r=0.555, P<0.05), the level of IL6 expression was negatively correlated with IL6R expression (r=−0.587, P<0.05), IL1R1 expression was positively correlated with the level of TSG-6 expression (r=0.618, P<0.05), IL1A expression was positively correlated with the gestational week in which delivery occurred (r=0.740, P<0.05), TSG-6 expression was positively correlated with the pH of umbilical cord blood (r=0.675, P<0.05), and TSG-6 expression level was negatively correlated with pCO2 (r=−0.578, P<0.05). In addition, relationships between IL1R, IL1A, IL2, and IL6 with the parameters MCV, MCH, and MCHC were noted (Table 4).
In MSCs from patients with gestational diabetes, the following relationships were observed: IL1A expression was negatively correlated with IL2 expression (r=−0.762, P<0.05), IL1R expression was negatively correlated with IL2 expression (r=−0.714 P<0.05), IL2 expression was positively correlated with cord blood pH (r=0.764, P<0.05), IL1A expression was positively correlated with cord blood pCO2 (r=0.676 P<0.05), IL1A expression was positively correlated with cHCO3 (r=0.633, P<0.05), TSG-6 expression level was positively correlated with IL1R expression (r=0.582, P<0.05), and TSG-6 expression level was positively correlated with cHCO3 (r=0.575, P<0.05).
Moreover, in this study, we showed a certain tendency regarding the influence of vaginal delivery and the administration of oxytocin during labor on TSG-6 expression in the umbilical cord MSCs; however, these results were not statistically significant (P=0.06 and P=0.09). There is the need for further studies in a larger group to assess the effect of the use of oxytocin and vaginal delivery on the level of TSG-6 in MSCs.
Discussion
The results of the present study have shown that MSCs express the TSG-6 gene, which is consistent with the results of other studies [26]; however, to date, there are no data in the literature that consider the correlation of the expression of the TSG-6 gene in umbilical cord MSCs with the clinical condition of the patient.
TSG-6 is a hyaluronan-binding protein. It is one of the mechanisms responsible for the anti-inflammatory effect of this protein. It has been observed that the affinity of TSG-6 for hyaluronan is pH-dependent [27–29]. This indicates that the anti-inflammatory effect of TSG-6 will depend on the pH value, which is confirmed by the results of our research, in which we have shown that the expression of TSG-6 in MSCs increases with increasing of pH in umbilical cord blood. No data has been found in the literature that would indicate the influence of cord blood pH on the level of TSG-6 expression in the umbilical cord MSCs; to the best of our knowledge, our study is the first. This is a very important aspect that influences the decision to collect stem cells in specific cases and supports their potential clinical usefulness.
In addition to the effect of cord blood acid-base balance parameters on the level of TSG-6 expression in MSCs, we also noticed that patients with hypothyroidism showed higher levels of TSG-6 than did healthy patients. Hypothyroidism is associated with chronic inflammation, usually with elevated levels of cytokines. The elevation of TSG-6 in the MSCs of patients with hypothyroidism may suggest an increase associated with inflammation. We also noted a positive relationship between the level of TSG-6 expression and the expression of the IL1 receptor in these patients.
Moreover, arteritis has been shown to worsen after suppression of TSH, compared with the state of hypothyroidism [30]. This is consistent with our study, in which it was observed that TSG-6 expression was statistically significantly higher in MSCs obtained from patients with hypothyroidism. This suggests that higher levels of TSG-6 in people with hypothyroidism may be responsible for suppressing arteritis.
We also observed that the expression of TSG-6 in healthy women depends on the number of deliveries. The more deliveries, the higher the levels of TSG-6 were observed in healthy women. There are no data on the dependence of TSG-6 expression in MSC on the number of pregnancies and deliveries in the literature. Perhaps the adaptive changes taking place in the body of women who give birth again affect the level of TSG-6 expression in the MSCs of the umbilical cord; however, this requires further research.
It has been shown that in inflammation caused by trauma, the platelet lysate activates NF-κB in MSCs, promoting the release of pro-inflammatory cytokines. TSG-6, which also acts through the NF-κB pathway in an inhibitory manner, increases in this situation [31]. Regarding our study, which also showed a significant, positive correlation of TSG-6 expression with the number of platelets, it can be concluded that TSG-6 may participate in the suppression of inflammation caused by injuries.
Our results showed that there was a tendency to different values of TSG-6 expression in the umbilical cord MSCs in women who received oxytocin while giving birth. This suggests that oxytocin likely influences the anti-inflammatory properties of MSCs. A decrease of pro-inflammatory cytokine levels was observed in earlier studies, with an increase of anti-inflammatory cytokine levels after the administration of oxytocin in lung damage [32] and after microglia activation [33]. The anti-inflammatory effect of oxytocin has also been demonstrated in atherosclerosis, enteritis, and urinary tract inflammation [34]. TSG-6 works in the same way, also by regulation of inflammatory cytokines [35]. Considering the similar mechanisms of TSG-6 and oxytocin action and the results of our research, this topic is worth a closer look.
We also observed that there is a tendency for different values of TSG-6 gene expression in vaginal delivery compared to cesarean delivery; this situation may be caused by the involvement of oxytocin. These speculations can be explained by the influence of oxytocin on many mechanisms that contribute to oxidative stress and inflammation, thus protecting cells from damage. Studies by other authors have shown that oxytocin suppresses oxidative stress and inhibits the inflammatory process in the acute stages of labor, while protecting against postpartum hypoxia [36]. It should be noted, however, that in our study group only 6 patients out of 45 had vaginal delivery, and only 10 patients had oxytocin-supported labor; therefore, the results obtained should be repeated on a larger number of participants, to really assess whether the use of oxytocin, and natural delivery, have a significant impact on the level of TSG-6 in the MSC and thus the clinical utility of these cells.
In our study, apart from the evaluation of TSG-6 expression in umbilical cord MSCs, we focused on the evaluation of selected pro-inflammatory cytokines and the analysis of the relationship between TSG-6 and these cytokines.
Treatment with TSG-6 has already been shown to reduce IL1B and IL6 levels [37]. Similar effects were observed in another study, in which cells cultured with IL1 and IL6 were shown to have lower TSG-6 production [38]. The aim of our study was to assess whether similar relationships occur in MSCs at the level of gene expression.
Liu et al tested the effect of transplantation of MSCs isolated from the human umbilical cord on the healing of post-burn wounds. MSCs reduced the amount of infiltrating inflammatory cells, lowered the concentration of pro-inflammatory interleukins IL1 and IL6, and increased the concentration of anti-inflammatory factors, such as TSG-6 [39]. During our research, we decided to check whether TSG-6 inhibited the synthesis of pro-inflammatory interleukins, namely IL1 and IL6, at the mRNA level.
Despite the lack of satisfactory effects of the potential positive impact of MSC on the course and symptoms of toxic shock syndrome presented in the publication by Kim et al [40], our team was inspired to check the relationship between the expression level of pro-inflammatory interleukins, namely IL1 and IL6, and the presence of TSG-6 in MSCs. Our aim was to determine whether MSCs express mRNA of the mentioned pro-inflammatory mediators or whether this expression may be related to the expression level of TSG-6 mRNA.
One study has shown that MSC has a positive effect on reducing the concentration of pro-inflammatory cytokines in chronic exposure to cigarette smoke. It turns out that after endotracheal administration of MSC, the concentration of IL1B and TSG-6 are reduced. We were interested in whether there is an effect of the anti-inflammatory TSG-6 in MSCs on the production of IL1B and other pro-inflammatory interleukins [41].
Data in the literature indicate a significant relationship between concentration of IL1A and arterial hypertension. The cytokine IL1A is a predictor of high systolic and diastolic blood pressure [42]. IL6, on the other hand, has multidirectional effects, such as inter alia initiating chronic inflammation. The presence of IL6R on the MSC surface has also been demonstrated [43]. The results of the reports are consistent with the results of our study concerning significantly higher IL1A expression in the MSC in hypertensive patients compared with that in healthy patients, and significantly lower IL6R expression in MSCs in healthy patients compared with that in hypertensive patients. This may indicate that the increase of pro-inflammatory cytokines is associated with the presence of arterial hypertension. This hypothesis is supported by the results of other studies, in which it was shown that pregnant women with hypertension exhibit higher levels of pro-inflammatory cytokines and acute phase proteins than do healthy women [44]. In addition, in our study, we also showed that in MSCs taken from hypertensive patients, the expression of TSG-6 was positively correlated with the expression of IL1R1. It seems that the increase in the expression of pro-inflammatory cytokines in MSCs of hypertensive patients is also accompanied by a compensatory increase in TSG-6. We also observed that TSG-6 was negatively correlated with gestational week of delivery, and IL1B and IL6R were negatively correlated with neonatal weight. It has been shown that inflammation, and in particular an imbalance of pro- and anti-inflammatory mediators, is recognized as a key factor in the pathophysiology underlying preterm birth as well as neonatal disease [45].
Reduction of blood oxygen saturation is associated with an increase of IL6 level in serum [46]. Reports on this subject are consistent with the results we obtained, according to which IL6 in MSCs shows a positive expression, with an increase of pCO2 and negative expression with an increase of pO2. On this basis, it can be hypothesized that IL6-induced inflammation worsens with increasing pCO2.
Moreover, IL6, apart from its role in the immune response, is responsible for the regulation of hemopoiesis in the organism [47]. Hemoglobin constitutes the majority of intracellular proteins of RBCs [48]. Our study showed an increase in the level of IL6 expression in patients with hemoglobin levels >11.5 g/dL, which suggests that the increase of hemopoiesis is accompanied by an increase of IL6. In our study, we also observed that the expression level of IL6 in MSCs taken from healthy women was positively correlated with the number of RBC, HGB, and HCT, and we showed that IL6 expression was positively correlated with pCO2 and negatively correlated with umbilical cord blood pH.
This is supported by other studies which show that maternal anemia has an effect on the increase in umbilical cord pO2 [49], which is further negatively correlated with IL6 expression. This supports that there is a relationship between levels of hemoglobin and IL6.
One of MSC’s functions is inhibition of the development of an excessive inflammatory response. By negative feedback, pro-inflammatory cytokines stimulate MSCs to secrete TSG-6, which then reduces signaling of NF-κB in macrophages and thus models the pro-inflammatory cytokine cascade [50]. This is consistent with our results, in which we obtained a positive correlation between TSG-6 expression and IL1R and IL1B in the entire study group.
Conclusions
Our research has shown that the expression of the TSG-6 gene in MSCs derived from Wharton’s jelly from the umbilical cord probably depends on coexisting diseases in the patient (hypothyroidism) and the biochemical parameters of umbilical cord blood, including a very important role of cord blood pH. We also noted that the type and course of delivery (oxytocin-assisted delivery) is probably important in the levels of TSG-6 expression in MSCs, but this has to be confirmed in further studies. Based on the above results, we conclude that MSCs obtained from births in which the pH of the umbilical blood is higher probably have a greater therapeutic potential, and considering the function of the TSG-6 protein, this may contribute to an even wider application of these cells in medicine. However, the anti-inflammatory activity of these cells has not been tested, and this needs to be confirmed in the next tests that we plan to do. Considering the subject matter of our research, it is important that a positive correlation was demonstrated between the expression of the TSG-6 gene and the level of IL1R and IL1B gene expression in the analyzed study group.
Footnotes
Conflict of interest: None declared
Publisher’s note: All claims expressed in this article are solely those of the authors and do not necessarily represent those of their affiliated organizations, or those of the publisher, the editors and the reviewers. Any product that may be evaluated in this article, or claim that may be made by its manufacturer, is not guaranteed or endorsed by the publisher
Ethics Statement
The research was conducted with the consent of the Bioethics Committee at the Medical University of Lublin, no. KE-0254/128/2014. All methods were conducted in accordance with relevant guidelines and regulations. Informed consent was obtained from all participants and/or their legal guardian(s).
Declaration of Figures’ Authenticity
All figures submitted have been created by the authors who confirm that the images are original with no duplication and have not been previously published in whole or in part.
Financial support: This study was supported in part by funds from the project “Evaluation of the anti-inflammatory protein TSG-6 and cytometric analysis of the CD146 multipotence marker in mesenchymal stem cells”, grant no. MG34/2021, conducted in the period from 2021 to 2022, financed by the Medical University of Lublin, with project manager, Aleksandra Ozygała
References
- 1.Andrzejewska A, Lukomska B, Janowski M. Concise review: Mesenchymal stem cells: From roots to boost. Stem Cells. 2019;37(7):855–64. doi: 10.1002/stem.3016. [DOI] [PMC free article] [PubMed] [Google Scholar]
- 2.Gil-Kulik P, Świstowska M, Kondracka A, et al. Increased expression of BIRC2, BIRC3, and BIRC5 from the IAP family in mesenchymal stem cells of the umbilical cord Wharton’s Jelly (WJSC) in younger women giving birth naturally. Oxid Med Cell Longev. 2020;2020:9084730. doi: 10.1155/2020/9084730. [DOI] [PMC free article] [PubMed] [Google Scholar]
- 3.Jiang W, Xu J. Immune modulation by mesenchymal stem cells. Cell Prolif. 2020;53(1):e12712. doi: 10.1111/cpr.12712. [DOI] [PMC free article] [PubMed] [Google Scholar]
- 4.Pojda Z, Machaj E, Kurzyk A, et al. Mezenchymalne komórki macierzyste. Postępy Biochemii. 2013;59(2):187–97. [in Polish] [PubMed] [Google Scholar]
- 5.Rodríguez-Fuentes DE, Fernández-Garza LE, Samia-Meza JA, et al. Mesenchymal stem cells current clinical applications: A systematic review. Arch Med Res. 2021;52(1):93–101. doi: 10.1016/j.arcmed.2020.08.006. [DOI] [PubMed] [Google Scholar]
- 6.Matsuzaka Y, Yashiro R. Therapeutic strategy of mesenchymal-stem-cell-derived extracellular vesicles as regenerative medicine. Int J Mol Sci. 2022;23(12):6480. doi: 10.3390/ijms23126480. [DOI] [PMC free article] [PubMed] [Google Scholar]
- 7.Lee RH, Pulin AA, Seo MJ, et al. Intravenous hMSCs improve myocardial infarction in mice because cells embolized in lung are activated to secrete the anti-inflammatory protein TSG-6. Cell Stem Cell. 2009;5(1):54–63. doi: 10.1016/j.stem.2009.05.003. [DOI] [PMC free article] [PubMed] [Google Scholar]
- 8.Day AJ, Milner CM. TSG-6: A multifunctional protein with anti-inflammatory and tissue-protective properties. Matrix Biol. 2019;78–79:60–83. doi: 10.1016/j.matbio.2018.01.011. [DOI] [PubMed] [Google Scholar]
- 9.Wang M, Zhang M, Fu L, et al. Liver-targeted delivery of TSG-6 by calcium phosphate nanoparticles for the management of liver fibrosis. Theranostics. 2020;10(1):36–49. doi: 10.7150/thno.37301. [DOI] [PMC free article] [PubMed] [Google Scholar]
- 10.Li Q, Song WJ, Ryu MO, et al. TSG-6 secreted by human adipose tissue-derived mesenchymal stem cells ameliorates severe acute pancreatitis via ER stress downregulation in mice. Stem Cell Res Ther. 2018;9(1):255. doi: 10.1186/s13287-018-1009-8. [DOI] [PMC free article] [PubMed] [Google Scholar]
- 11.Kota DJ, Wiggins LL, Yoon N, Lee RH. TSG-6 produced by hMSCs delays the onset of autoimmune diabetes by suppressing Th1 development and enhancing tolerogenicity. Diabetes. 2013;62(6):2048–58. doi: 10.2337/db12-0931. [DOI] [PMC free article] [PubMed] [Google Scholar]
- 12.Dyer DP, Thomson JM, Hermant A, et al. TSG-6 inhibits neutrophil migration via direct interaction with the chemokine CXCL8. J Immunol. 2014;192(5):2177–85. doi: 10.4049/jimmunol.1300194. [DOI] [PMC free article] [PubMed] [Google Scholar]
- 13.Yang H, Wu L, Deng H, et al. Anti-inflammatory protein TSG-6 secreted by bone marrow mesenchymal stem cells attenuates neuropathic pain by inhibiting the TLR2/MyD88/NF-κB signaling pathway in spinal microglia. J Neuroinflammation. 2020;17(1):154. doi: 10.1186/s12974-020-1731-x. [DOI] [PMC free article] [PubMed] [Google Scholar]
- 14.Bárdos T, Kamath RV, Mikecz K, Glant TT. Anti-inflammatory and chondroprotective effect of TSG-6 (tumor necrosis factor-alpha-stimulated gene-6) in murine models of experimental arthritis. Am J Pathol. 2001;159(5):1711–21. doi: 10.1016/s0002-9440(10)63018-0. [DOI] [PMC free article] [PubMed] [Google Scholar]
- 15.Qu Y, Yang F, Meng F, et al. Plasma concentration of tumor necrosis factor-stimulated gene-6 as a novel diagnostic and 3-month prognostic indicator in non-cardioembolic acute ischemic stroke. Front Immunol. 2022;13:713379. doi: 10.3389/fimmu.2022.713379. [DOI] [PMC free article] [PubMed] [Google Scholar]
- 16.Hu T, Liu Y, Li X, et al. Tumor necrosis factor-alpha stimulated gene-6: A biomarker reflecting disease activity in rheumatoid arthritis. J Clin Lab Anal. 2022;36(5):e24395. doi: 10.1002/jcla.24395. [DOI] [PMC free article] [PubMed] [Google Scholar]
- 17.Li Y, Zhang D, Xu L, et al. Cell-cell contact with proinflammatory macrophages enhances the immunotherapeutic effect of mesenchymal stem cells in two abortion models. Cell Mol Immunol. 2019;16(12):908–20. doi: 10.1038/s41423-019-0204-6. [DOI] [PMC free article] [PubMed] [Google Scholar]
- 18.Świstowska M, Gil-Kulik P, Krzyżanowski A, et al. Potential effect of SOX2 on the cell cycle of Wharton’s Jelly stem cells (WJSCs) Oxid Med Cell Longev. 2019;2019:5084689. doi: 10.1155/2019/5084689. [DOI] [PMC free article] [PubMed] [Google Scholar]
- 19.Walecka I, Gil-Kulik P, Krzyżanowski A, et al. Phenotypic characterization of adherent cells population CD34+ CD90+ CD105+ derived from Wharton’s Jelly. Med Sci Monit. 2017;23:1886–95. doi: 10.12659/MSM.902186. [DOI] [PMC free article] [PubMed] [Google Scholar]
- 20.Gil-Kulik P, Świstowska M, Krzyżanowski A, et al. Evaluation of the impact of pregnancy-associated factors on the quality of Wharton’s Jelly-derived stem cells using SOX2 gene expression as a marker. Int J Mol Sci. 2022;23(14):7630. doi: 10.3390/ijms23147630. [DOI] [PMC free article] [PubMed] [Google Scholar]
- 21.Gil-Kulik P, Leśniewski M, Bieńko K, et al. Influence of perinatal factors on gene expression of IAPs family and main factors of pluripotency: OCT4 and SOX2 in human breast milk stem cells – a preliminary report. Int J Mol Sci. 2023;24(3):2476. doi: 10.3390/ijms24032476. [DOI] [PMC free article] [PubMed] [Google Scholar]
- 22.Chomczyński P, Sacchi N. Single-step method of RNA isolation by acid guanidinium thiocyanate-phenol-chloroform extraction. Anal Biochem. 1987;162(1):156–59. doi: 10.1006/abio.1987.9999. [DOI] [PubMed] [Google Scholar]
- 23.Livak KJ, Schmittgen TD. Analysis of relative gene expression data using real-time quantitative PCR and the 2(-Delta Delta C(T)) method. Methods. 2001;25(4):402–8. doi: 10.1006/meth.2001.1262. [DOI] [PubMed] [Google Scholar]
- 24.Gil-Kulik P, Krzyżanowski A, Dudzińska E, et al. Potential involvement of BIRC5 in maintaining pluripotency and cell differentiation of human stem cells. Oxid Med Cell Longev. 2019;2019:8727925. doi: 10.1155/2019/8727925. [DOI] [PMC free article] [PubMed] [Google Scholar]
- 25.Gil-Kulik P, Chomik P, Krzyżanowski A, et al. Influence of the type of delivery, use of oxytocin, and maternal age on POU5F1 gene expression in stem cells derived from Wharton’s Jelly within the umbilical cord. Oxid Med Cell Longev. 2019;2019:1027106. doi: 10.1155/2019/1027106. [DOI] [PMC free article] [PubMed] [Google Scholar]
- 26.Liu L, Song H, Duan H, et al. TSG-6 secreted by human umbilical cord-MSCs attenuates severe burn-induced excessive inflammation via inhibiting activations of P38 and JNK signaling. Sci Rep. 2016;6:30121. doi: 10.1038/srep30121. [DOI] [PMC free article] [PubMed] [Google Scholar]
- 27.Parkar AA, Kahmann JD, Howat SL, et al. TSG-6 interacts with hyaluronan and aggrecan in a pH-dependent manner via a common functional element: implications for its regulation in inflamed cartilage. FEBS Lett. 1998;428(3):171–76. doi: 10.1016/s0014-5793(98)00523-7. [DOI] [PubMed] [Google Scholar]
- 28.Blundell CD, Mahoney DJ, Cordell MR, et al. Determining the molecular basis for the pH-dependent interaction between the link module of human TSG-6 and hyaluronan. J Biol Chem. 2007;282(17):12976–88. doi: 10.1074/jbc.M611713200. [DOI] [PubMed] [Google Scholar]
- 29.Milner CM, Higman VA, Day AJ. TSG-6: A pluripotent inflammatory mediator? Biochem Soc Trans. 2006;34(Pt 3):446–50. doi: 10.1042/BST0340446. [DOI] [PubMed] [Google Scholar]
- 30.Boswijk E, Sanders KJC, Broeders EPM, et al. TSH suppression aggravates arterial inflammation – an 18F-FDG PET study in thyroid carcinoma patients. Eur J Nucl Med Mol Imaging. 2019;46(7):1428–38. doi: 10.1007/s00259-019-04292-w. [DOI] [PMC free article] [PubMed] [Google Scholar]
- 31.Xu C, Fu F, Li X, Zhang S. Mesenchymal stem cells maintain the microenvironment of central nervous system by regulating the polarization of macrophages/microglia after traumatic brain injury. Int J Neurosci. 2017;127(12):1124–35. doi: 10.1080/00207454.2017.1325884. [DOI] [PubMed] [Google Scholar]
- 32.An X, Sun X, Hou Y, et al. Protective effect of oxytocin on LPS-induced acute lung injury in mice. Sci Rep. 2019;9(1):2836. doi: 10.1038/s41598-019-39349-1. [DOI] [PMC free article] [PubMed] [Google Scholar]
- 33.Inoue T, Yamakage H, Tanaka M, et al. Oxytocin suppresses inflammatory responses induced by lipopolysaccharide through inhibition of the eIF-2-ATF4 pathway in mouse microglia. Cells. 2019;8(6):527. doi: 10.3390/cells8060527. [DOI] [PMC free article] [PubMed] [Google Scholar]
- 34.Mehdi SF, Pusapati S, Khenhrani RR, et al. Oxytocin and related peptide hormones: Candidate anti-inflammatory therapy in early stages of sepsis. Front Immunol. 2022;13:1–19. doi: 10.3389/fimmu.2022.864007. [DOI] [PMC free article] [PubMed] [Google Scholar]
- 35.Yang H, Wu L, Deng H, et al. Anti-inflammatory protein TSG-6 secreted by bone marrow mesenchymal stem cells attenuates neuropathic pain by inhibiting the TLR2/MyD88/NF-κB signaling pathway in spinal microglia. J Neuroinflammation. 2020;17(1):1–21. doi: 10.1186/s12974-020-1731-x. [DOI] [PMC free article] [PubMed] [Google Scholar]
- 36.Carter CS, Kingsbury MA. Oxytocin and oxygen: The evolution of a solution to the ‘stress of life’. Philos Trans R Soc Lond B Biol Sci. 2022;377(1858):20210054. doi: 10.1098/rstb.2021.0054. [DOI] [PMC free article] [PubMed] [Google Scholar]
- 37.Beltran SR, Svoboda KKH, Kerns DG, et al. Anti-inflammatory protein tumor necrosis factor-α – stimulated protein 6 (TSG-6) promotes early gingival wound healing: An in vivo study. J Periodontol. 2015;86(1):62–71. doi: 10.1902/jop.2014.140187. [DOI] [PubMed] [Google Scholar]
- 38.Mahoney DJ, Swales C, Athanasou NA, et al. TSG-6 inhibits osteoclast activity via an autocrine mechanism and is functionally synergistic with osteoprotegerin. Arthritis Rheum. 2011;63(4):1034–43. doi: 10.1002/art.30201. [DOI] [PubMed] [Google Scholar]
- 39.Liu L, Yu Y, Hou Y, et al. Human umbilical cord mesenchymal stem cells transplantation promotes cutaneous wound healing of severe burned rats. PLoS One. 2014;9(2):e88348. doi: 10.1371/journal.pone.0088348. [DOI] [PMC free article] [PubMed] [Google Scholar]
- 40.Kim H, Darwish I, Monroy MF, et al. Mesenchymal stromal (stem) cells suppress pro-inflammatory cytokine production but fail to improve survival in experimental staphylococcal toxic shock syndrome. BMC Immunol. 2014;15(1):1. doi: 10.1186/1471-2172-15-1. [DOI] [PMC free article] [PubMed] [Google Scholar]
- 41.Arreola-Ramírez JL, Vargas MH, Carbajal V, et al. Mesenchymal stem cells attenuate the proinflammatory cytokine pattern in a guinea pig model of chronic cigarette smoke exposure. Cytokine. 2023;162:156104. doi: 10.1016/j.cyto.2022.156104. [DOI] [PubMed] [Google Scholar]
- 42.Mirhafez SR, Mohebati M, Disfani MF, et al. An imbalance in serum concentrations of inflammatory and anti-inflammatory cytokines in hypertension. J Am Soc Hypertens. 2014;8(9):614–23. doi: 10.1016/j.jash.2014.05.007. [DOI] [PubMed] [Google Scholar]
- 43.Deng W, Chen H, Su H, et al. IL6 receptor facilitates adipogenesis differentiation of human mesenchymal stem cells through activating P38 pathway. Int J Stem Cells. 2020;13(1):142–50. doi: 10.15283/ijsc19073. [DOI] [PMC free article] [PubMed] [Google Scholar]
- 44.Catarino C, Santos-Silva A, Belo L, et al. Inflammatory disturbances in preeclampsia: Relationship between maternal and umbilical cord blood. J Pregnancy. 2012;2012:684384. doi: 10.1155/2012/684384. [DOI] [PMC free article] [PubMed] [Google Scholar]
- 45.Green EA, Garrick SP, Peterson B, et al. The role of the interleukin-1 family in complications of prematurity. Int J Mol Sci. 2023;24(3):2795. doi: 10.3390/ijms24032795. [DOI] [PMC free article] [PubMed] [Google Scholar]
- 46.Trucco F, Carruthers E, Davies JC, et al. Inflammation in children with neuromuscular disorders and sleep disordered breathing. Sleep Med. 2020;72:118–21. doi: 10.1016/j.sleep.2020.03.032. [DOI] [PubMed] [Google Scholar]
- 47.Kang S, Tanaka T, Kishimoto T. Therapeutic uses of anti-interleukin-6 receptor antibody. Int Immunol. 2015;27(1):21–29. doi: 10.1093/intimm/dxu081. [DOI] [PubMed] [Google Scholar]
- 48.Żak A, Lachert E, Antoniewicz-Papis J, et al. [Leukodepleted red blood cell concentrates frozen and thawed in ACP 215 system; Evaluation study]. J Transf Med. 2011;4(1):32–44. [in Polish] [Google Scholar]
- 49.Watkins VY, Frolova AI, Stout MJ, et al. The relationship between maternal anemia and umbilical cord oxygen content at delivery. Am J Obstet Gynecol MFM. 2021;3(1):100270. doi: 10.1016/j.ajogmf.2020.100270. [DOI] [PMC free article] [PubMed] [Google Scholar]
- 50.Prockop DJ, Oh JY. Mesenchymal stem/stromal cells (MSCs): Role as guardians of inflammation. Mol Ther. 2012;20(1):14–20. doi: 10.1038/mt.2011.211. [DOI] [PMC free article] [PubMed] [Google Scholar]