Abstract
High-mobility-group proteins HMG-1 and HMG-I/Y bind to multiple sites within a 268 bp A/T-rich enhancer element of the pea plastocyanin gene (PetE). Within a 31 bp region of the enhancer, the binding site for HMG-1 overlaps with the binding site for HMG-I/Y. The kinetics of binding and the affinities of HMG-1 and HMG-I/Y for the 31 bp DNA were determined using surface plasmon resonance. Due to very high non-specific interactions of the HMG proteins with a carboxymethyl–dextran matrix, a novel method using a cholesterol tag to anchor the DNA in a supported lipid monolayer on a thin gold film was devised. The phosphatidylcholine monolayer produced a surface that reduced background interactions to a minimum and permitted the measurement of highly reproducible protein–DNA interactions. The association rate constant (ka) of HMG-I/Y with the 31 bp DNA was ~5-fold higher than the rate constant for HMG-1, whereas the dissociation constant (KD) for HMG-I/Y (3.1 nM) was ~7-fold lower than that for HMG-1 (20.1 nM). This suggests that HMG-I/Y should bind preferentially at the overlapping binding site within this region of the PetE enhancer.
INTRODUCTION
High mobility group (HMG) proteins are the most abundant of the non-histone chromosomal proteins; they are defined as proteins that can be extracted from chromatin with 0.35 M NaCl and are soluble in 2% trichloroacetic acid or 2–5% perchloric acid (1,2). HMG proteins are rich in acidic and basic amino acids and also often contain a large number of proline residues (2). They are divided into three groups based on amino acid sequence homology: the HMG-1/2 group, the HMG-14/17 group and the HMG-I/Y group (1). Proteins of the HMG-1/2 group are characterised by the presence of one or two copies of a structural motif known as the HMG-box (3). These proteins bind preferentially at sites where the DNA structure has been distorted, such as in cruciforms or in cisplatin-modified DNA (4–8). The HMG-14/17 group consists of proteins that interact with the histone octamer in nucleosomes in transcriptionally-active chromatin (9). Proteins of the HMG-I/Y group bind to DNA in the minor groove of A/T-rich sequences using a motif known as an AT-hook (10–12). Plant homologues of HMG-1 and HMG-I/Y have been identified in a number of species (13–17) but as yet no plant homologues of the HMG-14/17 group have been identified. HMG-1 and HMG-I/Y proteins have been shown to bind to an A/T-rich enhancer element derived from the promoter region of the pea PetE gene (15,18). Multiple binding sites for HMG-1 and HMG-I/Y have been mapped in the 268 bp enhancer element (15), and a region of 31 bp, which when multimerised also acts as an enhancer element (18), has been shown to contain overlapping binding sites for HMG-1 and HMG-I/Y (see Fig. 1). The aim of the present study was to characterise in more detail the binding of HMG-1 and HMG-I/Y to the 31 bp region of the PetE enhancer.
Figure 1.
Overlapping binding sites of HMG-1 and HMG-I/Y on the 31 bp DNA. Binding sites were determined by DNase I footprinting on each strand of the 268 bp enhancer element (15). Nucleotides on each strand protected from cleavage by HMG-I/Y (solid single line) and HMG-1 (double line) are shown.
Previous measurements of HMG-1 binding to DNA have been made by quantifying band-shift experiments. Churchill et al. (19) estimated a KD of 560 nM for binding of Drosophila HMG-D, which contains a single HMG box, like the pea HMG-1 protein, to duplex DNA and a KD of 200 nM for binding to DNA containing a single cis-platinum lesion. Wagner et al. (20) investigated the influence of the method of preparation of HMG-1 protein from calf thymus upon the resulting affinity of the protein for double-stranded DNA. They reported KD values of 2–8 nM for protein prepared under their optimal conditions and 3–20 nM for protein prepared using the standard procedure with trichloroacetic acid or perchloric acid. An investigation of HMG protein binding to DNA using surface plasmon resonance (SPR) has been reported using HMG-1 and HMG-2 isolated from pig thymus and biotinylated DNA immobilised on a streptavidin-derivatised carboxymethyl–dextran (SA) sensor chip (21). KD values of 4.3 and 3.0 µM for HMG-1 and HMG-2, respectively, were reported. Estimates of the affinity of HMG-I/Y binding to DNA have been limited to binding to reconstituted nucleosomes or to distorted DNA structures such as cruciforms. Reported affinities vary from 50 nM for binding to nucleosomes (22) to 6.5 nM for binding to a cruciform structure (23).
Most methods for the determination of HMG protein–DNA interactions have been based on the separation of free and bound DNA by physical methods such as electrophoresis (24) or filter binding (25). Quantification of the amounts of free and bound DNA allows the determination of the affinity of the protein for DNA. These methods often suffer from poor reproducibility and are not easily used for the investigation of binding kinetics. Biosensor technology allows the measurement of macromolecular interactions in real time; hence both binding constants and rate constants for binding can be determined (26–28). However, analysis of DNA–protein interactions using SPR may be adversely affected by high levels of non-specific binding of the DNA-binding protein to the negative dextran matrix (29–31). There can be significant electrostatic interactions between such proteins and the negatively charged dextran matrix usually employed to immobilise the DNA. Biacore AB have commercialised a hydrophobic association sensor chip which consists of a self-assembled monolayer of alkane-thiol on a gold film. Phosphatidylcholine vesicles are spontaneously absorbed onto the alkane surface to form a supported lipid monolayer (32,33) which chemically and physically resembles the surface of a cell membrane. This type of surface is electrostatically neutral, as the negatively charged phosphate group of the lipid is balanced by the positively charged choline head-group. Changes in the measured refractive index at this surface, given in response units (RU), are proportional to the amount of material in the immediate vicinity of the sensor surface (34). Buffered solutions of a protein passed over the surface allow the affinity and kinetics of the binding event to be calculated from analysis of the resulting binding curve.
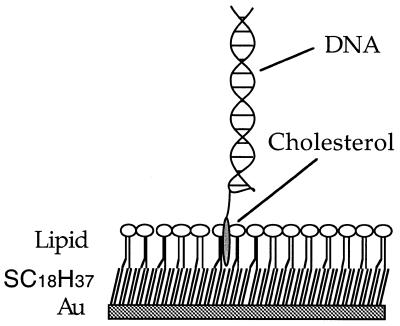
In this paper, we describe the use of a supported lipid monolayer into which annealed, complementary oligonucleotides containing binding sites for HMG-1 and HMG-I/Y have been anchored by means of a cholesterol tag (Fig. 2). This approach reduces the degree of non-specific interaction between the protein and the surface supporting the DNA, allowing measurements to be made in the absence of high levels of competitor DNA.
Figure 2.
Representation of cholesterol-tagged 31 bp double-stranded DNA immobilised in a supported lipid monolayer formed on a hydrophobic self-assembled monolayer, on a thin gold film.
MATERIALS AND METHODS
Preparation of HMG proteins
Pea HMG proteins were purified from Escherichia coli strains containing pET16B-kan plasmids expressing cDNAs encoding HMG-1 or HMG-I/Y under the control of a T7 promoter, as described previously (15). Protein concentrations were quantified by amino acid analysis.
Preparation of vesicles
Small unilamellar vesicles were prepared in phosphate buffer (0.1 M, pH 7.4) by extrusion (35). Dibehemoylphosphatidylcholine (DBPC, synthetic C22:0, Sigma) (128 mg, 160 mmol) was dissolved in chloroform (10 ml, rendered ethanol free by passage through a column of activated alumina) in a 100 ml round-bottom flask. The lipid was deposited as a thin film by removal of the solvent under reduced pressure on a rotary evaporator, then dried under high vacuum for 2 h. PBS (100 mM Na2HPO4/NaH2PO4, 150 mM NaCl, pH 7.4) (8 ml) was then added to give a 20 mM lipid suspension. The lipid was briefly sonicated, shaken for 30 min, then passed 17 times through a 50 nm polycarbonate filter in an Avestin Lipofast Basic extrusion apparatus to give a translucent suspension.
Formation of lipid monolayers
DBPC vesicles (500 µM lipid concentration, 100 µl) were loaded onto an HPA chip in a BIACORE 2000 biosensor (Biacore AB) using phosphate buffer as eluent at low flow rate (2 µl/min), immediately following a 10 min injection of 40 mM octyl-d-glucoside. The surface was then washed at high flow rate (100 µl/min) with 20 µl of 10 mM sodium hydroxide, resulting in formation of a stable baseline. Complete coverage of the hydrophobic chip surface was confirmed by an injection of bovine serum albumin (Sigma, 5 min injection at 0.1 mg/ml). The stability of the lipid monolayer was assayed by continuous buffer flow at 20 µl/min for 18 h.
Deposition of the 31 bp DNA in lipid monolayers
One strand of the 31 bp region of the PetE enhancer element (15) was synthesised with a 3′ cholesteryl group (AAT ATA CTA GTA TTA TTT ACT AAA AAA AAT C-cholesterol) using a cholesteryl-CPG 500 cartridge (Glen Research). The tagged strand was annealed to a complementary oligonucleotide lacking a cholesterol tag by heating an equimolar mixture of the two oligonucleotides in sterile water to 95°C and allowing then to cool slowly to room temperature. The annealed oligonucleotide was then diluted in PBS and injected over a lipid monolayer (4 ng/µl, 10 µl, 10 µl/min) resulting in the deposition of 200 RU of material.
Reproducibility of protein binding to a DNA–lipid monolayer surface
HMG-1 (250 nM, 60 µl, 20 µl/min) was injected across a DNA–lipid monolayer surface in binding buffer (25 mM HEPES–KOH pH 7.6, 40 mM KCl, 0.1 mM EDTA) followed by a 30 s injection of 2 M KCl. A pulse of cholesteryl-31 bp DNA (0.5 ng/µl, 10 s) was then injected across the surface resulting in the deposition of ~10 RU of material. The process of protein binding, regeneration with 2 M KCl and 31 bp DNA deposition was repeated 40 times.
Determination of kinetics of protein binding to a DNA–lipid monolayer surface
HMG proteins diluted in phosphate buffer from 1 µM to 65 nM in binding buffer were passed for 3 min at a flow rate of 20 µl/min serially over a flow cell containing a lipid monolayer alone and a flow cell containing lipid and 31 bp DNA. After injection, the sample plug was replaced by buffer and the protein–DNA complex allowed to dissociate for 5 min. Residually bound protein was then completely dissociated from the DNA by a 30 s injection of 2 M KCl. A solution of cholesterol-tagged 31 bp DNA (0.5 ng/µl, 5 µl, 30 µl/min) was then injected across the DNA-containing flow cell only, resulting in the deposition of 10 RU of 31 bp DNA. All assays were carried out at 25°C in duplicate.
Deposition of 31 bp DNA on a streptavidin–carboxymethyl–dextran surface
The 31 nt oligonucleotide biotinylated at the 5′ end of the bottom strand (15) was annealed to the non-biotinylated complementary strand by heating to 95°C and allowing to cool to room temperature. The concentration was adjusted to 100 ng/µl in binding buffer and injected over a SA sensor chip (10 µl, 20 µl/min). This resulted in the deposition of ~500 RU of oligonucleotide.
Protein binding to a 31 bp DNA–carboxymethyl dextran– surface
Serial 2-fold dilutions of HMG-1 or HMG-I/Y (500 to 16 nM) were injected first over an underivatised control flow cell, then over the 31 bp DNA-containing flow cell (10 µl/ml, 50 µl, 10 µl/min) of a SA sensor chip in binding buffer in the presence of 0 to 10 µg/ml poly(dGdC)·poly(dGdC) (Pharmacia). Residually bound protein was then completely dissociated from the sensor chip by a 30 s injection of 2 M KCl.
SPR data analysis
Data were prepared for analysis by subtracting the average response recorded 20 s prior to injection and adjusting the time of each injection to zero. Data from the flow cell containing lipid alone were subtracted from corresponding data from the DNA-containing flow cell to correct for bulk refractive index changes. Analysis was carried out using BIACORE 3.0 global analysis software based on algorithms for numerical integration (36).
The bimolecular association was assumed to be pseudo first order with no interaction between separate DNA molecules. The association and dissociation rates, ka and kd, for formation of a homogeneous binary complex of analyte A and ligand B in solution are given by
ka
A + B ↔ AB
kd
t = 0: A0 B0 0
t = t: A0 – ABt B0 – ABt ABt
thus
dAB/dt = kaAB – kdAB
In the SPR flow cell, the analyte is being continually added to and removed from the system so the concentration will remain at the initial value, C. The total amount of ligand present is expressed in terms of Rmax, the maximum possible response. The amount of complex formed is proportional to Rt, the observed response. Thus after a time, t, the concentration of analyte will still be C, and the amount of free ligand will be given by Rmax – Rt. The association and dissociation rates in the flow cell are given by:
ka
A + B ↔ AB
kd
t = 0: C Rmax 0
t = t: C Rmax – Rt Rt
thus
dR/dt = kaC (Rmax – Rt) – kdRt
RESULTS
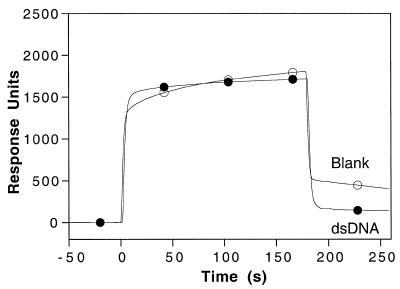
Initial experiments using surface plasmon resonance to determine the rate and binding constants of pea HMG-1 and HMG-I/Y to the 31 bp PetE enhancer region (Fig. 1) were carried out with 5′-biotinylated DNA immobilised on a SA sensor chip. HMG-1 or HMG-I/Y at 100 µM were injected first over an underivatised control flow cell, then over the DNA-containing flow cell. The HMG proteins bound equally well to the control surface without DNA as to the DNA-containing surface (Fig. 3 for HMG-1). In an attempt to reduce the non-specific binding of HMG-1 to the SA sensor chip, poly(dGdC)·poly(dGdC) was added as competitor DNA to the protein sample at concentrations up to 30 µg/ml. However, at this concentration, no binding of HMG-1 to the sensor chip surface was observed either in the presence or absence of the 31 bp DNA. The use of the derivatised carboxymethyl–dextran sensor chip was therefore abandoned in favour of a hydrophobic association sensor chip.
Figure 3.
Injection of HMG-1 over a SA sensor chip flowcell. HMG-1 (100 µM) was injected over a flow cell with ~500 RU of 31 bp DNA (closed circles), and over an underivatised control flowcell (open circles). The symbols are used solely as aids for the identification of the individual response traces.
Lipid monolayers were formed on a hydrophobic association chip (Biacore AB) by passing a suspension of small unilamellar vesicles of DBPC across the surface immediately after a cleansing pulse of the detergent octyl glucoside. This resulted in an unstable signal ~1600 RU above the original level; the instability was possibly due to the formation of multilamellar structures on the sensor chip (37). The surface was then washed at high flow rate with 10 mM NaOH to remove these putative multiple layers, and this produced a stable signal of ~1400 RU. Adequate coverage of the sensor chip was confirmed by the lack of binding of bovine serum albumin, which binds significantly to the chip in the absence of lipid (37). Buffer passed over the monolayer at 20 µl/min for 18 h resulted in baseline drift <0.3 RU/min, indicating that the lipid monolayer was stable over the course of an experiment.
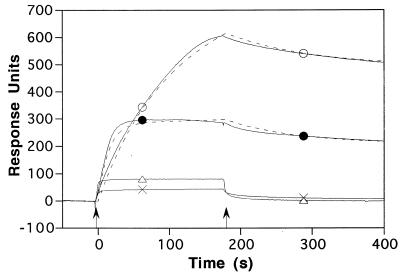
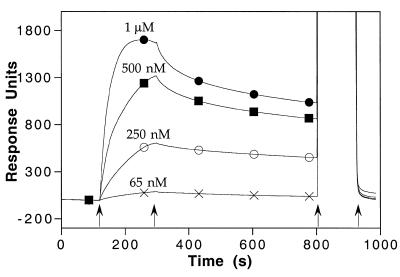
A 31 nt single-stranded oligonucleotide with a cholesteryl- triethyleneglycol phosphoramidite tag at the 3′ end was hybridised to its complementary oligonucleotide, to produce the 31 bp PetE enhancer region (15). The DNA was then injected across the lipid monolayer, resulting in the deposition of 200 RU of DNA, which corresponds (34) to 0.18 ng/mm2, or 8.0 fmol/mm2. HMG-1 and HMG-I/Y both bound significantly to the DNA-containing surface when applied at 250 nM (Fig. 4) and the resulting DNA–protein complexes could be disrupted with 2 M KCl with no apparent deterioration of the lipid layer (Fig. 5). The lipid surface without the inserted 31 bp DNA showed only ~10% of this level of HMG-1 and HMG-I/Y absorption and thus appeared to provide a good control surface (Fig. 4). The DNA-containing surface was also highly specific as evidenced by the lack of binding of BSA at concentrations as high as 0.1 mg/ml (data not shown). Data from the lipid control surface were subtracted from data from the DNA-containing surface to correct for bulk refractive index changes between the running buffer and the protein solutions. These corrected data were then fitted to the binding algorithms described in Materials and Methods.
Figure 4.
Response of control and cholesterol-tagged DNA surfaces to the injection of HMG-1 and HMG-I/Y. HMG-1 (triangles) and HMG-I/Y (crosses) at 250 nM were injected over the control lipid-only monolayer for 180 s beginning at time 0. HMG-1 (open circles) and HMG-I/Y (closed circles) at 250 nM were injected over a DNA–lipid monolayer for 180 s beginning at time 0. Arrows indicate the beginning and end of each injection, with data points taken every 0.5 s. Dashed lines indicate fitting of these data to the binding algorithm described in Materials and Methods. The symbols are used solely as aids for the identification of the individual response traces.
Figure 5.
Dose-dependent binding of HMG-1 to the cholesterol-tagged DNA–lipid surface. HMG-1 at various concentrations (65 nM to 1 µM) was injected over a DNA–lipid monolayer at time 120 s for 180 s, followed by buffer for 500 s. The surface was regenerated by an injection of 2 M KCl (at t = 800 s) for 120 s. The symbols are used solely as aids for the identification of the individual response traces.
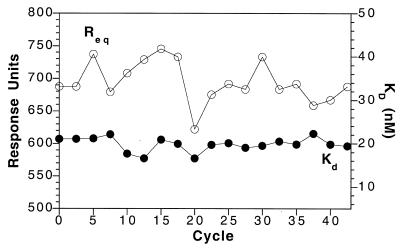
DBPC (C22:0), the saturated long-chain lipid used for these experiments, is gel-like at 25°C (38). Cholesterol is known to increase the fluidity of membranes composed of saturated lipids at temperatures below the phase transition temperature of the membrane lipids (39). DBPC was used in these experiments because a gel-like monolayer may better accommodate the cholesterol tag than a more fluid monolayer, which may have had a reduced affinity for the cholesterol-tagged 31 bp DNA. Stable ligand immobilisation levels are of paramount importance for kinetic analysis using SPR. Repeated injection of a constant concentration of HMG-1 over the DNA–lipid monolayer, followed by regeneration of the free DNA with salt showed that the binding levels decreased by ~5% per cycle of binding and regeneration. This was attributed to loss of the DNA from the monolayer. To compensate for this loss, a short pulse of cholesterol-tagged 31 bp DNA at low concentration was passed over the lipid surface after each cycle of protein binding and regeneration. This resulted in the deposition of 10 RU, or ~10 pg DNA/mm2 (34). The measured affinity, and amount of HMG-1 bound at equilibrium, was then stable for up to 40 repeated cycles of binding and regeneration (Fig. 6). This type of correction does not take into account any changes in the surface capacity during the binding event. Although this effect can be accurately described by introduction of extra terms into the binding algorithm (40), this type of analysis was not performed because the drift was very small and the data could be adequately fitted to the simple 1:1 binding algorithm (36) described in Materials and Methods.
Figure 6.
Reproducibility of binding and affinity of HMG-1 at the cholesterol-tagged DNA–lipid monolayer. The measured KD (closed circles, right-hand scale) and response levels at equilibrium Req (open circles, left-hand scale) for 42 cycles of binding of HMG-1 (250 nM) to the DNA–lipid monolayer are shown. The mean response was 690 ± 35 RU and the mean KD was 19.9 ± 1.6 nM.
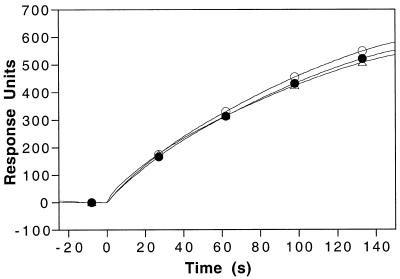
Association rate constants (ka) for binding of HMG-1 were measured at varying flow rates to probe for possible mass transport limitation of binding. Mass-transport-limited kinetics can adversely affect experimental data in biosensor flow cell systems and occur when massive analytes bind with rapid association rates (41). The observed association rate of HMG-1 for the 31 bp DNA varied by <10% over a range of flow rates from 10 to 40 µl/min (Fig. 7). This small variation in the association rate of HMG-1 with the DNA at different flow rates indicates that binding of this relatively small protein (22 kDa) was not unduly affected by mass transport (41).
Figure 7.
HMG-1 binding to the cholesterol-tagged DNA–lipid monolayer at different flow rates. Binding of HMG-1 (250 nM) at the DNA–lipid surface was performed at three different flow rates: 10 (triangles), 20 (closed circles) and 40 (open circles) µl/min.
The development of a robust and sensitive method for studying interactions of HMG proteins and DNA allowed the determination of the parameters for HMG-1 and HMG-I/Y binding to the 31 bp DNA. HMG-1 bound to the 31 bp DNA at a rate (ka = 3.4 ± 0.2 × 10⁴ M–1s–1) ~5-fold slower than HMG-I/Y (ka = 1.5 ± 0.4 × 10⁵ M–1s–1) (Table 1). The two proteins showed similar dissociation rates, and hence HMG-I/Y possessed a higher affinity (KD = 3.1 ± 0.3 nM) for its binding site in the 31 bp DNA than HMG-1 (KD = 20.1 ± 2.6 nM) (Table 1).
Table 1. Kinetic constants for binding of HMG proteins to cholesterol-tagged 31 bp DNA.
| Protein | ka (M–1s–1) | kd (s–1) | KD (nM) |
|---|---|---|---|
| HMG-1 |
3.4 ± 0.2 × 10⁴ |
6.8 ± 0.8 × 10⁻⁴ |
20.1 ± 2.6 |
| HMG-I/Y | 1.5 ± 0.4 × 10⁵ | 4.6 ± 0.9 × 10⁻⁴ | 3.1 ± 0.3 |
Values are means ± standard errors for n = 2.
DISCUSSION
The results obtained in these experiments show that DNA immobilised on a supported lipid monolayer by a cholesterol tag at the 3′ end of one of the DNA strands can be used to measure binding constants for two pea HMG proteins. The data obtained broadly agree with data obtained for HMG proteins from other species by several different methods. Previously estimated dissociation constants for HMG-1 range from 2 nM (20) to 5 µM (21). However, comparison of dissociation constants between HMG-1/2 proteins from different species may be influenced by the number of HMG-box motifs in the proteins. Proteins from mammalian sources have two HMG boxes whereas those from plants, insects and lower eukaryotes have a single HMG box (3). The only data available for HMG-1/2 proteins containing a single HMG box are those for Drosophila HMG-D (19) where a KD of 560 nM was estimated from band-shift experiments. This value is considerably higher than the value of 20 nM obtained for pea HMG-1 binding to the 31 bp DNA using SPR.
The only other investigation of HMG-1/2 protein binding to DNA by SPR was an investigation of pig thymus HMG-1 and HMG-2 binding to biotinylated DNA immobilised on a SA sensor chip (21). The KD values of 4.3 and 3.0 µM reported for HMG-1 and HMG-2, respectively, are at least two orders of magnitude greater than those obtained in the present work and those reported elsewhere (20). Extremely low flow rates (2 µl/min) were employed for a kinetic analysis of binding (26) and, most importantly, no controls were reported to show that the observed binding was specific for the DNA-derivatised surface. Using the same SA sensor chip used by Yamamoto et al. (21), in our hands, HMG-1 bound equally well to an underivatised control surface as to the DNA-derivatised surface (Fig. 3). Yamamoto et al. (21) reported no data for binding to a control surface. Attempts to use the SA surface to measure interactions between the pea HMG proteins and the 31 bp PetE enhancer region were severely hampered by non-specific interactions between the protein and the carboxymethyl–dextran surface. Attempts to reduce the non-specific binding by inclusion of poly(dGdC)·poly(dGdC) as a competitor DNA were unsuccessful. These results cast doubt on whether the interactions reported by Yamamoto et al. (21) were a result of specific DNA binding, or were due to non-specific binding of the protein to the negatively charged matrix of the sensor chip. The dissociation constants reported by Yamamoto et al. (21) are two to three orders of magnitude higher than the values reported in this study and values reported elsewhere (20). This observation adds support to the hypothesis that the ‘affinity’ reported by Yamamoto et al. (21) in fact describes a non-specific interaction. Yamamoto et al. (21) also derived affinities from gel retardation assays. These values are similar to those found in their SPR experiments. However, in the gel retardation assays they used an entire plasmid (pBR322) as the DNA substrate and were most likely measuring multiple protein–DNA interactions. Additionally, the off rate quoted from the SPR experiments appears to be too fast (t1/2 = 10 s) to allow the HMG-protein to remain bound to the DNA during the time required for electrophoresis.
Previous data for measuring HMG-I/Y binding to DNA have not been obtained using duplex DNA as has been described here. Previous affinities of 6.5 and 50 nM for binding to cruciform (23) and nucleosomal (22) DNA are close to the value of 3.1 nM obtained in these experiments. In both of these cases the DNA is either distorted or constrained which could influence the affinity of the HMG-I/Y for the DNA.
Both HMG-1 and HMG-I/Y are known to bind to A/T-rich regions of DNA (10,42) through interactions with the minor groove of the DNA helix (7,11). The function of HMG proteins binding to the DNA has begun to be unravelled over the past few years; binding of HMG-1 to DNA causes distortions to the DNA structure inducing bends (6,7,43,44) and this has led to the hypothesis that HMG-1 may be partly responsible for the organisation of chromatin (45). HMG-I/Y is known to be involved in the formation of multi-protein complexes within enhancer regions of an number of genes; the best studied of these is the human interferon beta gene promoter where HMG-I/Y is involved in the formation of an enhanceosome (46) and is responsible for the recruitment of other transcription factors (47). It has also been postulated that HMG-I/Y is able to relieve transcriptional repression caused by histone H1 and may be able to modulate DNA binding to the nuclear scaffold and influence local chromatin structure (48). The fact that HMG-1 and HMG-I/Y bind at overlapping sites within the 31 bp region of the PetE enhancer (15), and the absence of DNA–protein complexes containing both HMG proteins in gel retardation assays (15), raises the possibility that these two proteins compete for binding to this region of DNA in vivo. The present data indicate that HMG-I/Y has the higher affinity for DNA with a KD of 3.1 nM, compared to 20.1 nM for HMG-1, and also has an association rate almost 5-fold faster than HMG-1 (Table 1), suggesting that HMG-I/Y is likely to be responsible for the majority of the protein–DNA interactions at this site in mixtures of the two proteins present in nuclei. DNase I footprinting patterns on the 268 bp PetE enhancer indicate that HMG-I/Y binding predominates even in the presence of ~10-fold higher amounts of HMG-1 (15). DNase I footprints with crude preparations of HMG proteins from pea shoots were similar to those obtained with purified HMG-I/Y, but different to those with HMG-1 (15,49). This suggests that HMG-I/Y may be responsible for the initial protein–DNA interactions at this enhancer region where it recruits other proteins such as transcription factors to assemble a complex that confers the organ-independent enhancer properties of P268 (18). However, it is important not to extrapolate too far from studies in vitro to the situation in vivo, where other proteins will be present and the HMG proteins may undergo post-translational modification (1). Post-translational modification of HMG-1 and HMG-I/Y extracted from pea leaf nuclei is indicated by mass spectrometry (15). It will be important to establish the effects of post-translational modifications of HMG-1 and HMG-I/Y on their interactions with the enhancer element.
Immobilisation of DNA in a lipid monolayer allows evaluation of the binding kinetics of DNA-binding proteins which absorb non-specifically to other sensor chip surfaces. The data presented here demonstrate the utility of supported lipid monolayers and cholesterol-tagged DNA in the analysis of highly charged DNA-binding proteins.
Acknowledgments
ACKNOWLEDGEMENTS
We wish to thank Sanj Kumar (Biacore AB, UK) for the generous initial provision of a BIACORE 2000 biosensor, Charles Hill for help with the synthesis of the cholesterol-tagged DNA and Peter Sharratt for amino acid analysis. This work was supported by research grants from the BBSRC.
REFERENCES
- 1.Bustin M. and Reeves,R. (1996) Prog. Nucleic Acid Res. Mol. Biol., 54, 35–100. [DOI] [PubMed] [Google Scholar]
- 2.Johns E.W. (1982) The HMG Chromosomal Proteins. Academic Press, London, pp. 1–7.
- 3.Laudet V., Stehelin,D. and Clevers,H. (1993) Nucleic Acids Res., 21, 2493–2501. [DOI] [PMC free article] [PubMed] [Google Scholar]
- 4.Bianchi M.E., Beltrame,M. and Paonessa,G. (1989) Science, 243, 1056–1059. [DOI] [PubMed] [Google Scholar]
- 5.Landsman D. and Bustin,M. (1993) Bioessays, 15, 539–546. [DOI] [PubMed] [Google Scholar]
- 6.Grasser K., Krech,A.B. and Feix,G. (1994) Plant J., 6, 351–358. [DOI] [PubMed] [Google Scholar]
- 7.Allain F.H.-T., Yen,Y.-M., Masse,J.E., Schultze,P., Dieckmann,T., Johnson,R.C. and Feigon,J. (1999) EMBO J., 18, 2563–2579. [DOI] [PMC free article] [PubMed] [Google Scholar]
- 8.Ohndorf U.-M., Rould,M.A., He,Q., Pabo,C.O. and Lippard,S.J. (1999) Nature, 399, 708–712. [DOI] [PubMed] [Google Scholar]
- 9.Weisbrod S., Groudine,M. and Weintraub,H. (1981) Cell, 23, 391–400. [DOI] [PubMed] [Google Scholar]
- 10.Reeves R. and Nissen,M.S. (1990) J. Biol. Chem., 265, 8573–8582. [PubMed] [Google Scholar]
- 11.Geierstanger B.H., Volkman,B.F., Kremer,W. and Wemmer,D.E. (1994) Biochemistry, 33, 5347–5355. [DOI] [PubMed] [Google Scholar]
- 12.Huth J.R., Bewley,C.A., Nissen,M.S., Evans,J.N., Reeves,R., Gronenborn,A.M. and Clore,G.M. (1997) Nature Struct. Biol., 4, 657–665. [DOI] [PubMed] [Google Scholar]
- 13.Grasser K.D. (1995) Plant J., 7, 185–195. [DOI] [PubMed] [Google Scholar]
- 14.Nieto-Sotelo J., Ichida,A. and Quail,P.H. (1996) Nucleic Acids Res., 22, 1115–1116. [DOI] [PMC free article] [PubMed] [Google Scholar]
- 15.Webster C.I., Packman,L.C., Pwee,K.-H. and Gray,J.C. (1997) Plant J., 11, 703–715. [DOI] [PubMed] [Google Scholar]
- 16.Gupta R., Webster,C.I., Walker,A.R. and Gray,J.C. (1997) Plant Mol. Biol., 34, 529–536. [DOI] [PubMed] [Google Scholar]
- 17.Yamamoto S. and Minamikawa,T. (1997) Biochim. Biophys. Acta, 1396, 47–50. [DOI] [PubMed] [Google Scholar]
- 18.Sandhu J.S., Webster,C.I. and Gray,J.C. (1998) Plant Mol. Biol., 37, 885–896. [DOI] [PMC free article] [PubMed] [Google Scholar]
- 19.Churchill M.E.A., Jones,D.N.M., Glasser,T., Hefner,H., Searles,M.A. and Travers,A.A. (1995) EMBO J., 6, 1264–1275. [DOI] [PMC free article] [PubMed] [Google Scholar]
- 20.Wagner J.P., Quill,D.M. and Pettijohn,D.E. (1995) J. Biol. Chem., 270, 7394–7398. [DOI] [PubMed] [Google Scholar]
- 21.Yamamoto A., Ando,Y., Yoshioka,K.-I., Saito,K., Tanabe,T., Shirakawa,H. and Yoshida,M. (1998) J. Biochem. (Tokyo), 122, 586–594. [DOI] [PubMed] [Google Scholar]
- 22.Reeves R. and Nissen,M.S. (1993) J. Biol. Chem., 268, 21137–21146. [PubMed] [Google Scholar]
- 23.Hill D.H. and Reeves,R. (1997) Nucleic Acids Res., 25, 3523–3531. [DOI] [PMC free article] [PubMed] [Google Scholar]
- 24.Freid M. and Crothers,D.M. (1981) Nucleic Acids Res., 9, 6505–6525. [DOI] [PMC free article] [PubMed] [Google Scholar]
- 25.Wong I. and Lohman,T.M. (1993) Proc. Natl Acad. Sci. USA, 90, 5428–5432. [DOI] [PMC free article] [PubMed] [Google Scholar]
- 26.Karlsson R. and Falt,A. (1997) J. Immunol. Methods, 200, 121–133. [DOI] [PubMed] [Google Scholar]
- 27.Karlsson R., Roos,H., Fägerstam,L. and Persson,B. (1994) Methods: Companion to Methods in Enzymology, 6, 99–110. [Google Scholar]
- 28.Cheskis B. and Freedman,L.P. (1996) Biochemistry, 35, 3309–3318. [DOI] [PubMed] [Google Scholar]
- 29.Bondeson K., Karlsson,A.F., Fagerstam,L. and Magnusson,G. (1993) Anal. Biochem., 214, 245–251. [DOI] [PubMed] [Google Scholar]
- 30.Fisher R.J., Fivash,M., Finet,J.C., Erikson,J.W., Kondoh,A., Bladen,S.V., Fisher,C., Watson,D.K. and Papas,T. (1994) Protein Sci., 3, 257–266. [DOI] [PMC free article] [PubMed] [Google Scholar]
- 31.Parsons I.D., Persson,B., Mekhalfia,A., Blackburn,G.M. and Stockley,P.G. (1995) Nucleic Acids Res., 23, 211–216. [DOI] [PMC free article] [PubMed] [Google Scholar]
- 32.Kalb E., Frey,S. and Tamm,L.K. (1992) Biochim. Biophys. Acta, 1103, 307–316. [DOI] [PubMed] [Google Scholar]
- 33.Terrettaz S., Stora,T., Duschl,C. and Vogel,H. (1993) Langmuir, 9, 1361–1369. [Google Scholar]
- 34.Stenberg E., Persson,B., Roos,H. and Urbaniczky,C. (1991) J. Colloid Interface Sci., 143, 513–526. [Google Scholar]
- 35.MacDonald R.C., MacDonald,R.I., Menco,B.M., Takeshita,K., Subbarao,N.K. and Hu,L. (1991) Biochim. Biophys. Acta, 1061, 297–303. [DOI] [PubMed] [Google Scholar]
- 36.Burden R.L. and Faires,J.D. (1993) Numerical Analysis, 5th Edn. PWS-Kent Publishing Company, Boston, MA.
- 37.Cooper M.A., Try,A.C., Carroll,J., Ellar,D.J. and Williams,D.H. (1998) Biochim. Biophys. Acta, 1373, 101–111. [DOI] [PubMed] [Google Scholar]
- 38.Blume A. (1983) Biochemistry, 22, 5436–5442. [Google Scholar]
- 39.New R.C. (1990) In Rickwood,D. (ed.), Liposomes: A Practical Approach, 1st Edn. Oxford University Press, Oxford, UK pp. 18–22.
- 40.Joss L., Morton,T.A., Doyle,M.L. and Myska,D.G. (1998) Anal. Chem., 261, 203–210. [Google Scholar]
- 41.Myszka D.G., Morton,T.A., Doyle,M.L. and Chaiken,I.M. (1997) Biophys. Chem., 64, 127–137. [DOI] [PubMed] [Google Scholar]
- 42.Brown J.W. and Anderson,J.A. (1986) J. Biol. Chem., 261, 1349–1354. [PubMed] [Google Scholar]
- 43.Paull T.T., Haykinson,M.J. and Johnson,R.C. (1993) Genes Dev., 7, 1521–1534. [DOI] [PubMed] [Google Scholar]
- 44.Pil P.M., Chow,C.S. and Lippard,S.J. (1993) Proc. Natl Acad. Sci. USA, 90, 9465–9469. [DOI] [PMC free article] [PubMed] [Google Scholar]
- 45.Grosschedl R., Giese,K. and Pagel,J. (1994) Trends Genet., 10, 94–100. [DOI] [PubMed] [Google Scholar]
- 46.Thanos D. and Maniatis,T. (1995) Cell, 83, 1091–1100. [DOI] [PubMed] [Google Scholar]
- 47.Yie J., Merika,M., Munski,N., Chen,G. and Thanos,D. (1999) EMBO J., 18, 3074–3089. [DOI] [PMC free article] [PubMed] [Google Scholar]
- 48.Zhao K., Kas,E., Gonzalez,E. and Laemmli,U.K. (1993) EMBO J., 12, 3237–3247. [DOI] [PMC free article] [PubMed] [Google Scholar]
- 49.Pwee K.-H., Webster,C.I. and Gray,J.C. (1994) Plant Mol. Biol., 26, 1907–1920. [DOI] [PubMed] [Google Scholar]


