

Abstract
Background:
Prostate cancer is the most heritable cancer. There is a need to identify possible modifiable factors for men at increased risk of prostate cancer due to genetic factors.
Objective:
To examine whether men at increased genetic risk of prostate cancer can offset their risk of disease or disease progression by adhering to a healthy lifestyle.
Design, setting, and participants:
We prospectively followed 12,411 genotyped men in the Health Professionals Follow-up Study (1993–2019) and the Physicians’ Health Study (1983–2010). Genetic risk of prostate cancer was quantified using a polygenic risk score (PRS). A healthy lifestyle was defined by healthy weight, vigorous physical activity, not smoking, and a healthy diet.
Outcome measurements and statistical analysis:
Overall and lethal prostate cancer (metastatic disease/prostate cancer-specific death), analyzed using time-to-event analyses estimating hazard ratios (HRs) and lifetime risks.
Results and limitations:
During 27 yr of follow-up, 3,005 overall prostate cancer and 435 lethal prostate cancer events were observed. The PRS enabled risk stratification not only for overall prostate cancer, but also for lethal disease with a four-fold difference between men in the highest and the lowest quartiles (HR, 4.32; 95% CI, 3.16–5.89). Among men in the highest PRS quartile, adhering to a healthy lifestyle was associated with a decreased rate of lethal prostate cancer (HR, 0.55; 95% CI, 0.36–0.86) compared with having an unhealthy lifestyle, translating to a lifetime risk of 1.6% (95% CI, 0.8–3.1%) among the healthy and 5.3% (95% CI, 3.6–7.8%) among the unhealthy. Adhering to a healthy lifestyle was not associated with a decreased risk of overall prostate cancer.
Conclusions:
Our findings suggest that a genetic predisposition for prostate cancer is not deterministic for a poor cancer outcome. Maintaining a healthy lifestyle may provide a way to offset the genetic risk of lethal prostate cancer.
Patient summary:
This study examined whether the genetic risk of prostate cancer can be attenuated by a healthy lifestyle including a healthy weight, regular exercise, not smoking, and a healthy diet. We observed that adherence to a healthy lifestyle reduced the risk of metastatic disease and prostate cancer death among men at the highest genetic risk. We conclude that men at a high genetic risk of prostate cancer may benefit from adhering to a healthy lifestyle.
Keywords: Genetic susceptibility, Healthy lifestyle, Polygenic risk score, Prostate cancer
Introduction
Prostate cancer is the most heritable cancer, with 58% of variability in prostate cancer risk attributable to inherited genetic factors.1 A recent large-scale genome-wide association study (GWAS) identified 269 germline risk variants, which strongly predicts prostate cancer risk when combined into a polygenic risk score (PRS).2 The lifetime risk of prostate cancer is ≥50% among men in the top PRS decile, compared with <10% among men in the bottom decile.3 Although current PRS models do not specifically distinguish nonaggressive and aggressive disease, previous studies have reported that close to half of aggressive prostate cancer cases occur in men in the top quartile of the PRS.2,4
For men at an increased risk of prostate cancer due to unmodifiable genetic factors, there is a need to identify possible modifiable factors, which could include a healthy lifestyle. While no clear relationship between lifestyle factors and overall prostate cancer is established, increasing evidence suggests that a healthy lifestyle may reduce the risk of dying from prostate cancer.5–11 To what extent men at a high genetic risk benefit from adhering to a healthy lifestyle is currently unknown.
Within two prospective cohort studies, we aimed to evaluate whether men at a high genetic risk for prostate cancer, defined by a high PRS, can mitigate their risk of either overall or lethal prostate cancer by adhering to a healthy lifestyle. Our overarching hypothesis, which is informed by strong data for the prevention of other diseases,12–15 is that modifiable lifestyle factors can attenuate the effect of an increased genetic risk.
Patients and methods
Study populations
This study included men in the Health Professionals Follow-up Study (HPFS) and the Physicians’ Health Study (PHS). HPFS is a prospective cohort study of 51,529 US male health professionals recruited in 1986 at the age of 40–75 yr.16 Participants were mailed questionnaires biennially to collect information on lifestyle factors, medical history and disease outcomes, with dietary information collected using validated semiquantitative food frequency questionnaire (FFQ) every 4 yr. All HPFS participants were invited to donate a blood sample (received from 18 159 participants between 1993 and 1999) or a buccal cell sample (received from 13 956 participants between 2005 and 2006).
PHS was a randomized primary prevention trial of aspirin and betacarotene which began in 1982 and enrolled 22 071 US male physicians aged 40–84 yr.17 In yearly follow-up questionnaires, information on lifestyle factors, medical history, and disease status was collected. Ten follow-up questionnaires included an abbreviated food list, and the 2000–2002 questionnaire included a 61-item FFQ. Blood samples were collected for 14 916 participants at baseline (1982–1986).
We included all men in HPFS and PHS for whom genotyped data were available and who did not have a diagnosis of prostate cancer at the date of DNA collection (HPFS, n = 10 443; PHS, n = 1 968). As described previously,18 men have been genotyped as part of 12 nested case-control studies, including prostate cancer.19 The vast majority of men (99% in HPFS and 93% in PHS) selected for genotyping self-reported as White.
All participants gave written informed consent and the study protocol was approved by the institutional review boards of the Brigham and Women’s Hospital and Harvard T.H. Chan School of Public Health, and those of participating registries as required.
Polygenic risk score
To calculate genetic risk, we used a multiancestry PRS model2 for prostate cancer including 269 single nucleotide polymorphisms (SNPs), of which 264 were available for analysis. We calculated the score for all men by summing the number of risk alleles of each genetic variant multiplied by the corresponding effect estimate from the original GWAS.2
Healthy lifestyle score
Based on information from validated questionnaires,20,21 each participant was assigned a healthy lifestyle score.10 The score included six components (one point each): body mass index ≤30 kg/m2, high vigorous physical activity, never smoker or having quit 10 yr ago, high intake of tomato-based products, high intake of fatty fish, and low intake of processed meat (Supplementary Table 1). Fewer than 5% of men had missing values in these components at enrollment, which if missing were imputed with the median value or the most common category. The questionnaire returned closest before the date of DNA sampling was used as the baseline questionnaire.
Study outcomes
The outcomes of interest were overall and lethal (metastatic disease/prostate cancer-specific death) prostate cancer. Self-reported prostate cancer diagnoses have been confirmed through medical record and pathology report review. Metastatic disease and vital status were ascertained from questionnaires, medical records, autopsy reports, and searches of the National Death Index. The underlying cause of death was determined by a physician endpoint review committee (blinded to any exposure information). Follow-up for cancer incidence (>96%) and mortality (>99%) is near complete.
Statistical analysis
Men were followed from the date of DNA collection to the date of prostate cancer diagnosis, death, or end of follow-up (outcome: overall prostate cancer), or from the date of DNA collection to the date of metastatic disease, death, or end of follow-up (outcome: lethal prostate cancer). End of follow-up for HPFS was January 2017 for overall prostate cancer (based on the latest available questionnaire cycle) and January 2019 for lethal prostate cancer (based on the latest available cause of death information). End of follow-up for PHS was January 2010 (both outcomes).
We examined the association between PRS, healthy lifestyle score, and prostate cancer both separately and in joint analyses. Exposure groups were constructed based on a priori defined PRS quartiles (using the distribution among all genotyped men) and the healthy lifestyle score aggregated into three categories taking the number of events into account (0–2: unhealthy; 3: moderate healthy; and 4–6: healthy) or its individual components. To account for a possible bias arising from the genotype sampling design, we estimated hazard ratios (HRs) and 95% confidence intervals (CIs) from inverse probability weighted (IPW) Cox proportional hazard models. The IPW method aims to reconstruct the underlying cohort when data from nested case-control studies are reanalyzed for secondary outcomes.22,23 We weighted each genotyped participant by the inverse probability of being selected for genotyping, excluding cases of the original outcomes and prostate cancer cases who were assigned a weight of 1. Weights were derived from logistic regression models using age at sampling and age at the end of followup as covariates.
All Cox models were stratified by 10-yr birth cohort and adjusted for age (underlying time-scale), calendar period of inclusion (1993, 1994, 1995–1999, and 2005–2006), genetic ancestry (principal components 1–3), prostate-specific antigen (PSA) screening in the past 2 yr (yes/no, lagged by one questionnaire cycle to avoid counting diagnostic PSA testing as screening), history of other cancers (yes/no), history of diabetes (yes/no), current aspirin use (yes/no), current statin use (yes/no), and total energy intake (quintiles of kcal/d). For PHS, adjustment was limited to age, genetic ancestry, history of other cancers, history of diabetes, and randomization status. Time-varying models, with covariates updated at each questionnaire cycle, were applied. Information from the prior questionnaire was carried forward for missing values. In a sensitivity analysis, unweighted Cox models were fitted. A fixed effects meta-analysis was used to pool estimates.
In HPFS only, we fitted case-only Cox models following men from diagnosis to lethal disease and Cox models using only prostate cancer/non-prostate cancer death as the outcome. We further estimated the cumulative incidence of both outcomes using the Aalen-Johansen estimator,24 with non-prostate cancer death treated as a competing event and with cumulative incidence by age 85 yr referred to as lifetime risk.
All analyses were performed using R (version 3.6.1).
Results
Among the 10 443 genotyped men in HPFS, we observed 2152 prostate cancer and 251 lethal prostate cancer events. The median follow-up time for men without an event was 22 yr (interquartile range [IQR], 12–23) and 23 yr (IQR, 14–25), respectively. Among the 1968 genotyped men in PHS, we observed 853 prostate cancer and 184 lethal prostate cancer events. The median follow-up time for men without an event was 26 yr (IQR, 18–27) and 27 yr (IQR, 21–27), respectively.
Approximately one-third of men were in the healthy lifestyle group (Table 1). In addition to the expected differences in lifestyle components between lifestyle groups (eg. among men in HPFS, 67% reported vigorous physical activity in the healthy group vs. only 3.5% of men in the unhealthy group), the groups differed in other characteristics suggested to be risk factors for advanced prostate cancer, but these differences were less pronounced.
Table 1.
Characteristics of genotyped men in the Health Professionals Follow-up Study and the Physicians’ Health Study at study entry (ie, DNA collection) according to healthy lifestyle score.
| HPFS (n = 10 443) | PHS (n = 1 968) | |||||
|---|---|---|---|---|---|---|
| Healthy lifestyle score | Healthy lifestyle score | |||||
| Characteristics a | Unhealthy (0–2) | Moderate (3) | Healthy (4–6) | Unhealthy (0–2) | Moderate (3) | Healthy (4–6) |
| No. of men | 3129 | 4276 | 3038 | 367 | 851 | 750 |
| Age at study entry (median, IQR) | 63 [56, 70] | 64 [56, 71] | 64 [57, 70] | 58 [52, 63] | 58 [52, 64] | 59 [54, 65] |
| Source of DNA, n (%) | ||||||
| Blood | 2740 (88) | 3751 (88) | 2667 (88) | 367 (100) | 851 (100) | 750 (100) |
| Cheek | 389 (12) | 525 (12) | 371 (12) | 0 | 0 | 0 |
| History of diabetes, n (%) | 327 (11) | 300 (7.0) | 147 (4.8) | 5 (1.4) | 15 (1.8) | 14 (1.9) |
| Current statin use, n (%) | 318 (10) | 508 (12) | 396 (13) | – | – | – |
| Current aspirin use, n (%) | 1328 (42) | 1792 (42) | 1338 (44) | – | – | – |
| PSA test history, n (%) | 1201 (38) | 1823 (43) | 1317 (43) | – | – | – |
| Components of the healthy lifestyle score, n (%) | ||||||
| BMI <30 kg/m2 | 2188 (70) | 4065 (95) | 2978 (98) | 303 (83) | 832 (98) | 750 (100) |
| Never smoker or quitting ≥10 yr | 1945 (62) | 3967 (93) | 2949 (97) | 120 (33) | 714 (84) | 716 (96) |
| High vigorous physical activity | 109 (3.5) | 584 (14) | 2030 (67) | 4 (1.1) | 40 (4.7) | 287 (38) |
| High tomato intake | 135 (4.3) | 412 (9.6) | 1128 (37) | 7 (1.9) | 28 (3.3) | 130 (17) |
| Low processed meat intake | 998 (32) | 3575 (84) | 2872 (95) | 221 (60) | 783 (92) | 730 (97) |
| High fatty fish intake | 38 (1.2) | 225 (5.3) | 1043 (34) | 7 (1.9) | 28 (3.3) | 130 (17) |
Abbreviations: BMI, body mass index; HPFS, Health Professionals Follow-up Study; IQR, interquartile range; PSA, prostate specific antigen; PHS, Physicians’ Health Study.
Lifestyle characteristics for HPFS are from the questionnaire closest before DNA collection (median time of 1.2 yr (IQR, 0.4–1.6) before DNA collection). For PHS, lifestyle characteristics are from the time-point of DNA collection.
The PRS enabled risk stratification both for overall and lethal prostate cancer (Table 2 and Fig. 1A) with men in the top PRS quartile having a four-fold increased rate of lethal prostate cancer (pooled HR, 4.32; 95% CI, 3.16–5.89) compared with men in the bottom PRS quartile. The healthy lifestyle score was associated with a decreased rate of lethal, but not overall, prostate cancer (Table 2).
Table 2.
Hazard ratios and 95% confidence intervals for the association between polygenic risk score, healthy lifestyle score, and overall and lethal prostate cancer in the Health Professionals Follow-up Study and the Physicians’ Health Study.
| HPFS (n = 10 443) | PHS (n = 1 968) | Pooled (n = 12 411) | |||
|---|---|---|---|---|---|
| No. of events / Person-years of follow-up | HR (95% CI)a | No. of events / Person-years of follow-up | HR (95% CI)b | HR (95% CI) | |
| Overall prostate cancer | |||||
| PRS quartile | |||||
| 0–25% | 203/107739 | 1 (Ref.) | 90/82201 | 1 (Ref.) | 1 (Ref.) |
| 25–50% | 348/105592 | 1.73 (1.44–2.07) | 163/79851 | 1.97 (1.44–2.69) | 1.78 (1.53–2.09) |
| 50–75% | 594/100499 | 3.03 (2.56–3.58) | 236/76463 | 3.05 (2.24–4.14) | 3.03 (2.62–3.51) |
| 75–100% | 1007/95734 | 5.40 (4.61–6.34) | 364/53388 | 6.68 (4.92–9.08) | 5.65 (4.91–6.51) |
| Healthy lifestyle scorec | |||||
| 0–1 (less healthy) | 111/22635 | 1 (Ref.) | 17/5989 | 1 (Ref.) | 1 (Ref.) |
| 2 | 422/84929 | 1.02 (0.82–1.27) | 98/43989 | 0.82 (0.44–1.56) | 0.99 (0.81–1.22) |
| 3 | 881/168713 | 1.06 (0.86–1.31) | 364/116757 | 1.09 (0.59–2.02) | 1.06 (0.87–1.30) |
| 4 | 555/95645 | 1.19 (0.96–1.48) | 279/95911 | 1.01 (0.54–1.89) | 1.17 (0.95–1.44) |
| 5–6 (more healthy) | 183/37644 | 1.09 (0.84–1.40) | 95/29256 | 1.06 (0.55–2.05) | 1.08 (0.86–1.37) |
| Lethal prostate cancer | |||||
| PRS quartile | |||||
| 0–25% | 32/127734 | 1 (Ref.) | 27/96053 | 1 (Ref.) | 1 (Ref.) |
| 25–50% | 47/122294 | 1.50 (0.96–2.35) | 42/90145 | 1.84 (1.11–3.07) | 1.64 (1.17–2.30) |
| 50–75% | 75/114213 | 2.53 (1.67–3.84) | 52/67488 | 2.68 (1.63–4.43) | 2.59 (1.88–3.57) |
| 75–100% | 97/102641 | 3.73 (2.50–5.56) | 63/47620 | 5.40 (3.29–8.85) | 4.32 (3.16–5.89) |
| Healthy lifestyle scorec | |||||
| 0–1 (less healthy) | 18/25161 | 1 (Ref.) | 8/6117 | 1 (Ref.) | 1 (Ref.) |
| 2 | 55/95656 | 0.69 (0.40–1.18) | 27/45052 | 0.51 (0.21–1.26) | 0.64 (0.40–1.01) |
| 3 | 112/191513 | 0.66 (0.40–1.10) | 71/120616 | 0.43 (0.18–1.01) | 0.59 (0.38–0.91) |
| 4 | 53/110601 | 0.61 (0.35–1.05) | 59/99140 | 0.40 (0.17–0.93) | 0.54 (0.34–0.85) |
| 5–6 (more healthy) | 13/43952 | 0.40 (0.19–0.83) | 19/30381 | 0.38 (0.15–0.96) | 0.39 (0.22–0.69) |
Abbreviations: CI, confidence interval; HPFS, Health Professionals Follow-up Study; HR, hazard ratio; PHS, Physicians’ Health Study; PRS, polygenic risk score.
HPFS: Inverse probability weighted Cox regression models, stratified by birth cohort and adjusted for age (underlying time-scale), calendar period of inclusion, and genetic ancestry (PC1-PC3). Models for the healthy lifestyle score were additionally adjusted for lagged PSA screening history, history of other cancers, history of diabetes, current aspirin use, current statin use, and total energy intake.
PHS: Inverse probability weighted Cox regression models, stratified by birth cohort and adjusted for age (underlying time-scale) and genetic ancestry (PC1-PC3). Models for the healthy lifestyle score were additionally adjusted for history of other cancers, history of diabetes, and randomization status.
Categorization as in the original study by Kenfield et al.10
Figure 1.
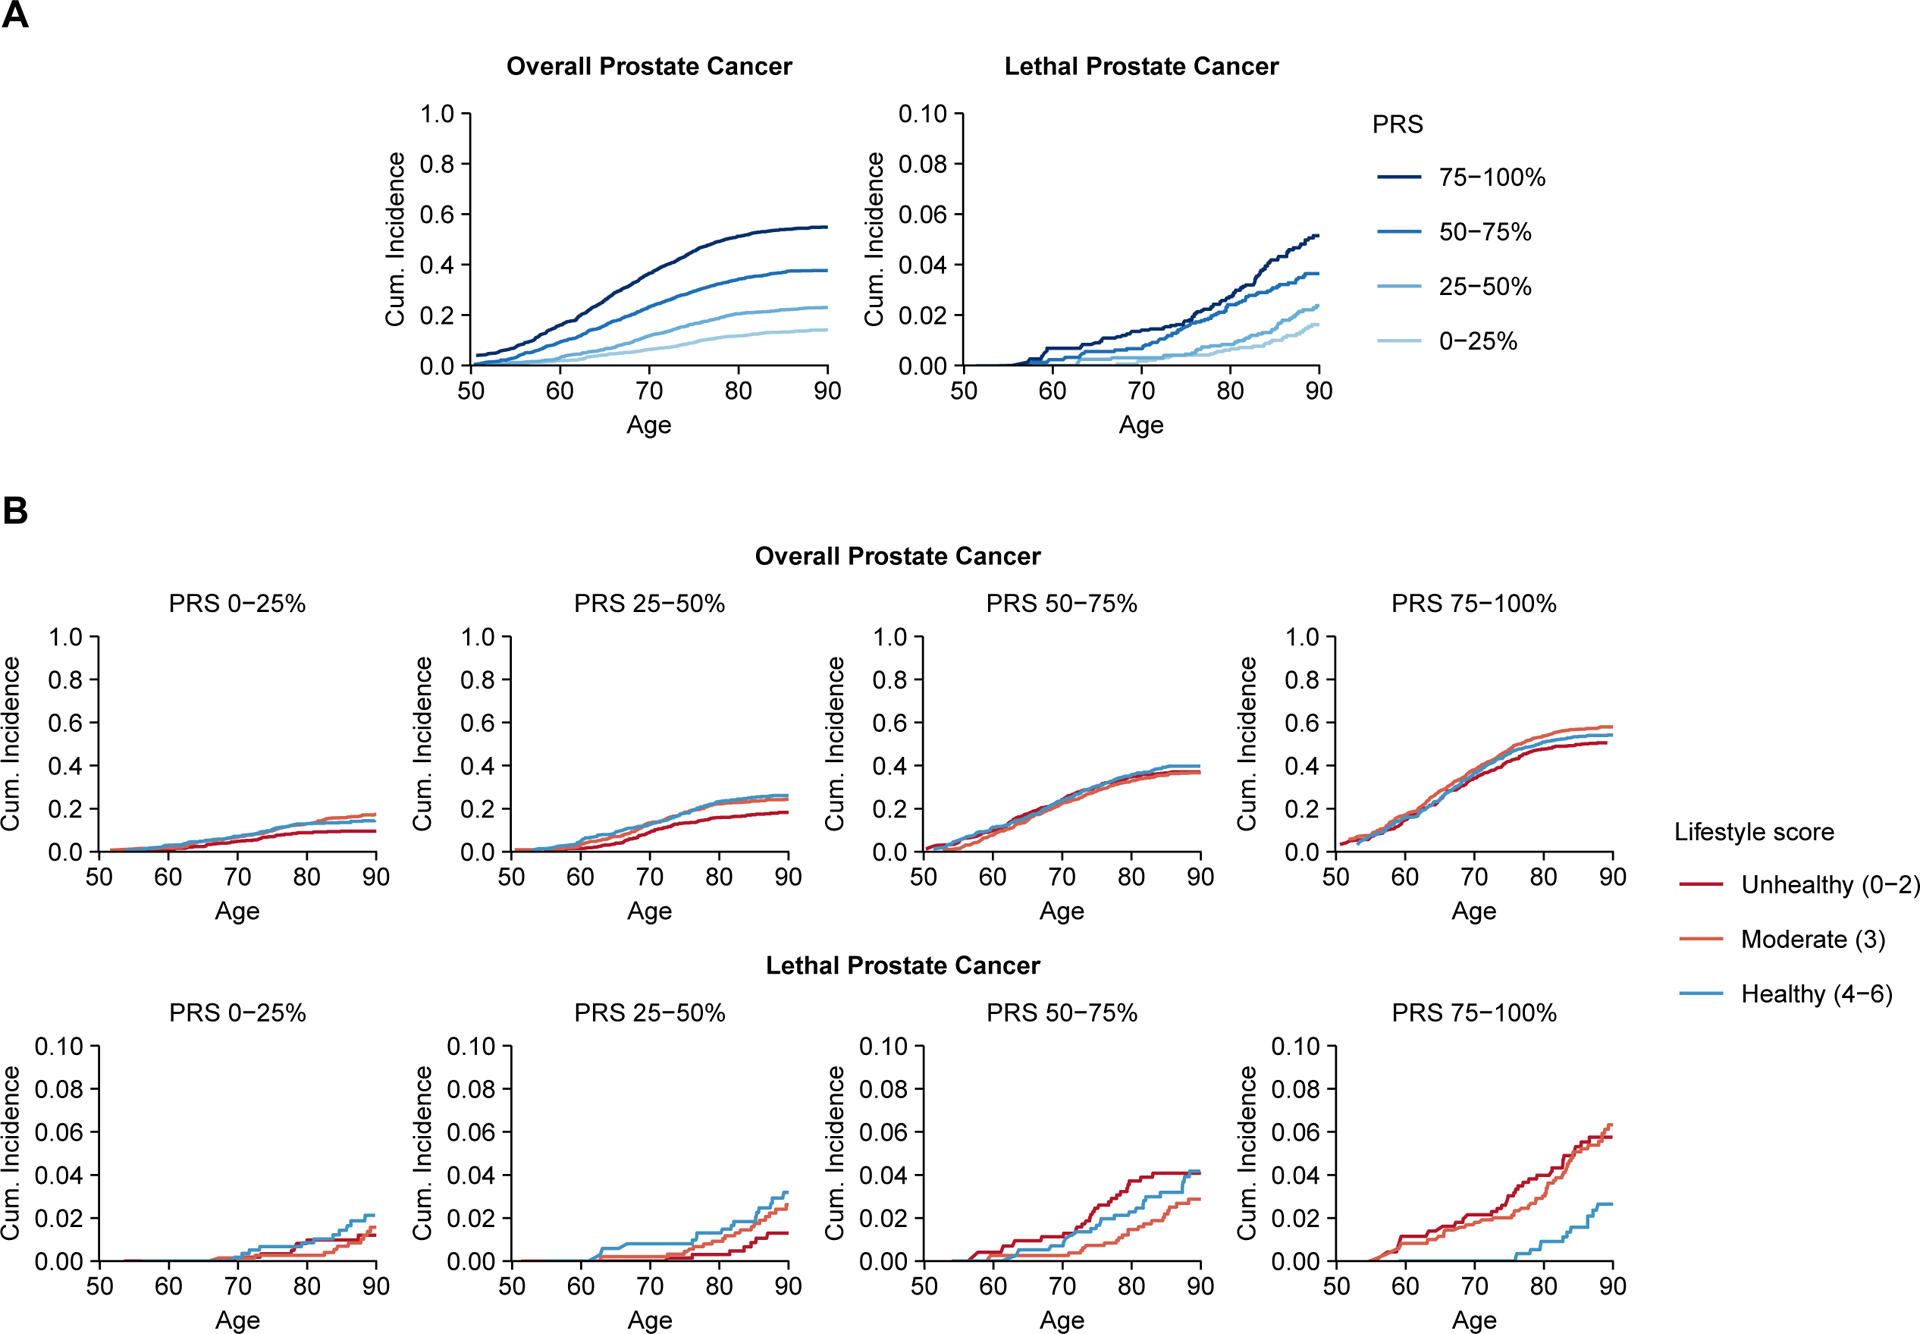
Lifetime risk of overall and lethal prostate cancer in the Health Professionals Follow-up Study: (A) the lifetime risk according to polygenic risk score (PRS) alone and (B) the lifetime risk according to joint categories of PRS and healthy lifestyle score at study entry. Lifetime risks were estimated using the unweighted cohort.
In joint analyses, men in the top PRS quartile with a healthy lifestyle had a 45% decreased rate (pooled HR, 0.55, 95% CI, 0.36–0.86) of lethal prostate cancer compared with men in the top PRS quartile with an unhealthy lifestyle (Table 3 and Supplementary Figs. 1 and 2). In HPFS, this difference translated to a lifetime risk of lethal disease in the top PRS quartile of 1.6% (95% CI, 0.8–3.1%) among men with a healthy lifestyle and 5.3% (95% CI, 3.6–7.8%) for those with an unhealthy lifestyle (Fig. 1B and Supplementary Table 2). A healthy lifestyle was not associated with a reduced rate of overall prostate cancer within any of the PRS quartiles (Table 3).
Table 3.
Hazard ratios and 95% confidence intervals for the joint association of polygenic risk score and healthy lifestyle score with overall and lethal prostate cancer in the Health Professionals Follow-up Study and the Physicians’ Health Study.
| PRS quartile | HPFS (n = 10 443) | PHS (n = 1 968) | Pooled (n = 12 411) | ||||||
|---|---|---|---|---|---|---|---|---|---|
| Healthy lifestyle score | Healthy lifestyle score | Healthy lifestyle score | |||||||
| Unhealthy (0–2) | Moderate (3) | Healthy (4–6) | Unhealthy (0–2) | Moderate (3) | Healthy (4–6) | Unhealthy (0–2) | Moderate (3) | Healthy (4–6) | |
| HR (95% CI)a | HR (95% CI)a | HR (95% CI)a | HR (95% CI)b | HR (95% CI)b | HR (95% CI)b | HR (95% CI) | HR (95% CI) | HR (95% CI) | |
| Overall prostate cancer | |||||||||
| 75–100% | 1 (Ref.) | 0.97 (0.82–1.16) | 1.01 (0.84–1.22) | 1 (Ref.) | 0.94 (0.57–1.54) | 0.99 (0.60–1.65) | 1 (Ref.) | 0.97 (0.83–1.14) | 1.01 (0.85–1.20) |
| 50–75% | 0.52 (0.41–0.65) | 0.53 (0.44–0.65) | 0.62 (0.50–0.75) | 0.36 (0.19–0.67) | 0.45 (0.27–0.75) | 0.48 (0.28–0.81) | 0.50 (0.40–0.61) | 0.52 (0.44–0.63) | 0.60 (0.49–0.72) |
| 25–50% | 0.28 (0.21–0.36) | 0.31 (0.25–0.38) | 0.37 (0.29–0.46) | 0.18 (0.09–0.38) | 0.33 (0.20–0.57) | 0.28 (0.17–0.48) | 0.26 (0.21–0.34) | 0.31 (0.25–0.38) | 0.35 (0.28–0.43) |
| 0–25% | 0.16 (0.11–0.22) | 0.18 (0.13–0.23) | 0.22 (0.17–0.28) | 0.11 (0.05–0.24) | 0.16 (0.09–0.28) | 0.15 (0.08–0.26) | 0.15 (0.11–0.20) | 0.17 (0.14–0.22) | 0.20 (0.16–0.26) |
| Lethal prostate cancer | |||||||||
| 75–100% | 1 (Ref.) | 0.62 (0.39–0.98) | 0.52 (0.30–0.89) | 1 (Ref.) | 0.60 (0.28–1.31) | 0.63 (0.29–1.34) | 1 (Ref.) | 0.61 (0.41–0.91) | 0.55 (0.36–0.86) |
| 50–75% | 0.51 (0.29–0.89) | 0.47 (0.29–0.76) | 0.45 (0.26–0.78) | 0.45 (0.18–1.17) | 0.33 (0.15–0.73) | 0.31 (0.14–0.69) | 0.49 (0.31–0.80) | 0.42 (0.28–0.64) | 0.40 (0.25–0.63) |
| 25–50% | 0.27 (0.14–0.54) | 0.34 (0.20–0.57) | 0.23 (0.12–0.45) | 0.31 (0.12–0.85) | 0.26 (0.12–0.58) | 0.17 (0.08–0.40) | 0.28 (0.16–0.50) | 0.31 (0.20–0.49) | 0.20 (0.12–0.35) |
| 0–25% | 0.14 (0.06–0.33) | 0.21 (0.11–0.38) | 0.20 (0.10–0.40) | 0.10 (0.03–0.37) | 0.12 (0.05–0.31) | 0.13 (0.06–0.31) | 0.12 (0.06–0.26) | 0.18 (0.11–0.29) | 0.17 (0.10–0.29) |
Abbreviations: CI, confidence interval; HPFS, Health Professionals Follow-up Study; HR, hazard ratio; PHS, Physicians’ Health Study; PRS, polygenic risk score.
HPFS: Inverse probability weighted Cox regression models, stratified by birth cohort and adjusted for age (underlying time-scale), calendar period of inclusion, genetic ancestry (PC1-PC3), lagged PSA screening history, history of other cancers, history of diabetes, current aspirin use, current statin use, and total energy intake.
PHS: Inverse probability weighted Cox regression models, stratified by birth cohort and adjusted for age (underlying time-scale), genetic ancestry (PC1-PC3), history of other cancers, history of diabetes and randomization status.
A sensitivity analysis on the unweighted cohorts showed similar results, as did the case-only analysis adjusting for prostate cancer–specific factors and the analysis of prostate cancer death only (Supplementary Tables 3–5). Of note, while the PRS itself was not a risk factor for lethal disease among prostate cancer cases, the relative risk reduction associated with a healthy lifestyle was largest among cases in the top PRS quartile (HR, 0.51; 95% CI, 0.28–0.92). A healthy lifestyle was associated with a reduced rate of non–prostate cancer death in all PRS quartiles (Supplementary Table 5).
In HPFS, the individual lifestyle components most strongly associated with a reduced rate of lethal disease among men in the top PRS quartile were a healthy weight (HR, 0.45; 95% CI, 0.27–0.76) and high vigorous physical activity (HR, 0.50; 95% CI, 0.27–0.95; Table 4). In PHS, which was limited by a small number of events in certain categories and with slightly different definitions, never smoking or quitting 10 yr ago was most strongly associated with a reduced risk of lethal disease (HR, 0.48; 95% CI, 0.22–1.04) among men in the top PRS quartile (Supplementary Table 6).
Table 4.
Hazard ratios and 95% confidence intervals for the joint association of polygenic risk score and the individual components of the healthy lifestyle score with lethal prostate cancer in the Health Professionals Follow-up Study.
| PRS quartile | HPFS (n = 10 443) | |||
|---|---|---|---|---|
| No. of events / Person-years of follow-up | HR (95% CI)a | No. of events / Person-years of follow-up | HR (95% CI)a | |
| Lethal prostate cancer | ||||
| Obese | Not Obese | |||
| 75–100% | 19/11977 | 1 (Ref.) | 78/90664 | 0.45 (0.27–0.76) |
| 50–75% | 9/15501 | 0.45 (0.20–1.01) | 66/98712 | 0.34 (0.19–0.58) |
| 25–50% | 6/16248 | 0.28 (0.11–0.73) | 41/106046 | 0.20 (0.11–0.35) |
| 0–25% | 6/14720 | 0.28 (0.11–0.71) | 26/113014 | 0.12 (0.07–0.23) |
| Smoke: Current or quit <10 yr | Smoke: Never or quit ≥10 yr | |||
| 75–100% | 12/11109 | 1 (Ref.) | 85/91532 | 0.67 (0.36–1.25) |
| 50–75% | 7/12743 | 0.47 (0.18–1.20) | 68/101470 | 0.49 (0.26–0.91) |
| 25–50% | 5/14600 | 0.33 (0.12–0.95) | 42/107694 | 0.29 (0.15–0.55) |
| 0–25% | 2/13267 | 0.14 (0.03–0.62) | 30/114467 | 0.20 (0.10–0.39) |
| Low/moderate vigorous physical activity | High vigorous physical activity | |||
| 75–100% | 86/75793 | 1 (Ref.) | 11/26848 | 0.50 (0.27–0.95) |
| 50–75% | 64/86869 | 0.66 (0.47–0.92) | 11/27344 | 0.46 (0.24–0.87) |
| 25–50% | 40/92066 | 0.40 (0.27–0.58) | 7/30228 | 0.28 (0.13–0.61) |
| 0–25% | 30/92957 | 0.29 (0.19–0.45) | 2/34777 | 0.07 (0.02–0.30) |
| Low/moderate tomato intake | High tomato intake | |||
| 75–100% | 81/80960 | 1 (Ref.) | 16/21681 | 0.86 (0.50–1.49) |
| 50–75% | 61/89590 | 0.67 (0.48–0.95) | 14/24622 | 0.68 (0.37–1.23) |
| 25–50% | 37/96322 | 0.40 (0.27–0.59) | 10/25972 | 0.43 (0.22–0.84) |
| 0–25% | 24/100524 | 0.25 (0.16–0.39) | 8/27210 | 0.38 (0.18–0.80) |
| High/moderate processed meat intake | Low processed meat intake | |||
| 75–100% | 30/25781 | 1 (Ref.) | 67/76860 | 0.84 (0.53–1.31) |
| 50–75% | 18/28695 | 0.52 (0.29–0.96) | 57/85517 | 0.64 (0.40–1.01) |
| 25–50% | 10/27586 | 0.29 (0.14–0.60) | 37/94708 | 0.40 (0.24–0.66) |
| 0–25% | 6/31619 | 0.17 (0.07–0.41) | 26/96115 | 0.27 (0.16–0.46) |
| Low/moderate fish intake | High fatty fish intake | |||
| 75–100% | 84/90677 | 1 (Ref.) | 13/11964 | 1.05 (0.58–1.91) |
| 50–75% | 65/100000 | 0.69 (0.49–0.97) | 10/14213 | 0.71 (0.36–1.40) |
| 25–50% | 41/106186 | 0.43 (0.30–0.63) | 6/16108 | 0.37 (0.16–0.86) |
| 0–25% | 23/108869 | 0.24 (0.15–0.38) | 9/18865 | 0.50 (0.25–1.01) |
Abbreviations: CI, confidence interval; HPFS, Health Professionals Follow-up Study; HR, hazard ratio; PRS, polygenic risk score.
Inverse probability weighted Cox regression models, stratified by birth cohort and adjusted for age (underlying time-scale), calendar period of inclusion, genetic ancestry (PC1-PC3), lagged PSA screening history, history of other cancers, history of diabetes, current aspirin use, current statin use, total energy intake, and each individual component.
Discussion
In this analysis based on two prospective cohort studies with nearly 3 decades of follow-up, among men at a high genetic risk, those adhering to a healthy lifestyle had a 45% reduction in the risk of lethal prostate cancer compared to those not adhering to a healthy lifestyle. This translated to a clinically significant reduction in the lifetime risk of lethal disease. We did not observe a reduction in the risk of overall prostate cancer by a healthy lifestyle across genetic risk groups, consistent with previous research. This suggests that while the inherited risk of prostate cancer initiation may not be modifiable through lifestyle behaviors in mid- and late adult life, tumor promotion and progression among those at the highest genetic risk may be.
Previous studies investigating the interplay between lifestyle and genetic factors on the risk of prostate cancer have been limited by a small number of genetic markers and without data on prostate cancer prognosis.25,26 Loeb et al. reported that among men at an increased genetic risk defined based on 20 risk variants, high vegetable intake was associated with a lower risk of prostate cancer.25 However, this association was found for nonadvanced prostate cancer only, and it is still unclear whether high vegetable intake can influence prostate cancer mortality in men at increased genetic risk. In a different approach, Lindstrom et al. found no evidence of a gene-environment interaction for the risk of overall prostate cancer.26 Despite the limited data integrating lifestyle and genetic factors, our findings are supported by a large number of studies demonstrating that men with a healthy lifestyle have a reduced risk of prostate cancer progression and death.7,27–30
Our analysis suggests that men at the highest genetic risk for prostate cancer benefit the most from adhering to a healthy lifestyle. The benefits may extend to men at a lower genetic risk, but such differences could be more difficult to detect. The PRS strongly discriminates prostate cancer risk, and as a result, many lethal cases occurred in the highest genetic risk group. Competing events may potentially mask a benefit when the risk of dying from prostate cancer is low since men with an unhealthy lifestyle may die due to other diseases before manifestation of lethal prostate cancer. Nevertheless, as shown for non–prostate cancer mortality in this study and in numerous other studies,31,32 recommendations for a healthy lifestyle and diet should be universal. It may, however, be a particularly sensible approach to target lifestyle modifications to those at a high genetic risk, in particular since knowledge about an increased risk could motivate a long-lasting behavioral change.
We used a simple, previously developed healthy lifestyle score for lethal prostate including six lifestyle behaviors.10 Our analysis suggests that also adhering to a few of these healthy behaviors could have benefits for men at an increased genetic risk. Of the individual components, having a healthy weight, being physically active, and not smoking were most strongly associated with a decreased risk of lethal disease. These factors have also been most consistently reported as protective factors for prostate cancer progression in general.8 Although intake of specific dietary components may influence the risk of lethal disease, an overall healthy diet is likely important because of its influences on body weight.
Although our analysis was limited to men with available genotyped data, there was no indication of a selection bias. The HRs for the healthy lifestyle score alone were similar to those reported previously10 as were the estimates for the PRS.2,3 The over-representation of prostate cancer cases did not affect the estimation of lifetime risk for lethal disease, which was generally similar to the lifetime risk of prostate cancer death reported for American men (2.4%).33 Lastly, estimates from unweighted Cox models were similar to estimates from IPW Cox models taking the potential selection bias into account.
Our study was limited by its observational design. While randomized trials of specific diets or supplements have been performed,34,35 complex lifestyle patterns cannot feasibly be assigned randomly and maintained over the decades of follow-up needed to detect effects on prostate cancer development and progression. The observed reductions in lethal prostate cancer may have been caused partially by other factors that go along with the elements of the healthy lifestyle score, or are a consequence of implementing such a lifestyle, including more frequent PSA screening or a better diagnostic workup or treatment. Nevertheless, our analyses included a cohort of men with good access to health care and an overall high PSA screening intensity (over 90% of men in HPFS had a PSA test by 2008)36 and the generally small differences between the lifestyle groups in measured characteristics related to health care use were controlled for. Only relatively strong confounding could fully explain away the observed association for lethal disease among men in the top PRS quartile (E-value of 3.0).37,38 Our study was further limited to White men with high socioeconomic status and with a generally healthier lifestyle profile than the broader US population,39 and validation studies in other populations and ethnicities are needed. Despite these limitations, our analysis represents the largest analysis to date on the role of modifiable factors in the genetic risk of prostate cancer, with application of a multiancestry PRS that can capture the genetic risk of prostate cancer in diverse populations.
Conclusions
Our findings suggest that a genetic predisposition for prostate cancer is not deterministic for a poor cancer outcome. Men with a high PRS adhering to a healthy lifestyle had a substantially lower risk of lethal prostate cancer. While validation studies in other populations are needed, clinical recommendations to men to maintain or adopt a healthy lifestyle may provide a way to offset the genetic risk of lethal prostate cancer.
Supplementary Material
Acknowledgments
We would like to thank the following state cancer registries for their help: AL, AZ, AR, CA, CO, CT, DE, FL, GA, ID, IL, IN, IA, KY, LA, ME, MD, MA, MI, NE, NH, NJ, NY, NC, ND, OH, OK, OR, PA, RI, SC, TN, TX, VA, WA, WY. We are also grateful to the Health Professionals Follow-up Study participants and research staff.
Funding/Support and role of the sponsor
Research relating to this publication was funded by the National Cancer Institute at the National Institutes of Health (grant number U01 CA167552), the Prostate Cancer Foundation, the Swedish Society for Medical Research, the Swedish Cancer Society, the DiNovi Family Foundation, William Casey, and the Helen Diller Family Chair in Population Science for Urologic Cancer (UCSF). This project includes OncoArray data from the PRACTICAL consortium (full description of funding and acknowledgements in the Supplementary material). The authors assume full responsibility for analyses and interpretation of these data. The content is solely the responsibility of the authors and does not necessarily represent the official views of the National Institutes of Health. The sponsors of the study had no role in study design, data collection, data analysis, data interpretation, or writing of the manuscript.
Data sharing
The data analyzed in this study are not publicly available due to restrictions set by the data holder but may be made available for collaborating researchers upon request.
References
- 1.Hjelmborg JB, Scheike T, Holst K, et al. The heritability of prostate cancer in the Nordic Twin Study of Cancer. Cancer Epidemiol Biomarkers Prev. 2014;23(11):2303–2310. [DOI] [PMC free article] [PubMed] [Google Scholar]
- 2.Conti DV, Darst BF, Moss LC, et al. Trans-ancestry genome-wide association meta-analysis of prostate cancer identifies new susceptibility loci and informs genetic risk prediction. Nat Genet. 2021;53(1):65–75. [DOI] [PMC free article] [PubMed] [Google Scholar]
- 3.Plym A, Penney KL, Kalia S, et al. Evaluation of a Multiethnic Polygenic Risk Score Model for Prostate Cancer. J Natl Cancer Inst. 2021. [DOI] [PMC free article] [PubMed] [Google Scholar]
- 4.Seibert TM, Fan CC, Wang Y, et al. Polygenic hazard score to guide screening for aggressive prostate cancer: development and validation in large scale cohorts. BMJ. 2018;360:j5757. [DOI] [PMC free article] [PubMed] [Google Scholar]
- 5.Benke IN, Leitzmann MF, Behrens G, Schmid D. Physical activity in relation to risk of prostate cancer: a systematic review and meta-analysis. Ann Oncol. 2018;29(5):1154–1179. [DOI] [PubMed] [Google Scholar]
- 6.Szymanski KM, Wheeler DC, Mucci LA. Fish consumption and prostate cancer risk: a review and meta-analysis. Am J Clin Nutr. 2010;92(5):1223–1233. [DOI] [PubMed] [Google Scholar]
- 7.Wang Y, Jacobs EJ, Newton CC, McCullough ML. Lycopene, tomato products and prostate cancer-specific mortality among men diagnosed with nonmetastatic prostate cancer in the Cancer Prevention Study II Nutrition Cohort. Int J Cancer. 2016;138(12):2846–2855. [DOI] [PubMed] [Google Scholar]
- 8.Wilson KM, Mucci LA. Diet and Lifestyle in Prostate Cancer. Adv Exp Med Biol. 2019;1210:1–27. [DOI] [PubMed] [Google Scholar]
- 9.Zu K, Mucci L, Rosner BA, et al. Dietary lycopene, angiogenesis, and prostate cancer: a prospective study in the prostate-specific antigen era. J Natl Cancer Inst. 2014;106(2):djt430. [DOI] [PMC free article] [PubMed] [Google Scholar]
- 10.Kenfield SA, Batista JL, Jahn JL, et al. Development and Application of a Lifestyle Score for Prevention of Lethal Prostate Cancer. J Natl Cancer Inst. 2016;108(3). [DOI] [PMC free article] [PubMed] [Google Scholar]
- 11.Friedenreich CM, Wang Q, Neilson HK, Kopciuk KA, McGregor SE, Courneya KS. Physical Activity and Survival After Prostate Cancer. Eur Urol. 2016;70(4):576–585. [DOI] [PubMed] [Google Scholar]
- 12.Arthur RS, Wang T, Xue X, Kamensky V, Rohan TE. Genetic Factors, Adherence to Healthy Lifestyle Behavior, and Risk of Invasive Breast Cancer Among Women in the UK Biobank. J Natl Cancer Inst. 2020;112(9):893–901. [DOI] [PMC free article] [PubMed] [Google Scholar]
- 13.Khera AV, Emdin CA, Drake I, et al. Genetic Risk, Adherence to a Healthy Lifestyle, and Coronary Disease. N Engl J Med. 2016;375(24):2349–2358. [DOI] [PMC free article] [PubMed] [Google Scholar]
- 14.Wang X, O’Connell K, Jeon J, et al. Combined effect of modifiable and non-modifiable risk factors for colorectal cancer risk in a pooled analysis of 11 population-based studies. BMJ Open Gastroenterol. 2019;6(1):e000339. [DOI] [PMC free article] [PubMed] [Google Scholar]
- 15.Lourida I, Hannon E, Littlejohns TJ, et al. Association of Lifestyle and Genetic Risk With Incidence of Dementia. JAMA. 2019;322(5):430–437. [DOI] [PMC free article] [PubMed] [Google Scholar]
- 16.Rimm EB, Giovannucci EL, Willett WC, et al. Prospective study of alcohol consumption and risk of coronary disease in men. Lancet. 1991;338(8765):464–468. [DOI] [PubMed] [Google Scholar]
- 17.Hennekens CH, Eberlein K. A randomized trial of aspirin and beta-carotene among U.S. physicians. Prev Med. 1985;14(2):165–168. [DOI] [PubMed] [Google Scholar]
- 18.Lindstrom S, Loomis S, Turman C, et al. A comprehensive survey of genetic variation in 20,691 subjects from four large cohorts. PLoS One. 2017;12(3):e0173997. [DOI] [PMC free article] [PubMed] [Google Scholar]
- 19.Schumacher FR, Al Olama AA, Berndt SI, et al. Association analyses of more than 140,000 men identify 63 new prostate cancer susceptibility loci. Nat Genet. 2018;50(7):928–936. [DOI] [PMC free article] [PubMed] [Google Scholar]
- 20.Chasan-Taber S, Rimm EB, Stampfer MJ, et al. Reproducibility and validity of a self-administered physical activity questionnaire for male health professionals. Epidemiology. 1996;7(1):81–86. [DOI] [PubMed] [Google Scholar]
- 21.Rimm EB, Giovannucci EL, Stampfer MJ, Colditz GA, Litin LB, Willett WC. Reproducibility and validity of an expanded self-administered semiquantitative food frequency questionnaire among male health professionals. Am J Epidemiol. 1992;135(10):1114–1126; discussion 1127–1136. [DOI] [PubMed] [Google Scholar]
- 22.Delcoigne B, Hagenbuch N, Schelin ME, et al. Feasibility of reusing time-matched controls in an overlapping cohort. Stat Methods Med Res. 2018;27(6):1818–1829. [DOI] [PubMed] [Google Scholar]
- 23.Stoer NC, Meyer HE, Samuelsen SO. Reuse of controls in nested case-control studies. Epidemiology. 2014;25(2):315–317. [DOI] [PubMed] [Google Scholar]
- 24.Allignol A, Schumacher M, Beyersmann J. Empirical transition matrix of multi-state models: The etm package. J Stat Softw. 2011;38(4):1–15. [Google Scholar]
- 25.Loeb S, Peskoe SB, Joshu CE, et al. Do environmental factors modify the genetic risk of prostate cancer? Cancer Epidemiol Biomarkers Prev. 2015;24(1):213–220. [DOI] [PMC free article] [PubMed] [Google Scholar]
- 26.Lindstrom S, Schumacher F, Siddiq A, et al. Characterizing associations and SNP-environment interactions for GWAS-identified prostate cancer risk markers--results from BPC3. PLoS One. 2011;6(2):e17142. [DOI] [PMC free article] [PubMed] [Google Scholar]
- 27.Bonn SE, Wiklund F, Sjolander A, et al. Body mass index and weight change in men with prostate cancer: progression and mortality. Cancer Causes Control. 2014;25(8):933–943. [DOI] [PubMed] [Google Scholar]
- 28.Patel AV, Rodriguez C, Jacobs EJ, Solomon L, Thun MJ, Calle EE. Recreational physical activity and risk of prostate cancer in a large cohort of U.S. men. Cancer Epidemiol Biomarkers Prev. 2005;14(1):275–279. [PubMed] [Google Scholar]
- 29.Rohrmann S, Linseisen J, Allen N, et al. Smoking and the risk of prostate cancer in the European Prospective Investigation into Cancer and Nutrition. Br J Cancer. 2013;108(3):708–714. [DOI] [PMC free article] [PubMed] [Google Scholar]
- 30.Perez-Cornago A, Appleby PN, Pischon T, et al. Tall height and obesity are associated with an increased risk of aggressive prostate cancer: results from the EPIC cohort study. BMC Med. 2017;15(1):115. [DOI] [PMC free article] [PubMed] [Google Scholar]
- 31.Li Y, Pan A, Wang DD, et al. Impact of Healthy Lifestyle Factors on Life Expectancies in the US Population. Circulation. 2018;138(4):345–355. [DOI] [PMC free article] [PubMed] [Google Scholar]
- 32.Zhang YB, Pan XF, Chen J, et al. Combined lifestyle factors, all-cause mortality and cardiovascular disease: a systematic review and meta-analysis of prospective cohort studies. J Epidemiol Community Health. 2021;75(1):92–99. [DOI] [PubMed] [Google Scholar]
- 33.National Cancer Institute. Cancer stat facts: prostate cancer. https://seer.cancer.gov/statfacts/html/prost.html. Accessed August 30, 2021.
- 34.Parsons JK, Zahrieh D, Mohler JL, et al. Effect of a Behavioral Intervention to Increase Vegetable Consumption on Cancer Progression Among Men With Early-Stage Prostate Cancer: The MEAL Randomized Clinical Trial. JAMA. 2020;323(2):140–148. [DOI] [PMC free article] [PubMed] [Google Scholar]
- 35.Klein EA, Thompson IM Jr., Tangen CM, et al. Vitamin E and the risk of prostate cancer: the Selenium and Vitamin E Cancer Prevention Trial (SELECT). JAMA. 2011;306(14):1549–1556. [DOI] [PMC free article] [PubMed] [Google Scholar]
- 36.Rider JR, Wilson KM, Sinnott JA, Kelly RS, Mucci LA, Giovannucci EL. Ejaculation Frequency and Risk of Prostate Cancer: Updated Results with an Additional Decade of Follow-up. Eur Urol. 2016;70(6):974–982. [DOI] [PMC free article] [PubMed] [Google Scholar]
- 37.Mathur MB, Ding P, Riddell CA, VanderWeele TJ. Web Site and R Package for Computing E-values. Epidemiology. 2018;29(5):e45–e47. [DOI] [PMC free article] [PubMed] [Google Scholar]
- 38.VanderWeele TJ, Ding P. Sensitivity Analysis in Observational Research: Introducing the E-Value. Ann Intern Med. 2017;167(4):268–274. [DOI] [PubMed] [Google Scholar]
- 39.Song M, Giovannucci E. Preventable Incidence and Mortality of Carcinoma Associated With Lifestyle Factors Among White Adults in the United States. JAMA Oncol. 2016;2(9):1154–1161. [DOI] [PMC free article] [PubMed] [Google Scholar]
Associated Data
This section collects any data citations, data availability statements, or supplementary materials included in this article.
Supplementary Materials
Data Availability Statement
The data analyzed in this study are not publicly available due to restrictions set by the data holder but may be made available for collaborating researchers upon request.