Abstract
Accurate quantification of nucleic acids by competitive (RT)–PCR requires a valid internal standard, a reference for data normalization and an adequate mathematical model for data analysis. We report here an effective procedure for the generation of homologous RNA internal standards and a strategy for synthesizing and using a reference target RNA in quantification of absolute amounts of nucleic acids. Further, a new mathematical model describing the general kinetic features of competitive PCR was developed. The model extends the validity of quantitative competitive (RT)–PCR beyond the exponential phase. The new method eliminates the errors arising from different amplification efficiencies of the co-amplified sequences and from heteroduplex formation in the system. The high accuracy (relative error <2%) is comparable to the recently developed real time detection 5′-nuclease PCR. Also, corresponding computer software has been devised for practical data analysis.
INTRODUCTION
The intensive development of technologies for quantification of nucleic acids over the last decade reflects its importance in diagnostics and in biomedical research. Despite the fact that a number of methods are available for this purpose, such as northern blotting, the RNase protection assay (RPA), quantitative competitive reverse transcription–PCR [QC (RT)–PCR] (1) and real time detection 5′-nuclease (RTDN) PCR (2,3), the procedures involved are rather cumbersome. Each of these methods has its advantages as well as disadvantages. In hybridization methods like northern blotting and RPA, the reaction kinetics are easier to determine, but the sensitivity is not sufficient for most practical applications. In contrast, due to the amplifying effect, PCR-based methods are more sensitive. However, the kinetics of PCR are more complex and hence the use of PCR as a quantitative method is not straightforward.
Generally, a quantitative (RT)–PCR method consists of four steps: generation of internal standards, (RT)–PCR, detection of products and data analysis.
An internal standard is a nucleic acid fragment of closely similar sequence to the amplified fragment of a natural target of interest, but differs from it in size. Internal standards are commonly described by different terms such as ‘competitor’ or ‘mimic’; the term ‘mimic’ will be used in this report. Recently, RNA mimics have been generated by PCR-assisted mutagenesis, which may involve searching for and testing a ‘spacer gene’ or the direct synthesis of the whole single-stranded (ss)DNA template, chemical synthesis of long overlapping primers, digestion with restriction enzymes and cloning the mutant DNA into a transfer vector (4–7). We propose a simpler and more effective strategy for generating homologous RNA mimics with an internal deletion. Our strategy is based on the combination of PCR–ligation–PCR (PLP) (8) to generate mutant DNA, with a PCR-assisted approach for adding a phage RNA polymerase promoter (9).
Until recently, quantification of target nucleic acids by QC (RT)–PCR was calibrated by reference to the amount of a defined mimic. Since PCR is highly sensitive, a small difference in physical properties of the target and its mimic results in a significant difference in their total amplification efficiency. Unless this difference is determined, QC (RT)–PCR is valid only for relative quantification (comparison of the nucleic acid levels between samples) but not for absolute quantification (determination of absolute amounts of nucleic acids) (10,11). Because RNA requires special handling and storage and is usually present in minute quantities, relative quantification is not the best choice for samples obtained from different sources or at different times. We have synthesized a target RNA identical to the amplified fragment of a natural target of interest. Such an identical target RNA can exactly simulate the natural target during (RT)–PCR and, hence, can serve as a reference for absolute quantification; here it will be referred to as a ‘reference target’.
The accuracy and reproducibility of QC (RT)–PCR have been the topic of long-lasting discussions (10–14). We have developed a mathematical model for data analysis which resolves this problem. Until recently, the generally accepted mathematical model in traditional QC (RT)–PCR and in RTDN PCR has been the linear model (linear regression) (15) on log–log or semi-log scales. The main difference between these two PCR systems is the time point at which the data are measured. In RTDN PCR each data point is collected as soon as it is detectable, i.e. within the exponential phase. In post-PCR analysis, all PCR products in a dilution series are analyzed at the same time point, when the reactions have reached a plateau (the saturated phase). Since the linear model assumes the data to be within the exponential phase (16), only RTDN PCR can yield accurate and reproducible results. However, RTDN PCR presents a new, more complex reaction system and requires new costly equipment. Our strategy is based on a new mathematical model describing the general kinetic features of competitive PCR which extends the validity of QC (RT)–PCR beyond the exponential phase. Also, corresponding computer software has been devised for practical data analysis.
MATERIALS AND METHODS
Generation of RNA mimics
Design and synthesis of DNA templates. Two primer pairs corresponding to different exons, P1 and P2 and P3 and P4, were chosen from the sequence for human interleukin 1β mRNA (GenBank accession no. M15330) by means of the computer program Oligo 4.0 (National Biosciences, Plymouth, MN) to amplify two PCR fragments, U (upstream) and D (downstream), separated by the intervening sequence M (Fig. 1). The upper primer P1 of fragment U was appended to an RNA polymerase promoter (SP6 or T7). Fragments U and D were phosphorylated by forward reaction with T4 polynucleotide kinase and then ligated together by T4 DNA ligase (Ambion, Austin, TX) to form a new fragment UD. Extended PCR was performed on the ligated UD fragment with upper primer P1 and lower primer P4. This PCR product UD, therefore, was deleted with respect to sequence M in comparison with the natural target. Since it had an RNA polymerase promoter attached in the correct sense, it would serve as a DNA template for transcription or could be used directly as a DNA mimic.
Figure 1.
DNA template design. Fragments UMD and UD correspond to the templates for the reference target and the mimic, respectively.
In vitro transcription. Transcription of the PCR product (UD) was carried out with the BIOTINscript kit (Ambion) followed by digestion with DNase I. The transcripts were subsequently purified on RNeasy columns (Qiagen, Chatsworth, CA), quantified by measuring OD260 in a GeneQuant spectrophotometer (Pharmacia, Cambridge, UK).
Generation of reference target RNA
The DNA template for this transcript is the fragment UMD (Fig. 1) which was generated from wild-type RNA by RT–PCR with upper primer P1 and lower primer P4. In vitro transcription was performed as described above.
Validation of RNA mimic and reference target RNA by competitive RT–PCR
Total RNA was isolated from the human promonocytic cell line U937 stimulated with 2 µg/ml phorbol myristate acetate (PMA) for 4 h by phenol chloroform extraction with RNA STAT-60 reagent (Tel-Test Inc., Friendswood, TX). The RNA mimic was diluted with yeast RNA (Ambion) in DEPC-treated H2O. Experiments were carried out with 50 and 100 ng of total RNA from U937 cells (or 0.1 × 10⁷ and 0.2 × 10⁷ copies of the reference target RNA) and the RNA mimic in a 2- or 1.5-fold dilution series. All RT and PCR were performed with reagents from the GeneAmp RNA PCR Kit (Perkin-Elmer, Foster City, CA) according to the producer’s protocols, with minor modifications. PCR products were detected by 2% agarose gel electrophoresis and ethidium bromide staining. The gel was scanned on a digital imaging system (AlphaImager 2000; Alpha Innotech) by the 1D-Multi (Line Densitometry) method. While making exposure adjustments, the color saturation was checked to ensure that the image was not over-saturated or under-exposed.
Mathematical modeling
The aim of a mathematical model for PCR is to describe the relationship between the input and output amounts of the amplified sequence in a PCR tube. The amplification of a single target can be described by the following equation:
T1 = T0·(1 + E1) 1
where T0 is the initial number of target molecules, T1 is the number after the first amplification cycle and E is the amplification efficiency of the target. The index refers to the cycle number. A similar amplification equation can be written for the corresponding mimic:
M1 = M0·(1 + F1) 2
The amplification efficiency is defined as the fraction of the sequence amplified per total input amount and represents the yield of the chemical reaction, which depends on the reaction rate. A reaction rate of any order can be described as a power function of the concentrations of reactants. Under constant reaction conditions E or F can be considered as a power function of only T0, or only M0, respectively. Thus, T1 and M1 are polynomial functions of T0 and M0, respectively. After n cycles, equations 1 and 2, subjected to n iterations, can be written as follows:
Tn = P(T0) 3
Mn = Q(M0) 4
where P and Q are polynomial functions of T0 and M0, respectively.
Since in this case the reaction conditions are functions of time, it would be inaccurate to quantify an initial amount of nucleic acid from the PCR product using equations 3 and 4. However, the requirement of constant reaction conditions can be fulfilled by means of competitive PCR, as shown in the next paragraph.
The rational model as a general mathematical model for competitive PCR. In a competitive PCR tube, the target and its mimic react at the same time and compete for the same reagents. The reaction rate depends on the collision frequency of the reacting molecules. Therefore, the amplification efficiency for a sequence depends on its relative abundance (referred to the other sequence) rather than on its absolute amount in the reaction system.
Let us define:
the input relative molar fraction of the target
1/X = T0/M0 = Y0 definition 1a
and of the mimic
X = M0/T0 = 1/Y0 definition 1b
the output relative molar fraction of the target after n cycles
Y = Tn/Mn = Yn definition 2a
and of the mimic
1/Y = Mn/Tn = 1/Yn definition 2b
In each QC (RT)–PCR experiment two dilution series are set up, where the time parameter (the number of cycles) is fixed and the master mixture used in all the reaction tubes came from the same source. In each dilution series the initial target concentration is constant while the initial concentration of mimic is the only independent variable. Therefore, the co-amplification of a target and its mimic can be described by equations similar to equations 3 and 4 as follows:
Y = Yn = P(Y0) = P(1/X) = G(X) 5
1/Y = 1/Yn = Q(1/Y0) = Q(X) 6
where P and Q are polynomials of the same degree and G is a rational function.
Both equations 5 and 6 describe the relationship between the input and output amounts of the co-amplified sequences by a function of only one unknown. However, since rational functions are in this case more suitable for data analysis, both graphically and numerically, than polynomial functions, equation 5 was chosen as a general mathematical model for QC (RT)–PCR. Note that the model assumes identical reaction conditions for the dilution series (i.e. the same RT–PCR master mixture), but does not refer to any specific reaction kinetics. Therefore, it is general and can be used beyond the linear range of PCR.
Figure 2a and b shows real examples, where PCR data were fitted to this model. Since T0 is a constant, the graph Y versus M0 is equivalent to equation 5.
Figure 2.
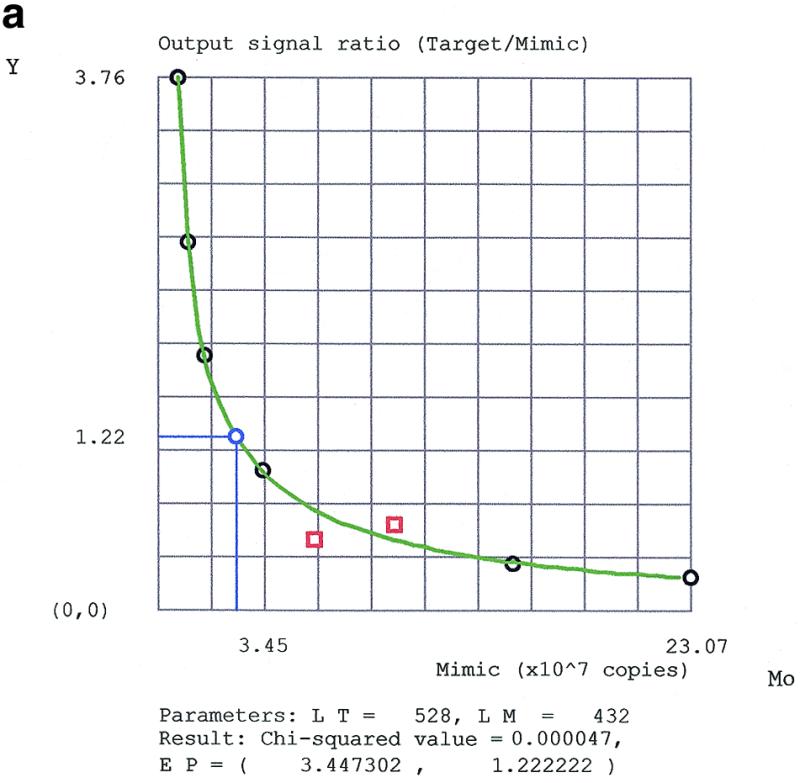
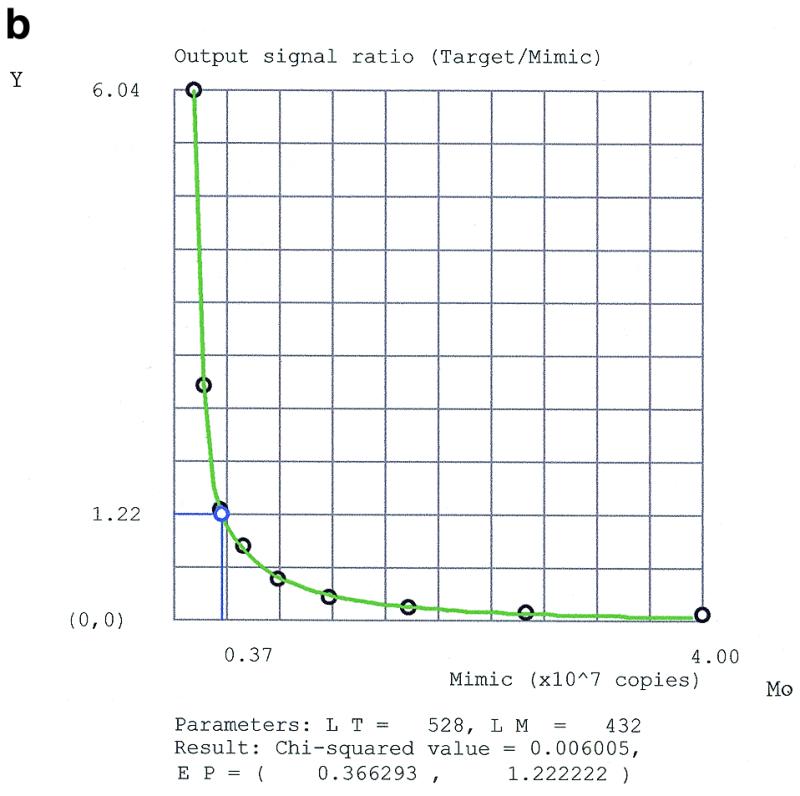
Fitting QC (RT)–PCR data for (a) the natural and (b) the reference targets by the program PCRFIT according to the rational model. M0 is the mimic input amount. Y is the ratio between the scanned densities of target and mimic bands. A black circle is a data point, a blue circle denotes the equimolar point EP, a red square is an outlier eliminated from input data. LT and LM are the lengths of the target and mimic amplified fragments, respectively.
As simple as it may seem, the model captures the essential nature of competitive PCR. The following illustrate how the mathematical characteristics of the model match the physical properties of the process.
(i) Monotonically decreasing function. In the dilution series, as the mimic concentration X increases, Y decreases.
(ii) Asymptotic convergence. This function has the x- and y-axes as asymptotes: as X approaches 0, Y approaches ∞, which means there is target without mimic; as X approaches ∞, Y approaches 0, there is mimic without target in the reaction.
(iii) The fixed point and the apparent equimolar point. If P = Q then equations 5 and 6 become:
Y = P(1/X) 7
1/Y = P(X) 8
For X = 1, equations 7 and 8 imply Y = 1/Y, i.e. Y = 1. Thus, the input equimolar point X = 1 is also the fixed point Y(1) = 1, whose physical meaning is as follows: if the target and the mimic have the same amplification efficiency, then equality of the input amounts (M0 = T0) implies equality of the output amounts (Mn = Tn).
If P ≠ Q, then the input equimolar point X = 1 is not a fixed point. The target and its mimic are co-amplified by reactions of the same order but their physical properties are different. Therefore, P and Q are polynomials of the same degree but with different coefficients and, hence, the target and mimic have different amplification efficiencies. Equality of the input amounts does not imply equality of the output amounts. However, since the function Y(X) decreases monotonically, equation 5 can be solved uniquely for X at the output equimolar point Y = 1. At this apparent equimolar point, where X = XEP and Y = 1, the input amounts of the target and the mimic are in a ratio that just compensates for the difference in their amplification efficiencies, yielding equal output amounts. In practice, since the detected output signal is proportional to the length of the molecules, a correction for the difference in length between target and mimic is taken into account. Let C be the ratio between the lengths of the target and the mimic amplified fragments (in our case C = 1.2). Then, graphically, the apparent equimolar point corresponds to the point of intersection of the line Y = Tn/Mn = C and the curve of equation 5, where M0 = MEP, XEP = MEP/T0.
The linear model and special cases. Although the linear model has been the only mathematical model used for data evaluation in competitive PCR so far, its nature has not been studied thoroughly. For the saturated phase of PCR, the model shows special behavior: its error is random (low reproducibility) and seems not to exceed a certain limit (~25%). The reason for this may be explored by the following analysis.
According to the linear model, the graph of equation 5 on a log–log scale
logY(X) = logG(X) 9
should be a straight line. Let us analyze two typical but special cases when the model can give correct results.
The exponential phase. During this phase of the reaction, the amplification efficiency is supposed to be constant over the whole range of X. Then, equation 5 has the simplified form:
Y = Yn = k·Y0 = k/X 10
where k is a constant. On a log–log scale equation 10 becomes:
logY(X) = logk – logX 11a
or
logY(M0) = logk + logT0 – logM0 11b
The corresponding graph, logY versus logM0, is a line with slope –1. The constant logk shifts the graph along the vertical axis. For relative quantification, this translation does not matter. The essential simplification here is the assumption of independence of the amplification efficiency from the relative abundance of the co-amplified sequences. In the saturated phase, when some of the reagents become limiting factors, co-amplification of the target and the mimic is of a competitive nature, this assumption is no longer valid.
The balanced model. Suppose that the target and the mimic have identical amplification efficiency, i.e. P = Q, then their co-amplification is described by equations 7 and 8. Let us also consider a special model: a dilution series ideally ‘skew-symmetrical’ around the equimolar point X = 1. This means that for each PCR tube with any input relative molar fraction X there is a corresponding PCR tube with input relative molar fraction 1/X. For example, tubes i and j, with Xi = 2 and Xj = 0.5, are skew-symmetrical points in the series. Since the relative abundance of the target and the mimic in one tube are reciprocal, the target has the same amplification efficiency as that of the mimic in the corresponding skew-symmetrical tube, rather than in the same tube, as previously thought. Equations 7 and 8 imply the relationship between the outputs at skew-symmetrical points:
Yi = P(1/Xi) = P(Xj) = 1/Yj 12
or on a log–log scale
logXi = –logXj 13a
and
logYi = –logYj 13b
Equations 13a and 13b mean that logY is a skew-symmetrical function of logX. In the exponential phase, the graph logY versus logX is a straight line with slope –1 and passes through the origin. In the saturated phase, the graph is no longer a line. However, the deviations of the function logY(X) from the ideal line caused by the saturation effect are skew-symmetrical with respect to the equimolar point. As a consequence of this, the regression line rotates around the equimolar point. One can view the rotation as being caused by two ‘forces’ acting in opposite directions on the ends of the line segment. If these ‘forces’ are equal, then the line would rotate around the equimolar point. The rotation does not displace the equimolar point and, hence, does not affect the result. The same result can be obtained even from an asymmetrical dilution series whose total deviations on both sides of the equimolar point are balanced (the balanced model). The skew-symmetrical model is actually a special case of the balanced model. Therefore, if the dilution series were fortuitously balanced around the equimolar point, the linear model would give a correct answer.
If P ≠ Q, then the regression line is also shifted as mentioned above. The center of rotation then would be the apparent equimolar point. In practice, for unbalanced dilution series, the center of rotation shifts away from the apparent equimolar point, causing an error of unpredictable nature. The fact that the non-linearity of the function logY(X) results partly in rotation instead of mere translation of the regression line explains why the error of the model is partly compromised.
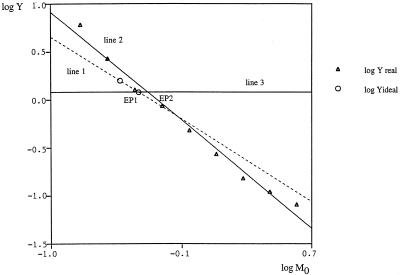
Figure 3 shows the translation and the rotation of the regression line in a real example.
Figure 3.
Fitting QC (RT)–PCR data (the same data as in Fig. 2b) by linear regression according to the linear model. Line 1, log10Yideal = –log10M0 – 0.355, r = 1.000, the ideal (hypothetical) regression line with a slope of –1, valid only for the exponential phase; line 2, log10Yreal = –1.325 log10M0 – 0.414, r = 0.993, the real regression line, translated and rotated due to the saturation effect; line 3, log10Y = logC = log101.2 = 0.079. The apparent equimolar points, EP1 and EP2, are the points of intersection of line 3 and the corresponding line (1 and 2, respectively). The estimation error is given by the distance between EP1 and EP2.
Applications of the mathematical model for QC (RT)–PCR
Relative quantification of nucleic acids. As implied from the rational model, under identical reaction conditions the apparent equimolar point XEP is a constant, typically not 1. For two samples with input target amounts (T0)1 and (T0)2 it holds that:
XEP = (MEP)1/(T0)1 = (MEP)2/(T0)2 14
or
R = (T0)1/(T0)2 = (MEP)1/(MEP)2 15
Equation 15 tells us that the ratio R between the input target amounts in two samples can be determined from the mimic amounts at the apparent equimolar points. This also explains why relative QC (RT)–PCR is theoretically always correct, regardless of the difference between the amplification efficiencies of the target and mimic. If the theoretical ratio Rth is known in advance then the relative error of the assay can be estimated:
ERR% = [(R – Rth)/Rth]·100 definition 3
Absolute quantification of nucleic acids. The strategy for absolute quantification arises directly from the relative quantification between a natural target and its identical reference target. The principle is as follows: two dilution series are set up in a QC (RT)–PCR experiment, one with a constant natural target amount (T0)1 and the other with a constant reference target amount (T0)2. Since (T0)2 is known in advance and the ratio R between (T0)1 and (T0)2 is determined as described above, (T0)1 can be calculated from equation 15.
Computer software for QC (RT)–PCR and practical data analysis
To implement our mathematical model we have modified a computer program for general least squares fit (maximum likelihood) (17). We show here how the computer program (PCRFIT 1.0, written in Microsoft Visual C++ 5.0 under Windows 95) can help to perform the following tasks:
• recognize and eliminate biased data points (outliers);
• evaluate the consistency of the data;
• estimate the amounts of nucleic acids by determining the apparent equimolar point.
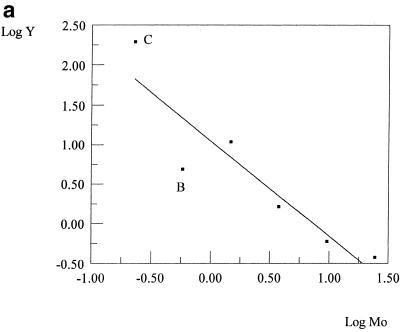
Competitive PCR may produce outliers that cannot be recognized either on the gel or by the graph of the linear model. Since the regression line is plotted between the data points, it can be hard to distinguish ‘good’ points from ‘bad’ (Fig. 4a). In contrast, when the data are plotted as Y versus M0, a hyperbola-like curve results. In most cases, one can readily discern the biased data points lying off the curve (Fig. 4b). PCRFIT can help to confirm this by returning the χ2 value. After eliminating the suspected outlier, the χ2 value should drop considerably.
Figure 4.
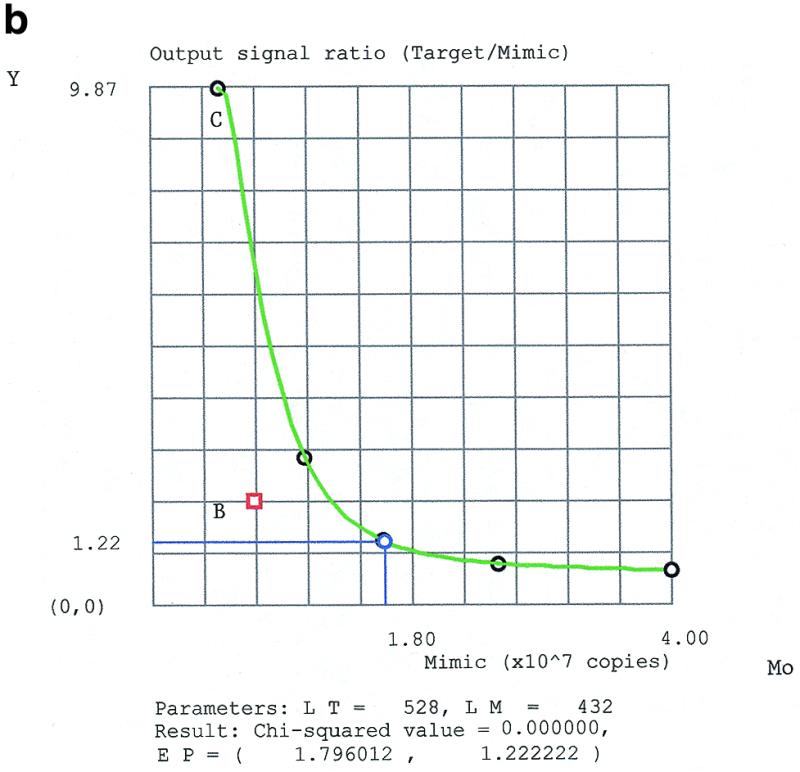
Graphical detection of outliers by the linear model on a natural logarithm scale (a), and by the rational model (b). Point B, a bad outlier, is clearly distinguishable from point C, a slight outlier, in (b) but not in (a).
The following is a brief summary of the interaction between the user and PCRFIT.
(i) The user provides input data which contains the values of the mimic dilution series M0, the corresponding measured values of Y (the ratio between the scanned densities of target and mimic bands), the lengths of the target and the mimic amplified fragments.
(ii) The program returns the graph, the apparent equimolar point EP (M0 = MEP and Y = Tn/Mn = C), the χ2 value and the list of the calculated values of Y dependent on M0 for as many points as the user wishes.
(iii) For typically accurate data, the graph is a smooth hyperbola-like curve (Fig. 2a and b) and the χ2 value is of the order of 10–3 or less (see Results and Discussion below). If the χ2 value is higher than the critical value (which is experimentally determined) and the graph appears atypical, then either some outliers are present or the entire data set is not sufficiently consistent. If some outliers occur, they can be easily located by inspecting the graph and eliminated by double-clicking on them (they can always be recovered by being double-clicked again). If the χ2 value does not drop under the critical value and the graph still looks unsatisfactory after elimination of the suspected outliers, then the experimentally biased data points are dominant. In this case, since the entire data set is inconsistent, checking for experimental errors is highly recommended.
(iv) The numerical result is the value M0 = MEP corresponding to the output equimolar point.
RESULTS AND DISCUSSION
QC (RT)–PCR assays were performed for the natural and the reference targets as shown in Figures 5 and 6, respectively. A 2-fold difference in target RNA levels was estimated and the results are summarized in Table 1. In experiments E#1 and E#2, the dilution ratio for the mimic was chosen to be 2, as usually recommended, and the corresponding number of PCR reactions in a dilution series was six. Since accurate estimation by the rational model requires at least five good data points, a dilution ratio of 1.5 was chosen for experiments E#4–E#7 and nine PCR reactions in the dilution series were performed (allowing for PCR failure or outliers).
Figure 5.
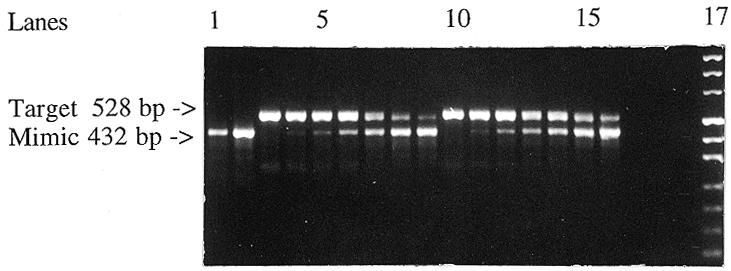
Detection of relative levels of human interleukin 1β mRNA by competitive RT–PCR. Lanes 1 and 2, mimic alone, 0.1 × 10⁷ and 6.4 × 10⁷ molecules, respectively; lanes 3 and 10, total U937 RNA alone, 50 and 100 ng, respectively; lanes 4–9, the first series containing a constant 50 ng of total U937 RNA with the mimic in 2-fold dilutions from 0.1 × 10⁷ to 3.2 × 10⁷ molecules; lanes 11–16, the second series containing a constant 100 ng of total U937 RNA with the mimic in 2-fold dilutions from 0.2 × 10⁷ to 6.4 × 10⁷ molecules; lane 17, DNA marker.
Figure 6.

Simulation of the natural target’s behavior in competitive RT–PCR with the reference target RNA. Lane 1, DNA marker; lanes 2–10, the first series containing a constant 2 × 10⁶ molecules of the reference target with the mimic in 1.5-fold dilutions from 4 × 10⁷ to 1.56 × 10⁶ molecules; lanes 11–19, the second series containing a constant 1 × 10⁶ molecules of the reference target with the mimic in 1.5-fold dilutions from 2.67 × 10⁷ to 1.04 × 10⁶ molecules; lane 20, water instead of RNA (negative control).
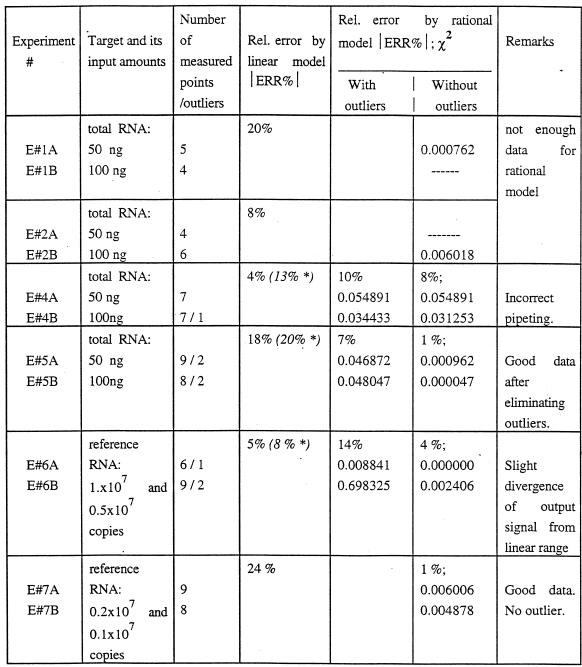
Table 1. Estimation of the 2-fold difference in the levels of target RNA (human interleukin 1β mRNA in U937 total RNA and the reference target) by the two mathematical models.
*Results obtained after eliminating the outliers.
Mathematical models for data analysis of QC (RT)–PCR
Two alternative mathematical models, the linear model (linear regression) and the rational model (by means of the computer program PCRFIT), were used for analysis of the obtained data. Data fitting was performed both with and without outliers (Table 1). Data consistency was evaluated by the χ2 criterion. The experimental ratio, R, was determined from equation 15, where the mimic amounts at the apparent equimolar points, MEP, were estimated by the corresponding mathematical model. The relative error, ERR%, shown as an absolute value, was then evaluated according to definition 3, where the theoretical ratio Rth = 2.
The data in Table 1 show that the relative error of estimation by the linear model ranged randomly from 4 (E#4) to 24% (E#7). These results are in accord with other reports (14,18).
In contrast, the rational model clearly distinguishes four categories of experimental datasets: (i) absence of outliers (E#7); (ii) exceptional occurrence of outliers (E#5); (iii) inconsistent dataset (E#4); (iv) consistent dataset with a small systematic error (E#6).
The accuracy of the rational model was excellent (relative error ~1% with low χ2 values) for good experimental data without outliers or after eliminating the exceptional outliers (E#7 and E#5, respectively). The fact that the two experiments were performed with different kinds of target RNA (natural and synthetic, respectively), using different batches of the mimic and the other reagents, implies a high reproducibility of the method. The origin of the exceptional outliers is the question that has concerned us from the beginning of this study. We applied the theory of dynamic systems to study the mathematical model of competitive PCR. However, our study implies that chaotic phenomena are not involved in this dynamic system. Due to the amplifying effect of PCR, a number of factors such as contamination, incorrect pipetting and insufficient mixing of reagents usually contribute to the outliers. According to our experience, the probability of an outlier occurring is higher in experiments starting with high DNA concentrations. There was no outlier observed in E#7, in which the template concentration was lowest (Table 1).
In experiments E#4A and B, the inconsistency of the data, due to pipetting error, is revealed graphically as atypical curves and numerically as high χ2 values, even after eliminating the obvious outlier.
Unlike E#4, where the error arose randomly during the measurement of input parameters, in E#6 the error was related systematically to the product detection step. Two data points were missing in this dataset because the two strongest target bands completely overshadowed the weaker mimic bands, which, though clearly visible, could not be scanned by the imaging system. The divergence of strong fluorescence signals of the target bands from the linear range caused a slight under-estimation of the data (point C in Fig. 4b) and, hence, of the result (R = 1.92). This type of error is of a systematic character. It is important to emphasize that although χ2 is a reliable criterion for data consistency, in most cases it fails to indicate systematic errors.
Strategy for absolute quantification of nucleic acids
The strategy for absolute quantification of nucleic acids is based on relative quantification between the natural and the reference targets. Therefore, the validity of the method relies on the identical amplification characteristics of the two targets and the accuracy of the relative quantification, as discussed previously.
The amplification characteristics of the two targets can be considered as identical for the following reasons: (i) the two amplified fragments are identical sequences; (ii) the RT–PCR products of both targets appeared identical (Figs 5 and 6), suggesting that there is no inhibiting factor which could affect the two amplifications differently; (iii) the two experiments E#5 and E#7 for the two targets show comparable data evaluated by the rational model (Table 1 and Fig. 2).
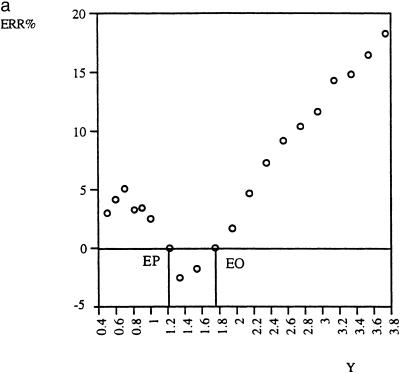
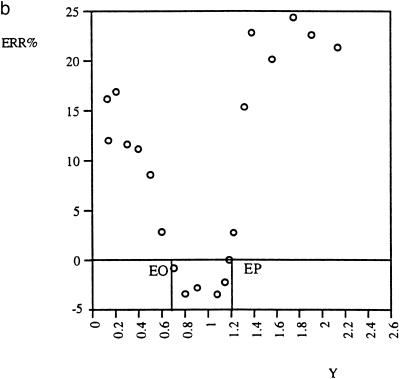
Standard curve. QC (RT)–PCR is based on determination of the apparent equimolar point (EP), where Y = C and M0 = MEP. If it was based on other points (Y ≠ C and M0 ≠ MEP), then the error is generally greater. Figure 7a and b shows this relationship for real data. The graphs corresponding to different data sets seem to have similar patterns. Although the error was found to also be minimal at another point, EO, it is only at the apparent equimolar point EP that the accuracy is excellent and reproducible. The reason is that the apparent equimolar point is the only fixed point of the function. At the fixed point, the value of the function does not depend on its coefficients. In other words, the apparent equimolar point is the only point in the dilution series where inter-assay comparison of the amount of nucleic acid in different tubes is valid. The use of standard curves, which depends on unwarranted extension of this validity to other points, is therefore not recommended.
Figure 7.
Dependence of the estimation error, ERR%, on variable Y, the ratio of target to mimic output signals. The absolute value of ERR% is minimal at the output equimolar point EP (Y = C = 1.2) and at another point EO. Only EP, not EO, is reproducible [compare (a) and (b)]. A negative value of ERR% means underestimation and vice versa.
PCR product detection. Our results indicate that the combination of agarose gel electrophoresis and an imaging system is a reliable detection method. The relative quantification of nucleic acids using internal standards rules out all variations in scanning that may occur. Although the absolute values of data points may vary from one scan to another (19), the final relative result is not significantly affected by this variability. Other more complex detection methods, such as using different labeled primers, would be necessary to increase the sensitivity, but not the accuracy, of the method.
Generation of RNA mimics
The fact that the accuracy of the new method is comparable with that of the RTDN PCR method, where heteroduplex formation between the target and the mimic sequences (20) does not interfere with the accuracy, suggests that heteroduplex formation does not present a problem in our system. If heteroduplexes occurred, they would have a loop of 96 nt (Fig. 1), i.e. almost 25% of their total length. Such heteroduplexes would not migrate at the same rate as either of the homoduplexes or faster than both of them. Since no unexpected PCR product of a larger size than the mimic was detected (Figs 5 and 6), heteroduplex formation can be considered as negligible. This is an advantage of a deletion in the middle of the sequence, in comparison with a deletion at one end, where heteroduplexes may migrate like the longer homoduplexes and complicate the separation process.
Other advantages of the new strategy for the generation of RNA mimics are: regular cloning is efficiently replaced by PCR yielding mimics free of bacterial nuclease contamination; no multiple rounds of PCR are required to produce DNA templates; flexibility in designing the size of PCR products resulting in easier product separation and distinction of contaminating genomic DNA from RT–PCR products. For the generation of RNA mimics, the crucial step is transcription. Experience in the synthesis of more than 30 RNA probes for non-isotopic RPA, based on the same PCR strategy for adding a phage promoter, revealed no problems with transcription of templates up to 600 bp, which is sufficient for the present application.
In conclusion, our study has clearly shown that the new mathematical model significantly improves the data analysis, and therefore the accuracy and reproducibility, of QC (RT)–PCR. Also, the mathematical model strongly supports our practical strategies for generation of internal standard RNA and quantification of absolute amounts of nucleic acids by QC (RT)–PCR using the conventional PCR system. As no special costly equipment is required, the method is suitable for all laboratories having basic facilities for molecular biology procedures. Furthermore, our computer software is suitable for implementing quantitative PCR as a new feature for automated PCR systems.
NOTICE
The computer software has been developed by personal efforts, and should be referred as PCRFIT 1.0 copyright © 1999 by Huong Lan Vu and Vu Quoc Nguyen. PCRFIT is available for users from: Maria Crenshaw, Department of Microbiology, University of Alabama at Birmingham, BBRB #757, 845 19th Street South, Birmingham, AL 35294, USA. Tel: +1 205 934 2225; Fax: +1 205 934 3894; Email: mariac@uab.edu. The cost for PCRFIT is $475.00 plus shipping costs. A demonstration version is available upon request, free of charge plus shipping costs.
Acknowledgments
ACKNOWLEDGEMENTS
The authors wish to thank Drs Robert Kralovics and Roman Tuma for their helpful discussions regarding molecular biology methods and computer software development, respectively. This work was supported by NIH Training Grants T32 HL07553 for H.L.V. and T32 AI07150 for H.H.N. and research grants AI 28147 and DE 09691.
REFERENCES
- 1.Wang A.M., Doyle,M.V. and Mark,D.F. (1989) Proc. Natl Acad. Sci. USA, 86, 9717–9721. [DOI] [PMC free article] [PubMed] [Google Scholar]
- 2.Heid C.A., Stevens,J., Livak,K.J. and Williams,P.M. (1996) Genome Res., 6, 986–994. [DOI] [PubMed] [Google Scholar]
- 3.Gibson U.E., Heid,C.A. and Williams,P.M. (1996) Genome Res., 6, 995–1001. [DOI] [PubMed] [Google Scholar]
- 4.Vanden H.J., Tyson,F.L. and Bell,D.A. (1993) Biotechniques, 14, 395–398. [PubMed] [Google Scholar]
- 5.Fille M., Shanley,J.D. and Aslanzadeh,J. (1997) Biotechniques, 23, 34–36. [DOI] [PubMed] [Google Scholar]
- 6.Tarnuzzer R.W., Macauley,S.P., Farmerie,W.G., Caballero,S., Ghassemifar,M.R., Anderson,J.T., Robinson,C.P., Grant,M.B., Humphreys,B.M., Franzen,L. et al. (1996) Biotechniques, 20, 670–674. [DOI] [PubMed] [Google Scholar]
- 7.Jin C.F., Mata,M. and Fink,D.J. (1994) PCR Methods Appl., 3, 252–255. [DOI] [PubMed] [Google Scholar]
- 8.Ali S.A., Sarto,I. and Steinkasserer,A. (1997) Biotechniques, 22, 1060–1062. [DOI] [PubMed] [Google Scholar]
- 9.Mullis K.B. and Faloona,F.A. (1987) Methods Enzymol., 155, 335–350. [DOI] [PubMed] [Google Scholar]
- 10.Raeymaekers L. (1995) Genome Res., 5, 91–94. [DOI] [PubMed] [Google Scholar]
- 11.Peccoud J. and Jacob,C. (1996) Biophys. J., 71, 101–108. [DOI] [PMC free article] [PubMed] [Google Scholar]
- 12.Hengen P.N. (1995) Trends Biochem. Sci., 20, 476–477. [DOI] [PubMed] [Google Scholar]
- 13.Delassus S. (1997) Eur. Cytokine Netw., 8, 239–244. [PubMed] [Google Scholar]
- 14.Lader E. (1998) Ambion Technotes, 5, 1. [Google Scholar]
- 15.Wiesner R.J. (1992) Nucleic Acids Res., 20, 5863–5864. [DOI] [PMC free article] [PubMed] [Google Scholar]
- 16.Wiesner R.J., Beinbrech,B. and Ruegg,J.C. (1993) Nature, 366, 416. [DOI] [PubMed] [Google Scholar]
- 17.Press W.H., Teukolsky,S.A., Vetterling,W.T. and Flannery,B.P. (1992) Numerical Recipes in C. The Art of Scientific Computing. Cambridge University Press, New York, NY.
- 18.Zimmermann K. and Mannhalter,J.W. (1996) Biotechniques, 21, 268–272. [DOI] [PubMed] [Google Scholar]
- 19.Sundfors C. and Collan,Y. (1995) Cell. Mol. Biol., 41, 671–681. [PubMed]
- 20.Henley W.N., Schuebel,K.E. and Nielsen,D.A. (1996) Biochem. Biophys. Res. Commun., 226, 113–117. [DOI] [PubMed] [Google Scholar]


