

Abstract
Diabetes increases oxidative stress in the retina and decreases the levels of the intracellular antioxidant glutathione (GSH). The transcriptional factor Nrf2 regulates the expression of Gclc, the enzyme important in the biosynthesis of GSH, and in diabetes the binding of Nrf2 at the antioxidant response element region 4 (ARE4) is decreased. Our aim was to investigate the role of epigenetic modifications in the decreased Nrf2 binding at Gclc-ARE4 in the development of diabetic retinopathy and in the metabolic memory associated with its continued progression. The effect of hyperglycemia on H3K4 methylation in Nrf2 binding at Gclc-ARE4 was investigated by chromatin immunoprecipitation in the rat retina and was confirmed in retinal endothelial cells in which histone demethylase (LSD1) was manipulated. The role of histone methylation at Gclc-ARE4 in the metabolic memory was examined in rats maintained under poor control for 3 months followed by good control (GC) for 3 months. Although H3K4me2 at Gclc-ARE4 was increased in diabetes, H3K4me3 and H3K4me1 were decreased. LSD1 siRNA abrogated the glucose-induced decrease in H3K4me1 at Gclc-ARE4 and ameliorated decreases in Nrf2 binding at Gclc-ARE4 and Gclc transcripts. Reestablishment of GC failed to provide any benefits to histone methylation, and Nrf2 binding activity remained compromised. Thus, in diabetic retinopathy, histone methylation at Gclc-ARE4 plays an important role in regulating the Nrf2–Gclc–GSH cascade. Targeting histone methylation could help inhibit/slow down this blinding disease.
Keywords: Diabetic retinopathy, Epigenetic modifications, GSH, Glutamate–cysteine ligase, Histone methylation, Nrf2, Free radicals
Increased oxidative stress is implicated in many micro- and macrovascular complications of diabetes, including retinopathy [1–3]. In diabetes, the retina and in its capillary cells experience oxidative stress, and the production of free radicals is increased, and the antioxidant defense system becomes suboptimal with decreased levels of the intracellular antioxidant glutathione (GSH) [4–8]. Furthermore, the transcriptional activity of the redox-sensitive transcription factor NF-E2-related factor 2 (Nrf2), which provides the primary cellular defense against the cytotoxic effects of oxidative stress, is also decreased, and the redox balance is disturbed [9]. Nrf2 is intimately implicated in the biosynthesis of GSH, and it regulates the transcription of the enzyme critical in its biosynthesis, glutamate–cysteine ligase [10,11]. Glutamate–cysteine ligase has two subunits; its catalytic subunit, Gclc, catalyzes the formation of γ-glutamylcysteine, and the modifier subunit, Gclm, interacts with Gclc to form the holoenzyme [12,13]. The human GCLC promoter has many potential cis-acting elements, including consensus recognition sites for binding of Sp1 and the antioxidant response element (ARE). Nrf2 regulates the expression of Gclc by binding at the ARE4 region, a region with a strong transcription activation function and located ~4 kb upstream of the transcriptional start site [12,14]. Our previous studies have shown that in diabetes retinal Gclc gene transcripts and the binding of Nrf2 at Gclc-ARE4 are decreased [9]. However, the mechanism responsible for this decreased binding of Nrf2 at Gclc-ARE4 in diabetes is not clear.
The expression of genes is also regulated by epigenetic modifications, including acetylation and methylation of histones and DNA [15–17]. Whereas DNA methylation is generally associated with deactivation and demethylation with activation of gene expression [16,18], histone methylation is a multifaceted phenomenon, as lysine residues on histones can undergo mono-, di-, or trimethylation, and the outcome of the methylation can differ depending on the degree of residue methylation and the location of the methylated lysine [19,20]. For example, di- or trimethylation of lysine 9 and lysine 27 on histone 3 (H3K9me2, me3 and H3K27me2, me3, respectively) is associated with transcriptional silencing, but methylation of lysine 4 on histone 3 (H3K4) is generally involved in transcriptional activation [21–23]. We have shown that decreased H3K4me1 at enhancer and H3K4me2 at promoter regions of the gene encoding mitochondrial superoxide scavenging enzyme, Sod2, are associated with its gene suppression [24]. In contrast, decreased H3K9me2 at the promoter region of matrix metalloproteinase-9 (MMP-9) regulates its activation [25]. Demethylation of histones is regulated by demethylating enzymes, e.g., lysine-specific demethylase 1 (LSD1) demethylates H3K4me2 or H3K4me1, resulting in gene repression, but in contrast, it demethylates methylated H3K9, resulting in gene activation [15–17]. In diabetes, retinal LSD1 is activated, and activated LSD1 hypomethylates H3K9 at the MMP-9 promoter, which frees up that lysine 9 for acetylation. Owing to increased acetylation of H3K9 the recruitment of p65 is facilitated, resulting in MMP-9 activation and mitochondria damage [25]. Methyl groups from mono- and dimethylated lysine of H3K4 are removed by LSD1, but this enzyme cannot remove methyl groups from the trimethylated K4 (H3K4me3); demethylation of H3K4me3 is facilitated by a JARID family protein—JARID1A (or KDM5A) [26]. The role of histone methylation in the regulation of Nrf2-mediated Gclc regulation in diabetes remains to be investigated.
Clinical and experimental studies have documented that chronic complications, including diabetic retinopathy, persist and progress even after the hyperglycemic insult is reversed by good glycemic control [27–29]. The retina continues to experience increased oxidative stress and the levels of GSH and Gclc remain subnormal [9,29]. Epigenetic modification chemically modifies the genes and these modifications, in addition to allowing cells to quickly respond to the changing stimuli, also result in long-lasting changes in gene activity [17,30,31]. Recent studies have implicated epigenetic modification in the metabolic memory phenomenon associated with the continued progression of diabetic complications [24,25,30,32–37]. Our studies have shown that the methylation status of H3K4 and H4K20 at Sod2 continues to be altered even after the hyperglycemic insult is reversed by good glycemic control in diabetic rats, and the enzymes responsible for histone methylation (SUV420h2) and demethylation (LSD1) remain dysfunctional [24,25]. The effect of reversal of hyperglycemia on histone methylation at Gclc-ARE4 in regulating the transcriptional activity of Nrf2 is not clear.
The aim of this study was to investigate the mechanism responsible for decreased binding of Nrf2 at Gclc-ARE4 in the development of diabetic retinopathy and in the metabolic memory associated with its continued progression. Using retina from diabetic rats, we have examined the role of histone methylation in the regulation of Gclc transcription. Owing to the complexity of the retina structure, retinal endothelial cells (the cells that present histopathology characteristic of diabetic retinopathy) with LSD1 genetically manipulated were also used. To transition from animal models and the in vitro studies to the human disease, the key results were confirmed in the retina from human donors with established diabetic retinopathy.
Methods
Rats
Male Wistar rats (200–225 g) were divided into three groups soon after the induction of diabetes with streptozotocin. Rats in group 1 were maintained under poor glycemic control (PC; glycated hemoglobin (GHb) ~12%) for 6 months, whereas in group 2 the rats were under PC for 3 months followed by good glycemic control (GC; GHb ~6%) for an additional 3 months (Rev group). Rats in group 3 were under GC for the entire 6 months. Good glycemic control was maintained by administering insulin twice a day (total of 5–7 IU/day). Body weight was obtained two times a week, and blood glucose (by tail vein puncture) and 24-h urine volume once every week. GHb was measured using a kit from Helena Laboratories (Beaumont, TX, USA) at 3 months after induction of diabetes and also before termination of the experiments. These procedures are routinely used in our laboratory [29,33–35] and conform to the ARVO Resolution on Treatment of Animals.
Endothelial cells
Bovine retinal endothelial cells (BRECs) were cultured in Dulbecco’s modified Eagle medium containing 15% fetal calf serum (heat inactivated), 5% replacement serum (Nu-serum; BD Bioscience, San Jose, CA, USA), heparin (50 μg/ml), endothelial growth supplement (50 μg/ml; BD Bioscience), and antibiotic/antimycotic in an environment of 95% O2 and 5% CO2. The cells from the fifth to the seventh passage were incubated in 20 mM glucose for 4 days, washed with phosphate-buffered saline (PBS), and incubated in 5 mM glucose for 4 additional days (20–5 group). Cells incubated continuously in 5 or 20 mM glucose for the entire 8 days served as controls [24,34,35]. To further confirm the effect of high glucose on altered Nrf2 binding at Gclc-ARE, cells were preincubated with an Nrf2 inducer, tert-butylhydroquinone (tBHQ; 15 μM; Sigma–Aldrich, St. Louis, MO, USA) for 24 h before being incubated with 5 or 20 mM glucose for 4 days, as previously reported [9]. Cells incubated in 0.001% dimethyl sulfoxide (DMSO; used to dissolve tBHQ) served as solvent controls, and 20 mM mannitol, instead of 20 mM glucose, was used as an osmotic control. These procedures are routinely performed in our laboratory [24,25,34,38].
To manipulate the gene expression of LSD1, cells from the fourth or fifth passage were transfected with LSD1 siRNA using a transfection reagent from Santa Cruz Biotechnology (Santa Cruz, CA, USA). The transfection complex containing LSD1 siRNA, transfection reagent, and transfection medium (Santa Cruz Biotechnology) was preincubated for 45 min at room temperature, followed by incubation of the cells with the transfection complex for 8 h at 37 °C. The cells were then rinsed twice with PBS and incubated in 5 or 20 mM glucose medium for 4 days; the transfection efficiency of LSD1 was ~50% [24]. Parallel incubations were performed using scramble RNA.
Human retinas
Eye globes, enucleated within 6–8 h of death from human donors (46–75 years of age) with diabetes for over 10 years and clinically documented diabetic retinopathy, were obtained from Midwest Eye Banks (Ann Arbor, MI, USA). Age-matched nondiabetic donors (46–76 years of age) served as controls. Retinas from these donors have also been used in our previous studies [9,24,39].
Chromatin immunoprecipitation (ChIP)
Crosslinked retina or isolated endothelial cells were resuspended in lysis buffer containing 1% SDS, 10 mM EDTA, 50 mM Tris–HCl, pH 8.1 (ChIP Assay Kit, Millipore, Temecula, CA, USA), and protease inhibitor cocktail (Sigma–Aldrich) and sonicated four to six times for 10 s each. The samples were diluted in ChIP dilution buffer and precleared with protein A agarose/salmon sperm DNA for 30 min. Protein–DNA complex (120 μg) was immunoprecipitated with the antibody against H3K4me3, me2, or me1 or Nrf2 (Abcam, Cambridge, MA, USA). DNA fragments were recovered by phenol–chloroform–isoamyl alcohol extraction, ethanol precipitated, and resuspended in water for PCR. The Gclc-ARE4 region was quantified by SYBR green-based real-time quantitative PCR (q-PCR) using the 7500 Real-Time PCR System (Applied Biosystems, Foster City, CA, USA), and Nrf2 at the heme oxygenase-1 (HO1) promoter by semiquantitative PCR, by analyzing the products on an agarose gel. Normal rabbit IgG served as a negative antibody control and DNA from the input as an internal control [24,25,34]. Each ChIP measurement was made in five or six rats/sgroup or four or five cell preparations.
Gene expression
Gene expression was quantified by q-PCR, and the conditions included denaturation at 95 °C for 10 min, 40 cycles of denaturation at 95 °C for 15 s, and annealing and extension at 60 °C for 60 s. This was followed by 95 °C for 15 s, 60 °C for 60 s, 95 °C for 15 s, and 60 °C for 15 s. The specific products were confirmed by SYBR green single melting curve. Relative fold changes were calculated by setting the mean values from normal rat retina or cells incubated in 5 mM glucose as 1 [24,34,35]. The primers used for q-PCR are listed in Table 1.
Table 1.
Primer sequences.
| Gene | Primer sequence | Position |
|---|---|---|
|
| ||
| Rat | ||
| Gclc-ARE4 | Forward: ACGCGGCAGCCTATACTCGGA | − 3,898 to −3,877 |
| Reverse: GAAAACCCGGACGCGGAGCTG | − 3,703 to −3,723 | |
| Gclc-ARE4 off target | Forward: TGACTCGGGGCTCATTCATTC | 281–301 |
| Reverse: GTGAGATGTGGCAGGGGTTT | 526–507 | |
| Gclc | Forward: GTGGACACCCGATGCAGTAT | 1,708–1,727 |
| Reverse: TCATCCACCTGGCAACAGTC | 1,795–1,176 | |
| HO1 promoter | Forward: CTGTGTCATGGTTGGGAGGG | − 3,837 to − 3,818 |
| Reverse: GGCTTTGCAAACCATTTAAAACCA | − 3,650 to −3,673 | |
| KDM5A | Forward: GAGCTGGCCCCTGAGTTATTT | 1,966–1,986 |
| Reverse: GATAGGCACGAGGAAACGTCA | 2,119–2,099 | |
| β-Actin | Forward: CCTCTATGCCAACACAGTGC | 957–976 |
| Reverse: CATCGTACTCCTGCTTGCTG | 1,171–1,152 | |
| Bovine | ||
| Gclc-ARE4 | Forward: ACGCAGGCTCTCCCAGGTTGA | − 4,185 to −4,164 |
| Reverse: ACATCTCATCCGGCCCTGCAG | − 3,898 to −3,918 | |
| Gclc | Forward: CCAGCACGTGGCGCATCTCT | 1,008–1,027 |
| Reverse: CAGCTGAACCTCCATGGGCCG | 1,203–1,183 | |
| HO1 promoter | Forward: TAGTATCTGACGCACAGGAAGG | −1,662 to −1,641 |
| Reverse: ATGGGGGCTGCTCAGTCTTC | −1,513 to − 1,532 | |
| KDM5A | Forward: TTCCAGCCTTTCTGCCCAAT | 89–109 |
| Reverse: CATCAAGACGCACGGGGATA | 3,174–3,193 | |
| β-Actin | Forward: CGCCATGGATGATGATATTGC | 3,338–3,319 |
| Reverse: AAGCCGCCTTGCACAT | 154–138 | |
| Human | ||
| GCLC-ARE4 | Forward: CAGATTGACCTCCGGCTCG | − 3,162 to − 3,143 |
| Reverse: CGCAGTTGTTGTGATACAGCC | − 3,044 to − 3,065 | |
| GCLC-ARE4 off target | Forward: ATAGGTGGGGGAGCAGCTAA | 33,616–33,635 |
| Reverse: ATCACTGCCCTGGAGCTAGA | 33,838–33,819 | |
| GCLC | Forward: GCAAGGCCCAGAACAGCACG | 1,875–1,894 |
| Reverse: CCCTCATCCATCTGGCAACTGT | 2,106–2,084 | |
| KDM5A | Forward: TCTTTGAGCCGAGTTGGGAG | 426–445 |
| Reverse: CTTCACAGGCAAATGGAGGC | 557–538 | |
| β-Actin | Forward: AGCCTCGCCTTTGCCGATCCG | 34–54 |
| Reverse: TCTCTTGCTCTGGGCCTCGTCG | 270–249 | |
Protein expression
Homogenates prepared from retina or isolated endothelial cells in 30 mM Tris–HCl buffer (pH 7.5) containing 2 mM EGTA, 1 mM EDTA, 1% Triton X-100, 250 mM sucrose, 1 mM NaF, 1 mM phenylmethanesulfonyl fluoride, 1 mM Na3VO4 were centrifuged at 750g for 5 min to remove the cell debris. Protein was measured in the homogenate using bicinchoninic acid, and protein expression was quantified by Western blot technique using target-specific antibodies. β-Actin was used as a loading control.
Nrf2–DNA binding activity
DNA binding activity of Nrf2 was determined in 5–20 μg nuclear protein using the TransAM Nrf2 DNA binding kit (Active Motif, Carlsbad, CA, USA), as previously reported by us [9].
Demethylase activity
The demethylase activity of the JARID histone demethylase family was quantified using an assay kit from Epigentek (Farmingdale, NY, USA). Nuclear protein (2–5 μg) was incubated with H3K4me3, and the demethylated substrate was captured by a specific antibody. The amount of demethylated H3K4 was measured fluorimetrically at 530 excitation and 590 emission wavelengths. An enzyme blank was included in each experiment.
Statistical analysis
Results are presented as the mean ± SD and were analyzed using SigmaStat. One-way ANOVA followed by Bonferroni’s test was used for data with normal distribution, and Kruskal–Wallis one-way analysis followed by Dunn’s for data that did not present normal distribution. A p of <0.05 was considered statistically significant.
Results
Rats
Glycated hemoglobin and 24-h urine volumes were significantly higher (>10% and ~90 ml, respectively) and body weights lower (~300 g) in the rats under continuous poor control compared to the age-matched normal rats (~5.5%, 5–10 ml, and 450 g, respectively). The rats maintained under continuous good control had similar GHb, urine volumes, and body weights compared to the rats in the normal group. As reported previously by us [29,33–35], before initiation of good control in the rats in the Rev group, GHb, urine volumes, and body weights were similar to those obtained from rats under poor control, but after reinstitution of good control, the values were not different from those obtained from rats under continuous good control or age-matched normal rats.
Diabetes impairs the Nrf2–Keap1–Gclc–GSH signaling cascade and decreases gene expression of Gclc in the retina [9]. To understand the mechanism responsible for subnormal Gclc, the methylation status of histones at Gclc-ARE4 was investigated. H3K4me2 at Gclc-ARE4 was increased by approximately two fold in the retina from diabetic rats compared with normal rats (Fig. 1a). However, in the same retina samples, H3K4me1 at Gclc-ARE4 was decreased by ~50% (Fig. 1b), suggesting a role for LSD1 in the demethylation of H3K4me1. To understand if this increase in H3K4me2 was due to demethylation of H3K4me3, H3K4me3 at Gclc-ARE4 was quantified, and as shown in Fig. 1c, H3K4me3 at Gclc-ARE4 was significantly decreased in diabetes. The input DNA obtained before ChIP had similar abundances of Gclc-ARE4 in normal and diabetic rats. Negative IgG controls in the same ChIP samples produced almost negligible PCR products (Fig. 1a–c). As an additional control, H3K4me3 at the off-target region of Gclc-ARE4 was also almost undetectable (Fig. 1c). This decrease in H3K4me3 at Gclc-ARE4 was accompanied by an increase in mRNA and enzyme activity of the H3K4me3 demethylating enzyme (Fig. 1d and e). In the same animals, as expected [9], the binding of Nrf2 at Gclc-ARE4 was decreased by 90% compared to the values obtained from age-matched normal rats (Fig. 2a), and mRNA and protein levels of Gclc were also decreased by 40–60% in diabetic rats (Fig. 2b). Consistent with a decrease in binding of Nrf2 at Gclc-ARE4, binding of Nrf2 at the promoter of HO1, another Nrf2-responsive antioxidant gene, was also decreased by ~50% (Fig. 2c), suggesting that the decrease in Nrf2 binding in diabetes is not specific to Gclc.
Fig. 1.
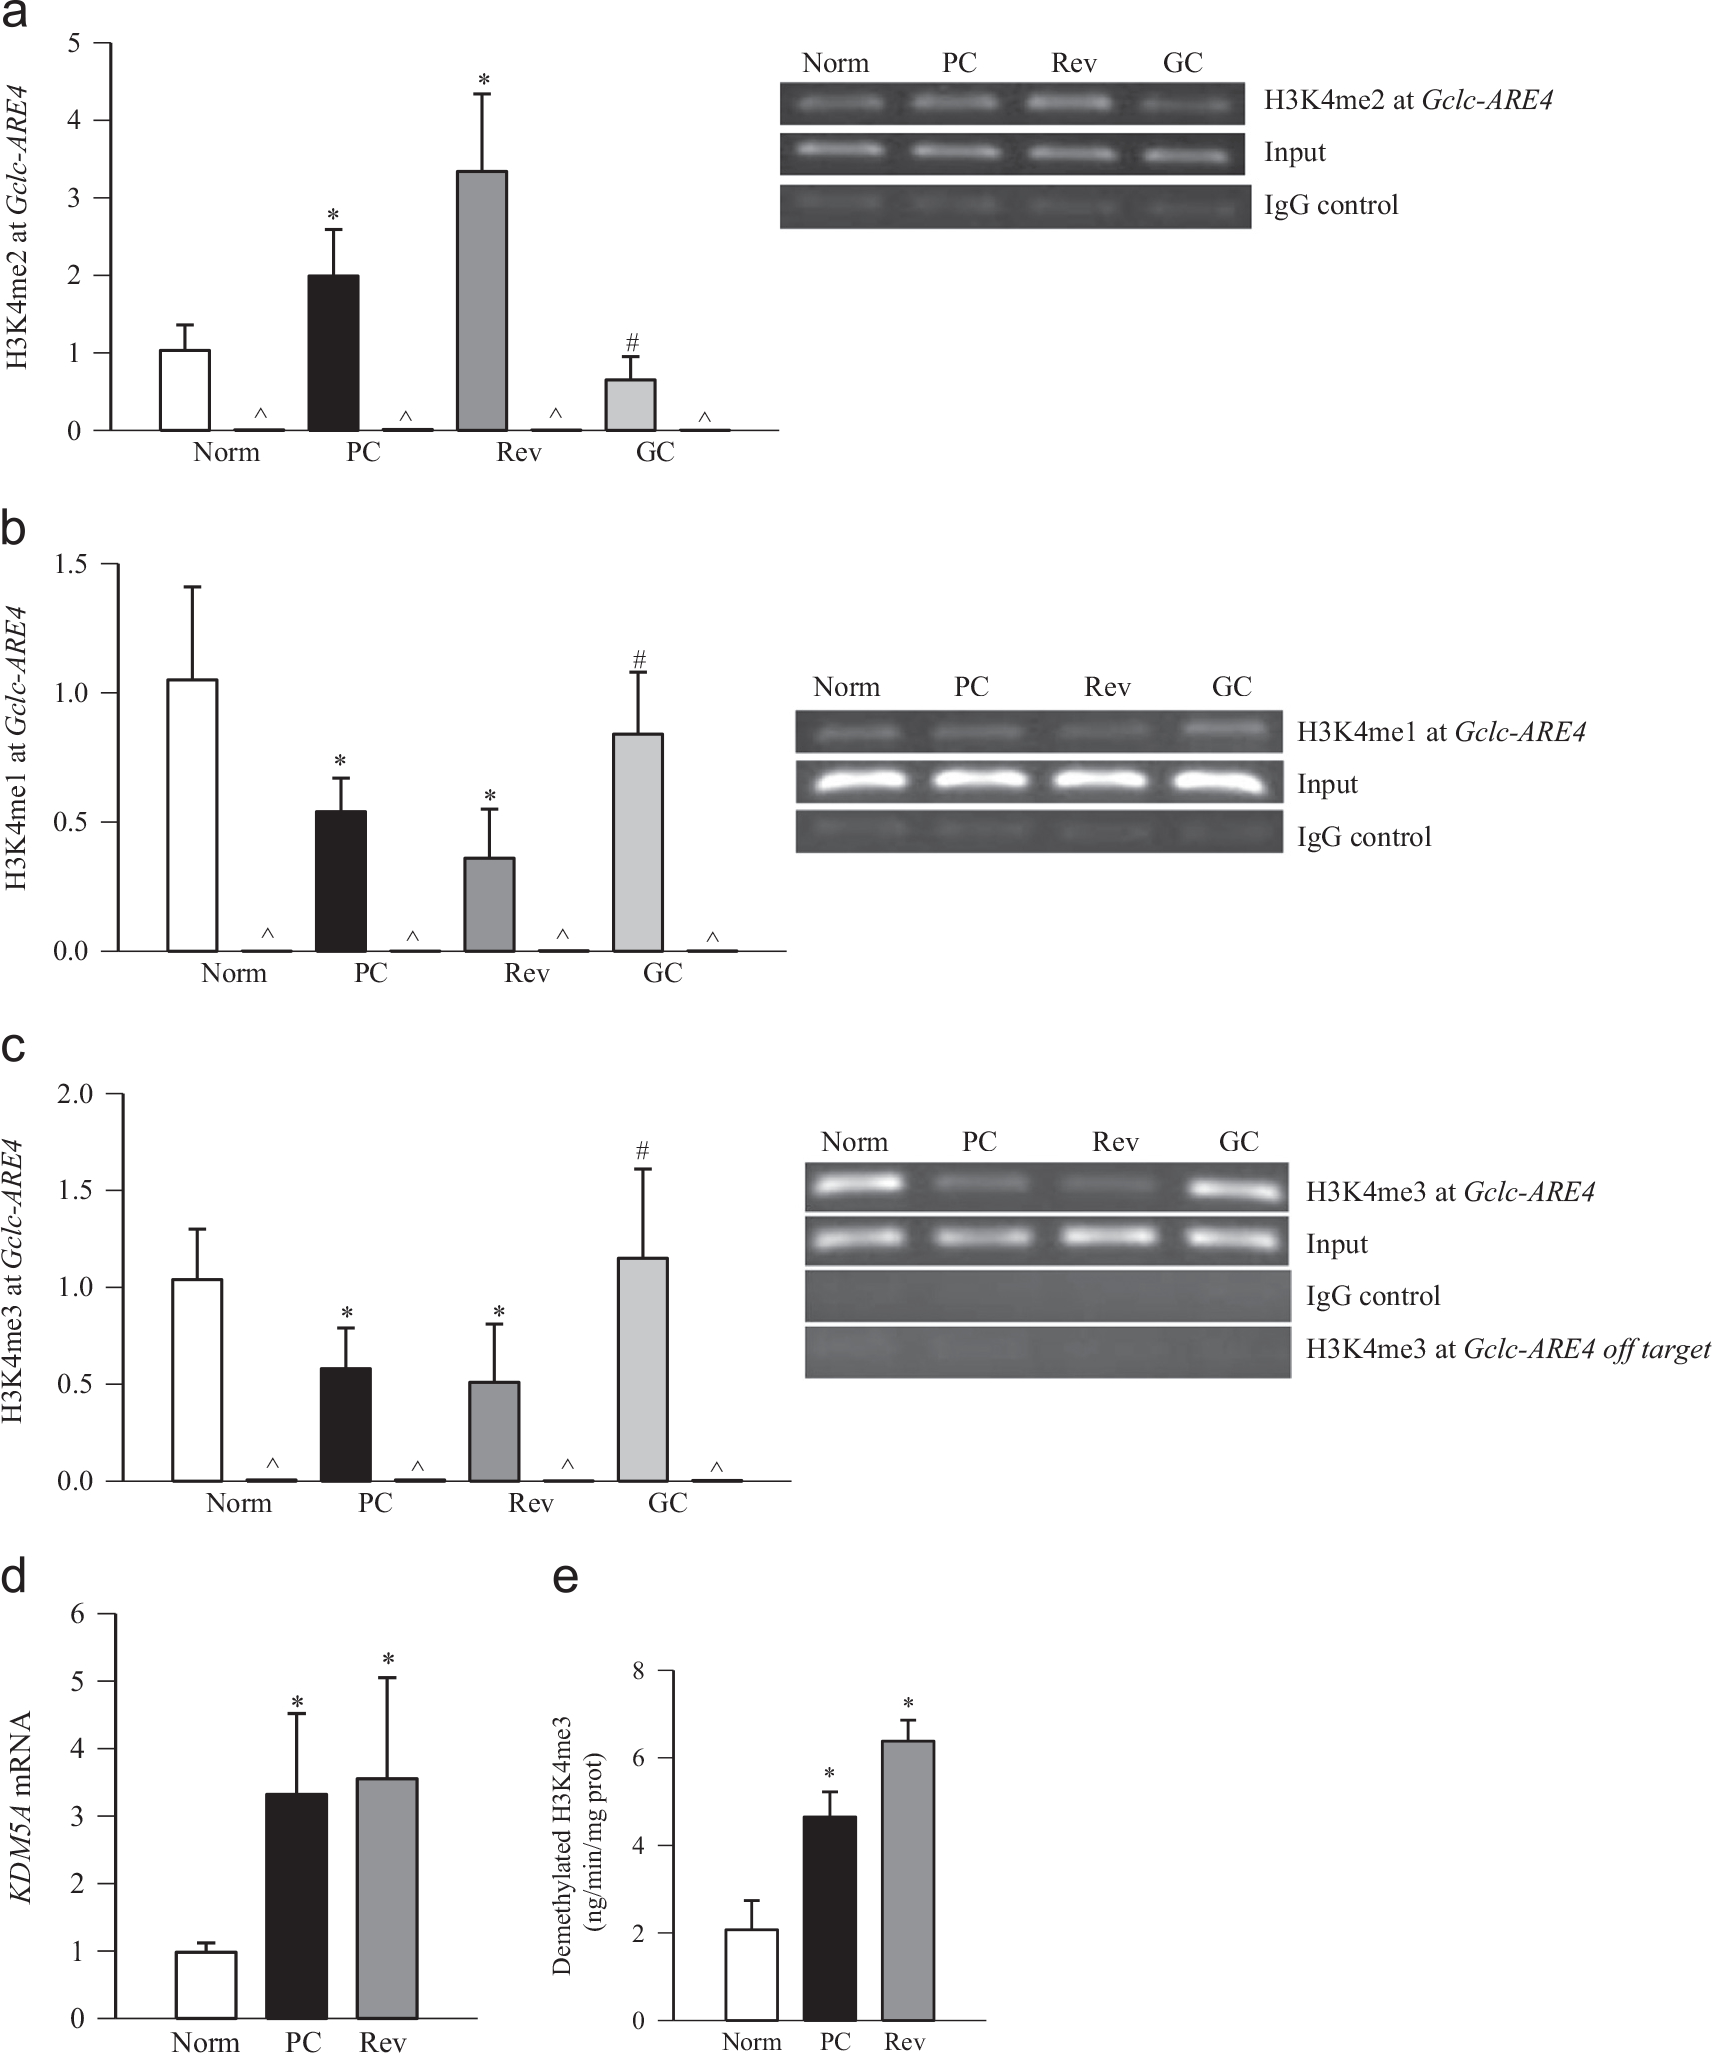
Effects of diabetes and of reinstitution of good glycemic control on H3K4 methylation status at the retinal Gclc-ARE4 region. Protein–DNA complexes were immunoprecipitated with the antibody against (a) H3K4me2, (b) H3K4me1, (c) H3K4me3, or normal rabbit IgG (marked as \widehat), and the Gclc-ARE4 was amplified and quantified by SYBR green-based q-PCR. The specificity of the ChIP was further confirmed by semiquantitative PCR. Crosslinked retina was immunoprecipitated with anti-H3K4me3 or normal rabbit IgG, and Gclc-ARE4 and off-target regions were quantified. (d) mRNA levels of KDM5A were quantified by q-PCR using β-actin as a housekeeping gene. (e) The H3K4me3 demethylase activity was quantified fluorimetrically in 2–5 μg of retinal nuclear fraction using an assay kit from Epigentek. Norm, normal; PC, rats under poor glycemic control for 6 months; Rev, rats maintained under poor control for 3 months followed by good glycemic control for 3 months; GC, rats maintained under good glycemic control for the entire 6 months; IgG control, immunoprecipitation with IgG; input, Gclc-ARE4 abundance in total genomic DNA, without ChIP. Data are presented as the mean ± SD from five or six rats in each group, *p < 0.05 compared with normal rats and #p < 0.05 compared with PC rats.
Fig. 2.
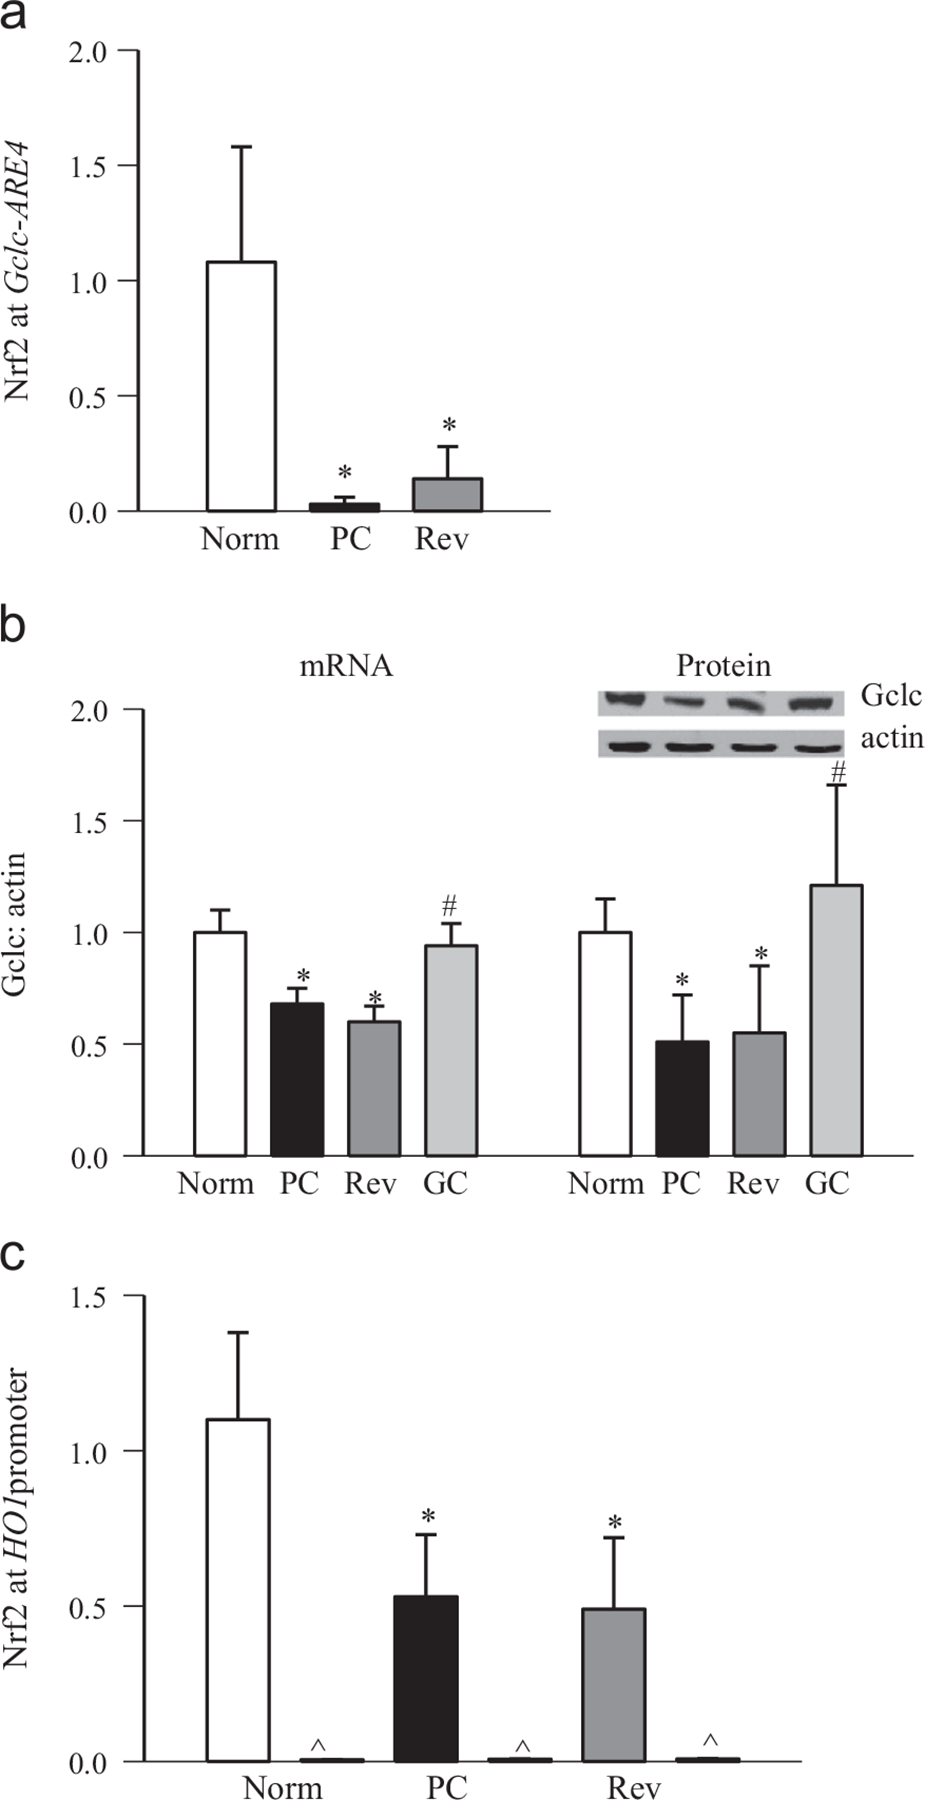
Effects of reversal of hyperglycemic insult on the binding of Nrf2 at Gclc-ARE4 and the HO1 promoter region. (a) Nrf2 binding at Gclc-ARE4 was measured by q-PCR using the ChIP technique by amplifying the ARE4 region of Gclc in the precipitated DNA. (b) mRNA and protein expression was quantified by q-PCR and by Western blot, respectively, using β-actin as housekeeping/loading control. (c) Nrf2 binding at HO1 was quantified by amplifying the HO1 promoter region in the precipitated DNA. Data are presented as the mean ± SD from four or five rats in each group, and values obtained from normal rat retina were considered as 1. *p < 0.05 and #p < 0.05 compared with the values obtained from normal and PC rats, respectively.
Reinstitution of good control in diabetic rats, after poor control, fails to reverse the decrease in retinal GSH levels, and the epigenetic modifications in genes and histopathology associated with diabetic retinopathy continue to progress [7,24,28,35]. The effects of reinstitution of good control on epigenetic modifications at Gclc-ARE4 and the binding of Nrf2 at Gclc-ARE4 were determined. Reversal of 3 months of poor glycemic control by 3 months of good glycemic control had no beneficial effect on the histone modifications at Gclc-ARE4; the levels of H3K4me2 remained elevated and those of H3K4me1 and H3K4me3 decreased, and KDM5A continued to be activated (Fig. 1a–e), suggesting that Gclc-ARE4 remains epigenetically modified even after hyperglycemic insult is terminated. Furthermore, the binding of Nrf2 at Gclc-ARE4, and the expression of Gclc (gene and protein), continued to be subnormal (Fig. 2a and b). These modifications were accompanied by sustained decrease in DNA binding activity of Nrf2 (Fig. 3a). Consistent with our previous results showing increased gene expression of Nrf2 in diabetes and decreased accumulation in the nucleus [9], reinstitution of good control also had no beneficial effect on protein and gene expression of Nrf2 (Fig. 3b). The values obtained from the rats in the Rev group were not different from those obtained from the rats in the PC group (p > 0.05), but were significantly different (p < 0.05) from those in the normal group.
Fig. 3.
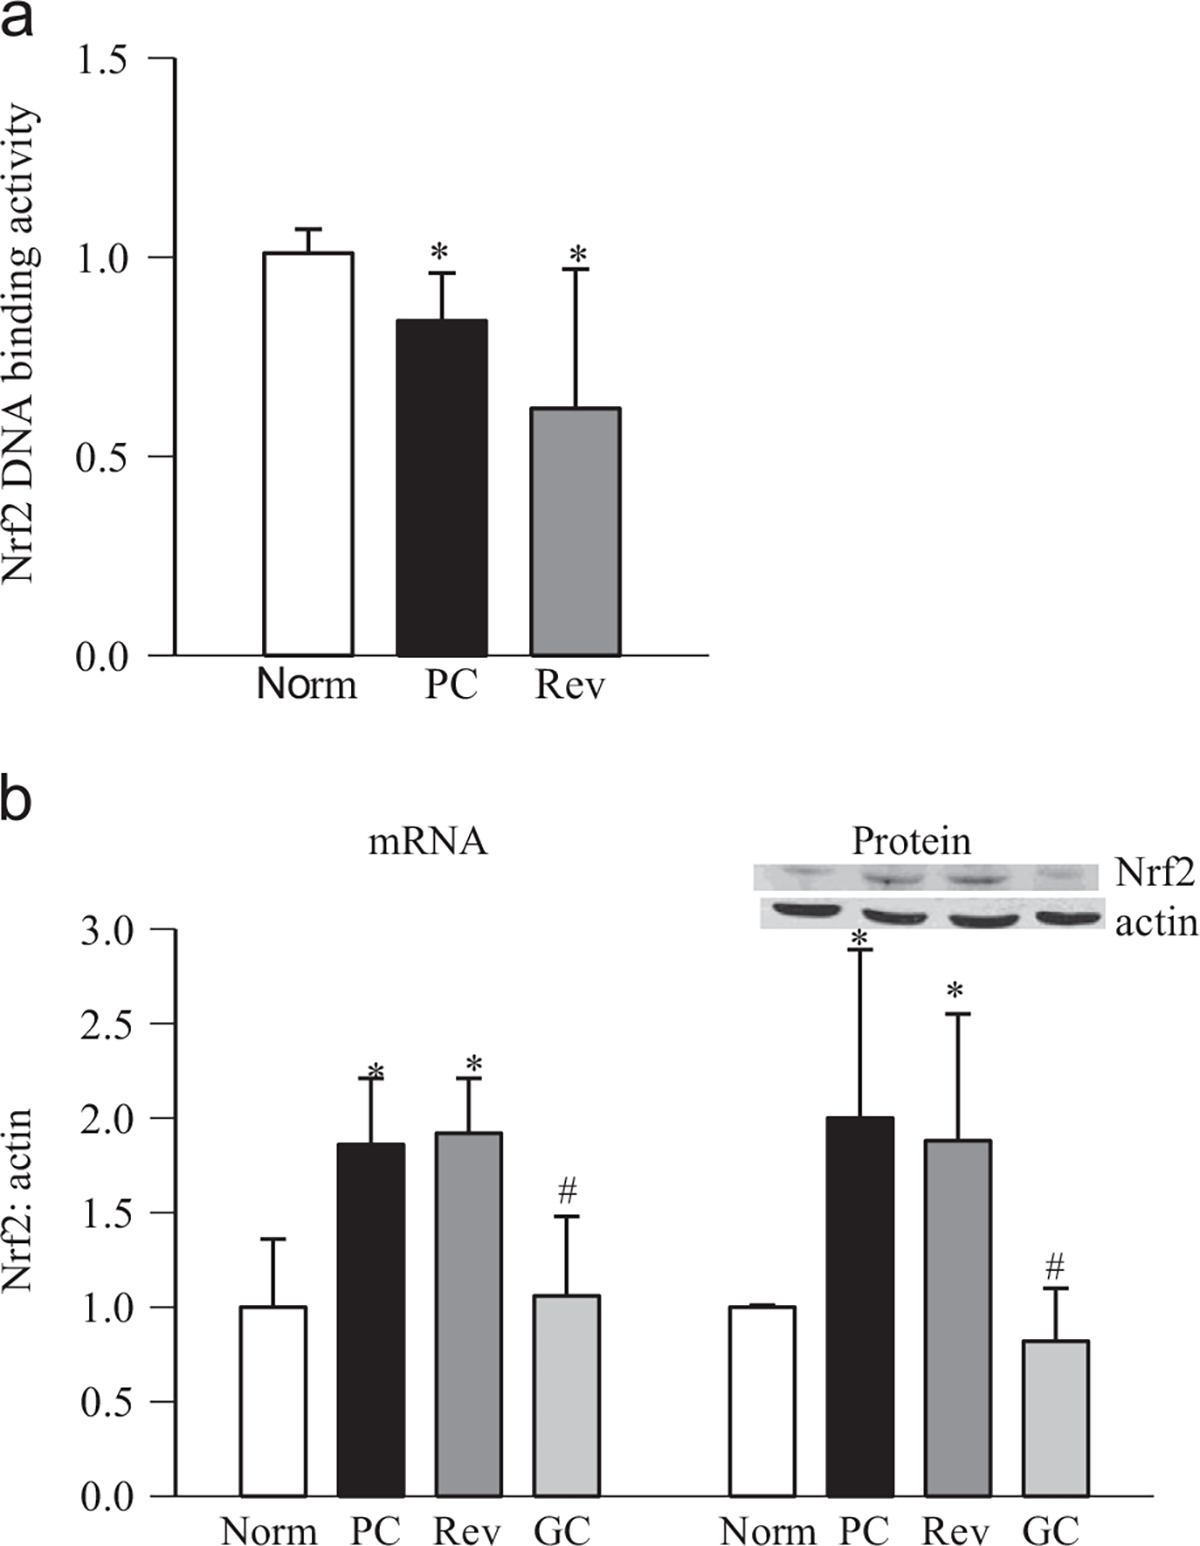
Reinstitution of good glycemic control and retinal Nfr2 activity. Retina was analyzed for (a) DNA binding activity of Nrf2 using an ELISA-based TransAM Nrf2 DNA binding kit and (b) gene expression of Nrf2 by SYBR green-based q-PCR using β-actin as housekeeping gene. Fold change was normalized to the values of normal control by the ddCt method. Protein expression of Nrf2 was determined by Western blot using β-actin as a loading control, and the data are presented as the mean ± SD from four to six rats in each group. PC, rats under poor glycemic control for 6 months; Rev, rats maintained under poor control for 3 months followed by good glycemic control for 3 months; and GC, rats maintained under good glycemic control for the entire 6 months. *p < 0.05 compared with normal rats and #p < 0.05 compared with PC rats.
However, when the animals were maintained under good glycemic control soon after induction of diabetes (GC group), diabetes-induced epigenetic modifications in Gclc-ARE4 and the expression of Gclc and Nrf2 remained normal (Figs. 1–3); the values obtained from GC rats were not different from those obtained from age-matched normal rats (p > 0.05), but were significantly different from those of the rats in the PC and Rev groups.
Retinal endothelial cells
High-glucose exposure of retinal endothelial cells significantly increased the levels of H3K4me2 at Gclc-ARE4 compared to the cells incubated in normal glucose (Fig. 4a). The input DNA showed similar Gclc-ARE4 abundance in the cells incubated in 5 or 20 mM glucose, and negative IgG controls in the same ChIP samples produced almost negligible PCR products (Fig. 4a). In the same preparations, the levels of H3K4me1 and H3K4me3 were decreased (Fig. 4b and c).
Fig. 4.

Effect of high glucose on methylation status of H3K4 at Gclc-ARE4 in retinal endothelial cells. BRECs, untransfected or transfected with LSD1 siRNA or scramble RNA, were incubated in 5 or 20 mM glucose for 4 days. (a) H3K4me2, (b) H3K4me1, and (c) H3K4me3 at Gclc-ARE4 were quantified by ChIP. The q-PCR value of each immunoprecipitate was normalized to the input samples using the ddCt method. Input represents Gclc-ARE4 region abundance in the total genomic DNA without ChIP. (d) Gene transcripts of KDM5A were quantified by q-PCR using β-actin as a housekeeping gene. (e) The JARID demethylase activity kit from Epigentek was used to fluorimetrically measure H3K4me3 demethylating activity in 2–5 mg of nuclear fraction. Results are presented as the mean ± SD from three or four experiments, each experiment performed in duplicate. 5mM and 20mM, cells incubated in 5 or 20 mM glucose medium for 4 days, si-L and SC, cells incubated in 20 mM glucose after being transfected with LSD1 siRNA or scramble RNA, respectively; 20–5, cells incubated in 20 mM glucose for 4 days followed by 5 mM glucose for 4 additional days; and Mann, cells incubated in 20 mM mannitol. *p < 0.05 and #p < 0.05 compared to the values obtained from untransfected cells incubated in 5 or 20 mM glucose, respectively.
Whereas demethylation of H3K4me2 is mediated by LSD1, KDM5A demethylates H3K4me3 [26], and here we show that in the same preparations, mRNA of KDM5A and its demethylating activity were significantly increased (Fig. 4d and e). To confirm the role of LSD1 in the regulation of Gclc, the cells transfected with LSD1 siRNA were used. Regulation of LSD1 by its siRNA, however, further increased H3K4me2 at Gclc-ARE4, but prevented the decrease in H3K4me1 at Gclc-ARE4 (p < 0.05; Fig. 4), and the values obtained from the cells transfected with scramble RNA were significantly different from those obtained from cells transfected with LSD1 siRNA. Incubation of cells in 20 mM mannitol, instead of 20 mM glucose, had no effect of histone modifications at Gclc-ARE4.
To investigate the role of H3K4 methylation in the regulation of binding of Nrf2 at Gclc-ARE4, the protein–DNA complex obtained from LSD1 siRNA-transfected cells was precipitated for Nrf2, and Gclc was quantified by q-PCR. The binding of Nrf2 at Gclc-ARE4 was also significantly decreased by high glucose exposure (Fig. 5a). However, regulation of LSD1 prevented this decrease in Nrf2 binding, suggesting an important role for chromatin condensation–decondensation in the regulation of the Nrf2–Gclc cascade. In the same LSD1 siRNA cells, the glucose-induced decrease in Gclc mRNA was also ameliorated (Fig. 5b).
Fig. 5.
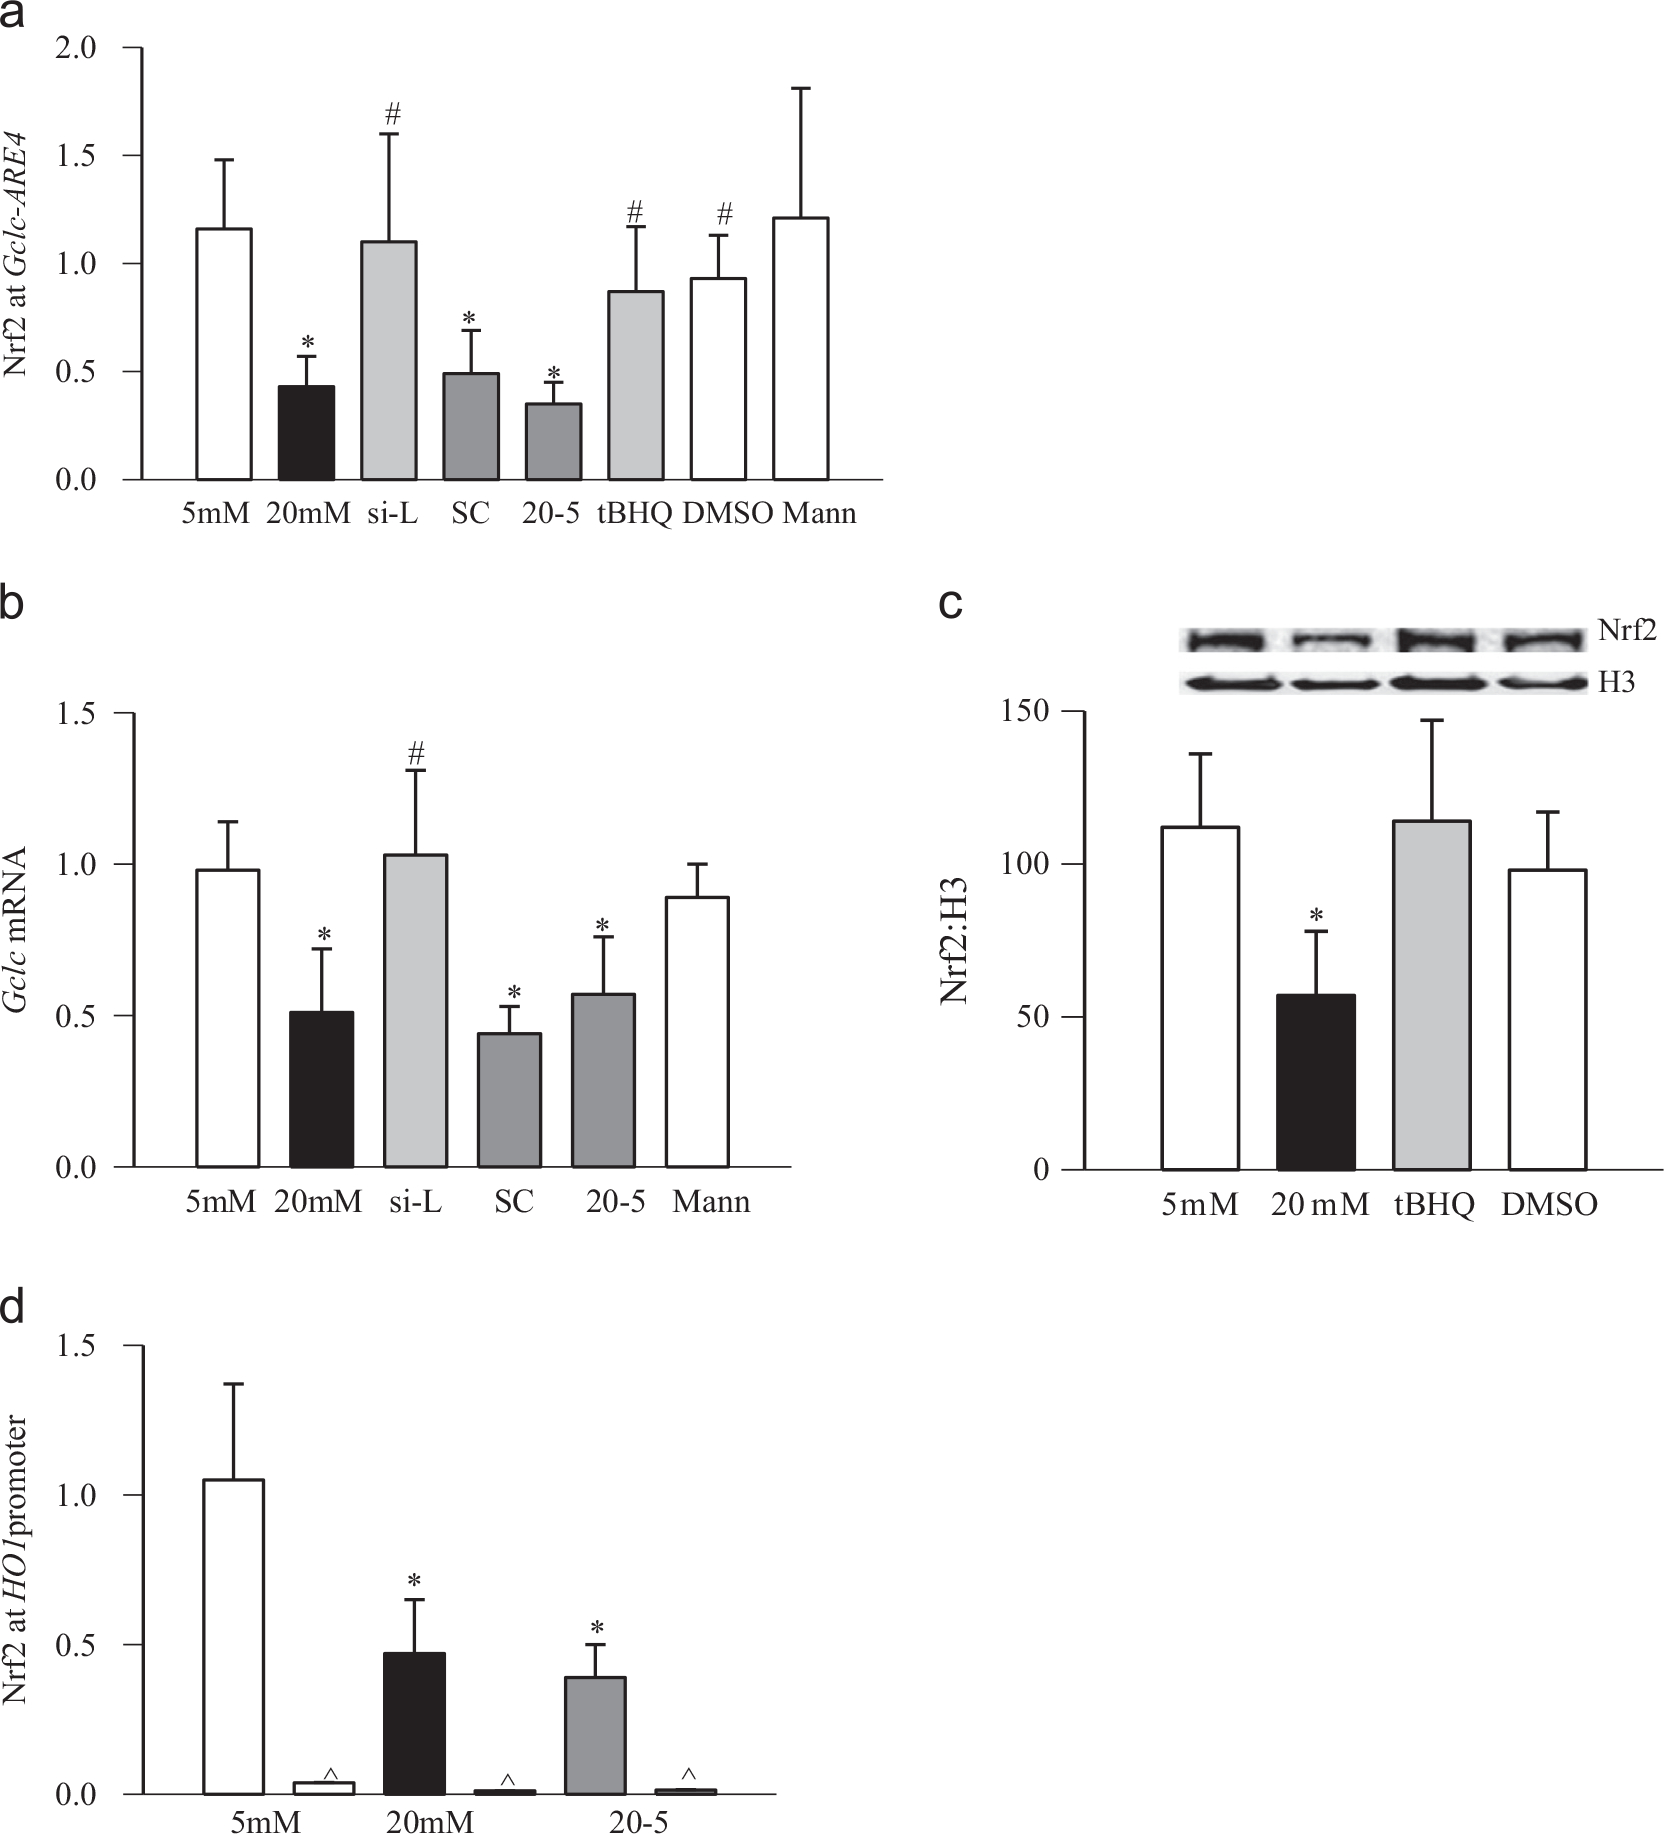
Effect of regulation of LSD1 on glucose-induced Nrf2 at Gclc-ARE4 and HO1 in retinal endothelial cells. (a) Nrf2 at Gclc-ARE4 was quantified in retinal endothelial cells transfected with LSD1 siRNA or scramble RNA, or untransfected cells exposed to tBHQ, by amplifying the ARE4 region in the precipitated DNA. (b) Gene expression of Gclc was quantified by q-PCR using β-actin as a housekeeping gene. (c) Nrf2 accumulation was quantified in the nuclear fraction by Western blot using histone H3 as a loading control. (d) Nrf2 at HO1 was quantified by amplifying the HO1 promoter region in the precipitated DNA. Each measurement was made in duplicate in three or four cell preparations. The values obtained from cells incubated in 5 mM glucose are considered as 1. 5mM and 20mM, cells incubated in 5 or 20 mM glucose medium for 4 days; si-L and SC, cells incubated in 20 mM glucose after being transfected with LSD1 siRNA or scramble RNA, respectively; tBHQ and DMSO, cells preincubated with 15 μM tBHQ or 0.001% DMSO, respectively, for 24 h and exposed to 20 mM glucose for 4 days; 20–5, cells incubated in 20 mM glucose for 4 days followed by 5 mM glucose for 4 additional days; and Mann, cells incubated in 20 mM mannitol. *p < 0.05 and #p < 0.05 compared to the values obtained from untransfected cells incubated in 5 or 20 mM glucose, respectively.
Because high glucose also decreases the nuclear translocation of Nrf2 [9], to further confirm the role of epigenetic modifications in the decreased Nrf2 binding at Gclc-ARE, the effects of tBHQ on Nrf2 binding at Gclc-ARE4 and nuclear transport of Nrf2 were examined. As shown in 5a, activation of Nrf2 by tBHQ ameliorated glucose-induced decrease in Nrf2 binding at Gclc-ARE4. In the same cell preparations, tBHQ also increased nuclear localization of Nrf2, compared to the cells incubated in high glucose alone (Fig. 5c). However, as observed in rat retina in diabetes, high glucose also decreased binding of Nrf2 at the HO1 promoter (Fig. 5d).
The role of epigenetic modifications at Gclc-ARE4 in the metabolic memory was also confirmed in retinal endothelial cells; the levels of H3K4me2 remained elevated at Gclc-ARE4 and those of H3H4me3 and H3K4me1 decreased, further confirming the role of histone methylation in the metabolic memory phenomenon (Fig. 4a–c). The gene transcripts and enzyme activity of H3K4me3 demethylating enzyme remained elevated (Fig. 4d and e). Nrf2 at Gclc-ARE4 continued to be compromised even after 4 days of normal glucose, which had followed 4 days of high-glucose exposure, Gclc remained subnormal (Fig. 5). Consistent with the results from rat retina, reversal of high-glucose insult did not ameliorate decreased DNA binding activity of Nrf2 (Fig. 6a), and Nrf2 mRNA levels remained elevated (Fig. 6b). The values obtained from cells in the 20–5 group were not different from those obtained from the cells exposed to continuous high glucose for 8 days, but were significantly different compared to those obtained from the cells incubated in continuous normal glucose.
Fig. 6.
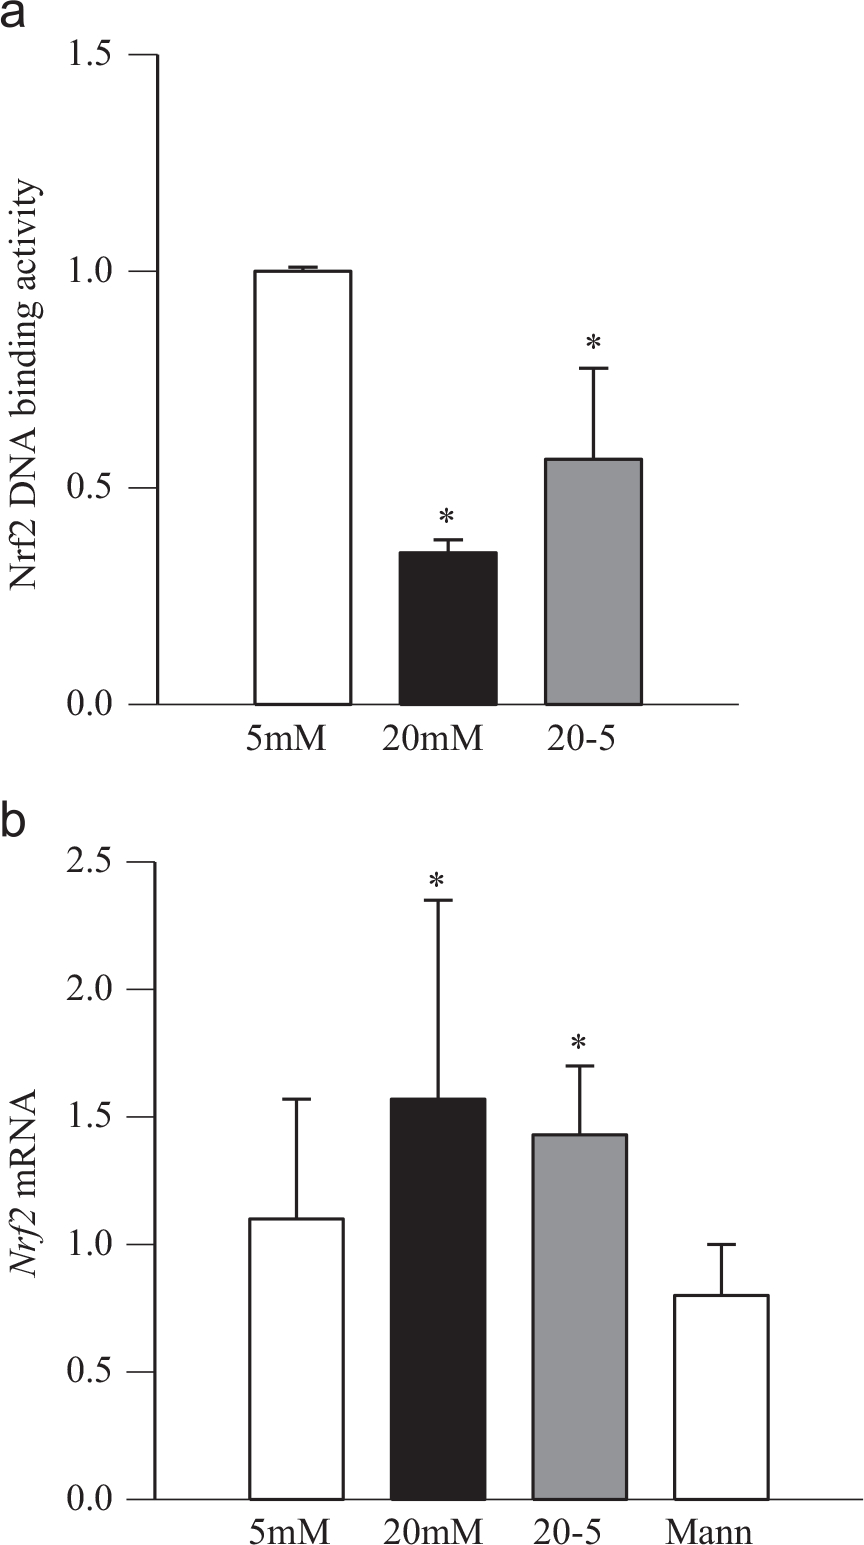
Reversal of high-glucose insult and Nrf2. Retinal endothelial cells were analyzed for (a) Nrf2 DNA binding activity by an ELISA-based method by quantifying nuclear Nrf2 bound to the Nrf2-ARE DNA sequence. (b) Gene expression of Nrf2 was quantified by SYBR green-based q-PCR using β-actin as a housekeeping gene. Fold change was normalized to the values of normal control using the ddCt method. Values obtained from the cells incubated in 5 mM glucose were considered as 1. 5mM and 20mM, cells incubated in 5 or 20 mM glucose; 20–5, cells incubated in 20 mM glucose for 4 days followed by 5 mM glucose for 4 additional days; and Mann, cells incubated in 20 mM mannitol. *p < 0.05 compared to the values obtained from untransfected cells incubated in 5 mM glucose.
Please note that the extension of duration of continuous 20 mM glucose from 4 to 8 days did not produce any significant effects on the methylation status of H3K4 or Nrf2 at Gclc-ARE4, and the values obtained from 8 days incubation were similar to those obtained from 4 days incubation (p > 0.05).
Human retina
Because retinal mRNA levels of GCLC are decreased in the human donors with diabetic retinopathy [9], to further confirm the role of histone methylation at GCLC-ARE4 in diabetic retinopathy, H3K4me3 was quantified at GCLC-ARE4 in the retina from human donors with documented diabetic retinopathy. Fig. 7a shows over 80% decrease in H3K4me3 at retinal GCLC-ARE4 compared to age-matched nondiabetic donors. For control, the products produced by IgG in these retinal samples from nondiabetic and diabetic donors were less than 1%. The specificity of the proteins binding to GCLC-ARE4 was further confirmed in the same ChIP DNA by amplifying off-target primers and performing conventional PCR. As shown in Fig. 7b, H3K4me3 at GCLC-ARE4 was decreased in diabetes, and H3K4me3 at the off-target region was negligible. The input DNA, which was obtained before ChIP, had similar abundance of GCLC-ARE4 in both nondiabetic and diabetic samples. In the same samples, the levels of retinal histone demethylating enzyme KDM5A were also increased (Fig. 7c).
Fig. 7.
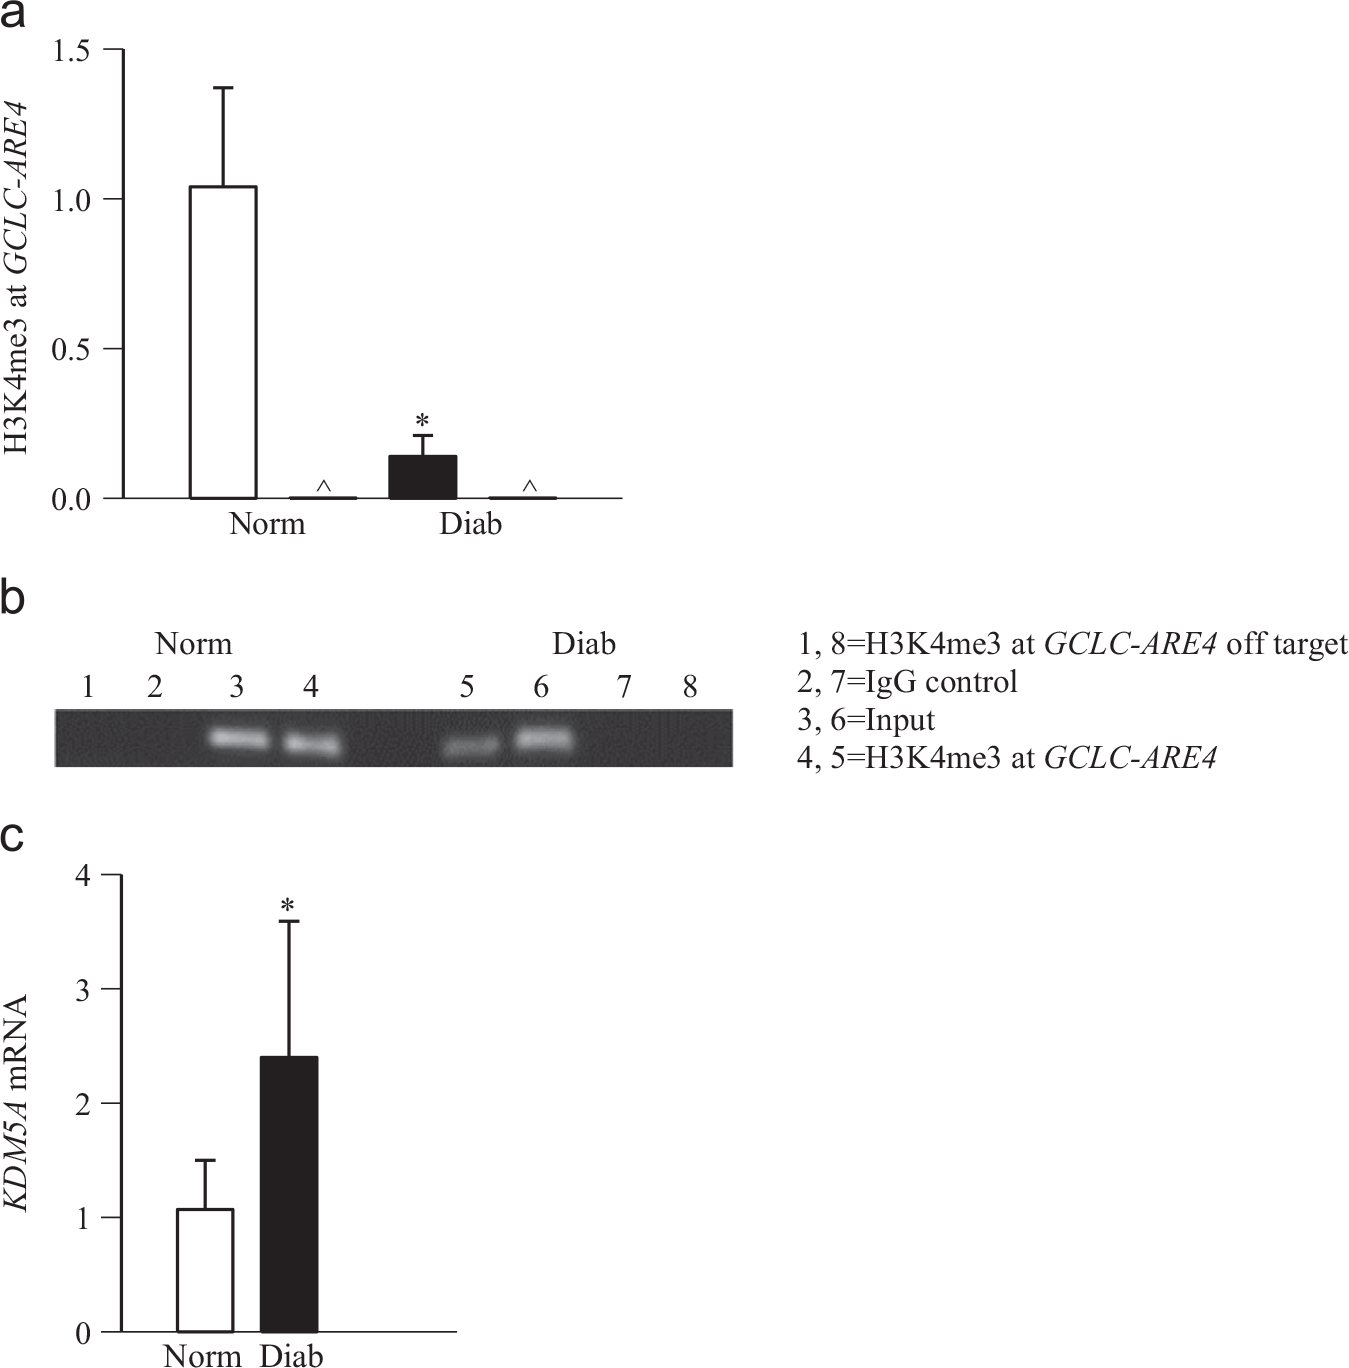
H3K4me3 at GCLC-ARE4 in the retina from human donors with diabetic retinopathy. (a) H3K4me3 at GCLC-ARE4 was quantified by ChIP in the retina from diabetic donors with documented retinopathy and from age-matched nondiabetic donors. Normal IgG was used as a negative antibody control for ChIP and is labeled as ∧ (b) To verify the specificity of the ChIP assay, semiquantitative PCR was performed. The crosslinked retina was immunoprecipitated with anti-H3K4me3 or IgG, and the precipitated DNA was amplified for the GCLC-ARE4 region or the off-target region. Input represents GCLC-ARE4 in the DNA without ChIP. (c) KDM5A mRNA was quantified by q-PCR using human-specific primers and β-actin as a housekeeping gene. Values are presented as the mean ± SD from four to six donors in each group. Norm, nondiabetic donors; Diab, donors with diabetic retinopathy. Lanes 1–4, retina from nondiabetic donors and 5–8, retina from donors with diabetic retinopathy. *p < 0.05 compared to the values obtained from age-matched nondiabetic donors.
Discussion
The diabetic environment increases oxidative stress in the retina by increasing the production of oxidants and decreasing their removal, and oxidative stress is considered to play a major role in the development of diabetic retinopathy [5–7,40]. GSH levels are decreased in the retina in diabetes, and the enzymes responsible for its biosynthesis and redox cycling become dysfunctional [2,4,9]. Nrf2 is considered one of the major transcription factors regulating GSH homeostasis, and it achieves this by modulating its de novo synthesis [10–12,14,41]. Our recent studies have shown that despite increased gene expression of Nrf2 in the retina in diabetes, its accumulation in the nucleus is decreased, resulting in its decreased DNA transcriptional activity and binding at Gclc-ARE4 [9]. Although diabetes decreased Nrf2 binding at Gclc-ARE4 by over 75%, the decrease in nuclear accumulation of Nrf2 was <50%, suggesting that there could be additional mechanisms responsible for decreased binding of Nrf2 at Gclc-ARE4. In this study we demonstrate that the histone modifications at Gclc-ARE4 have a major role in the impaired Nrf2 binding at Gclc-ARE4. We show that under hyperglycemic conditions, H3K4 methylation is altered at Gclc-ARE4, whereas H3K4me2 is increased, and H3K4me1 and H3K4me3 are decreased in the retina and its endothelial cells. The role of histone methylation at Gclc-ARE4 in diabetic retinopathy is further confirmed in the retinas from human donors with documented diabetic retinopathy. In addition to the effect of hyperglycemia on altered histone methylation at Gclc-ARE4, the results show the role of histone methylation in the metabolic memory phenomenon associated with diabetic retinopathy; termination of hyperglycemic insult does not reverse diabetes-induced alterations in the methylation status of H3K4 at Gclc-ARE4, and Gclc transcripts continue to be subnormal with impaired Nrf2 binding at Gclc-ARE4. These results clearly suggest the role of epigenetic modification at Gclc-ARE4 in diabetes-induced increased oxidative stress in the development of retinopathy and in the metabolic memory phenomenon associated with its progression.
The transcription factor Nrf2 is constitutively expressed in almost all tissues, and via binding to upstream sequences of the promoter region, it regulates the transcription of a number of antioxidant genes including NAD(P)H quinone oxidoreductase, HO1, and Gclc [42,43]. The efficiency of transcription factor binding and activation of the transcription process is partially controlled by chromatin condensation and decondensation, and chromatin remodeling is carried out by covalent modifications of histones [44,45]. Histone modifications, including acetylation and methylation, play fundamental roles in most biological processes that are involved in the manipulation and expression of many genes. Lysine on histones can be mono-, di-, or trimethylated, and depending on the site and the extent of methylation, lysine methylation could activate or repress gene transcription [16,18]. Both H3K4me2 and H3K4me3 peak at the transcription start site, and whereas H3K4me3 is generally associated with active transcription, H3K4me2 could repress gene expression [22,23]. Diabetes favors many such modifications in the retina [24,25,34,35]. Our results show that H3K4me1 and H3K4me3 are decreased at Gclc-ARE4; however, H3K4me2 is increased; this increase in H3K4me2 could possibly be due to increased demethylation of H3K4me3. Because LSD1 cannot remove methyl groups from the trimethylated lysine of H3K, we also investigated the status of KDM5A, an H3K4me3 demethylase, and the results show that in the same samples KDM5A is increased. However, when LSD1 is regulated by its siRNA, despite further increase in H3K4me2 at Gclc-ARE4, the decrease in H3K4me1 is ameliorated. This is accompanied by an increase in Nrf2 binding at Gclc-ARE4 and amelioration of the decrease in Gclc gene transcripts. The reason for such increase in H3K4me2 is not clear, but could be that in diabetes, activated KDM5A demethylates H3K4me3, resulting in increased H3K4me2, which is then demethylated to H3K4me1 by LSD1. However, when LSD1 is inhibited, demethylation of H3K4me2 is decreased, further increasing H3K4me2 levels. Because the binding of Nrf2 at the enhancer region of Gclc regulates its transcription, and in diabetes, this binding is decreased in the retina [9], our results showing altered histone methylation at Gclc-ARE4 strongly suggest that epigenetic modifications at Gclc-ARE4 (methylation status of H3K4) play an important role in the regulation of Gclc. We have also shown that human donors with diabetic retinopathy have decreased GCLC transcripts [9], and our results demonstrate that they have decreased H3K4me3 at GCLC-ARE4 and increased KDM5A, further strengthening the role of histone methylation in the regulation of Gclc-ARE4. However, we recognize that Nrf2 is an antioxidant-defense transcriptional factor, and under oxidative stress conditions it translocates to the nucleus to induce defensive genes. But, in diabetes, despite increased retinal Nrf2 expression (mRNA and protein), the levels of Nrf2 in the nucleus remain subnormal, and owing to altered methylation status, its binding with Gclc-ARE4 is decreased. Stimulation of Nrf2 by tBHQ, in addition to ameliorating the glucose-induced decrease in Gclc transcription [9], also prevented the decrease in Nrf2 binding at Gclc-ARE4 and its nuclear accumulation. These results clearly raise the possibility that epigenetic modifications of Gclc-ARE4 and nuclear transport of Nrf2 both play important roles in the regulation of Nrf2-mediated antioxidant response.
Seminal epidemiological studies have clearly demonstrated that despite long-term good glycemic control, prior poor glycemic control remains a risk factor for vascular complications, including retinopathy [27], and a similar phenomenon is well documented in both animal and cell models [24,25,28,29,34,38,46]. Our previous studies have shown that the retina continues to experience increased oxidative stress with dysfunctional mitochondrial subnormal intracellular antioxidant levels [29,34,38,47]. As a diabetic environment is implicated in the alteration of transcription programs in target cells, the role of epigenetic modifications in the regulation of transcriptional activity is now being appreciated as these modifications allow the cells to respond to changing environmental stimuli and to memorize these changes [16,17,30,32]. Recent studies have suggested their role in the metabolic memory phenomenon associated with microvascular complications of diabetes [24,25,30,32–37]. Reversal of poor glycemic control by good glycemic control in rats does not remove the retinal epigenetic modifications, and the enzymes responsible for acetylation of histones and methylation of histones and DNA continue to be abnormal [24,25,33–35]. Furthermore, we have shown that diabetes-induced alterations in the methylation of retinal Sod2 and MMP-9, and LSD1, remain unchanged even after the hyperglycemic insult is terminated. Here, our data show that 3 months of good glycemic control after 3 months of poor control provides no beneficial effects to the methylation of Gclc-ARE4; H3K4me2 continues to be increased and H3K4me3 and H3K4me1 decreased, suggesting the role of histone modifications at Gclc-ARE4 in the metabolic memory phenomenon. The role of epigenetic modifications at Gclc-ARE4 in the metabolic memory phenomenon is further strengthened by continued increase in the demethylation enzymes LSD1 and KDM5A and also by our previous work showing continued decreased levels of retinal GSH [29]. In addition, good glycemic control after a period of poor control in rats fails to provide any benefit to the histopathology associated with diabetic retinopathy [29,34,38,47]. In contrast, if good control is initiated soon after induction of diabetes, the methylation status of Gclc-ARE4 and binding of Nrf2 also remain similar to those observed in age-matched normal rats, suggesting that the modifications at Gclc-ARE4 are not affected by the high dose of insulin administered to maintain rats under good control. Consistent with this, the expression of Gclc and Nrf2-DNA binding activity also remain similar to normal, and their retinal vasculature shows no significant increase in capillary cell apoptosis compared to the age-matched normal control rats [29,38,48].
In conclusion, we show that in diabetes, histone modifications of Gclc, an enzyme responsible for maintaining homeostasis of the intracellular antioxidant status, impair its binding with Nrf2, resulting in subnormal GSH biosynthesis. LSD1 plays an important role in epigenetically modifying Gclc, and the process continues even after termination of hyperglycemic insult, suggesting their roles in both the development of diabetic retinopathy and the metabolic memory phenomenon. Thus, regulation of histone modifications could help restore GSH homeostasis and inhibit the development/progression of this devastating disease, which a diabetic patient fears the most.
Acknowledgments
We thank Doug Putt and Dr. Mangayarkarasi Thandampallayam for technical assistance. This study was supported in part by grants to R.A.K. from the National Institutes of Health (EY014370, EY017313, and EY022230), Juvenile Diabetes Research Foundation (5–2012–313), and Thomas Foundation and unrestricted funds to the Department of Ophthalmology from Research to Prevent Blindness.
References
- [1].Baynes JW Role of oxidative stress in development of complications in diabetes. Diabetes 40:405–412; 1991. [DOI] [PubMed] [Google Scholar]
- [2].Kowluru RA; Kern TS; Engerman RL Abnormalities of retinal metabolism in diabetes or experimental galactosemia. IV. Antioxidant defense system. Free Radic. Biol. Med. 22:587–592; 1997. [DOI] [PubMed] [Google Scholar]
- [3].Brownlee M The pathobiology of diabetic complications: a unifying mechanism. Diabetes 54:1615–1625; 2005. [DOI] [PubMed] [Google Scholar]
- [4].Kern TS; Kowluru R; Engerman RL Abnormalities of retinal metabolism in diabetes or galactosemia: ATPases and glutathione. Invest. Ophthalmol. Visual Sci. 35:2962–2967; 1994. [PubMed] [Google Scholar]
- [5].Kowluru RA; Tang J; Kern TS Abnormalities of retinal metabolism in diabetes and experimental galactosemia. VII. Effect of long-term administration of antioxidants on the development of retinopathy. Diabetes 50:1938–1942; 2001. [DOI] [PubMed] [Google Scholar]
- [6].Kowluru RA Diabetic retinopathy, oxidative stress and antioxidants. Curr. Top. Nutraceutical Res. 3:209–218; 2005. [Google Scholar]
- [7].Kowluru RA Mitochondria damage in the pathogenesis of diabetic retinopathy and in the metabolic memory associated with its continued progression. Curr. Med. Chem. 20:3226–3233; 2013. [DOI] [PMC free article] [PubMed] [Google Scholar]
- [8].Kowluru RA; Chan PS Oxidative stress and diabetic retinopathy. Exp. Diabetes Res. 2007:43603; 2007. [DOI] [PMC free article] [PubMed] [Google Scholar]
- [9].Zhong Q; Mishra M; Kowluru RA Transcription factor Nrf2-mediated antioxidant defense system in the development of diabetic retinopathy. Invest. Ophthalmol. Visual Sci. 54:3941–3948; 2013. [DOI] [PMC free article] [PubMed] [Google Scholar]
- [10].Kensler TW; Wakabayashi N; Biswal S Cell survival responses to environmental stresses via the Keap1–Nrf2–ARE pathway. Annu. Rev. Pharm. Toxicol. 47:89–116; 2007. [DOI] [PubMed] [Google Scholar]
- [11].Lu SC Regulation of glutathione synthesis. Mol. Aspects Med. 30:42–59; 2009. [DOI] [PMC free article] [PubMed] [Google Scholar]
- [12].Erickson AM; Nevarea Z; Gipp JJ; Mulcahy RT Identification of a variant antioxidant response element in the promoter of the human glutamate–cysteine ligase modifier subunit gene: revision of the ARE consensus sequence. J. Biol. Chem. 277:30730–30737; 2002. [DOI] [PubMed] [Google Scholar]
- [13].Lu SC Glutathione synthesis. Biochim. Biophys. Acta 1830:3143–3153; 2013. [DOI] [PMC free article] [PubMed] [Google Scholar]
- [14].Mulcahy RT; Wartman MA; Bailey HH; Gipp JJ Constitutive and beta-naphthoflavone-induced expression of the human gamma-glutamylcysteine synthetase heavy subunit gene is regulated by a distal antioxidant response element/TRE sequence. J. Biol. Chem. 272:7445–7454; 1997. [DOI] [PubMed] [Google Scholar]
- [15].Jaenisch R; Bird A Epigenetic regulation of gene expression: how the genome integrates intrinsic and environmental signals. Nat. Genet. 33:245–254; 2003. [DOI] [PubMed] [Google Scholar]
- [16].Bird A DNA methylation patterns and epigenetic memory. Genes Dev. 16:6–21; 2002. [DOI] [PubMed] [Google Scholar]
- [17].Gibney ER; Nolan CM Epigenetics and gene expression. Heredity (Edinburgh) 105:4–13; 2010. [DOI] [PubMed] [Google Scholar]
- [18].Stower H Epigenetics: dynamic DNA methylation. Nat. Rev. Genet. 13:75; 2011. [DOI] [PubMed] [Google Scholar]
- [19].Klose RJ; Zhang Y Regulation of histone methylation by demethylimination and demethylation. Nat. Rev. Mol. Cell Biol. 8:307–318; 2007. [DOI] [PubMed] [Google Scholar]
- [20].Lan F; Nottke AC; Shi Y Mechanisms involved in the regulation of histone lysine demethylases. Curr. Opin. Cell Biol. 20:316–325; 2008. [DOI] [PMC free article] [PubMed] [Google Scholar]
- [21].Sims RJ; Reinberg D Histone H3 Lys 4 methylation: caught in a bind? Genes Dev. 20:2779–2786; 2006. [DOI] [PubMed] [Google Scholar]
- [22].Shilatifard A Molecular implementation and physiological roles for histone H3 lysine 4 (H3K4) methylation. Curr. Opin. Cell Biol. 20:341–348; 2008. [DOI] [PMC free article] [PubMed] [Google Scholar]
- [23].Kaelin WG Jr.; McKnight SL Influence of metabolism on epigenetics and disease. Cell 153:56–69; 2013. [DOI] [PMC free article] [PubMed] [Google Scholar]
- [24].Zhong Q; Kowluru RA Epigenetic modification of Sod2 in the development of diabetic retinopathy and in the metabolic memory: role of histone methylation. Invest. Ophthalmol. Visual Sci. 54:244–250; 2013. [DOI] [PMC free article] [PubMed] [Google Scholar]
- [25].Zhong Q; Kowluru RA Regulation of matrix metalloproteinase-9 by epigenetic modifications and the development of diabetic retinopathy. Diabetes 62:2559–2568; 2013. [DOI] [PMC free article] [PubMed] [Google Scholar]
- [26].Chicas A; Kapoor A; Wang X; Aksoy O; Evertts AG; Zhang MQ; et al. H3K4 demethylation by Jarid1a and Jarid1b contributes to retinoblastoma-mediated gene silencing during cellular senescence. Proc. Natl. Acad. Sci. USA 109:8971–8976; 2012. [DOI] [PMC free article] [PubMed] [Google Scholar]
- [27].Diabetes Control and Complications Trial/Epidemiology of Diabetes Interventions and Complications Research Group. Retinopathy and nephropathy in patients with type 1 diabetes four years after a trial of intensive therapy. N. Engl. J. Med. 342:381–389; 2000. [DOI] [PMC free article] [PubMed] [Google Scholar]
- [28].Engerman RL; Kern TS Progression of incipient diabetic retinopathy during good glycemic control. Diabetes 36:808–812; 1987. [DOI] [PubMed] [Google Scholar]
- [29].Kowluru RA Effect of re-institution of good glycemic control on retinal oxidative stress and nitrative stress in diabetic rats. Diabetes 52:818–823; 2003. [DOI] [PubMed] [Google Scholar]
- [30].Villeneuve LM; Reddy MA; Lanting LL; Wang M; Meng L; Natarajan R Epigenetic histone H3 lysine 9 methylation in metabolic memory and inflammatory phenotype of vascular smooth muscle cells in diabetes. Proc. Natl. Acad. Sci. USA 105:9047–9052; 2008. [DOI] [PMC free article] [PubMed] [Google Scholar]
- [31].Szyf M; Meaney MJ Epigenetics, behaviour, and health. Allergy Asthma Clin. Immunol. 4:37–49; 2008. [DOI] [PMC free article] [PubMed] [Google Scholar]
- [32].Villeneuve LM; Reddy MA; Natarajan R Epigenetics: deciphering its role in diabetes and its chronic complications. Clin. Exp. Pharm. Physiol. 38:401–409; 2011. [DOI] [PMC free article] [PubMed] [Google Scholar]
- [33].Zhong Q; Kowluru RA Role of histone acetylation in the development of diabetic retinopathy and the metabolic memory phenomenon. J. Cell. Biochem. 110:1306–1313; 2010. [DOI] [PMC free article] [PubMed] [Google Scholar]
- [34].Zhong Q; Kowluru RA Epigenetic changes in mitochondrial superoxide dismutase in the retina and the development of diabetic retinopathy. Diabetes 60:1304–1313; 2011. [DOI] [PMC free article] [PubMed] [Google Scholar]
- [35].Tewari S; Zhong Q; Santos JM; Kowluru RA Mitochondria DNA replication and DNA methylation in the metabolic memory associated with continued progression of diabetic retinopathy. Invest. Ophthalmol. Visual Sci. 53:4881–4888; 2012. [DOI] [PMC free article] [PubMed] [Google Scholar]
- [36].Jayaraman S Epigenetic mechanisms of metabolic memory in diabetes. Circ. Res. 110:1039–1041; 2012. [DOI] [PubMed] [Google Scholar]
- [37].Keating ST; El-Osta A Epigenetic changes in diabetes. Clin. Genet. 84:1–10; 2013. [DOI] [PubMed] [Google Scholar]
- [38].Kowluru RA; Chan PS Metabolic memory in diabetes—from in vitro oddity to in vivo problem: role of apoptosis. Brain Res. Bull. 87:297–302; 2010. [DOI] [PMC free article] [PubMed] [Google Scholar]
- [39].Zhong Q; Kowluru RA Diabetic retinopathy and damage to mitochondrial structure and transport machinery. Invest. Ophthalmol. Visual Sci. 52:8739–8746; 2011. [DOI] [PMC free article] [PubMed] [Google Scholar]
- [40].Kowluru RA; Kanwar M Oxidative stress and the development of diabetic retinopathy: contributory role of matrix metalloproteinase-2. Free Radic. Biol. Med. 46:1677–1685; 2009. [DOI] [PMC free article] [PubMed] [Google Scholar]
- [41].Niture SK; Khatri R; Jaiswal AK Regulation of Nrf2—an update. Free Radic. Biol. Med. 66:36–44; 2014. [DOI] [PMC free article] [PubMed] [Google Scholar]
- [42].Jain AK; Bloom D; Jaiswal AK Nuclear import and export signals in control of Nrf2. J. Biol. Chem. 280:29158–29168; 2005. [DOI] [PubMed] [Google Scholar]
- [43].Aleksunes LM; Manautou JE Emerging role of Nrf2 in protecting against hepatic and gastrointestinal disease. Toxicol. Pathol. 35:459–473; 2007. [DOI] [PubMed] [Google Scholar]
- [44].Saha A; Wittmeyer J; Cairns BR Chromatin remodelling: the industrial revolution of DNA around histones. Nat. Rev. Mol. Cell. Biol. 7:437–447; 2006. [DOI] [PubMed] [Google Scholar]
- [45].Strahl BD; Allis CD The language of covalent histone modifications. Nature 403:41–45; 2000. [DOI] [PubMed] [Google Scholar]
- [46].Roy S; Sala R; Cagliero E; Lorenzi M Overexpression of fibronectin induced by diabetes or high glucose: phenomenon with a memory. Proc. Natl. Acad. Sci. USA 87:404–408; 1990. [DOI] [PMC free article] [PubMed] [Google Scholar]
- [47].Madsen-Bouterse SA; Mohammad G; Kanwar M; Kowluru RA Role of mitochondrial DNA damage in the development of diabetic retinopathy, and the metabolic memory phenomenon associated with its progression. Antioxid. Redox Signaling 13:797–805; 2010. [DOI] [PMC free article] [PubMed] [Google Scholar]
- [48].Kowluru RA; Kanwar M; Kennedy A Metabolic memory phenomenon and accumulation of peroxynitrite in retinal capillaries. Exp. Diabetes Res. 2007:2196; 2007. [DOI] [PMC free article] [PubMed] [Google Scholar]