Abstract
Defining drivers of tumor initiation can provide opportunities to control cancer progression. Here, we report that lysophosphatidic acid receptor 4 (LPAR4) becomes transiently upregulated on pancreatic cancer cells exposed to environmental stress or chemotherapy where it promotes stress tolerance, drug resistance, self-renewal, and tumor initiation. Pancreatic cancer cells gain LPAR4 expression in response to stress by downregulating a tumor suppressor, miR-139-5p. Even in the absence of exogenous LPA, LPAR4-expressing tumor cells display an enrichment of extracellular matrix (ECM) genes that are established drivers of cancer stemness. Mechanistically, upregulation of fibronectin via a LPAR4/AKT/CREB axis is indispensable for LPAR4-induced tumor initiation and stress tolerance. Moreover, ligation of this fibronectin containing matrix via integrins α5β1 or αVβ3 can transfer stress tolerance to LPAR4-negative cells. Therefore, stress- or drug-induced LPAR4 enhances cell-autonomous production of a fibronectin-rich ECM, allowing cells to survive “isolation stress” and compensate for the absence of stromal-derived factors by creating their own tumor-initiating niche.
Introduction
Tumor-initiating cells (TIC) are significant contributors to tumor growth, recurrence, and metastatic spread by virtue of their capacity to overcome various forms of stress1, 2. Such features are not only derived from intrinsic stem-like traits but can be influenced by tumor stroma-derived immune cell factors within a cancer stem cell (CSC) niche3. One such factor is lysophosphatidic acid 4, a bioactive lipid that regulates cell fate transitions for a variety of stem cell types, including CSCs5, 6.
We are particularly interested in how TIC properties may fluctuate in response to external cues7, such as changes in vascularization that impact oxygenation and access to nutrients, or application of therapeutic pressures designed to eliminate vulnerable populations of tumor cells. At the earliest stage of tumor formation or during seeding of metastatic cells in distant organs, individual tumor cells must overcome the challenging consequences of isolation-induced stresses such as hypoxia, nutrient deprivation, and oxidative stress, while compensating for the loss of matrix adhesion, cell-cell contact, or immune cell and stromal-produced survival factors8, 9. While TIC may inherently possess resistance to such stresses, we considered whether non-TIC may undergo adaptive reprogramming to overcome isolation stress and thereby gain tumor initiating properties.
Pancreatic cancer is a lethal cancer that is notoriously resilient to therapy due in part to poor vascularization and dense stroma in the tumor microenvironment10. LPA and the enzyme that produces LPA, autotaxin, are particularly enriched in pancreatic cancer11, 12, which can exploit LPA produced by neighboring pancreatic stellate cells to drive ductal adenocarcinoma (PDAC) growth in vivo12. Functions of the six G-protein coupled LPA receptors (LPAR1–6) do not appear to overlap in pancreatic cancer cells. LPAR1 promotes cell migration and metastasis13, 14, while LPAR2 suppresses migration15. Interestingly, LPAR4 suppresses mobility in PANC1 cells16, but is also necessary for cardiac dedifferentiation and heart tissue repair17, suggesting a context-dependent role.
Here, we discovered that LPAR4 becomes upregulated by the stress-induced loss of a tumor suppressive microRNA (miRNA) and is capable of conferring TIC properties, stress tolerance, and drug resistance. Mechanistically, LPAR4 expression endows solitary tumor cells with the ability to create their own fibronectin-containing niche to support tumor initiation. The molecular basis for this adaptive reprogramming mechanism may provide therapeutic opportunities to slow pancreatic cancer progression and sensitize tumors to therapeutic intervention.
Results
Pancreatic cancer cells upregulate LPAR4 in response to stress
Tumor cells must overcome various stressors during tumor initiation and progression, including hypoxia, nutrient stress, loss of adhesion, oxidative stress, and therapeutic stress. Given the role of autotaxin/LPA in pancreatic cancer progression18, we asked whether one or more LPA receptor(s) are linked to tumor initiation. To create tumor growth conditions that would selectively favor the survival of TIC in vivo, nu/nu mice received a subcutaneous injection of 300 pancreatic cancer cells, a cell number we established produces palpable tumors in approximately 50% of the injection sites after 14 days (Fig. 1a). Compared to an injection of 1 million cells resulting in tumor growth at all injection sites, we propose that tumors formed from a limiting number of cells creates a state of “isolation stress” that highlights the contribution of tumor initiating and/or self-renewing cells. Among the six LPA receptors, only LPAR4 was enriched in isolation-stressed tumors formed by 300 cells (Fig. 1a–1b). Interestingly, LPAR4 expression was significantly higher in early-stage (Day 20) lesions vs. established (Day 35) tumors (Fig. 1c), indicating that LPAR4 is transiently expressed when tumor cells are experiencing “isolation stress” but downregulated as tumors become established. Compared with cells grown in 2D adherent culture conditions, LPAR4 mRNA was highly enriched in the self-renewing cells that form secondary tumor spheres (Fig. 1d). Thus, LPAR4 is upregulated under in vitro and in vivo conditions that enrich for TIC.
Fig. 1: Pancreatic cancer cells selectively upregulate LPAR4 in response to isolation stress.
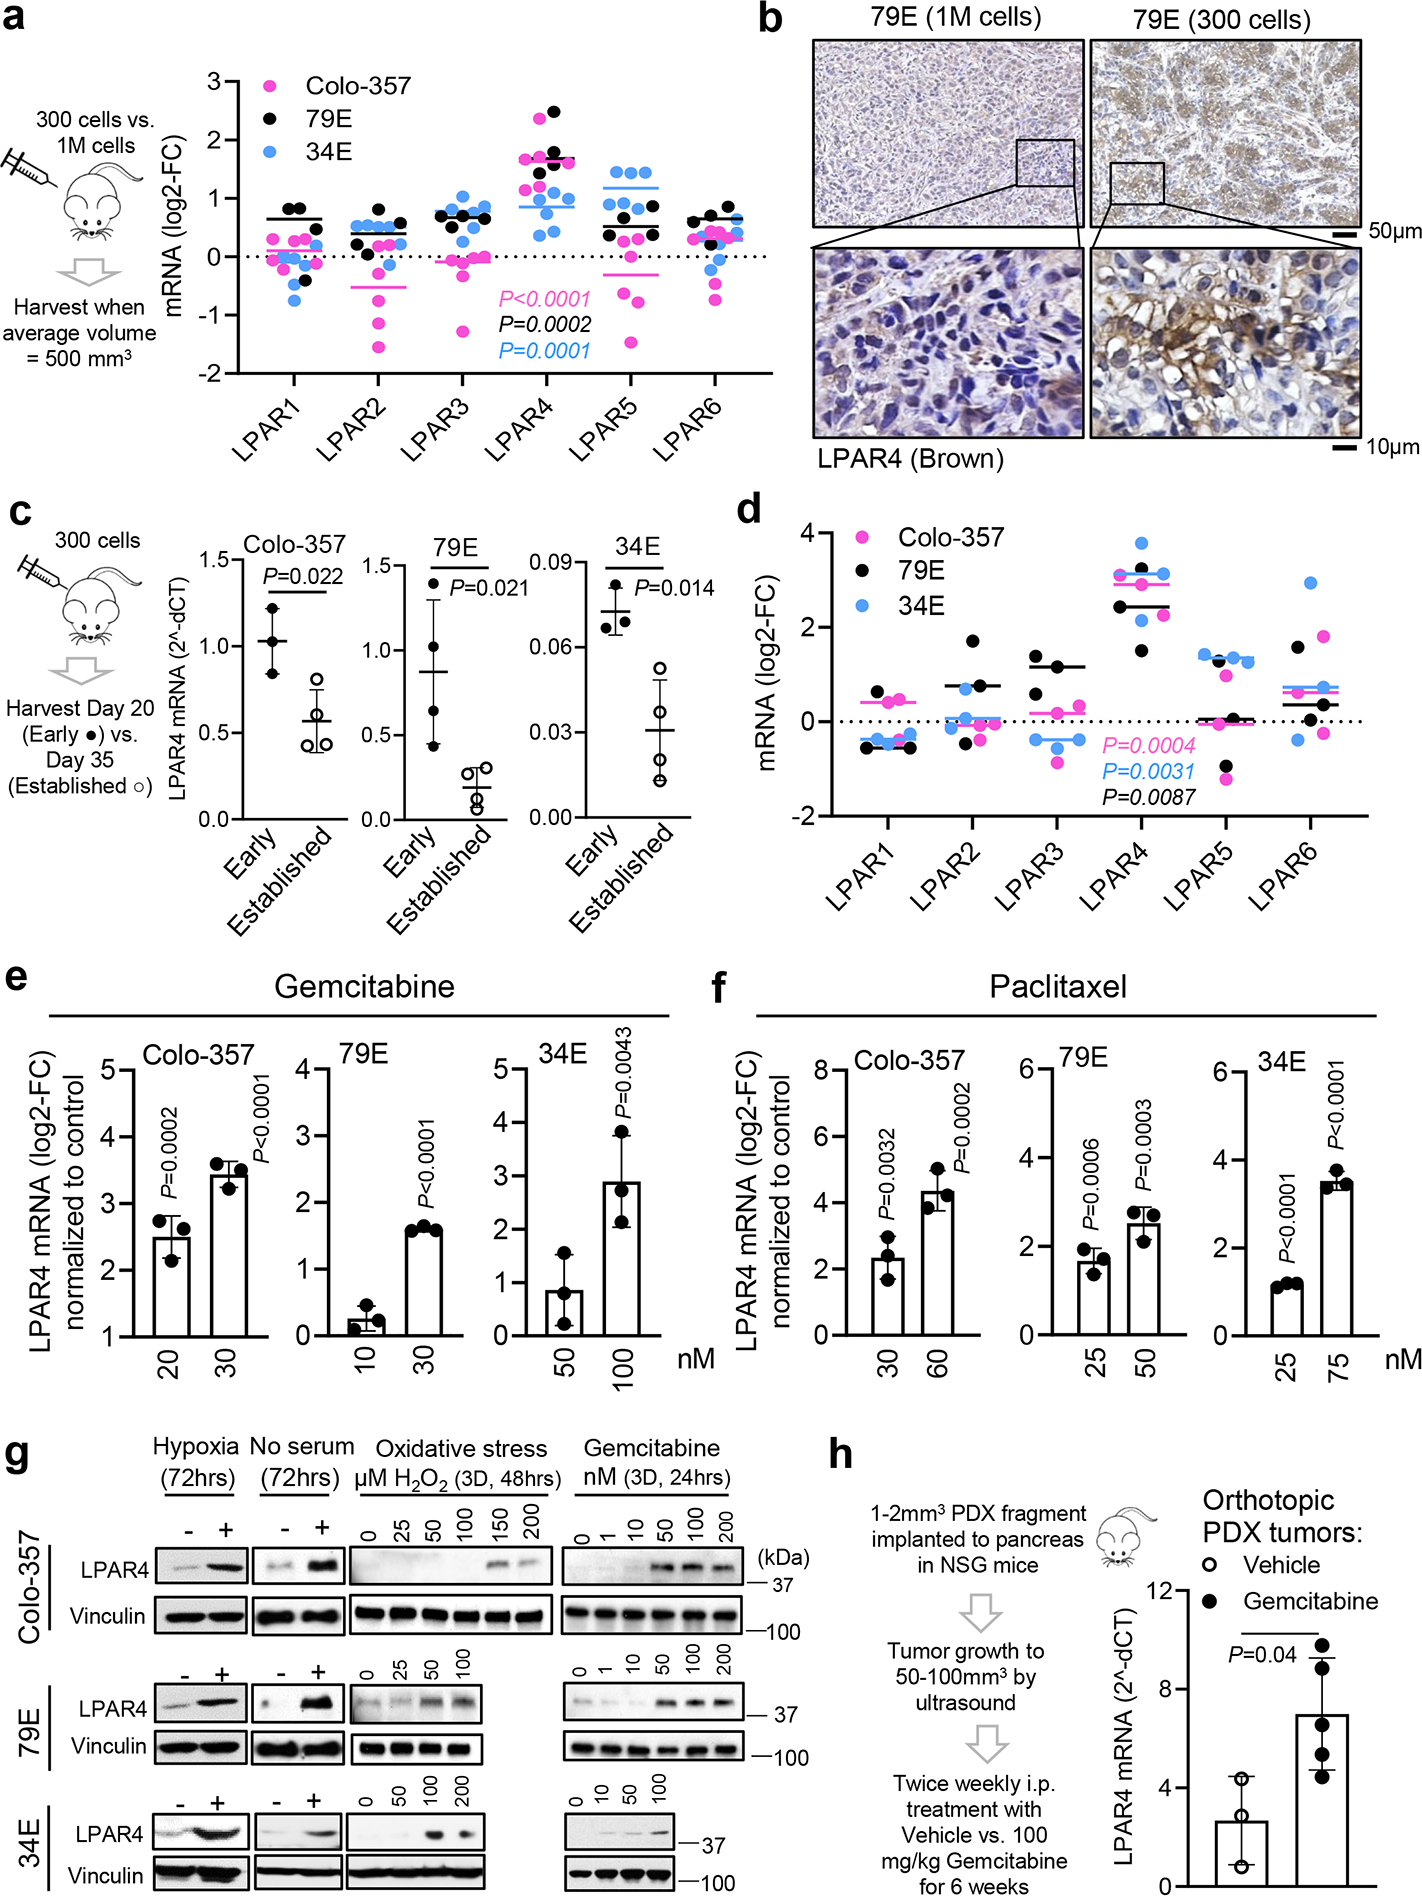
a, Log2 fold change (log2-FC) for all LPARs mRNA expression in “self-renewing” tumors formed by subcutaneous injection of 300 cells of Colo-357 (pink dots, n=6 biologically independent samples), 79E (black dots, n=4 biologically independent samples), or 34E (blue dots, n=6 biologically independent samples) with respect to “bulk” tumors formed by injection of 1 million cells of Colo-357 (n=6 biologically independent samples), 79E (n=6 biologically independent samples), or 34E (n=5 biologically independent samples). b, Representative images of immunohistochemistry staining of LPAR4 in 79E xenograft tumors derived from 1M cells (n=5 biologically independent samples) or 300 cells (n=4 biologically independent samples). Scale bar is 50 μm or 10 μm as indicated. c, Relative LPAR4 mRNA level (normalized to housekeeping genes) in xenograft tumors harvested at early time point (day 20, early lesions,) vs. late time point (day 35, established tumors,). Data are mean ± s.d. (n=3, 4, 3 biologically independent samples from early lesions for Colo-357, 79E, 34E cells, respectively; n=4 biologically independent samples from established tumors for all three cell lines). d, All LPARs mRNA expression in cells grown as secondary tumorspheres with respect to cells grown in 10% serum on 2D (n=3 independent experiments for each line). e-f, LPAR4 mRNA level in cells treated with various doses of gemcitabine or paclitaxel, relative to cells treated with vehicle control. Data are mean ± s.d. (n = 3 independent experiments). g, LPAR4 protein expression in cells treated with different stress as indicated. Data are representative of three independent experiments. h, Experimental flow showing the procedure of patient-derived xenograft (PDX) implantation to the pancreas of NSG mice following by treatment with vehicle or gemcitabine in vivo up to 6 weeks. Bar graph showing relative LPAR4 mRNA expression in PDXs treated with vehicle or gemcitabine. Data are mean ± s.d.(n=3 biologically independent samples for vehicle control and n= 5 for gemcitabine treated group). Bars represent median value per cell line (a and d). Statistical analyses were performed using two tailed unpaired one sample t-test (a, c-f, and h). Source numerical data and unprocessed blots are available in source data.
We next considered if LPAR4 upregulation represents a general mechanism that pancreatic cancer cells use to overcome the effects of cellular stresses encountered during tumor initiation. Whereas the expression of each LPAR in the absence of stress shows heterogeneity among individual pancreatic cancer cell lines (Extended Data Fig. 1a), subjecting cells to nutrient stress in combination with non-adherent culture conditions selectively upregulated LPAR4 mRNA expression across all cell lines tested (Extended Data Fig. 1b). LPAR4 mRNA and protein expression was selectively induced in cells exposed to various stresses (Extended Data Fig. 1c) or sublethal doses of chemotherapy (Fig. 1e–g and Extended Data Fig. 1d–e). To investigate whether therapeutic stress induces LPAR4 expression in vivo, we orthotopically implanted 1–2mm3 patient-derived xenograft (PDX) tumor fragments into the pancreas of NSG mice. Once each tumor reached 50–100mm3 as evaluated by ultrasound, mice received twice weekly injections of either vehicle or 100 mg/kg gemcitabine. After 6 weeks of treatment, LPAR4 expression was significantly higher in tumors from gemcitabine-treated mice compared to the control group (Fig. 1h). Together, these findings indicate that LPAR4 is a stress responsive gene in pancreatic cancer cells.
LPAR4 is necessary and sufficient to drive tumor initiation
For the TNMplot public dataset19, LPAR4 gene expression was significantly higher in pancreatic adenocarcinoma (PAAD) than in normal pancreas (Fig. 2a). While normal pancreas cores were negative, 6 out of 15 PDAC cores showed a relatively high level LPAR4 expression (Extended Data Fig. 2a). Clinically, the significance of LPAR4, analysis of the TCGA PAAD dataset revealed that high LPAR4 mRNA expression significantly correlated with a shorter relapse free survival (RFS, P=0.017), with a similar trend for overall survival (P=0.18) (Fig. 2b), indicating high LPAR4 expression is associated with worse outcomes in pancreatic adenocarcinoma patients.
Fig. 2: LPAR4 expression in patients with pancreatic cancer and its link to tumor initiation.
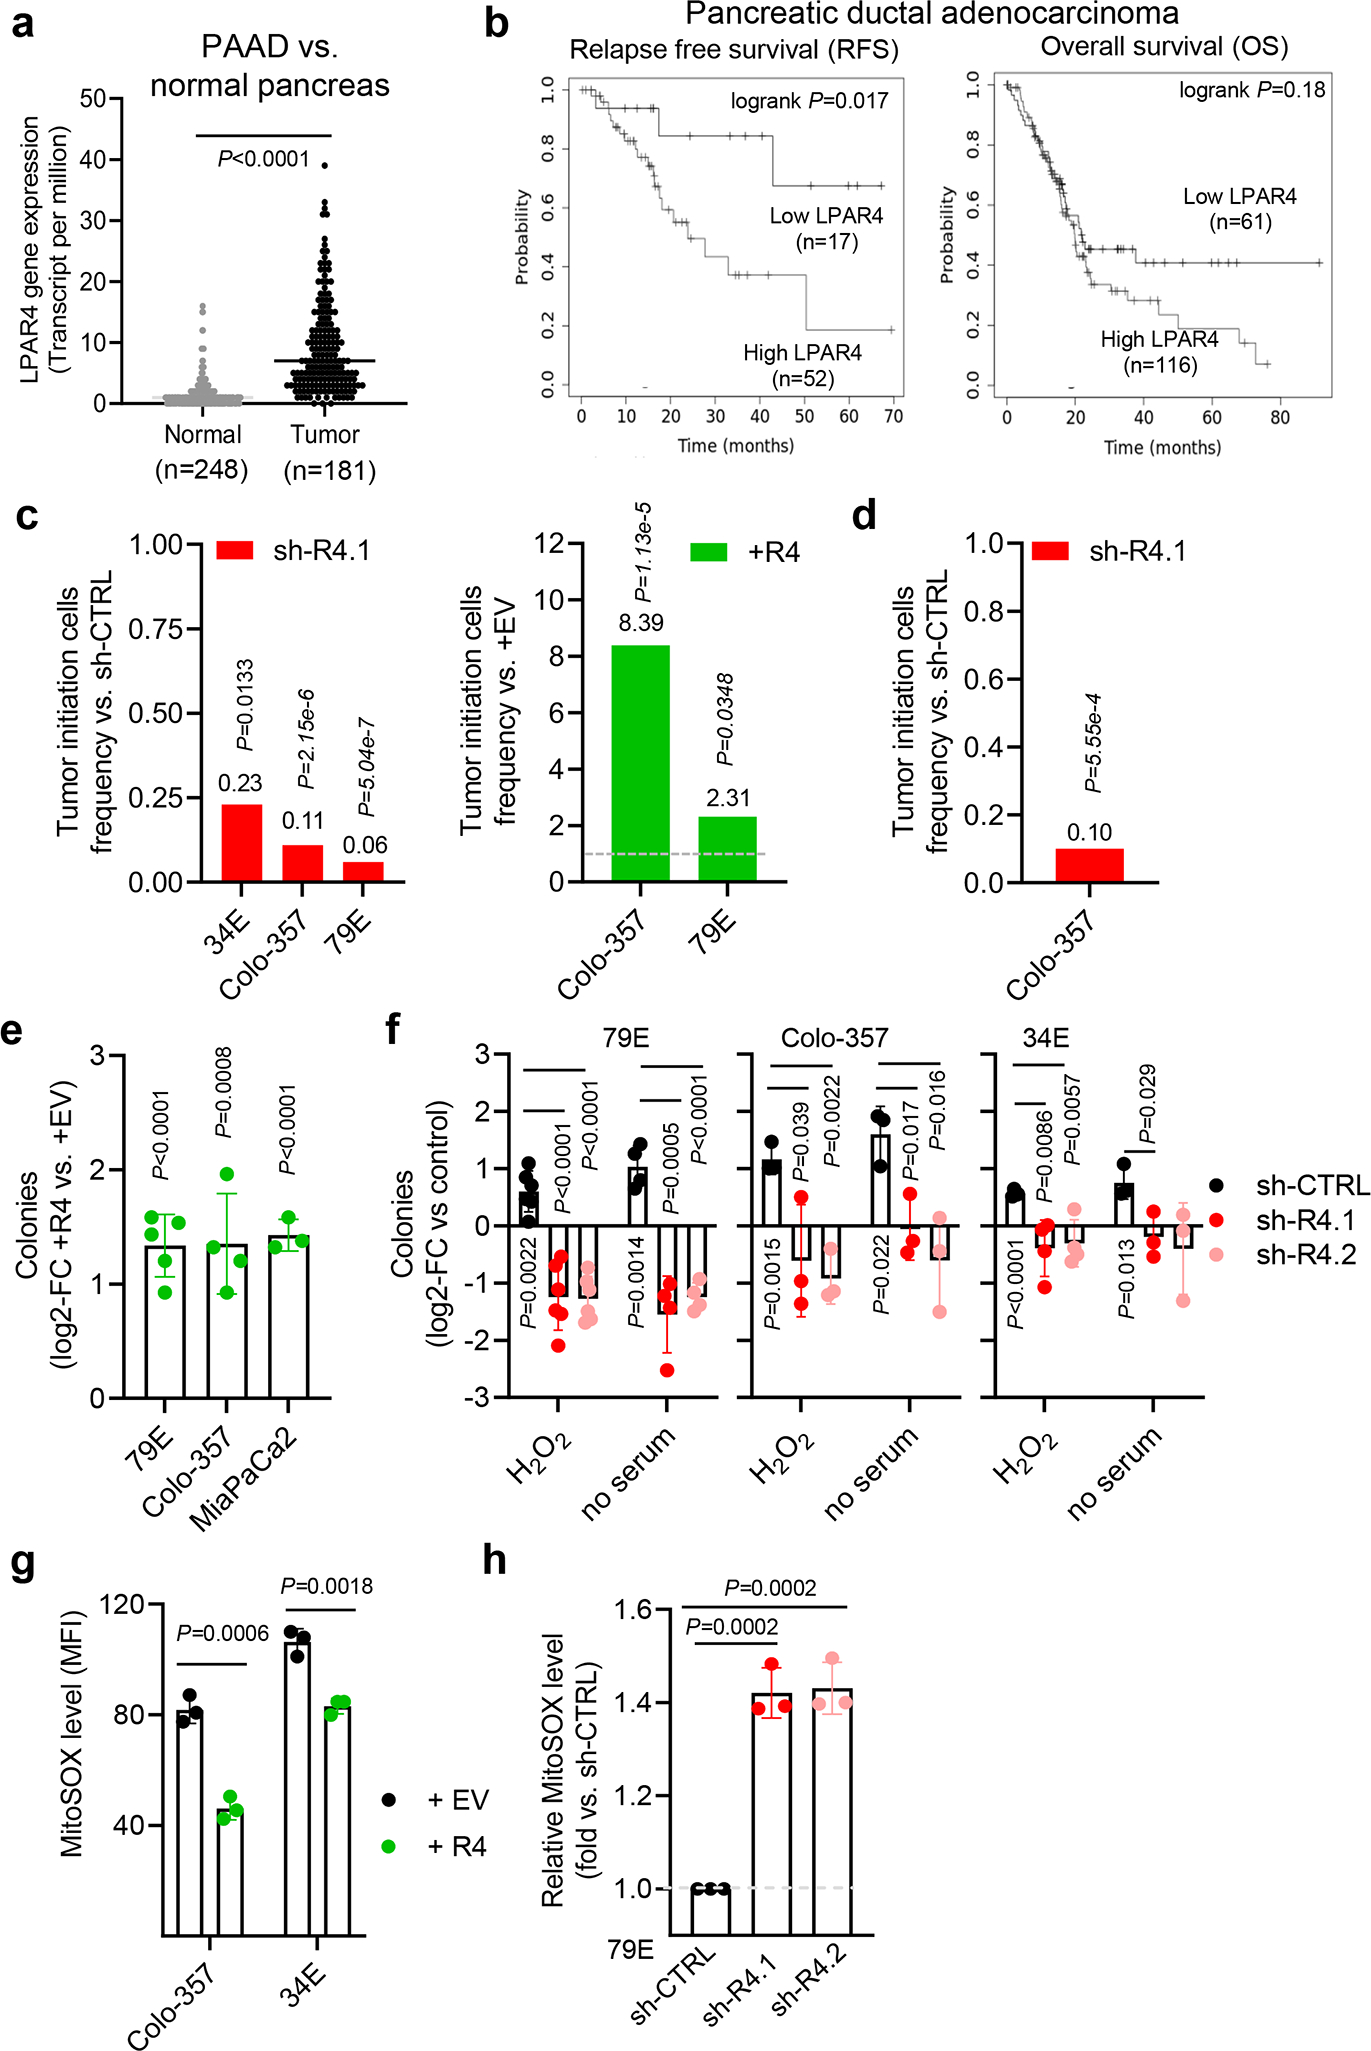
a, TNMplot showing LPAR4 gene expression in pancreatic adenocarcinoma (PAAD) and normal pancreas. Bars represent median value for each group. b, Relapse-free and overall survival for patients with low vs. high LPAR4 expression in the TCGA PAAD dataset. c, In a subcutaneous tumor model, tumor initiating cells frequency (TIC) (95% interval) between control cells and LPAR4 expression manipulated cells was calculated using ELDA software. P-values were obtained by Pearson’s chi-squared two-tailed test. d, In an orthotopic tumor model, tumor initiating cells frequency (TIC) (95% interval) between Colo-357-sh-CTRL+luciferase cells and Colo-357-sh-R4.1+luciferase cells was calculated using ELDA software. P-values were obtained by Pearson’s chi-squared two-tailed test. e, Effect of ectopic LPAR4 expression on tumorsphere formation for cells grown in methylcellulose media, plotted as fold change relative to cells expressing the empty vector control. Data are mean ± s.d. (n=3, 4, 5 independent experiments for MiaPaCa2, Colo-357, and 79E cells, respectively). f, Fold change for the number of colonies for each group relative to control (no stress). Data are mean ± s.d.(n=5 independent experiments for 79E treated with H2O2 and n=4 for 79E cells treated with serum deprivation, n=3 independent experiments for both Colo-357 and 34E cells). g, Median fluorescence intensities (MFI) of MitoSOX signaling in +EV or +R4 cells grown in serum-free media for 48 hours. Data are mean ± s.d. (n = 3 independent experiments). h, Relative MFI of MitoSOX signaling in 79E cells stably transfected with sh-CTRL, sh-R4.1, or sh-R4.2 cultured in serum-free media for 48 hours. Data are mean ± s.d. (n = 3 independent experiments). Statistical analyses were performed using two tailed unpaired one sample t-test. Source numerical data are available in source data.
To evaluate the biological significance of LPAR4, we stably knocked down LPAR4 using shRNA (sh-R4) or ectopically expressed LPAR4 (+R4) in multiple pancreatic cancer cell lines and patient-derived xenograft models (Extended Data Fig. 2b). Using a limiting dilution assay to gauge the contribution of LPAR4 to subcutaneous tumor initiation in vivo, TIC frequency was reduced by LPAR4 knockdown and enhanced by ectopic LPAR4 expression (Fig.2c and Supplementary Table 1). Using an orthotopic limiting dilution tumor initiation assay with noninvasive bioluminescence imaging, we similarly found that TIC frequency was 90% lower for cells with LPAR4 knockdown (Fig.2d, Supplementary Table 2, and Extended Data Fig. 2c). While manipulation of LPAR4 expression had no effect on in vitro growth in the absence of stress (Extended Data Fig. 2d–e) or tumor growth in vivo (Extended Data Fig. 2f), ectopic expression of LPAR4 could help cells to overcome the challenge of isolation stress imposed during tumor sphere formation in 3D culture (Fig. 2e). Similarly, forms of stress that induce LPAR4 expression (hydrogen peroxide, serum deprivation) also enhanced tumor sphere formation in an LPAR4-dependent manner (Fig. 2f). As an additional readout for stress tolerance, LPAR4 was both necessary and sufficient to mitigate the accumulation of mitochondrial superoxide (MitoSOX) in cells challenged with serum deprivation stress (Fig. 2g–h). In contrast, knockdown of LPAR1, a constitutively expressed LPAR on Colo-357 pancreatic cancer cells (Extended Data Fig. 1a and Extended Data Fig. 2g), equally impaired cell growth in both 2D and 3D (Extended Data Fig. 2h), suggesting that LPAR1 plays a more generalized role in cell survival or proliferation. Together, these findings demonstrate that pancreatic cancer cells can overcome the growth limiting conditions during tumor initiation and isolation stress by upregulating LPAR4.
Stress suppresses miR-139-5p to release a brake on LPAR4
miRNAs regulate gene expression allowing reprogramming in response to stress or injury20 and contribute to the function of stem-like cells in pancreatic21 and other cancers22. To determine if a miRNA may account for the upregulation of LPAR4 in response to stress, we used multiple miRNA-target prediction tools to generate a list of putative LPAR4-targeting miRNAs and then evaluated how these correspond to survival for the TCGA PAAD dataset. The top hit from this approach was miR-139-5p, for which the median survival of the high cohort (50.1 months) greatly exceeded that for the low cohort (19.9 months) (Supplementary Table 3 and Fig. 3a). Considering that miR-139-5p had been identified as a tumor suppressor in pancreatic cancer23, and since hsa-miR-139-5p was predicted to recognize an 8mer binding sequence on the 3’UTR of the LPAR4 promoter (Fig. 3b), we considered how stress would impact miR-139-5p. Remarkably, multiple stressors upregulated LPAR4 and downregulated miR-139-5p, while another miRNA predicted to bind LPAR4 (miR-138-5p) was not stress-responsive (Fig. 3c). Additionally, self-renewing cells (i.e., secondary spheres) that were enriched for LPAR4 mRNA expression showed a significantly lower level of miR-139-5p, but not miR-138-5p, compared with cells grown under 2D conditions (Fig. 3d). Manipulation of LPAR4 did not alter miR-139-5p levels (Extended Data Fig. 3a), indicating that miR-139-5p is not a downstream target of LPAR4.
Fig. 3: Stress suppresses miR-139-5p to release the brake on LPAR4 expression.
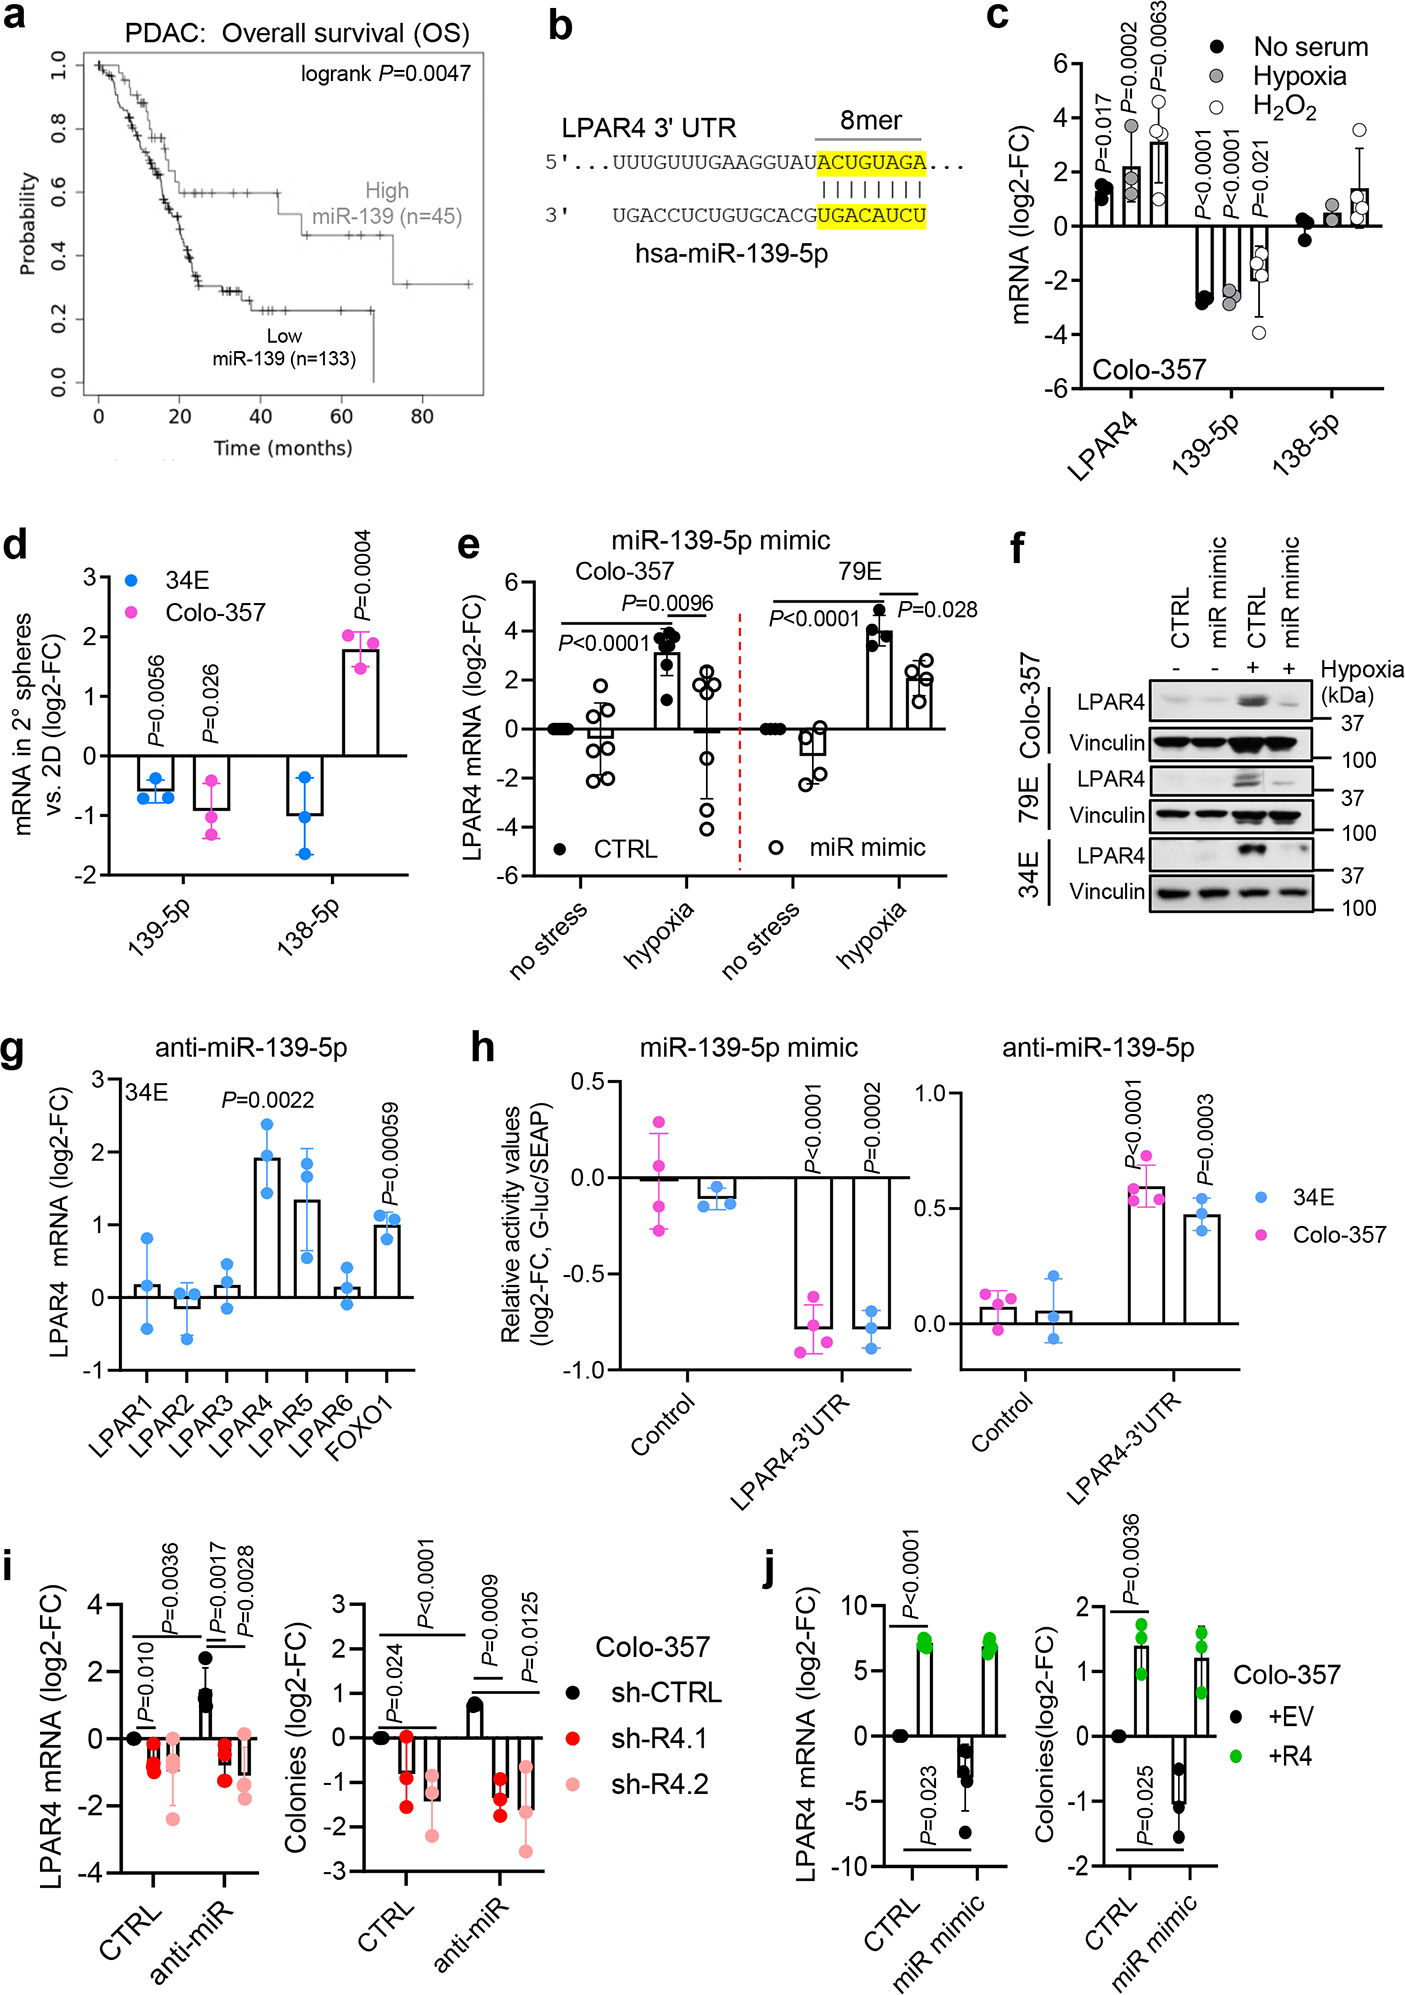
a, Overall survival probability for high vs. low miR-139-5p for the TCGA PAAD dataset. b, Eight oligonucleotides are paired between LPAR4 3’UTR and hsa-miR-139-5p. c, Relative mRNA levels of LPAR4, miR-139-5p, and miR-138-5p in Colo-357 cells treated with serum deprivation stress (n= 3 independent experiments), hypoxia (n=3 independent experiments except n=2 for miR-138-5p), or oxidative stress (n= 4 independent experiments), normalized to cells treated with no stress. d, Relative mRNA levels of miR-139-5p and miR-138-5p in secondary methylcellulose spheres grown from Colo-357 or 34E cells as compared to their expressions in cells grown on 2D. e, Relative mRNA level of LPAR4 in Colo-357 (n=7 independent experiments) or 79E cell lines (n=4 independent experiments) treated with scrambled control miRNA or miR-139-5p mimic in normoxia vs. hypoxia. f, LPAR4 protein level in three cell lines treated with scrambled control miRNA or miR-139-5p mimic in normoxia vs. hypoxia. Data are representative of three independent experiments. g, The mRNA level of LPARs and FOXO1 in 34E cells treated with miR-139-5p inhibitor relative to cells treated with scrambled control (n=3 independent experiments). h, The relative luciferase values in 34E (n=3 independent experiments) or Colo-357 (n=4 independent experiments) treated with miR-139-5p mimic or anti-miR-139-5p, along with their scrambled controls. i, Impact of miR-139-5p inhibitor on the mRNA level of LPAR4 and the number of tumorspheres in Colo-357 cells with or without LPAR4 knockdown (n=3 independent experiments for tumorsphere assay and n=4 for quantitative RT-PCR assay). j, Impact of miR-139-5p mimic on the mRNA level of LPAR4 and on the number of tumorspheres in Colo-357 cells with or without LPAR4 ectopic expression (n=3 independent experiments for tumorsphere assay and n=5 for quantitative RT-PCR assay). Data are presented as mean ± s.d. in c-e and g-i. Statistical analyses were performed using two tailed unpaired one sample t-test (c-e and g-j). Source numerical data and unprocessed blots are available in source data.
Cells were transfected with a miR-139-5p mimic to counteract the downregulation of miR-139-5p during stress. The miR-139-5p mimic prevented hypoxia induced expression of LPAR4 (Fig. 3e–f) while the anti-miR-139-5p inhibitor was sufficient to increase LPAR4 expression in the absence of stress (Fig. 3g and Extended Data Fig. 3b), as well as a known miR-139-5p target, FOXO1 (ref. 24, 25). Using a LPAR4–3’UTR luciferase reporter assay, we observed miR-139-5p direct binding to the LPAR4–3’UTR (Extended Data Fig. 3c), which was decreased by the miR-139-5p mimic and increased by anti-miR-139-5p (Fig. 3h). In unstressed cells, LPAR4 expression and tumorsphere formation that was increased by anti-miR-139-5p could be reversed by shRNA-mediated knockdown of LPAR4 (Fig. 3i and Extended Data Fig. 3d), while ectopic LPAR4 could rescue the inhibitory effect of the miR-139-5p mimic on tumor sphere formation (Fig. 3j). Thus, the effect of miR-139-5p on tumorsphere formation is primarily due to its regulation of LPAR4. In support of this, among several gene targets of miR-139-5p in tumor cells, LPAR4 was the most consistently decreased by the miR-139-5p mimic (Extended Data Fig. 3e). Together, these findings indicate that LPAR4 expression depends on the stress-inducible loss of miR-139-5p expression, revealing the existence of a stress-response pathway that pancreatic cancer cells can use to overcome isolation stress.
LPAR4 gene signature includes ECM-related genes
To further investigate how pancreatic cancer cells utilize LPAR4 to gain stem-like properties, patient-derived 79E pancreatic cancer cells with stable ectopic expression of LPAR4 (+R4) or control cells were treated with or without the canonical LPAR4 ligand, LPA, and then harvested for RNA-seq analysis. As expected, control cells responded to LPA by upregulating a cluster of differentially expressed genes (DEGs) (gene cluster 1) that promote gene ontology (GO) terms such as cell proliferation, growth factor activity, cell-cell signaling, and signal transduction (Fig. 4a). To our surprise, a set of genes (gene cluster 3) were differentially expressed in +R4 cells compared with +EV cells and independent of LPA, notably including multiple GO terms related to extracellular matrix (ECM) proteins and organization (Fig. 4a). The genes in this cluster were validated in 4 paired cell lines using individual qPCR assays (Fig. 4b and Extended Data Fig. 4a). Thus, cells that upregulate LPAR4 gain a subset of pro-tumor functions regardless of their exposure to LPA, supporting the notion that LPAR4 allows cells to overcome isolation stress during tumor initiation when there is limited access to LPA derived from vascular, stromal, or immune cells.
Fig. 4: Differentially expressed genes common to LPAR4-expressing cells and patient tumors include extracellular matrix related genes.
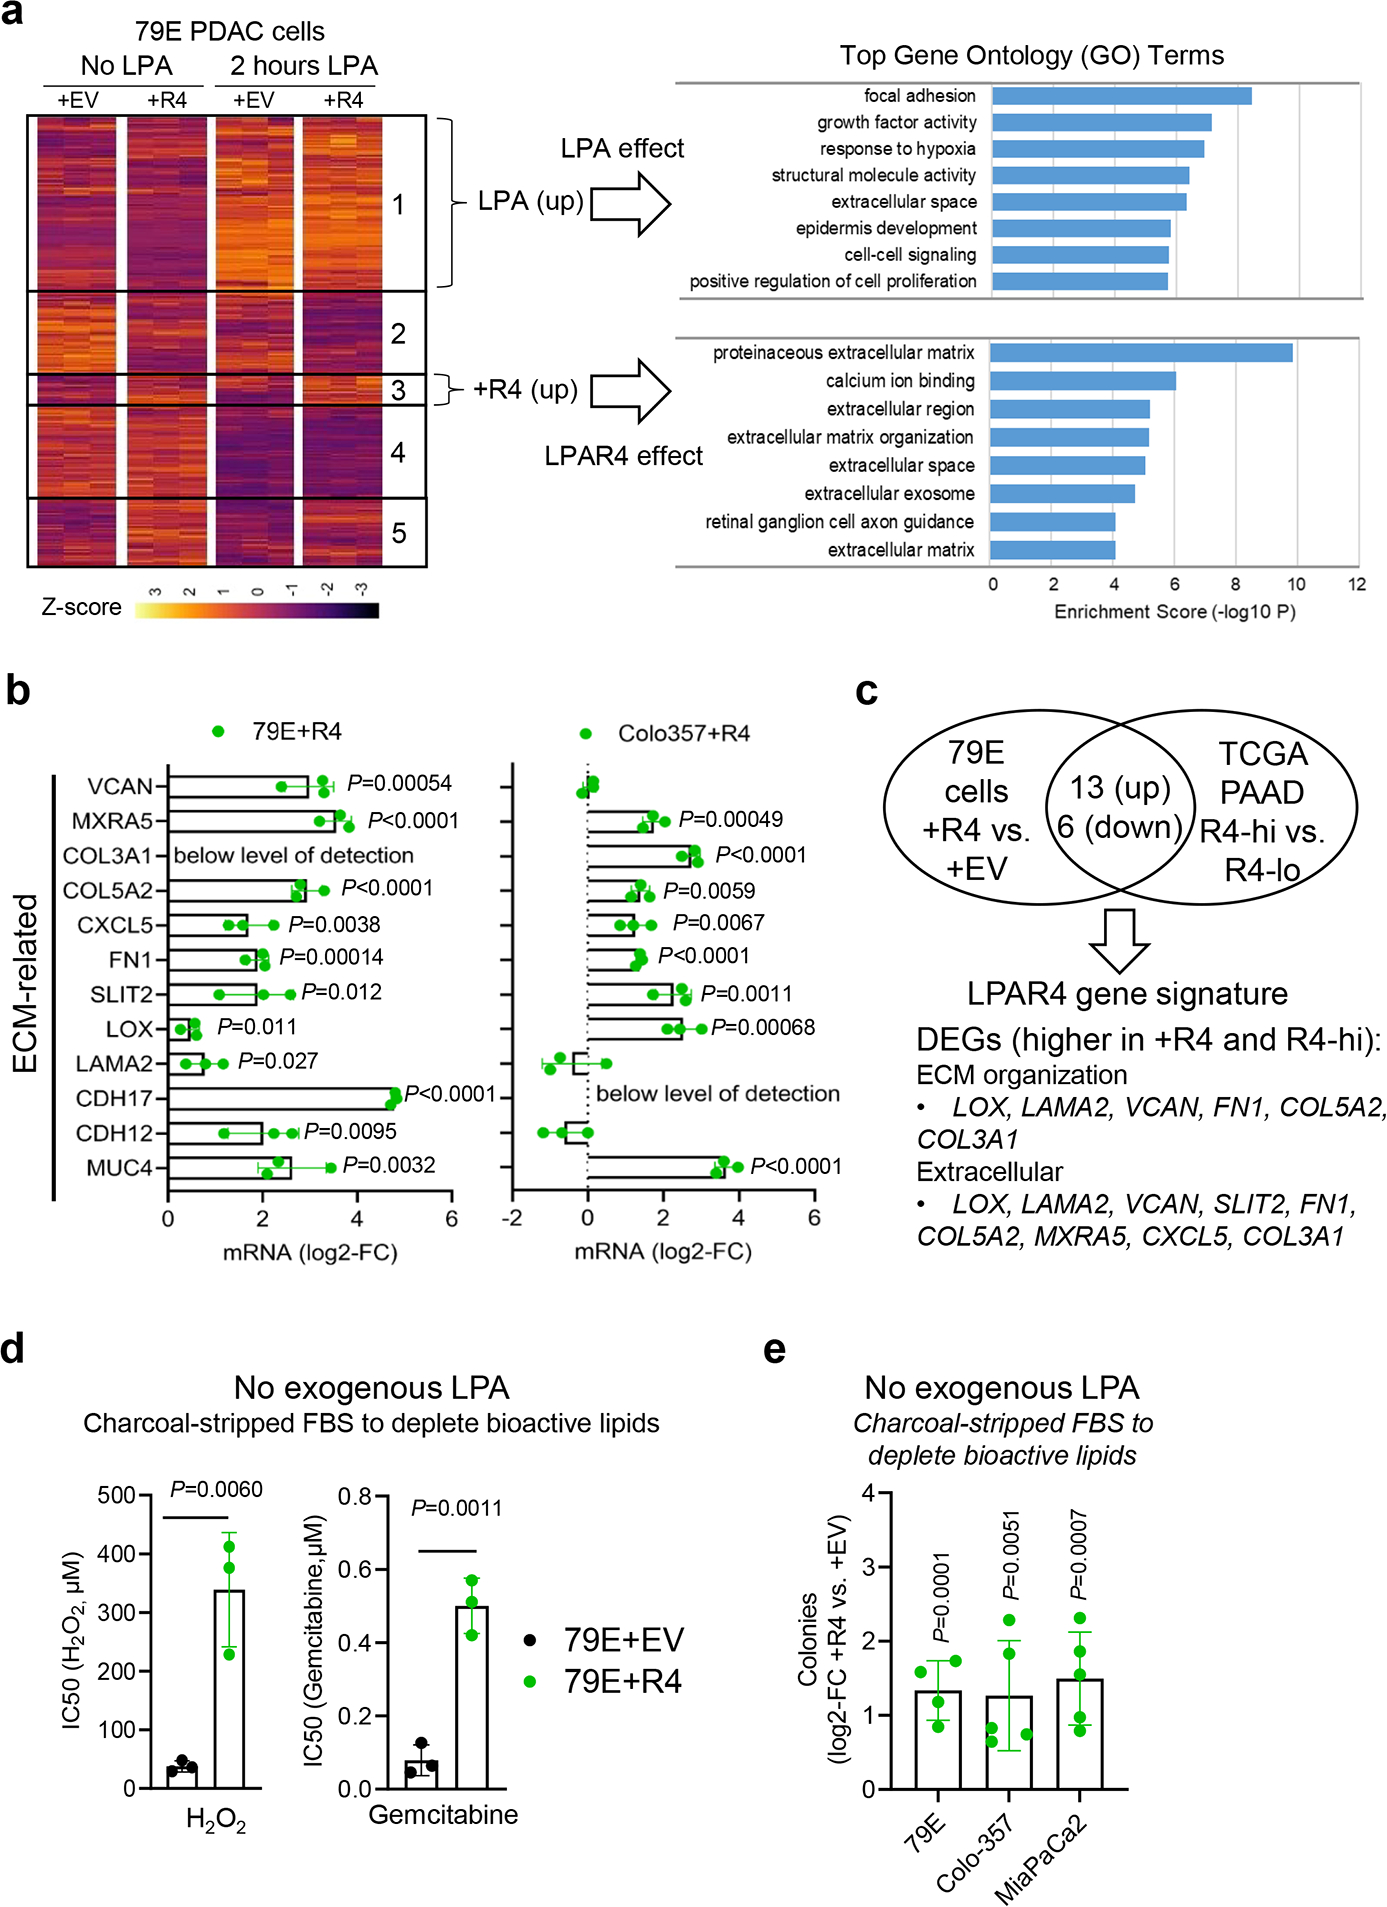
a, Vector control (+EV) cells and LPAR4 (+R4) cells were treated with or without 1 μM LPA for 2 hours. Samples were analyzed by RNA-seq and DEseq2 differential expression analysis was performed. Unsupervised clustering analysis reveals unique sets of differentially expressed genes (DEGs) associated with LPA treatment and LPAR4 expression. Top gene ontology (GO) terms illustrate LPA-induced or LPAR4-induced effect on gene expression. b, Quantitative RT-PCR confirmation of LPAR4 regulated genes associated with ECM in two pairs of +EV vs. +R4 cells, grown in charcoal stripped FBS containing media. All mRNA level was normalized to +EV cells. c, Overlap analysis was performed to identify DEGs that are commonly upregulated or downregulated for 79E+R4 cells and LPAR4-high tumors from the TCGA PAAD dataset. Full list of DEGs that overlap between 79E+R4 cells and TCGA R4-high tumors are shown in Supplementary Table 4. d, Graphs showing IC50 values for H2O2 or Gemcitabine between 79E+EV and 79E+R4 cells, presented as mean± s.d. (n=3 biologically independent experiments), calculated by GraphPad Prime 9. e, Effect of ectopic LPAR4 expression on tumorsphere formation for cells grown in methylcellulose media topped with charcoal stripped FBS containing media, plotted as fold change relative to cells expressing the empty vector control. Data were presented as mean ± s.d. (n=4 independent experiments for 79E cells and n=5 for both Colo-357 and MiaPaCa2). Statistical analyses were performed using two tailed unpaired one sample t-test (b and d-e). Source numerical data are available in source data.
We next performed an overlap analysis to identify DEGs in common between 79E+R4 cells and LPAR4-high patient tumors from the TCGA PAAD dataset (Fig. 4c and Supplementary Table 4). Upregulated DEGs included several ECM genes with documented roles as contributors to pancreatic cancer progression, such as fibronectin (FN1)26. DEGs that were lower in LPAR4+ cells and tumors included the pancreatic lineage marker FOXA3 (ref.27), suggesting that LPAR4 expression was associated with an immature or dedifferentiated phenotype. Notably, the upregulated DEGs were associated with positive hazard ratios (indicating poor relapse free survival) while the downregulated DEGs were associated with negative hazard ratios (Supplementary Table 4). All hazard ratios achieved statistical significance (P<0.05) except as indicated, indicating the genes identified as part of the LPAR4 gene signature play a role in human pancreatic cancer progression.
In line with the observation that the pro-tumor gene signature regulated by LPAR4 does not require exogenous LPA treatment, ectopic expression of LPAR4 allowed cells grown in media containing either charcoal-stripped serum (to deplete bioactive lipids including LPA) or no serum to tolerate higher levels of stress induced by H2O2 or gemcitabine (Fig. 4d and Extended Data Fig. 4b). Similarly, exogenous LPA was not required for the ability of ectopic LPAR4 to promote 3D tumorsphere formation in methylcellulose or suspension culture (Fig. 4e and Extended Data Fig. 4c). Accordingly, expression of the antioxidant gene SOD3 was significantly higher in +R4 cells in the absence of LPA (Extended Data Fig. 4d). Interestingly, 34E+R4 cells had significantly enriched expression of the pancreatic CSC markers PROM1, EPCAM, and CD44, while 79E+R4 cells showed higher expression of ALDH1A1 (Extended Data Fig. 4d), suggesting the phenotype of +R4 cells overlaps to some extent with CSC populations, and this appears to be LPA independent. Together, these findings indicate pancreatic cancer cells that gain LPAR4 can autonomously produce pericellular matrices and acquire properties of TIC. Notably, this appears to occur even when there is limited access to LPA within the surrounding microenvironment, such as one lacking blood vessels, immune cells, or stromal cells which serve as sources of LPA in pancreatic cancer12, 28.
LPAR4 promotes the cell-autonomous production of FN1
ECM proteins have a profound impact on cancer development and progression29. Among the ECM-related genes upregulated by LPAR4, we were especially interested in FN1 because of its links to cancer stemness and tumor initiation30–32, biological features that are also induced by LPAR4. In fact, there was a positive correlation between LPAR4 and FN1 mRNA expression for the TCGA PAAD dataset (P<0.0001) (Fig. 5a) and orthotopic PDX tumors (P=0.0180), while gemcitabine treated PDX tumors expressed high levels of both LPAR4 and FN1 (Fig. 5b). As observed for LPAR4, FN1 expression was also significantly higher in PAAD tumors than in normal pancreas (Extended Data Fig. 5a). Importantly, analysis of the TCGA PAAD dataset revealed that high FN1 expression significantly correlated with lower overall and relapse-free survival (both P<0.05) (Fig. 5c).
Fig. 5: LPAR4 expression promotes the cell-autonomous production of FN1.
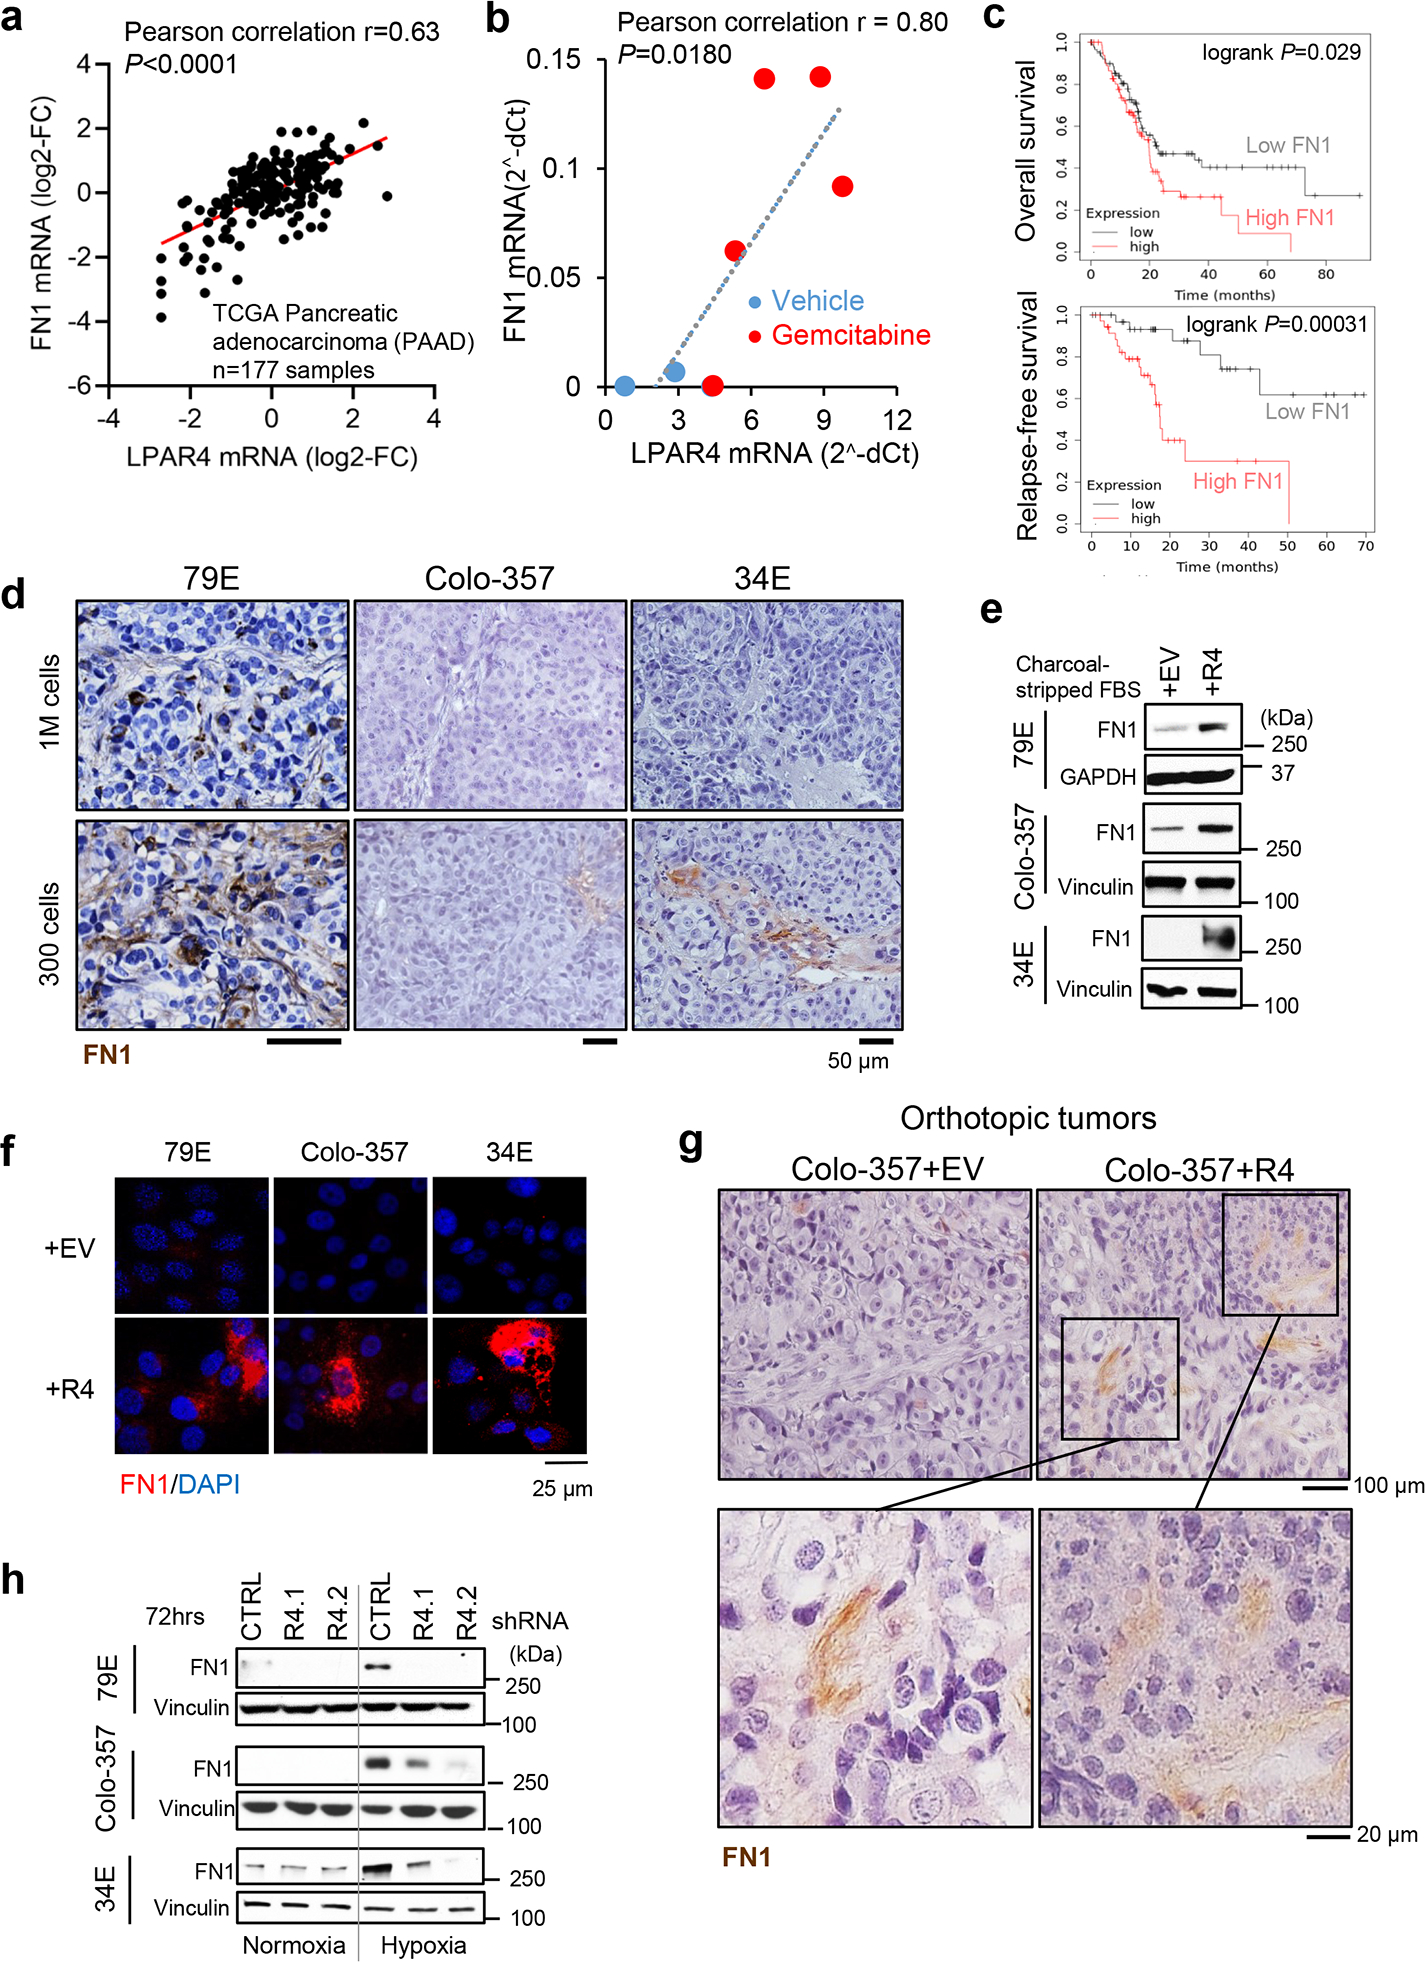
a, Expression correlation between LPAR4 and FN1 from the TCGA PAAD dataset (n=177 samples). Pearson correlation coefficient r=0.63 and two-tailed P <0.0001. b, Expression correlation between LPAR4 and FN1 from the PDX tumors from the orthotopic mouse models treated with vehicle control (n=3 biologically independent samples) or gemcitabine (n=5 biologically independent samples). Pearson correlation coefficient r=0.80 and two-tailed P=0.018. c, Overall and relapse-free survival for patients with low vs. high FN1 expression in the TCGA PAAD dataset. d, Representative images for human FN1 immunohistochemistry staining in 79E (n=10 biologically independent samples), Colo-357 (n=4 biologically independent samples), or 34E (n=5 biologically independent samples) xenograft tumors formed from 1 million (1M) cells injected or 300 cells injected. Scale bar is 50 μm. e-f, Western blot and immunostaining showing FN1 protein expression for pancreatic cancer cells with stable ectopic expression of LPAR4 (+R4) vs. empty vector control (+EV) grown in charcoal striped FBS containing media for 72 hours. Data are representative of three biological experiments. g, Representative images for human FN1 immunohistochemistry staining in Colo-357+EV vs. Colo-357+R4 tumors harvested at day 15 post implantation in the pancreas of nu/nu mice. Images in the lower panel highlight FN1 staining in matrix areas. Data are representative of three biological samples. Scale bar is 100 μm or 20 μm as indicated. h, Effects of hypoxia and LPAR4 knockdown on FN1 protein expression. Data are representative of three biological experiments. Source numerical data and unprocessed blots are available in source data.
FN1 has up to 20 distinct isoforms due to alternative splicing, and isoforms that contain the Extra Domain A (EDA) or EDB regions appear to be more tumorigenic33. Thus, we asked whether LPAR4-induced FN1 mRNA contains EDA, or EDB, or both domains. As shown in Extended Data Fig. 5b, +R4 cells expressed comparable mRNA levels of FN1, FN1-EDA, and FN1-EDB, suggesting LPAR4-induced FN1 likely contains both the pro-tumor EDA and EDB domains. As shown for LPAR4 (Fig. 1a), FN1 expression was higher in isolation-stressed tumors formed from the injection of 300 cells compared with those formed by 1 million cells (Fig. 5d). Consistent with the LPAR4 gene signature, +R4 cells showed higher levels of FN1 protein in the absence of exogeneous LPA (Fig. 5e–f). In an orthotopic tumor model, there was more abundant FN1 staining in the matrix surrounding Colo-357+R4 tumor cells than for Colo-357+EV tumor cells (Fig. 5g), providing evidence of LPAR4-induced tumor intrinsic FN1 production and deposition in vivo. Furthermore, cells exposed to hypoxia showed increased FN1, and this was prevented by LPAR4 knockdown (Fig. 5h and Extended Data Fig. 5c). These findings indicate that LPAR4 expression changes the phenotype of pancreatic cancer cells, providing them with a cell-autonomous source of pro-tumor FN1, creating a TIC niche to support survival during the earliest stages of tumor formation.
FN1 is indispensable for LPAR4-induced TIC properties
Next, we asked what signaling event(s) activated by LPAR4 drive FN1 expression. cAMP response element-binding protein (CREB) is a known stress-responsive transcription factor that can bind to the FN1 gene exon134, 35. Indeed, LPAR4 knockdown prevented hypoxia-induced FN1 protein expression and CREB phosphorylation at serine 133, an indicator of CREB activity32 (Fig. 6a). In addition, all +R4 cells showed higher CREB activity in the absence of exogenous LPA (Fig. 6b), suggesting LPAR4 was sufficient to activate CREB. Importantly, treating +R4 cells with CREB siRNA or CREB inhibitor 666–15 resulted in a dramatic decrease of FN1 protein expression (Fig. 6c–d). Using a CREB ChIP-qPCR assay, we detect significantly enriched CREB occupancy on FN1 exon1 in +R4 cells, relative to +EV cells, in the absence of exogenous LPA (Fig. 6e). Together, these results demonstrate that LPAR4-mediated activation of CREB directly drives the transcription of FN1 in pancreatic cancer cells.
Fig. 6: FN1, induced by the LPAR4/AKT/CREB signaling, is indispensable for LPAR4-induced TIC properties.
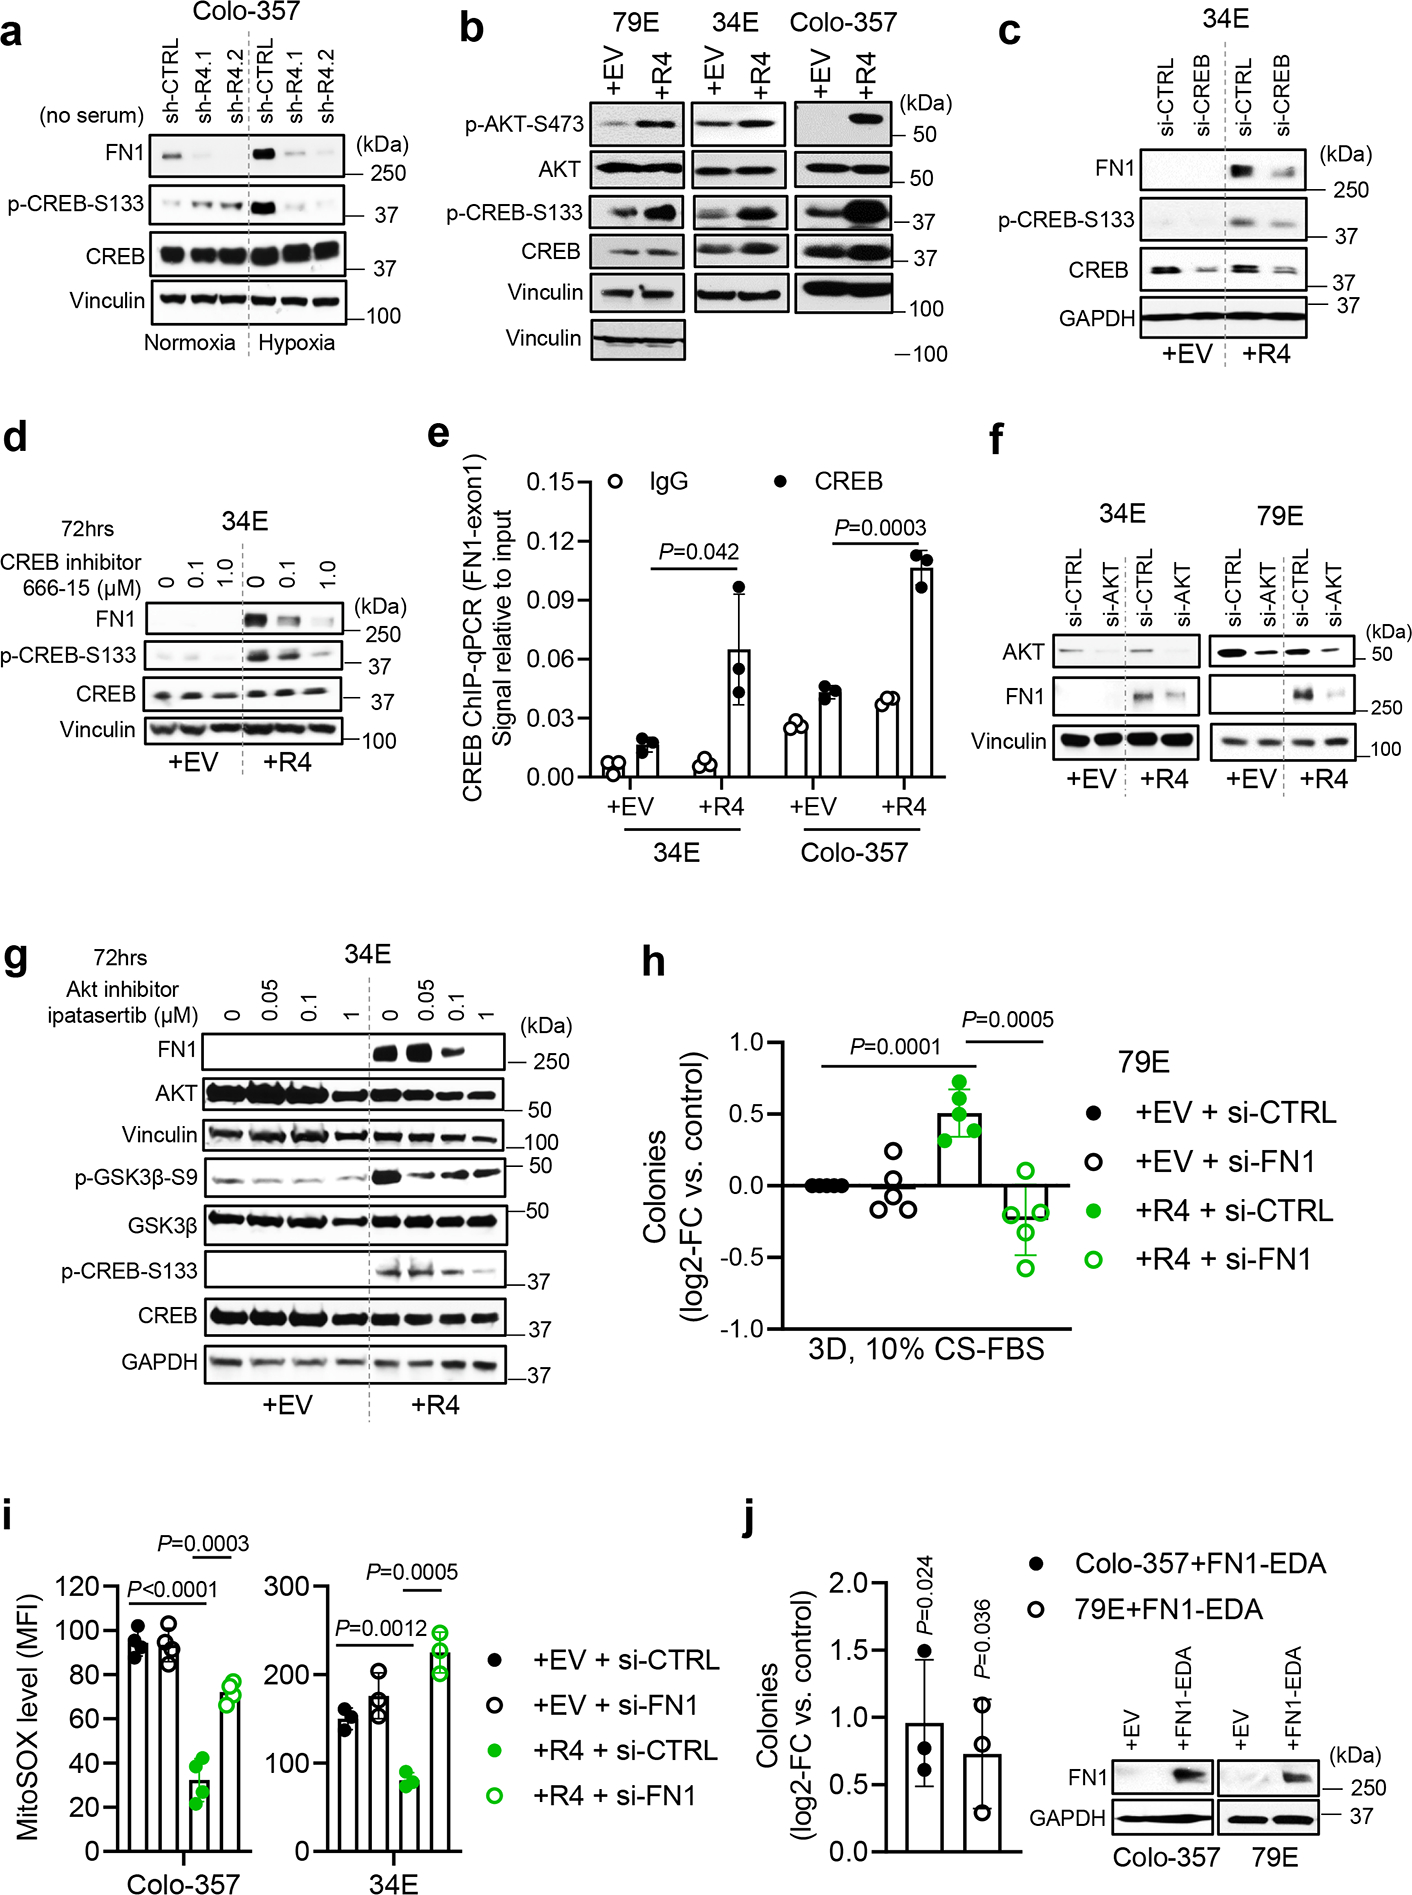
a, Effects of hypoxia and LPAR4 knockdown on protein expressions of FN1, phosphorylated CREB at serine133 (p-CREB-S133), and CREB. b, Protein levels of p-CREB-S133, CREB, p-AKT-S473, AKT, and vinculin in +EV vs. +R4 cells, cultured in charcoal stripped FBS containing media for 72 hours. c-d, Effects of CREB inhibition by using siRNA knockdown or 666–15 on the protein levels of FN1, p-CREB-S133, and CREB in 34E+EV vs. 34E+R4 cells cultured in charcoal stripped FBS containing media for 72 hours. e, ChIP-qPCR assay showing CREB binding occupancy on FN1 exon1 in +EV vs. +R4 cells cultured in charcoal stripped FBS containing media and IgG antibody serves as a negative control. The ChIP-qPCR signal was normalized to 2% input. f, Effect of AKT knockdown by using siRNA on FN1 protein expression in +EV vs. +R4 cells cultured in charcoal stripped FBS containing media. g, Effects of AKT inhibition by Ipatasertib for 72 hours on the protein levels of FN1, AKT, p-GSK-3β-S9, GSK-3β, p-CREB-S133, and CREB in 34E+EV vs. 34E+R4 cells cultured in charcoal stripped FBS containing media. h, Relative number of tumorsphere formed by cells transfected with scrambled siRNA (si-CTRL) or FN1 siRNA (si-FN1) in methylcellulose media topped with 10% charcoal stripped FBS containing media. All numbers were normalized to EV cells transfected with si-CTRL. i, Median fluorescence intensity (MFI) of MitoSOX in +EV and +R4 cells transfected with si-CTRL or si-FN1, grown in serum-free media for 48 hours. j, Relative number of tumorsphere formed by cells transfected with empty vector (EV) or FN1-EDA in methylcellulose media topped with 10% FBS containing media. Immunoblots represent two independent experiments for FN1 protein expression in cells transfected with EV or FN1-EDA at day 3. Western blots shown in a-d,f, and g represents three biologically independent experiments. Data were presented as mean ± s.d. in e, and h-j (n=3 independent experiments for e, j; n=5 for h, n=4 for Colo-357 cells and n=3 for 34E cells for i). Statistical analyses were performed using two tailed unpaired one sample t-test (e, and h-j). Source numerical data and unprocessed blots are available in source data.
Using Gene Set Enrichment Analysis (GSEA) to consider kinases known to activate CREB36, we found that AKT signaling was upregulated in +R4 cells in the absence of LPA (Extended Data Fig. 6a). Consistently, all +R4 cells showed relatively high AKT activity, evidenced by p-AKT-S473 (Fig. 6b), and the AKT inhibitor ipatasertib decreased p-CREB-S133 in a dose/time-dependent manner (Extended Data Fig. 6b), supporting the notion that CREB is a bona fide substrate of AKT in our cells. Furthermore, blockade of AKT by either siRNA-mediated knockdown or ipatasertib decreased FN1 in +R4 cells (Fig. 6f–g). In this case, p-GSK3β-S9 inhibition served as a surrogate indicator for the blockade of AKT kinase activity (Fig. 6g). As shown in Extended Data Fig. 6c, CREB knockdown resulted in a significant downregulation of several ECM-related genes within the LPAR4 gene signature, including FN1 and versican (VCAN), in both +R4 cell lines. Together, our data demonstrates that stress-induced LPAR4 activates AKT, leading to CREB-mediated transcription of FN1.
Not only has fibronectin been linked to cancer progression33, but it is critical for the creation of a niche that directs stem cells through different fate changes37, 38. FN1 functions as a scaffold for the deposition of other matrix proteins and anchoring of soluble factors, allowing it to promote angiogenesis, metastasis, chemoresistance, and immune evasion in pancreatic cancer33, 39, 40. Given the abundant FN1 expression in +R4 cells, we asked whether this could account for their phenotype. Indeed, FN1 knockdown significantly reduced LPAR4-induced 3D tumorsphere formation and growth advantage in the presence, but not absence, of stress (Fig. 6h and Extended Data Fig. 6d) and significantly increased MitoSOX levels in +R4, but not +EV, cells grown under serum-free conditions (Fig. 6i and Extended Data Fig. 6f). In addition, ectopic expression of FN1-EDA significantly induced 3D tumorsphere formation (Fig. 6j). Together, our data indicates that that FN1 is required for LPAR4-dependent stress tolerance and can account for the LPAR4-induced phenotype.
Considering that LPAR4 supports cell-autonomous growth under stressed conditions, we asked if the FN1-containing ECM produced by LPAR4-expressing pancreatic cancer cells could transfer this advantage to cells lacking LPAR4. To do this, +EV or +R4 cells were grown on tissue culture plastic for 72 hours to allow matrix deposition, and then removed to create a cell-free ECM (Fig. 7a). When LPAR4-negative cells were plated in serum-free growth conditions onto ECM deposited by +R4 cells (ECM-R4), they grew significantly faster than when plated on ECM produced by +EV cells (ECM-EV) (Fig. 7b). Of note, cells plated onto ECM-R4, but not ECM-EV, began to form colonies after several days (Fig. 7c and Extended Data Fig. 7a), further suggesting deposited matrix can transfer cell growth advantages from LPAR4-expressing cells to LPAR4-negative cells. Furthermore, LPAR4-negative cells grown on ECM-R4 became more stress tolerant to H2O2 or gemcitabine, and this was negated by FN1 knockdown (Fig. 7d).
Fig. 7: Extracellular matrix deposited by LPAR4-positive cells endows stemness features to LPAR4-negative cells in a FN1-dependent manner.
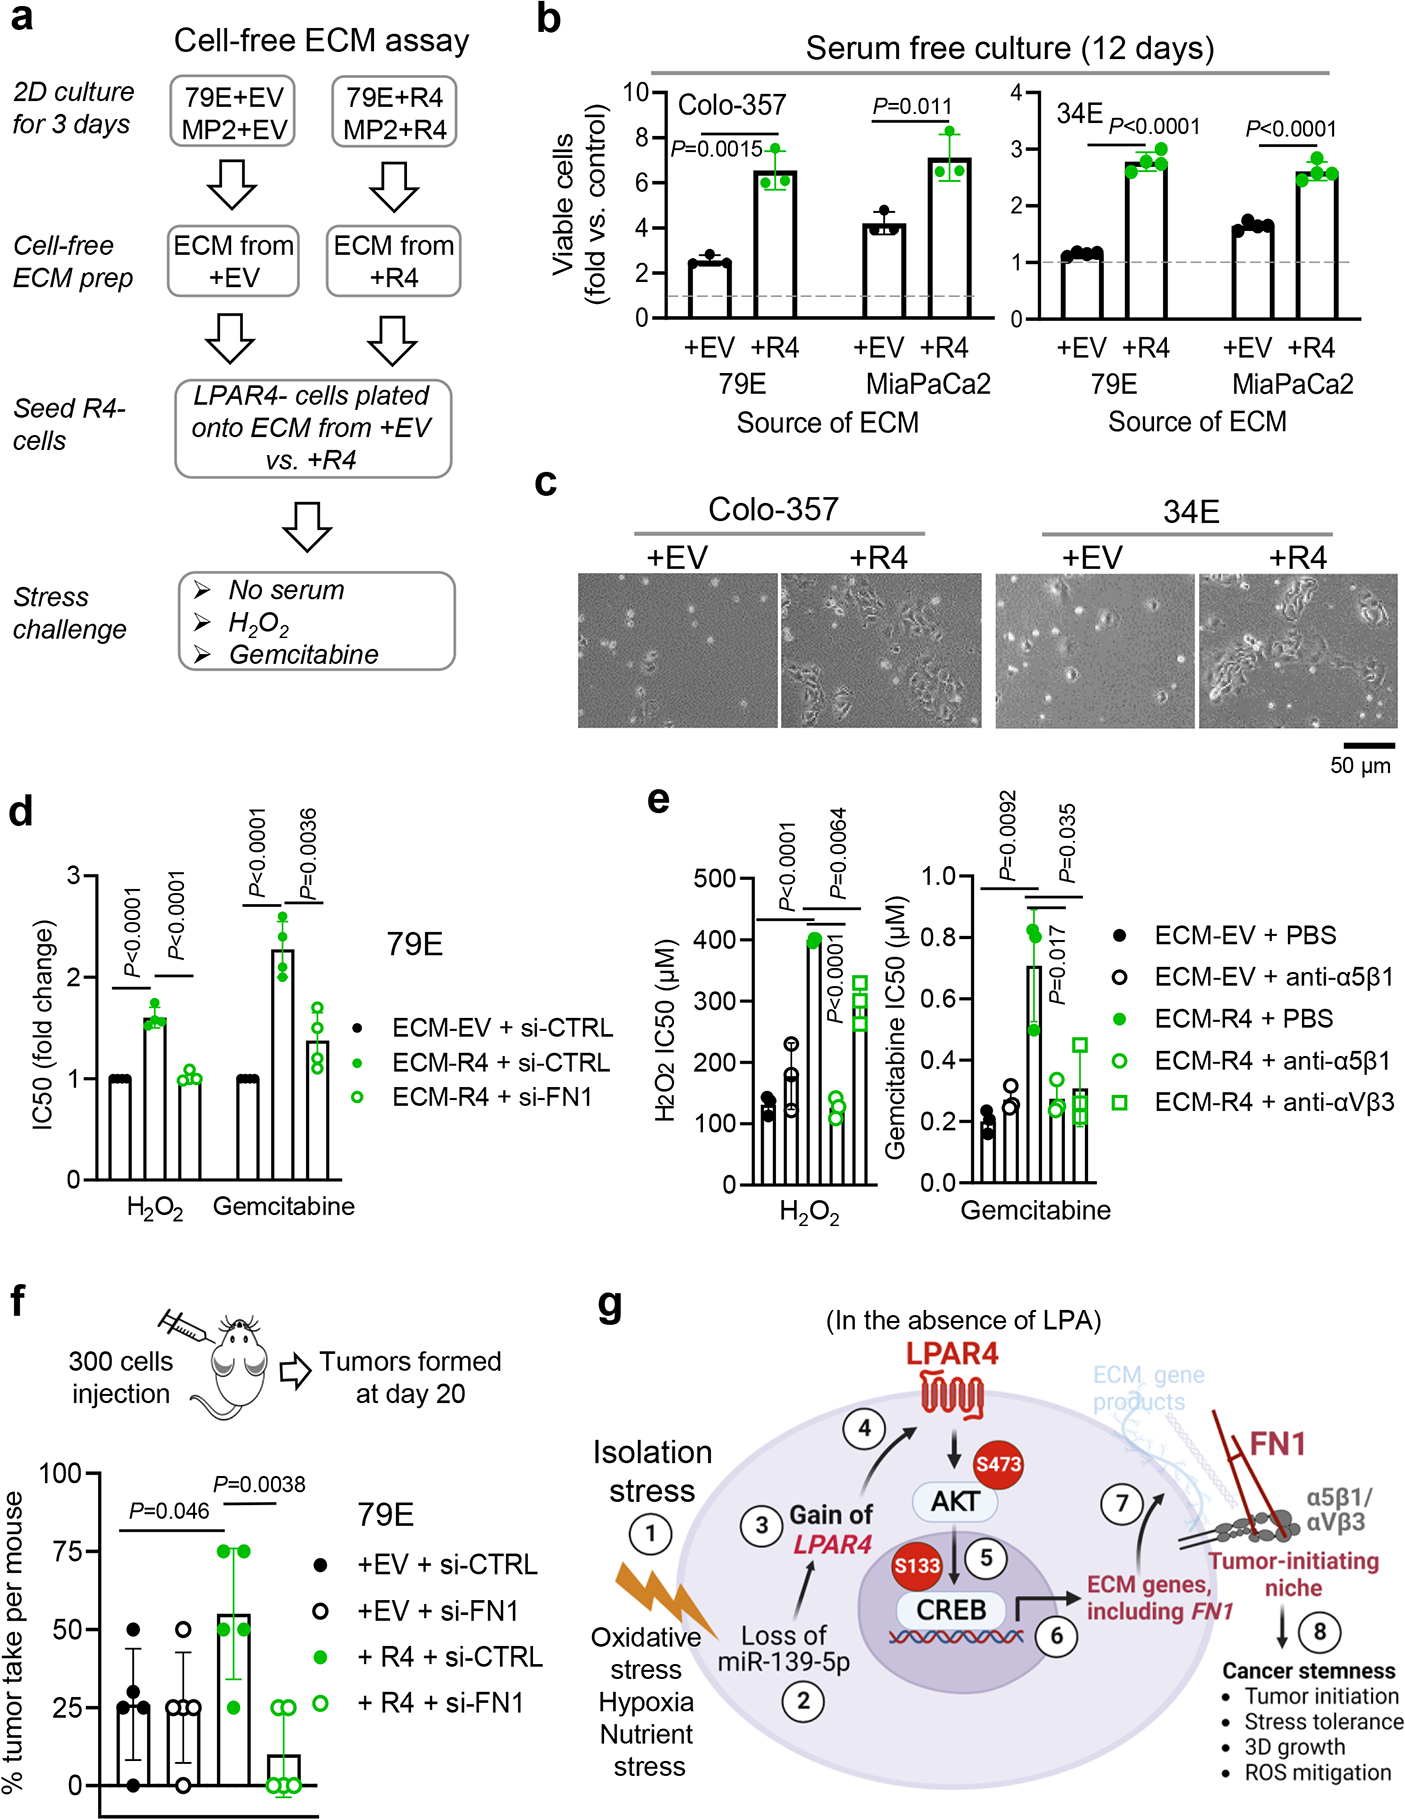
a, Experimental flow showing that +EV or +R4 cells were grown on tissue culture plastic for 72 hours in serum-free medium before cells were removed, and LPAR4-negative cells were plated atop the residual matrix in serum-free media. LPAR4-negative cells plated on uncoated tissue culture plate were used as baseline controls in this assay. b-c, Graph showing the number of viable cells, relative to baseline controls, assessed by the CellTiter-Glo assay. Data were presented as mean ± s.d. for n=3 independent experiments for Colo-357 and n=4 independent experiments for 34E cells. c, represents three independent experiments for pictures of colonies formed at day 12. d-e, Graphs showing IC50 values for 79E cells grown on the matrix deposited by 79E+EV cells or 79E+R4 cells with vs. without FN1 knockdown as indicated and then exposed to various doses of H2O2 or gemcitabine, or in combination with 5 μg/mL anti-α5 antibody P1D6, or with 5 μg/mL anti-αVβ3 antibody LM609. Cell viability was assessed by the Cell-Titer Glo assay and IC50 values were calculated by GraphPad prism 9. Data were presented as mean ± s.d. for n=4 independent experiments for d and n=3 independent experiments for e. f, The diagram shows 300 cells transfected with either scrambled siRNA (si-CTRL) or FN1 siRNA (si-FN1) were injected in a nu/nu mouse subcutaneously at four different sites. Graph showing the tumor take rate per mouse (n=5) for the four treatment groups analyzed at day 20. g, Schematic model of LPAR4 in pancreatic cancer. “Isolation stress” ① downregulates the expression of miR-139-5p ② that releases a brake on LPAR4 expression ③ ④. Even the microenvironmental LPA is absent, LPAR4 is sufficient to activate AKT/CREB signaling ⑤, driving the expression of ECM related genes, including FN1 ⑥. The deposited FN1 matrix protein ligates with its cell surface integrins α5β1 and/or αVβ3 ⑦, endowing cells with several self-sufficient traits, including 3D growth and stress tolerance, ultimately promoting tumor initiation and cancer stemness ⑧. Statistical analyses were performed using two tailed unpaired one sample t-test (b and d-f). Source numerical data are available in source data.
Finally, we show the ability of ECM-R4 to provide stress tolerance could be eliminated by interfering with fibronectin binding to its cell surface receptors, integrins α5β1 or αvβ3 (Fig. 7e). Thus, FN1 is a critical effector of LPAR4 that supports LPAR4-induced self-sufficiency, and the ability to transfer this to LPAR4-negative cells requires the function of integrin α5β1 and/or αvβ3. Lastly, to further substantiate the significance of FN1 for the LPAR4-induced tumor initiation advantage, we knocked down FN1 in both +EV and +R4 cells and performed a tumor initiating assay by injecting 300 cells in mice. As shown in Fig. 7f, FN1 knockdown in +R4 cells, but not +EV cells, resulted in a significantly decreased tumor take rate in vivo, indicating that FN1 was required for LPAR4-induced tumor initiation. Together, a variety of in vitro and in vivo assays consistently indicate that FN1 is a critical effector of LPAR4 in pancreatic cancer cells.
In summary, pancreatic cancer cells can overcome isolation stress through the stress-induced suppression of a miRNA that releases a brake on LPAR4 expression, thus activating an AKT/CREB axis allowing a tumor cell to generate a fibronectin containing ECM niche, and thereby promoting a self-sufficient phenotype (Fig. 7g).
Discussion
Evidence is provided that LPAR4 acts as an adaptive response to stress that pancreatic cancer cells exploit to overcome solitary growth conditions encountered during tumor initiation. Established pancreatic tumors feature a dense stroma that supports growth and survival for pancreatic cancer cells in the primary tumor environment by providing cell-cell and cell-matrix adhesion, as well as secreted factors including cytokines, growth factors, and ECM41. We propose that at the earliest stages of tumor development or metastatic seeding, solitary tumor cells adapt to isolation stress by downregulating miR-139-5p, which releases the brake on LPAR4 expression.
Aside from LPAR4, we did not find any other previously reported miR-139-5p target genes 42–44 to be stress dependent in our pancreatic cancer cells. This may be because IGF1R and CCNB1 are highly expressed in unstressed conditions, unlike LPAR4. While IGF1R and CCNB1 were ~2-fold downregulated by the miR-139-5p mimic in 34E cells, this was not the case for Colo-357 cells (Extended Data Fig. 3f), suggesting potential context dependent interactions.
Upregulating LPAR4 in response to stress allows solitary pancreatic cancer cells to create their own tumor initiating niche by producing ECM proteins. Fibronectin within this matrix, via integrin ligation, supports a self-sufficient state to enable tumor initiation and can transfer this advantage to nearby LPAR4-negative cells (Fig. 7g). Importantly, we show that blocking the ability of cells to utilize this fibronectin matrix with integrin antagonists can reverse the stress tolerance benefit of LPAR4 expression. Considering that tumors that develop drug resistance via upregulation of LPAR4 show enhanced stress tolerance and tumor initiation, targeting the LPAR4/AKT/CREB pathway or disrupting the integrin/FN1 interaction might not only reduce tumor drug resistance, but could ultimately delay disease progression by suppressing tumor initiation at metastatic sites.
Our gene expression analysis highlights functions for LPAR4 that do not require LPA, suggesting this mechanism to overcome stress represents a non-canonical role for an LPA receptor that is ligand-independent and stress-inducible. In “unstressed” states, cells do not require LPAR4-FN1-integrin signaling when sufficient growth support can be obtained from other cell-cell and cell-matrix interactions, along with the growth factors, cytokines, soluble FN1, and vitronectin provided by fetal bovine serum (FBS). The fact that LPAR4 expression is undetectable in cells grown in such states may explain why LPAR4 has not yet been appreciated as a stress-inducible contributor to pancreatic cancer.
In a more general context, our work highlights an opportunity to explore additional functions for cell surface proteins with defined roles as “receptors”. LPAR4 might represent a larger family of proteins that can be hijacked by tumor cells to overcome the unfavorable growth conditions encountered during phases of tumor progression that require a self-sufficient phenotype. For example, our previous studies revealed that integrin αvβ3 functions in a non-ligated state to promote stemness, tumor initiation, and drug resistance in cancer cells 45–48. Ultimately, therapeutic agents that block the function of LPAR4 and other receptors enriched on TIC may be overlooked when evaluated by their capacity to halt the growth of well-established primary tumors. Instead, such agents may have an alternative use to limit therapeutic resistance, disease relapse, or metastasis by preventing tumor cells from gaining the self-sufficient phenotype that tumor cells exploit to achieve tumor initiation and spread to distant sites.
Methods
All experiments conform to the relevant regulatory standards and animal studies were conducted under protocol S05018 and S09158, approved by the University of California San Diego Institutional Animal Care protocol and Use Committee in accordance with the National Institutes of Health Guide for the Care and Use of Laboratory Animals.
Reagents, chemicals, and antibodies.
Lysophosphatidic acid (18:1) (Avanti Polar Lipids, Alabaster, AL, #857130) was diluted to 5mM in dH2O, sonicated at 37°C for 15 mins, and used fresh. The CellTiter-Glo kit (Promega, Madison, WI, #G7573) was used to measure cell viability. Gemcitabine HCI (#S1149), Paclitaxel (NSC 125973) and Hydrogen peroxide (H2O2) were purchased from Selleck Chem (Houston, TX) and Thermo Fisher Scientific (H325–100), respectively. Charcoal: Dextran stripped Fetal Bovine Serum (FBS) was purchased from GeminiBio (#100–119). Ipatasertib (GDC-0068, HY-15186) and 666–15 (HY-101120) were purchased from MedChemExpress (Monmouth Junction, NJ). Primary antibodies used in this study included: LPAR4 (Proteintech, #22165–1-AP, 1:1000 for western blots), LPAR4 (Thermo Fisher, #PA5–49727, 1:50 for immunohistochemistry), Vinculin (Santa Cruz Biotechnology, #sc-25336, H-10, 1:5000 for western blots), GAPDH (CST, #5174, D16H11, 1:3000 for western blots), β-actin (CST, #8457, D6A8, 1:5000 for western blots), Fibronectin (CST, #26836, E5H6X, 1:1000 for western blots, 1:200 for immunohistochemistry and immunofluorescence), phosphor-AKT-Ser473 (CST, #9271, 1:1000 for western blots), AKT (CST, #9272, 1:1000 for western blots), phosphor-CREB-Ser133 (CST, #9198, 87G3, 1:1000 for western blots), CREB (CST, #9197, 48H2, 1:1000 for western blots), Phospho-GSK-3β-Ser9 (CST, #5558, D85E12, 1:1000 for western blots), GSK-3β (CST, #12456, D5C5Z, 1:1000 for western blots), and anti-α5 integrin antibody (Sigma-Aldrich, MAB1956Z, P1D6). Anti-αVβ3 integrin antibody (LM609) was produced as previously described49. Secondary antibodies for western blots include anti-rabbit IgG (CST, #7074,1:3000 for western blots) and anti-mouse IgG (CST, #7076, 1:3000 for western blots).
Cell lines.
Pancreatic ductal adenocarcinoma cell lines (XPA1, MiaPACA-2) were obtained from the American Type Culture Collection (ATCC, Manassas, VA). 79E and 34E cells were derived from patient-derived xenograft (PDX) models established by Dr. Andrew Lowy (University of California, San Diego). The fast-growing variant of the pancreatic carcinoma cell line Colo-357 was a gift from Dr. Shama Kajiji and Vito Quaranta (The Scripps Research Institute). Cells were grown in DMEM containing 10% FBS (Gibco) and 1% penicillin-streptomycin (Thermo Fisher Scientific, Waltham, MA) and cryopreserved as low-passage stocks. All cell lines were regularly tested for mycoplasma contamination using PCR mycoplasma detection kit (Genlantis, San Diego, CA). All cell lines were tested mycoplasma negative.
Genetic knockdown and ectopic expression.
Cells were transfected with vector control or LPAR4 using a lentiviral system. Lentiviruses were produced in 293T cells co-transfected with lentiviral backbone constructs and packing vectors (ps-PAX2 and VSVG) using Lipofectamine 3000 (ThermoFisher Scientific). For knockdown experiments, cells were transfected with siRNA (Sigma-Aldrich) using the Lipofectamine RNAiMAX (Thermo Fisher Scientific) or with shRNA (Sigma-Aldrich) using a lentiviral system. Two siRNAs or shRNAs targeting different regions of the gene of interest were applied for the gene knockdown. Ectopic expression and knockdown effects were confirmed by qRT-PCR. miRNA inhibitor (Millipore Sigma) or mimic (Millipore Sigma) transfections were conducted using Lipofectamine RNAiMAX. Cells were harvested 48 hours post transfection for RNA isolation and qPCR analysis or for methylcellulose tumorsphere formation assay. Supplementary Table 5 shows details for constructs, siRNAs, and miRNA reagents.
Application of cellular stress in vitro.
Hypoxia: Cells at ~50% confluence were grown in a 1% O2 hypoxia chamber (Coylab) or 21% O2 normoxia chamber (regular tissue culture chamber) on 2D monolayer culture for 72 hours. Oxidative stress: 5 X10⁵ cells were seeded in a 12-well ultra-low attachment plate (Corning, 3D) and treated with different doses of H2O2 for 48 hours. Serum deprivation: 5 X10⁵ cells were seeded on 2D (6-well plate) or 12-well ultra-low attachment plate (Corning, 3D) in the presence of 10% regular FBS or 0% FBS- supplemented media for 48 hours. Medium were substituted with 10% regular FBS-supplemented media for both experimental and control cells for 2 hours prior to cell harvest. Chemotherapy stress: 5 X10⁵ cells were seeded in 12-well ultra-low attachment plate a day before treatment of various doses of gemcitabine or paclitaxel for 24 hours.
Subcutaneous and orthotopic tumor studies.
Experiments were conducted under protocol S05018 approved by the UC San Diego Institutional Animal Care and Use Committee in accordance with the NIH Guide for the Care and Use of Laboratory Animals. All experiments utilized 6-to-8-week-old female immune-compromised nu/nu mice (Charles River Labs, Wilmington, MA). Mice were kept on a 12-hour light/dark cycle, 7:00 to 18:00 at ambient room temperature of ~22 Celsius degree, and at humidity of 40–60%, monitored through the building control management system. The maximal tumor volume permitted by IACUC is 2×103 mm3 and was not exceeded.
A limiting dilution assay was used to estimate the frequency of tumor-initiating cells. Briefly, 1 million, 100K, 10K, 1K, 100, or 10 cells were suspended in a 1:1 mixture of Hanks Balanced Salt Solution and Phenol Red-free Basement Membrane Matrix (BD Biosciences, San Diego, CA) and injected subcutaneously. Mice were examined twice weekly for palpable tumors. The results were tabulated as the number of tumors observed (at the specified endpoint) per the number of tumors injected, and used to calculate the frequency of tumor-initiating cells using ELDA software50.
Based on the limiting dilution experiments, the tumor take rate was about 50% for a 300-cell injection and 100% for 1 million cells. As such, we reasoned that tumor formed after injection of 300 cells are enriched for cancer stem or self-refirsting cells. Mice received a subcutaneous injection of 300 or 1 million tumor cells to the flank and were checked twice weekly for palpable tumors. Once a tumor was observed, the tumor was harvested, cut bluntly into pieces and ground on ice using a glass tissue grinder with 20% Binding Buffer from the High Pure miRNA Isolation Kit (Roche) for tissue homogenization. Supernatants collected after tissue homogenization were utilized for total RNA isolation using the High Pure miRNA Isolation Kit (Roche), following the manufacturer’s protocol.
For 300 cells injection xenograft model, +EV or +R4 cells were transfected with either FN1 siRNA or scrambled siRNA for 48 hours prior to harvest, then 300 cells mixed with Phenol Red-free Basement Membrane Matrix (1:1 ratio) were subcutaneously injected into mice. At day 20, the number of palpable tumors formed were counted.
For tumor initiation in an orthotopic model, Colo-357-sh-CTRL or sh-R4.1 cells were firstly transduced with luciferase lentivirus. Cells with equivalent levels of luciferase activity were implanted into the pancreas of nu/nu mice. Tumor initiation in the pancreas of mice was monitored twice a week by using non-invasive bioluminescence imaging.. Note that all mice were imaged 10 minutes after injected with D-luciferin (L9504, Sigma-Aldrich). The frequency of tumor-initiating cells was analyzed using ELDA software50.
Pancreatic cancer patient-derived xenograft study.
The study involving patient samples was following UCSD Institutional Review Board (IRB)-approved protocol (IRB number:181755) and all patients were consented and not compensated. The patients’ information (sex and age) was blinded to protect patient confidentiality. The patient-derived xenografts mouse study was conducted under the protocol S09158 approved by the UC San Diego Institutional Animal Care and Use Committee in accordance with the NIH Guide for the Care and Use of Laboratory Animals. Briefly, 1–2 mm3 PDX fragments (n=8 patient tumor samples) were implanted to pancreas of NOD.Cg-Prkdcscid Il2rgtm1Wjl/SzJ (NSG) mice. Tumor growth was monitored by weekly ultrasound imaging. Once a tumor size reached 50–100 mm3, the mouse was recruited randomly and subsequently treated with vehicle or 100 mg/kg gemcitabine (intraperitoneal injection) twice a week for up to 6 weeks. Once the control tumor group reached a diameter of 2.0 cm3, all mice were sacrificed for tumor harvest and qPCR analysis.
Quantitative RT-PCR and RNA-Seq.
RNA was collected using the RNeasy RNA Purification kit (Qiagen, Germantown, MD). Cells were harvested at the indicated time points and conditions. Adherent (2D) cells were washed twice with 1X HBSS (Gibco, #14025076) and scraped off in the presence of Buffer RLT (Qiagen). Cells grown in ultra-low attachment plates (Corning, #3473) were harvested through centrifugation (300Xg, 5 minutes) and washed twice with 1X HBSS before lysing with Buffer RLT. cDNA was synthesized by using High-Capacity cDNA Reverse Transcription Kit (ThermoFisher Scientific), and RT-PCR was performed on a LightCycler with SYBR Green (BioRad, Irvine, CA). Expression of each target gene is normalized by comparing the target Ct value to the geometric mean of the Ct for the five housekeeping genes, RPL37A, ACTB, TUBB, VCL and GAPDH. Primer sequences are listed in Supplementary Table 6. For RNA-seq experiments, RNA was extracted using the RNeasy RNA Purification kit (Qiagen) following the manufacturer’s instructions. A total of 1 μg RNA per sample was used to generate RNA-seq libraries using NEBNext Ultra RNA library prep kit (NEB, USA) following manufacturer’s protocol. PCR products were purified (AMPure XP system) and library quality was assessed on the Agilent Bioanalyzer 2100 system. The clustering of the index-coded samples was performed on Illumina Novaseq sequencer according to the manufacturer’s protocol. Subsequently, the RNA libraries were sequence on Illumina Novaseq machine and paired-end reads were generated. The Python package HTSeq was used to generate read counts for each gene which were analyzed using the R package DESeq2 (v.1.28.0). Benjamini and Hochberg correction were used to calculate adjusted P values (p.adj) for differentially expressed genes. A p.adj < 0.01 was required to consider genes as differentially expressed ones. Heatmaps were generated using Java Treeview (v.1.1.6r4). Total RNA (including small RNA) was isolated using the High Pure miRNA Isolation Kit (Roche), following the manufacturer’s protocol. cDNA for miRNA was synthesized and the stem-loop RT-PCR method was applied to assess the expression of miRNA of interest following the protocol described in detail by Xie et al51. PCR cycles for amplifying all miRNA were: Stage 1: 94°C, 3 minutes, 1 cycle; Stage 2: 95°C, 15 seconds; 60°C, 45 seconds; 45 cycles; Stage 3: Dissociation analysis. Expression of the target miRNA is normalized by comparing the target Ct value to the geometric mean of the Ct for the two housekeeping miRNAs, U6 and miR-16-5p. Primer sequences for miRNA expression are listed in Supplementary Table 6.
LPAR4–3’UTR luciferase reporter assay.
The LPAR4–3’UTR luciferase reporter plasmid (HmiT099310-MT05) and control plasmid (CmiT000001-MT05) were purchased from GeneCopoeia. Briefly, cells were transfected with LPAR4–3’UTR reporter plasmid or control plasmid using lipofectamine 3000 (ThermoFisher Scientific) at day 1, and at day 2 cells were subsequently transfected with 100 nM miR-139-mimic, or anti-miR, or scrambled control mimic, respectively, using lipofectamine RNAiMAX (ThermoFisher Scientific). At day 4, gaussia luciferase and Secreted alkaline phosphatase (SEAP) luciferase activities for each sample were accessed separately by using Secrete-Pair Dual Luminescence Assay Kit (LF031, GeneCopoeia).
Chromatin immunoprecipitation (ChIP)-qPCR assay.
The ChIP kit was purchased from Cell Signaling (SimpleChIP Plus Chromatin IP kit, #9005) and the experiments were performed according to the protocol provided by Cell Signaling Technology. Briefly, cells grew in charcoal stripped FBS containing media up to 90% confluence prior to crosslink using 37% formaldehyde for 10 minutes at room temperature. Nuclei/chromatin was digested and sonicated after 3 sets of 20-second pulse and 3 sets of 30-second on wet ice between pulses (Branson Digital Sonifier 450). Chromatin lysates were incubated with anti-CREB antibody (#4820, Cell Signaling) or anti-IgG (#2729, Cell Signaling) at 4°C with rotation overnight. The eluted DNA products were subsequently utilized for real-time qPCR assay. Primers for detecting FN1-exon1 are available in Supplementary Table 6. The details of the PCR reaction program are: initial denaturation: 95°C, 3 minutes; Denature: 95°C, 15 seconds; Anneal & Extension: 60°C, 60 seconds; Repeat step Denature and Anneal & Extension for a total of 40 cycles.
Western blots.
Western blots were performed as described previously45. Briefly, cells were harvested at the mentioned time points and conditions. Adherent (2D) cells were washed three times with 1X HBSS and scraped off in the presence of 1X RIPA buffer containing protease and phosphatase inhibitors, or 2X Laemmli sample buffer containing reducing agent. Cells grown in suspension (3D) were harvested through centrifugation (300Xg, 5 minutes) and washed twice with 1X HBSS before lysing with cell lysis buffer mentioned above. BCA assay (Thermo Fisher Scientific) was performed, and lysates were normalized. Sample buffer containing reducing reagent were added to the 1X RIPA buffer lysate and then heated at 95°C for 5 minutes. 20 μg of protein was loaded on an SDS-PAGE gel. Blocking and probing were done in 5% fat-free milk + TBS-T buffer. ECL reagent (Thermo Fisher Scientific) was used to visualize protein bands.
Methylcellulose tumorsphere forming assay.
Methylcellulose tumorsphere forming assay was performed following manufacturer’s instructions. Briefly, cells were washed with 1x HBSS and centrifuged at 300 X g for 5 minutes, and cell number was counted by the Trypan blue exclusion assay. Briefly, 4000 cells were mixed in 1mL methylcellulose stock media (HSC001, R&D systems, Minneapolis, MN) in 24-well non-treated plate (Corning), topped by 1 mL 10% regular FBS- or 10% charcoal stripped FBS-supplemented medium. After 12 days, one lower magnification image of each well plus 3 random fields with higher magnification within each well were acquired using an AmScope microscope (MU1603). The number and % area of tumorspheres per field was computed using Image J (NIH, MD).
Flow cytometry detecting mitochondrial superoxide (MitoSOX).
MitoSOX Red (Thermo Fisher, M36008) staining was used according to the manufacturer’s instructions. Briefly, 5X10⁵ cells were seeded on 6-well tissue culture plate in serum-free media for 48 hours. Cells were washed with 1 X HBSS twice and were disassociated with 0.5% trypsin buffer, then washed with 1 X HBSS and centrifuged with 300 X g for 5 minutes twice. Subsequently cells were stained with 5 μM MitoSOX reagent for 10 minutes at 37°C, protected from light, before flow cytometry analysis. An example of gating strategy for this assay is provided in Supplementary Figure. Data were analyzed with FlowJo.v10.
Immunohistochemistry staining.
Immunohistochemistry staining of LPAR4 or FN1 in human PDAC tissue array (US Biomax PA484a) or formalin-fixed, paraffin-embedded xenograft tumors were performed using the LPAR4 antibody (Thermo Fisher, #PA5–49727) or FN1 antibody (CST, #26836, E5H6X) following the manufacturer’s protocol. Slides were later imaged on a NanoZoomer Slide Scanning System (Hamamatsu). The LPAR4 antibody was validated for immunohistochemistry application by the manufacturer, as well as in-house validation by staining orthotopic xenograft tumors generated by 79E+EV vs.79E+R4 cells (Extended Data Fig. 8).
Immunofluorescence staining.
Briefly, cells were grown on 8-well chamber slide (Nunc™ Lab-Tek™ chamber slide, Thermo Scientific) and fixed with 4% formaldehyde for 15 minutes at room temperature. Cells were then incubated with primary antibodies at a dilution of 1:1000 (anti-FN1) for overnight at 4°C, following by secondary antibody at a dilution of 1:2000 for 1 hour and DAPI staining for 5 minutes at room temperature. Images were acquired by Nikon Eclipse C1 confocal microscope and analyzed with NIS-Elements Viewer 5.21.
Production and testing of cell-free extracellular matrix.
+EV or +R4 cells were seeded confluently on 6- or 96-well tissue culture plate (Corning) in serum-free medium for 72 hours to deposit extracellular matrix (ECM). Cells were thereafter removed with 20% ammonium hydroxide solution following an established protocol52. For the cell growth assay, 1X10⁵ cells were seeded on 6-well plate pre-coated with extracellular matrix derived from +EV (ECM-EV) or +R4 (ECM-R4) cells in the absence of serum up to 12 days. For H2O2 and gemcitabine resistance assay, 2X10⁴ cells were seeded on 96-well plate pre-coated with ECM-EV, ECM-R4, or ECM-R4 with FN1 knockdown in the absence of serum. Next day, cells were treated with various doses of H2O2 or gemcitabine, or in combination with antibody P1D6 (5 μg/mL) or antibody LM609 (5 μg/mL) up to 72 hours. The number of viable cells were assessed by the CellTiter-Glo kit (Promega).
Statistical analysis.
Fisher’s exact tests, One-Way ANOVA tests or Student t tests were performed using Prism (GraphPad 9.4.1, San Diego, CA) and Microsoft Excel 365. P<0.05 was considered significant. Data distribution was assumed to be normal, but this was not formally tested. No statistical methods were used to pre-determine sample sizes but our sample sizes are similar to those reported in previous publications53, 54. No randomization was used except all the mice for the in vivo study were allocated randomized. Single-blinding was performed for all in vivo assays and data analysis, as well as for RNA-seq data analysis. Data collection and analysis were not performed blind to the in vitro experiments. No samples, mice or data points were excluded for analysis.
Extended Data
Extended Data Fig. 1: LPAR4 is a stress inducible gene.
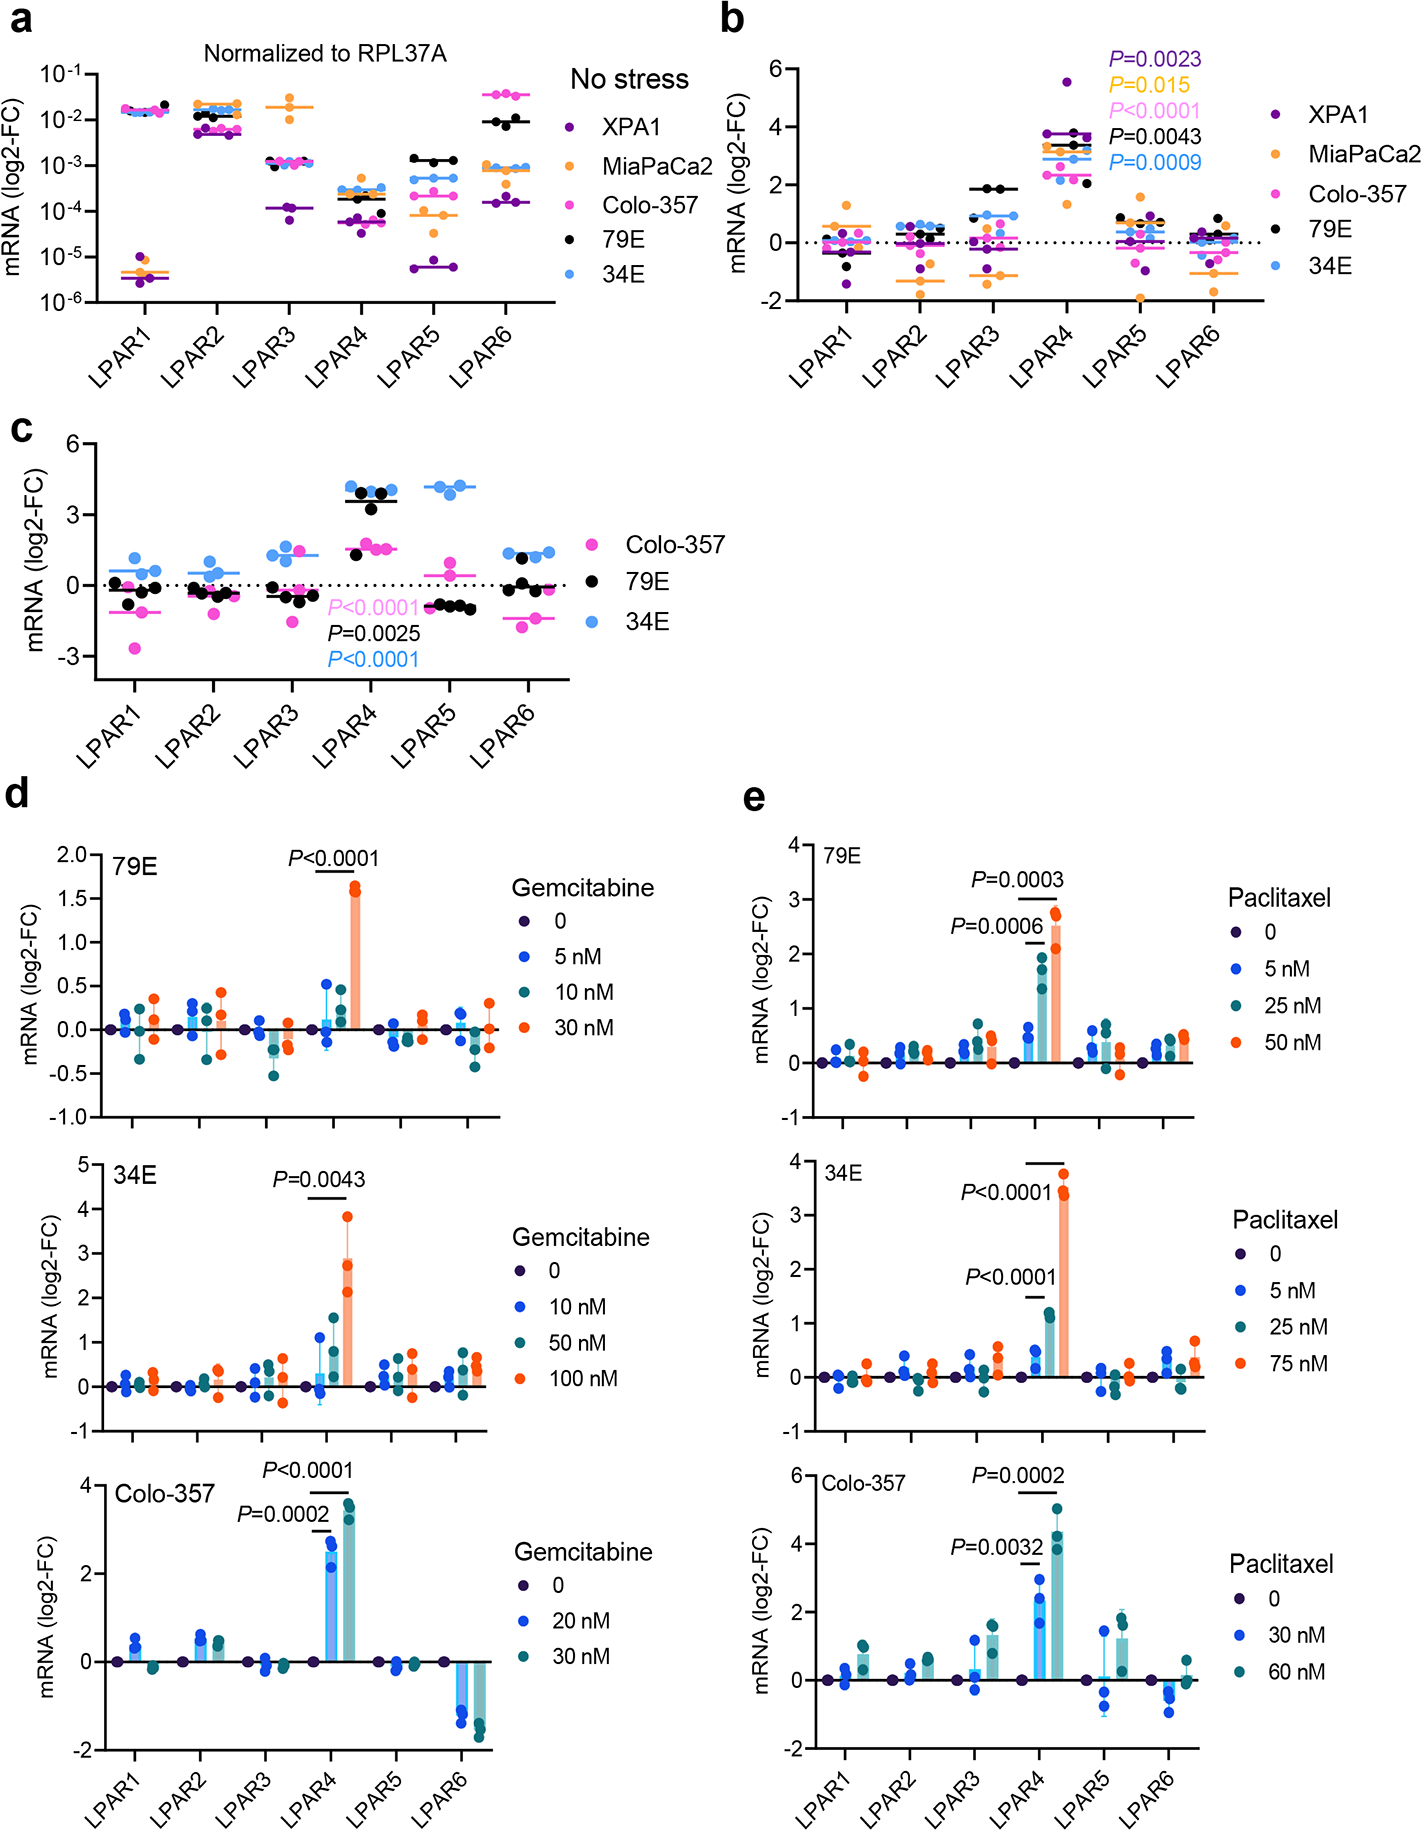
a, Graph showing relative mRNA expression of six LPARs (normalized to housekeeping gene RPL37A) for cells grown in 10% serum and 2D. b, Graph comparing LPARs expression on cells grown in stem-like culture conditions (i.e., no serum/3D) for 72 hours with respect to cells grown in 10% serum on 2D for 72 hours. c, Graph comparing LPARs expression on cells grown in hypoxia condition (1% O2) for 72 hours with respect to cells grown in normoxia for 72 hours. d-e, Graphs comparing LPARs expression on cells grown in 3D condition treated with varying doses of gemcitabine or paclitaxel for 24 hours. Bars represent median value per cell line (a-c). Data were presented as mean ± s.d. for n=3 independent experiments. Statistical analyses were performed using two tailed unpaired one sample t-test (b-e). Source numerical data are available in source data.
Extended Data Fig. 2: LPAR4 does not impact cell growth in the absence of stress.
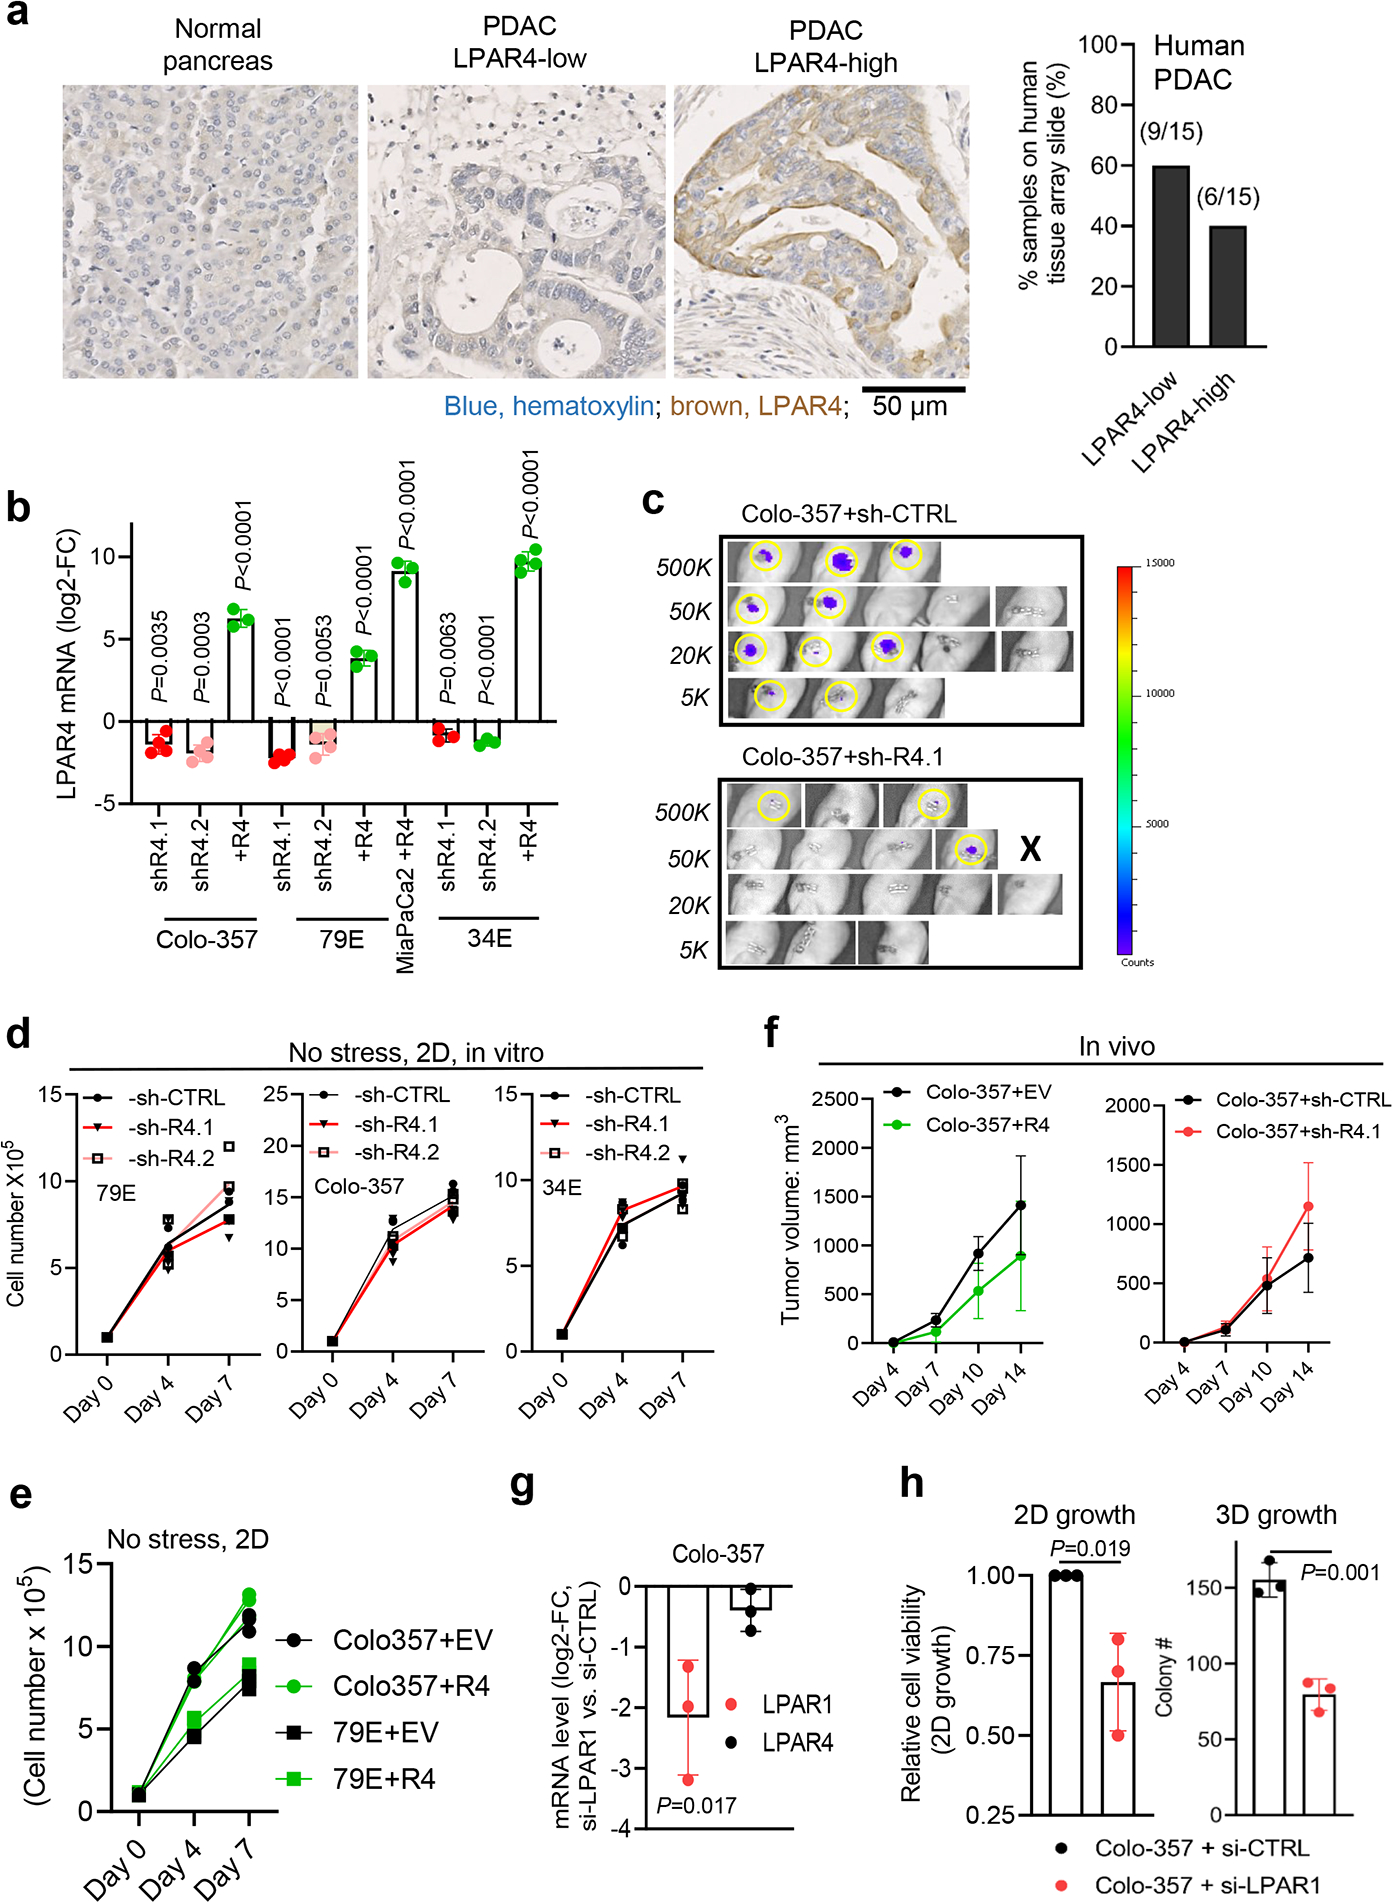
a, Immunohistochemistry staining of LPAR4 in a PDAC tissue array consisted of 15 PDAC samples and 4 samples of normal pancreas. Scale bar is 50 μM. Representative images showing normal pancreas (n=4 biological samples), low-LPAR4 PDAC (n=9 biological samples), and high-LPAR4 PDAC (n=6 biological samples). Bar graph shows the relative percentage of LPAR4-low and LPAR4-high patients in the PDAC tissue array. b, Quantitative RT-PCR confirming the manipulation of LPAR4 expression in 2 pancreatic cancer cell lines (Colo-357, MIA PaCa-2) and 2 patient-derived cancer cells (79E, 34E). Data were shown as mean ± s.d. (n=4 independent experiments for Colo-357 and 79E cells with LPAR4 stable knockdown, n=3 for Colo-357, 79E, and MiaPaCa2 cells with LPAR4 ectopic expression, n=3 for 34E cells with LPAR4 stable knockdown, and n=4 for 34E with LPAR4 ectopic expression). c, Non-invasive Bioluminescence images showing tumors formed at day 10 for Colo-357+sh-CTRL+luciferase or Colo-357+sh-R4.1+luciferase of various number implanted in the pancreas of nu/nu mice. Right panel showing the luminescence intensity in a blue-to-red spectrum. d, f, Trypan blue exclusion assay showing the relative number of viable cells with or without LPAR4 expression manipulation grown in 10% serum and 2D at day 4 and day 7. e, Tumor growth rates for 1 million Colo-357 cells with or without LPAR4 expression manipulation in a subcutaneous tumor model. Data were presented as mean ± s.d. for n=8 independent samples for each group. g, Quantitative RT-PCR confirming the knockdown of LPAR1 in Colo-357 cells. h, Effects of LPAR1 knockdown using siRNA on 2D or 3D (methylcellulose sphere forming) cell growth. Data were presented as mean ± s.d. for n=3 independent experiments (d,f,g, and h). Statistical analyses were performed using two tailed unpaired one sample t-test (b,g, and h) and one-way ANOVA (d-f). Source numerical data are available in source data.
Extended Data Fig. 3: miR-139–5p downregulates LPAR4 expression in pancreatic cancer cells.
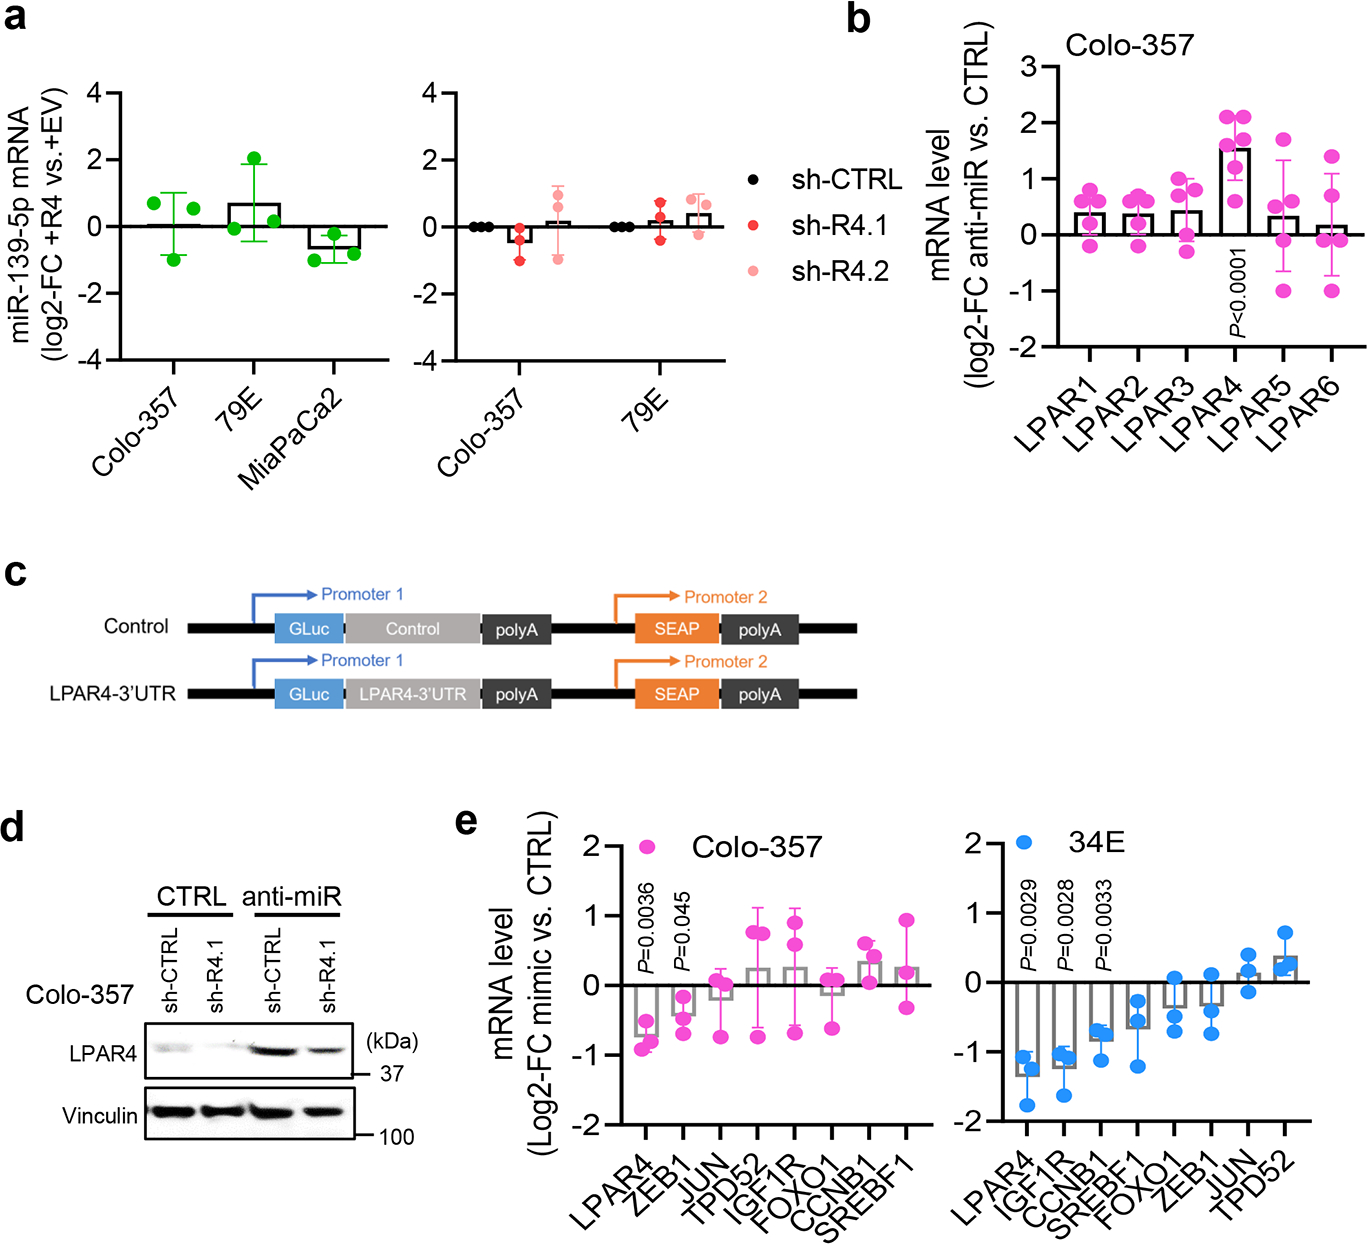
a, Graphs showing the log2-FC of miR-139–5p expression level in cells with or without LPAR4 expression manipulation. b, Graph shows the log2-FC of mRNA level of LPARs in Colo-357 cells treated with anti-miR-139–5p, normalized to cells treated with scrambled control miRNA. Data were presented as mean ± s.d. for n=6 independent experiments for LPAR4 and n=5 for other LPARs. c, Construct map for LPAR4–3’UTR luciferase reporter vector or control vector. d, Immunoblots showing representative of three independent experiments for LPAR4 protein level in Colo-357-sh-CTRL or sh-R4.1 cells treated with scrambled control miRNA vs. anti-miR-139–5p. e, Graphs showing the log2-FC of mRNA level of LPAR4 and various predicated miR-139–5p targets in Colo-357 or 34E cells treated with miR-139–5p mimic, normalized to cells treated with scrambled control miRNA. Data were presented as mean ± s.d. for n=3 independent experiments (a,b, and e). Statistical analyses were performed using two tailed unpaired one sample t-test (a,b, and e). Source numerical data are available in source data.
Extended Data Fig. 4: LPAR4 upregulates ECM genes and cancer stemness-related genes in the absence of exogenous LPA.
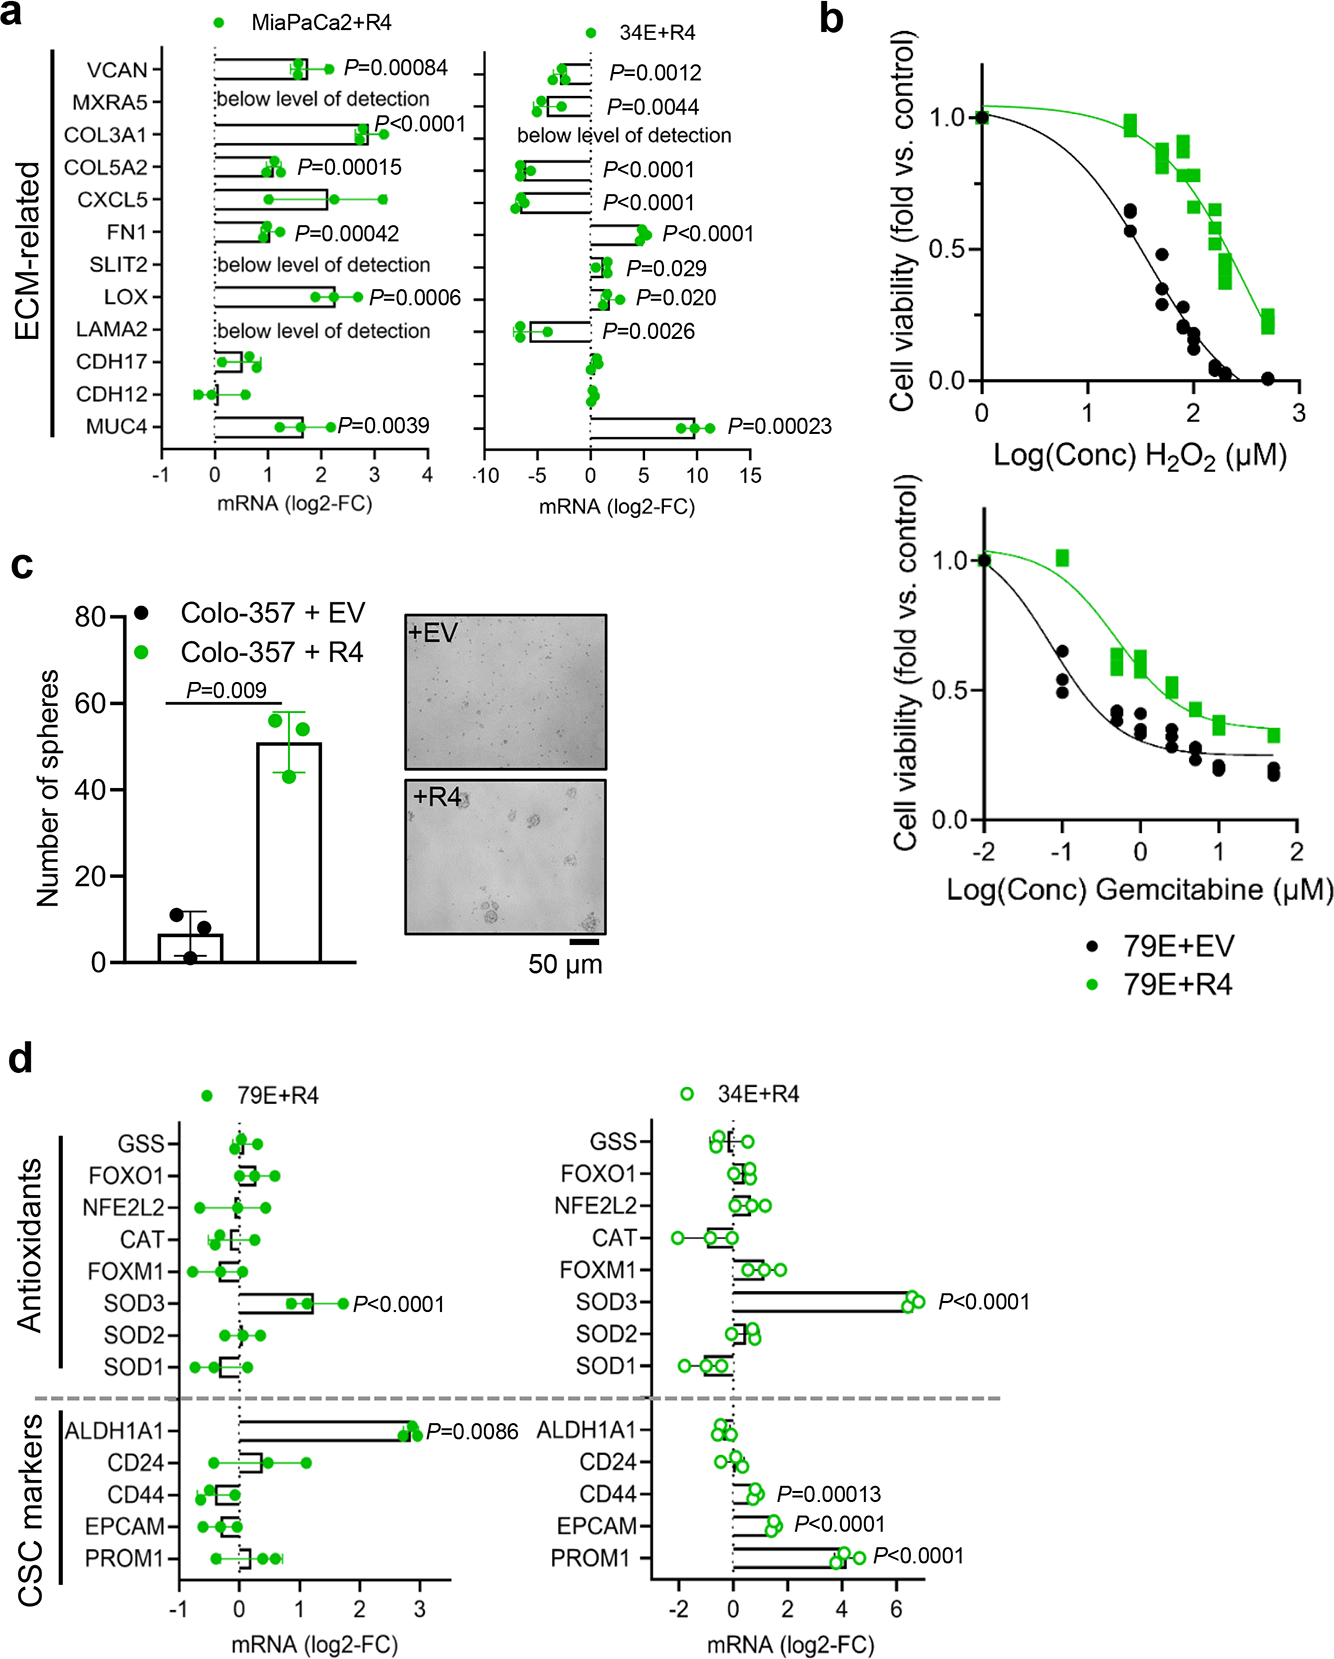
a, Quantitative RT-PCR confirmation of LPAR4 regulated genes associated with ECM in two additional pairs of +EV vs. +R4 cells, grown in charcoal stripped FBS containing media. All mRNA level was normalized to +EV cells. b, Graphs showing the relative number of viable 79E+EV or 79E+R4 cells treated with various doses of H2O2 or gemcitabine in serum-free media for 72 hours, evaluated by the CellTiter-Glo assay. c, Graph showing the number of tumorspheres formed by Colo-34+EV or Colo-357+R4 cells grown in 3D suspension with serum-free media at day 10. The right panel shows representative images from three biological experiments for spheres formed by +EV or +R4 cells at day 10. d, Relative gene expression of CSC markers and antioxidant genes in +EV vs. +R4 cells grown in charcoal stripped FBS containing media. All mRNA level was normalized to +EV cells. Data were presented as mean ± s.d. for n=3 independent experiments (a-d). Statistical analyses were performed using two tailed unpaired one sample t-test (a, c, and d). Source numerical data are available in source data.
Extended Data Fig. 5: LPAR4 induces expression of FN1 isoforms containing EDA and EDB domains.
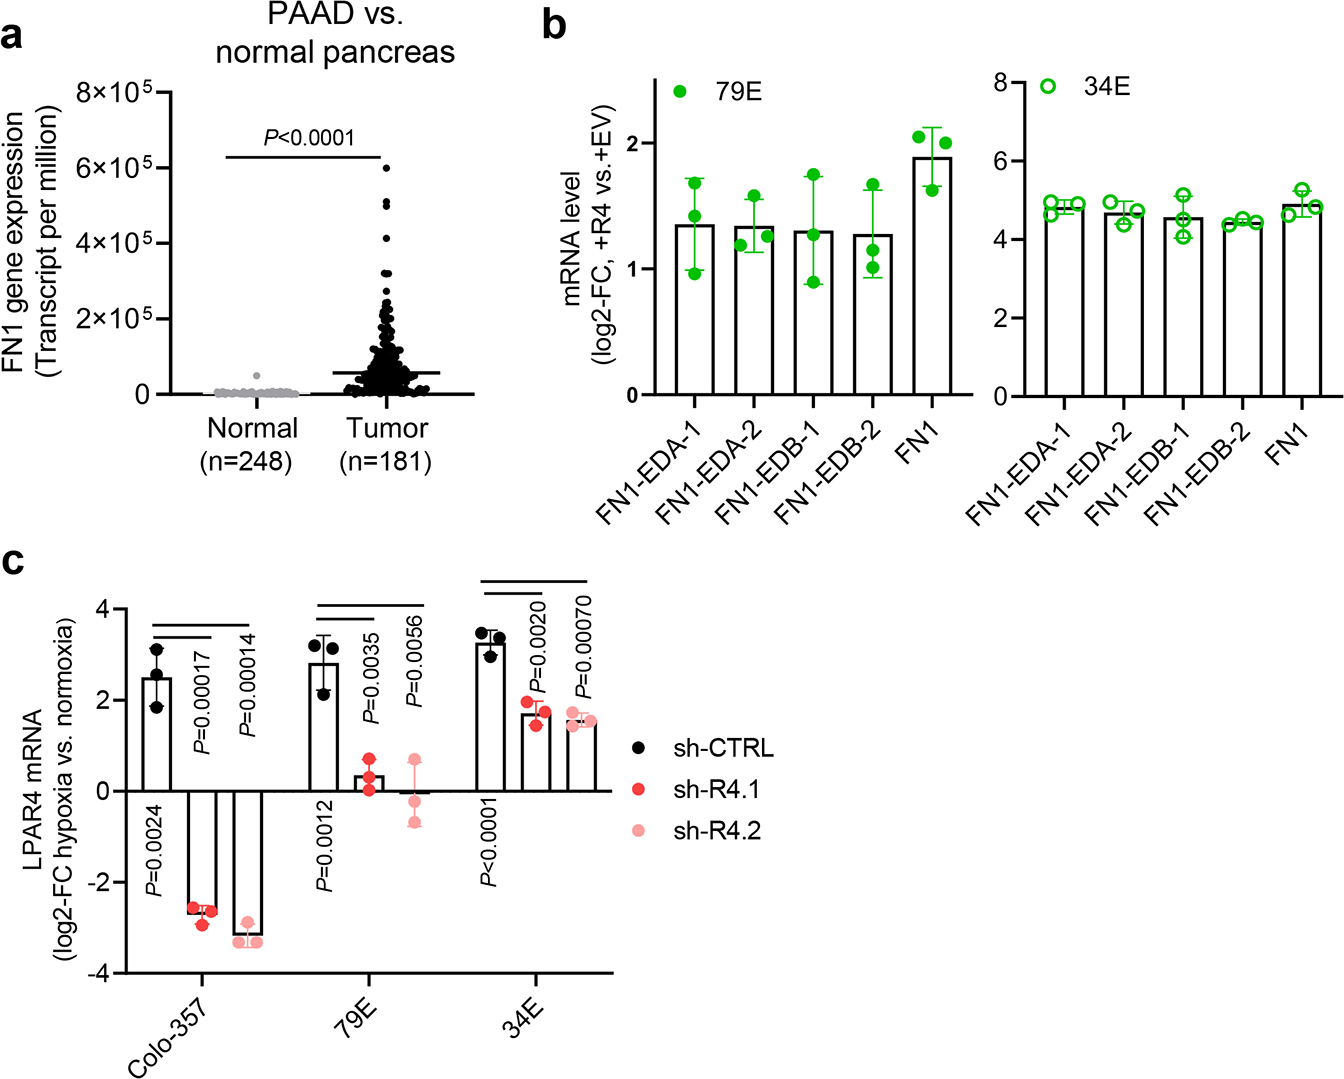
a, TNMplot showing FN1 gene expression is significantly higher in pancreatic adenocarcinoma (PAAD) than in normal pancreas (P<0.0001). The unpaired two-tailed t test was used for statistical analysis. Bars represent median values for each group. b, Graphs showing the relative mRNA level of total FN1, FN1 containing EDA domain (FN1-EDA), and FN1 containing EDB (FN1-EDB) in +EV vs. +R4 cells as indicated. All mRNA expression was normalized to +EV cells. Expression of FN1-EDA or FN1-EDB is quantitated independently by using two different sets of primers. c, Graphs showing the relative LPAR4 mRNA level in cells stably transfected with scrambled shRNA (sh-CTRL) or two different LPAR4 shRNAs (sh-R4.1 and sh-R4.2), treated with hypoxia and no serum for 72 hours. All were normalized to LPAR4 mRNA level in normoxia and no serum condition. Data were presented as mean ± s.d. for n=3 biological experiments (b and c). P-value was calculated using two tailed unpaired one sample t-test. Source numerical data are available in source data.
Extended Data Fig. 6: FN1 is a critical mediator of LPAR4-induced cancer stemness.
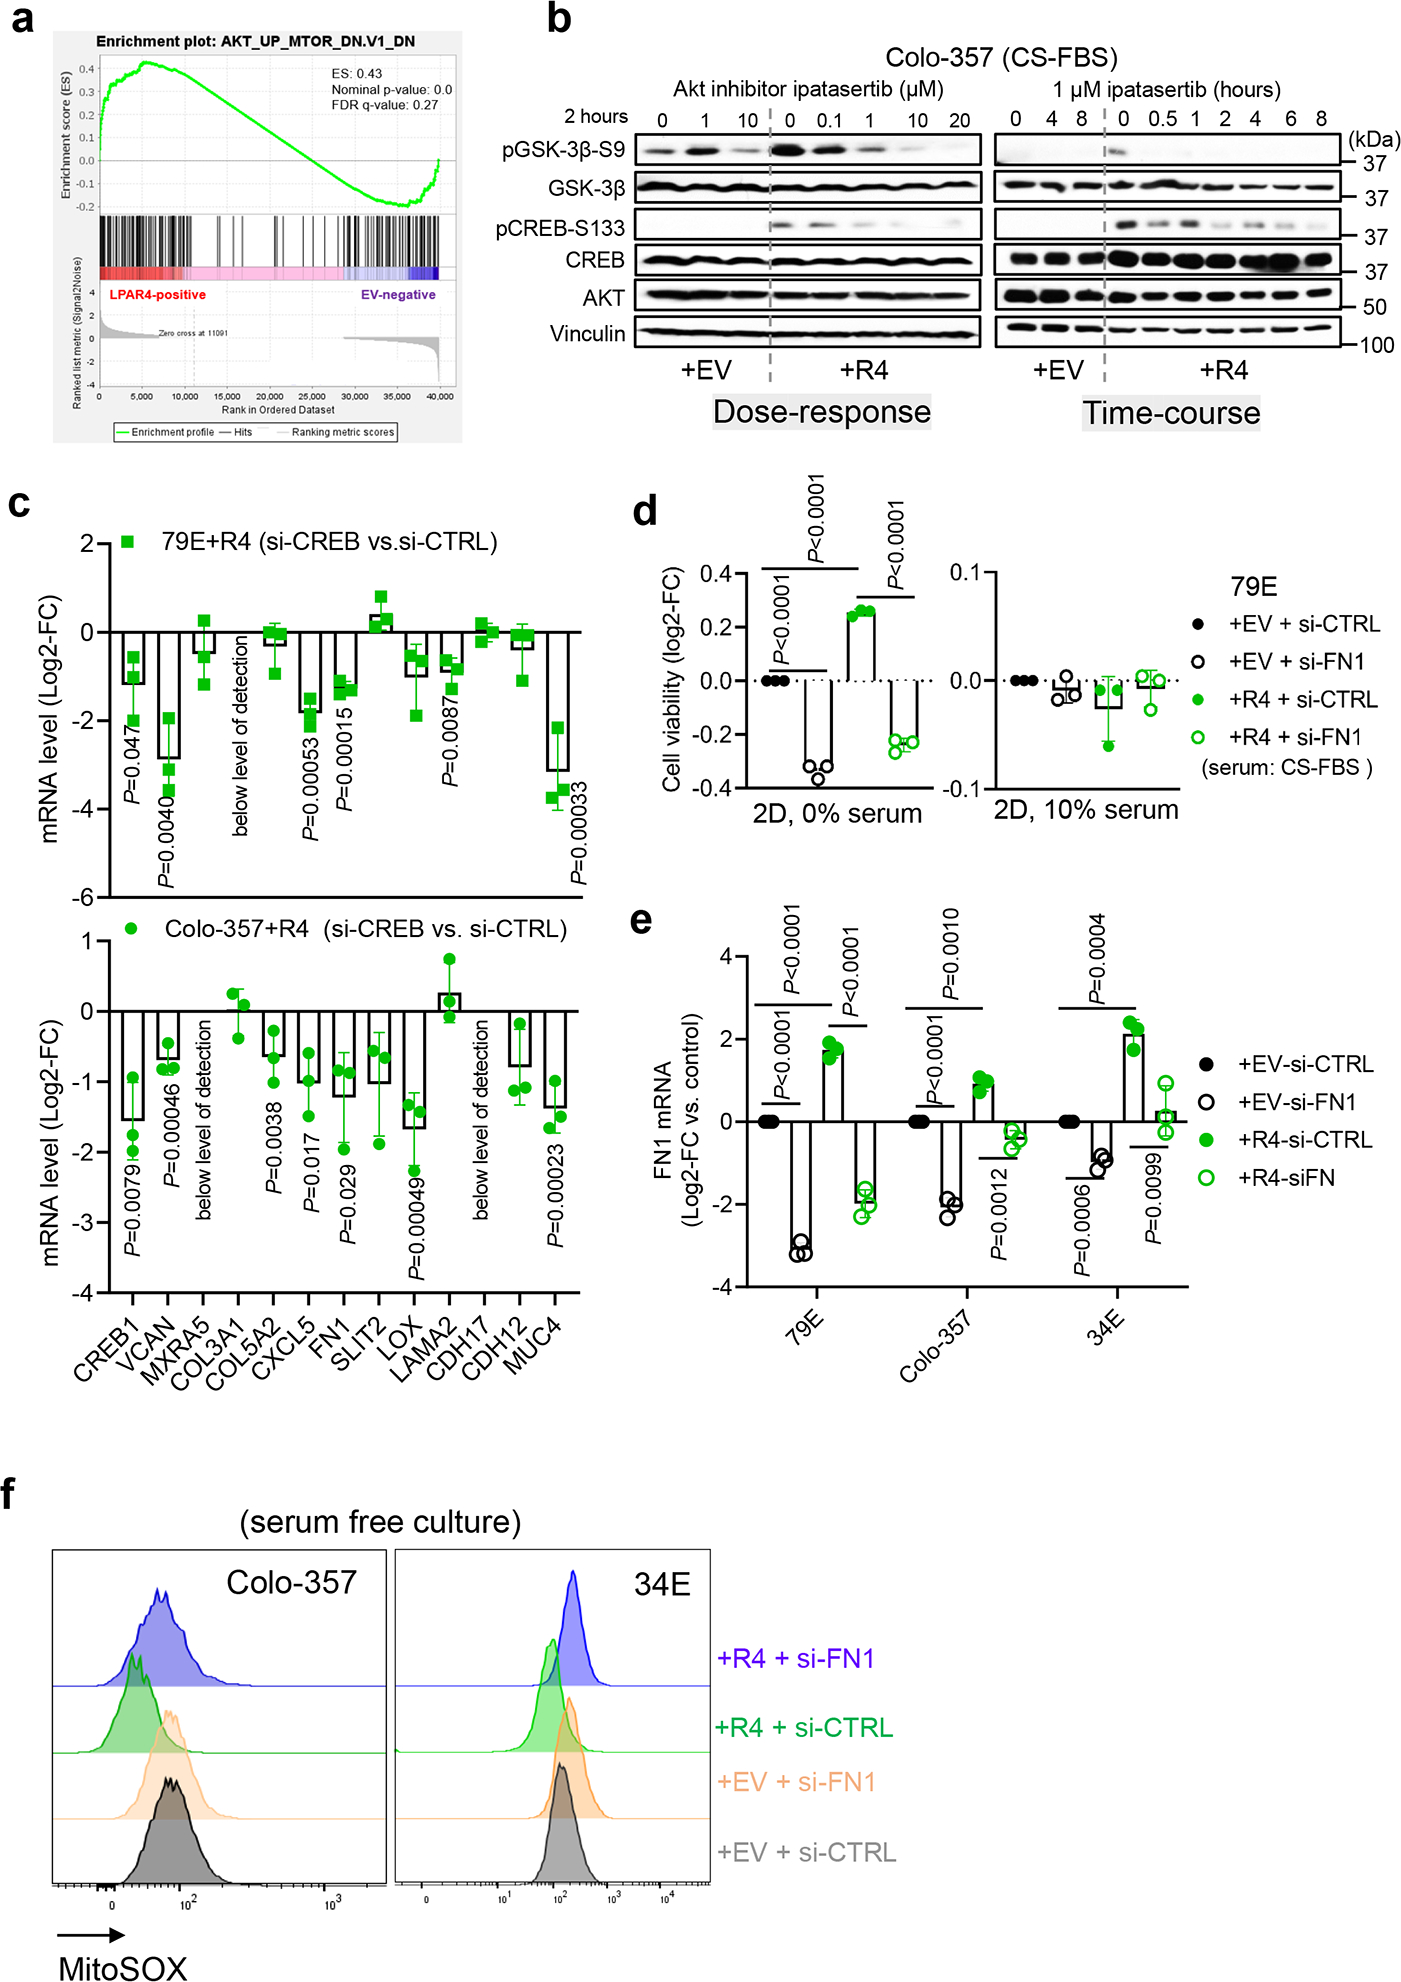
a, Gene Set Enrichment Analysis (GESA) for LPAR4-induced gene expression suggests that AKT signaling is upregulated in 79E+R4 cells in the absence of LPA. b, Immunoblot showing representative of three biological experiments for the protein levels of p-AKT-S473, AKT, p-GSK-3β-S9, p-CREB-S133, CREB, and vinculin in Colo-357+EV and Colo-357+R4 cells treated with Ipatasertib of a range of doses for 2 hours, or with 1 μM Ipatasertib in a time-course experiment. c, Relative mRNA level of ECM-related genes among LPAR4 gene signature in +R4 cells transfected with si-CREB as compared to cells transfected with si-CTRL. d, Graphs showing the cell viability of cells grown on 2D with serum free or with 10% charcoal stripped FBS containing media. Cell viability was assessed by the CellTiter-Glo assay, and all numbers were normalized to EV cells transfected with si-CTRL. e, Quantitative RT-PCR confirmation of FN1 knockdown by using siRNA in three pairs of +EV and +R4 cells as indicated. f, Representative histograms of three biological experiments showing MitoSOX signaling in +EV vs. +R4 cells treated with scrambled siRNA or si-FN1. All cells were cultured in serum free media for 48 hours prior to MitoSOX staining. Data were presented as mean ± s.d. for n=3 biological experiments (c-e). P-value was calculated using two tailed unpaired one sample t-test. Source numerical data are available in source data.
Extended Data Fig. 7: ECM deposited by LPAR4+ cells endows LPAR4-negative cells with growth advantage.
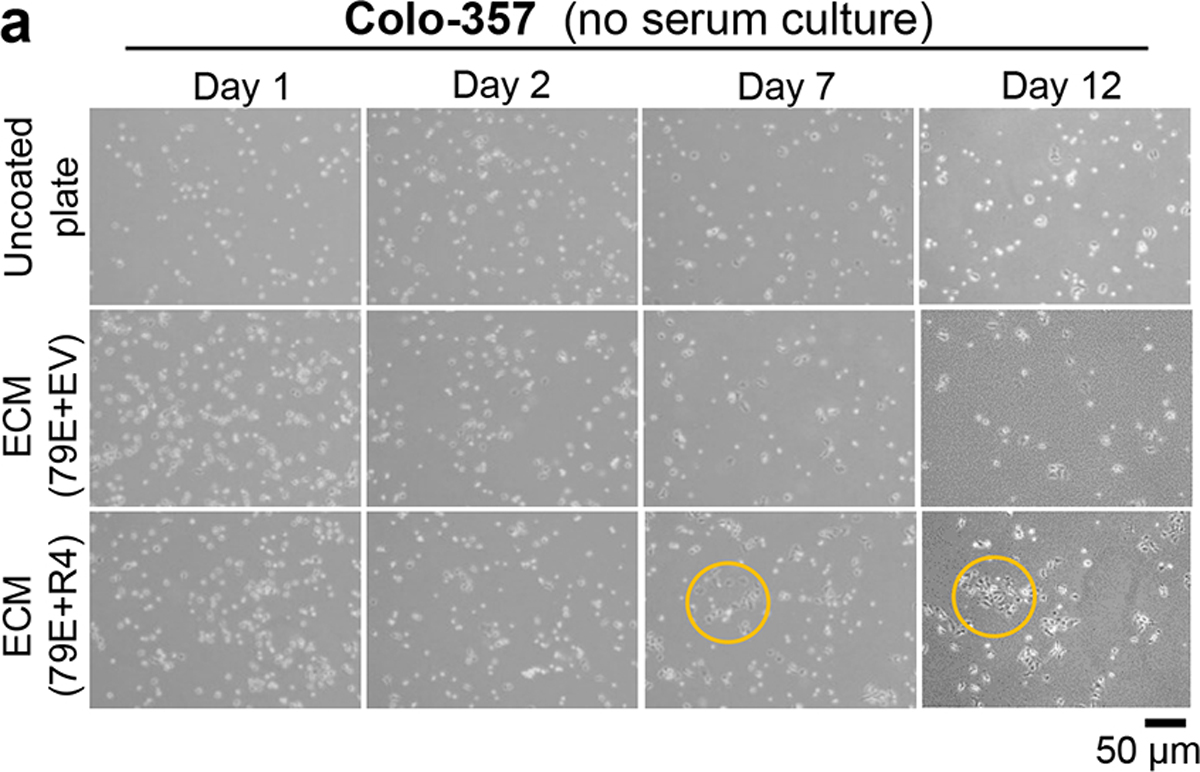
a, Representative images for three biological experiments for Colo-357 cells grown on uncoated plate or on plate coated with extracellular matrix deposited by 79E+EV or 79E+R4 cells in serum-free media at day 1, day 2, day 7, and day 12. Scale bar = 50 μM. Yellow color circled areas show representative cell colony.
Extended Data Fig. 8: Validation of LPAR4 antibody for immunohistochemistry application.
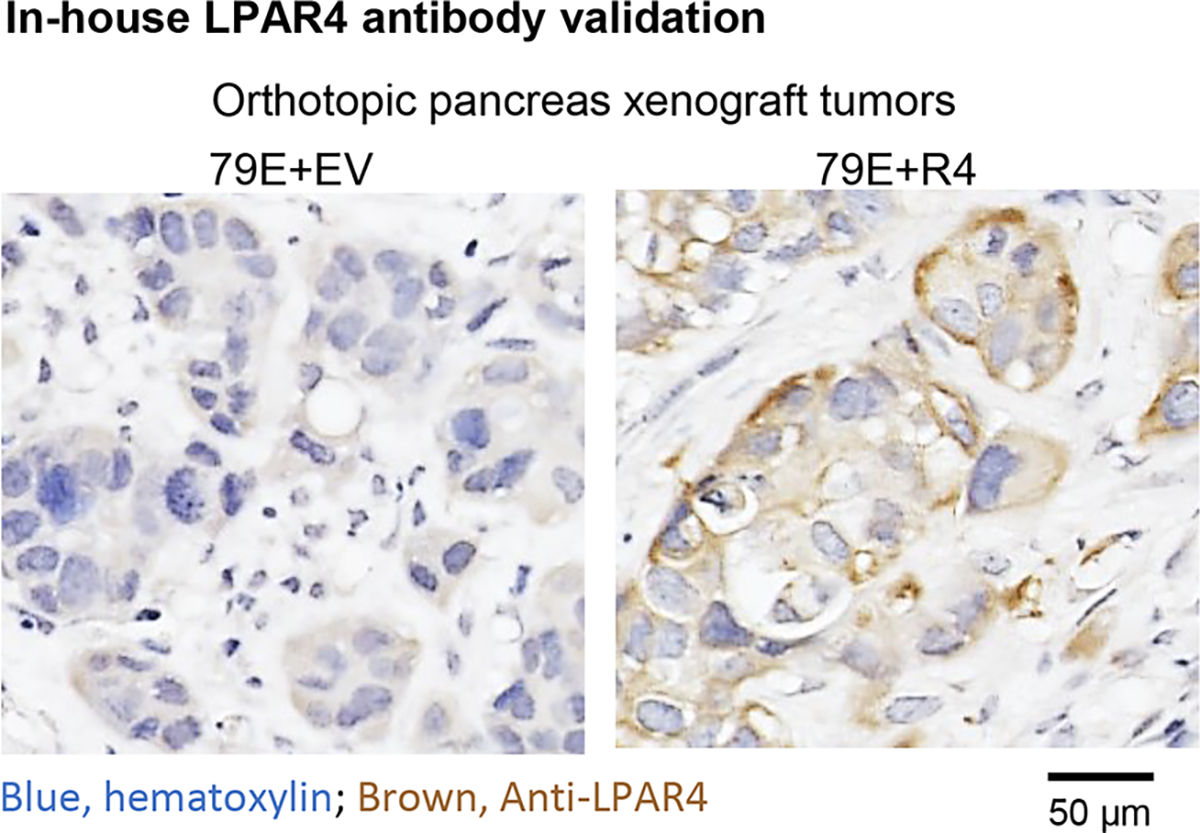
Representative LPAR4 immunohistochemistry staining for orthotopic xenograft tumors from 79E+EV (n=3 biologically independent samples) and 79E+R4 (n=3 biologically independent samples).
Supplementary Material
Acknowledgements
We thank Alex Reiss, Molly Morgan, and Mahima Advani for their technical support. This study was funded by the University of California Tobacco-Related Disease Research Program (CW, T29FT0343), and from grants awarded by the NIH, including T32CA009523 (TR), T32OD017863 (HIW), T32HL086344 (HIW), K01OD030513 (HIW), R01CA155620 (AML), R01CA045726 (DAC), and R35CA220512 (DAC). The funders had no role in study design, data collection and analysis, decision to publish or preparation of the manuscript.
Footnotes
Competing interests
The authors declare no competing interests.
Data availability
RNA-seq data that support the findings of this study have been deposited in the Gene Expressing Omnibus (GEO) under accession code GSE198002.
The human pancreatic adenocarcinoma data were derived from the TCGA Research Network: http://cancergenome.nih.gov/ and http://www.cbioportal.org/. The TNMplot public dataset that supports the findings of this study is available in https://tnmplot.com/analysis/ or details of source data files.
All other data supporting the findings of this study are available from the corresponding author on reasonable request.
References
- 1.Clarke MF Clinical and Therapeutic Implications of Cancer Stem Cells. N Engl J Med 380, 2237–2245 (2019). [DOI] [PubMed] [Google Scholar]
- 2.Zhou P et al. The epithelial to mesenchymal transition (EMT) and cancer stem cells: implication for treatment resistance in pancreatic cancer. Mol Cancer 16, 52 (2017). [DOI] [PMC free article] [PubMed] [Google Scholar]
- 3.Plaks V, Kong N & Werb Z The cancer stem cell niche: how essential is the niche in regulating stemness of tumor cells? Cell Stem Cell 16, 225–238 (2015). [DOI] [PMC free article] [PubMed] [Google Scholar]
- 4.Delmore JE et al. BET bromodomain inhibition as a therapeutic strategy to target c-Myc. Cell 146, 904–917 (2011). [DOI] [PMC free article] [PubMed] [Google Scholar]
- 5.Tigyi G, Lin KH, Jang IH & Lee SC Revisiting the role of lysophosphatidic acid in stem cell biology. Exp Biol Med (Maywood) 246, 1802–1809 (2021). [DOI] [PMC free article] [PubMed] [Google Scholar]
- 6.Seo EJ et al. Autotaxin Regulates Maintenance of Ovarian Cancer Stem Cells through Lysophosphatidic Acid-Mediated Autocrine Mechanism. Stem cells 34, 551–564 (2016). [DOI] [PubMed] [Google Scholar]
- 7.Hung KF, Yang T & Kao SY Cancer stem cell theory: Are we moving past the mist? J Chin Med Assoc 82, 814–818 (2019). [DOI] [PubMed] [Google Scholar]
- 8.Senft D & Ronai ZE Adaptive Stress Responses During Tumor Metastasis and Dormancy. Trends Cancer 2, 429–442 (2016). [DOI] [PMC free article] [PubMed] [Google Scholar]
- 9.Hayes JD, Dinkova-Kostova AT & Tew KD Oxidative Stress in Cancer. Cancer cell 38, 167–197 (2020). [DOI] [PMC free article] [PubMed] [Google Scholar]
- 10.Yao W, Maitra A & Ying H Recent insights into the biology of pancreatic cancer. EBioMedicine 53, 102655 (2020). [DOI] [PMC free article] [PubMed] [Google Scholar]
- 11.Chen J, Li H, Xu W & Guo X Evaluation of serum ATX and LPA as potential diagnostic biomarkers in patients with pancreatic cancer. BMC Gastroenterol 21, 58 (2021). [DOI] [PMC free article] [PubMed] [Google Scholar]
- 12.Auciello FR et al. A stromal lysolipid-autotaxin signaling axis promotes pancreatic tumor progression. Cancer Discovery, CD-18–1212 (2019). [DOI] [PMC free article] [PubMed] [Google Scholar]
- 13.Juin A et al. N-WASP Control of LPAR1 Trafficking Establishes Response to Self-Generated LPA Gradients to Promote Pancreatic Cancer Cell Metastasis. Developmental cell 51, 431–445 e437 (2019). [DOI] [PMC free article] [PubMed] [Google Scholar]
- 14.Yamada T et al. Lysophosphatidic acid (LPA) in malignant ascites stimulates motility of human pancreatic cancer cells through LPA1. The Journal of biological chemistry 279, 6595–6605 (2004). [DOI] [PubMed] [Google Scholar]
- 15.Komachi M et al. LPA1 receptors mediate stimulation, whereas LPA2 receptors mediate inhibition, of migration of pancreatic cancer cells in response to lysophosphatidic acid and malignant ascites. Carcinogenesis 30, 457–465 (2009). [DOI] [PubMed] [Google Scholar]
- 16.Ishii S et al. Diverse effects of LPA4, LPA5 and LPA6 on the activation of tumor progression in pancreatic cancer cells. Biochemical and biophysical research communications 461, 59–64 (2015). [DOI] [PubMed] [Google Scholar]
- 17.Lee JW et al. Lysophosphatidic Acid Receptor 4 Is Transiently Expressed during Cardiac Differentiation and Critical for Repair of the Damaged Heart. Mol Ther 29, 1151–1163 (2021). [DOI] [PMC free article] [PubMed] [Google Scholar]
- 18.Auciello FR et al. A Stromal Lysolipid-Autotaxin Signaling Axis Promotes Pancreatic Tumor Progression. Cancer discovery 9, 617–627 (2019). [DOI] [PMC free article] [PubMed] [Google Scholar]
- 19.Bartha A & Gyorffy B TNMplot.com: A Web Tool for the Comparison of Gene Expression in Normal, Tumor and Metastatic Tissues. Int J Mol Sci 22 (2021). [DOI] [PMC free article] [PubMed] [Google Scholar]
- 20.Sen CK & Ghatak S miRNA control of tissue repair and regeneration. Am J Pathol 185, 2629–2640 (2015). [DOI] [PMC free article] [PubMed] [Google Scholar]
- 21.Chaudhary AK, Mondal G, Kumar V, Kattel K & Mahato RI Chemosensitization and inhibition of pancreatic cancer stem cell proliferation by overexpression of microRNA-205. Cancer Lett 402, 1–8 (2017). [DOI] [PMC free article] [PubMed] [Google Scholar]
- 22.Jiao X et al. microRNA: The Impact on Cancer Stemness and Therapeutic Resistance. Cells 9 (2019). [DOI] [PMC free article] [PubMed] [Google Scholar]
- 23.Ma J, Zhang J, Weng YC & Wang JC EZH2-Mediated microRNA-139-5p Regulates Epithelial-Mesenchymal Transition and Lymph Node Metastasis of Pancreatic Cancer. Mol Cells 41, 868–880 (2018). [DOI] [PMC free article] [PubMed] [Google Scholar]
- 24.Hasseine LK et al. miR-139 impacts FoxO1 action by decreasing FoxO1 protein in mouse hepatocytes. Biochemical and biophysical research communications 390, 1278–1282 (2009). [DOI] [PubMed] [Google Scholar]
- 25.Okoye I et al. Plasma Extracellular Vesicles Enhance HIV-1 Infection of Activated CD4(+) T Cells and Promote the Activation of Latently Infected J-Lat10.6 Cells via miR-139-5p Transfer. Front Immunol 12, 697604 (2021). [DOI] [PMC free article] [PubMed] [Google Scholar]
- 26.Topalovski M & Brekken RA Matrix control of pancreatic cancer: New insights into fibronectin signaling. Cancer letters 381, 252–258 (2016). [DOI] [PMC free article] [PubMed] [Google Scholar]
- 27.Magnuson MA & Osipovich AB Pancreas-specific Cre driver lines and considerations for their prudent use. Cell metabolism 18, 9–20 (2013). [DOI] [PMC free article] [PubMed] [Google Scholar]
- 28.Geraldo LHM et al. Role of lysophosphatidic acid and its receptors in health and disease: novel therapeutic strategies. Signal Transduct Target Ther 6, 45 (2021). [DOI] [PMC free article] [PubMed] [Google Scholar]
- 29.Winkler J, Abisoye-Ogunniyan A, Metcalf KJ & Werb Z Concepts of extracellular matrix remodelling in tumour progression and metastasis. Nature communications 11, 5120 (2020). [DOI] [PMC free article] [PubMed] [Google Scholar]
- 30.Ou J et al. Fibronectin extra domain A (EDA) sustains CD133(+)/CD44(+) subpopulation of colorectal cancer cells. Stem cell research 11, 820–833 (2013). [DOI] [PMC free article] [PubMed] [Google Scholar]
- 31.Yu Q et al. Fibronectin Promotes the Malignancy of Glioma Stem-Like Cells Via Modulation of Cell Adhesion, Differentiation, Proliferation and Chemoresistance. Front Mol Neurosci 11, 130 (2018). [DOI] [PMC free article] [PubMed] [Google Scholar]
- 32.Zhong C et al. Remodeling cancer stemness by collagen/fibronectin via the AKT and CDC42 signaling pathway crosstalk in glioma. Theranostics 11, 1991–2005 (2021). [DOI] [PMC free article] [PubMed] [Google Scholar]
- 33.Efthymiou G et al. Shaping Up the Tumor Microenvironment With Cellular Fibronectin. Frontiers in oncology 10, 641 (2020). [DOI] [PMC free article] [PubMed] [Google Scholar]
- 34.Nakayama K cAMP-response element-binding protein (CREB) and NF-kappaB transcription factors are activated during prolonged hypoxia and cooperatively regulate the induction of matrix metalloproteinase MMP1. The Journal of biological chemistry 288, 22584–22595 (2013). [DOI] [PMC free article] [PubMed] [Google Scholar]
- 35.Habib SL, Mohan S, Liang S, Li B & Yadav M Novel mechanism of transcriptional regulation of cell matrix protein through CREB. Cell Cycle 14, 2598–2608 (2015). [DOI] [PMC free article] [PubMed] [Google Scholar]
- 36.Sakamoto KM & Frank DA CREB in the pathophysiology of cancer: implications for targeting transcription factors for cancer therapy. Clinical cancer research : an official journal of the American Association for Cancer Research 15, 2583–2587 (2009). [DOI] [PMC free article] [PubMed] [Google Scholar]
- 37.Singh P & Schwarzbauer JE Fibronectin and stem cell differentiation - lessons from chondrogenesis. J Cell Sci 125, 3703–3712 (2012). [DOI] [PMC free article] [PubMed] [Google Scholar]
- 38.Gattazzo F, Urciuolo A & Bonaldo P Extracellular matrix: a dynamic microenvironment for stem cell niche. Biochimica et biophysica acta 1840, 2506–2519 (2014). [DOI] [PMC free article] [PubMed] [Google Scholar]
- 39.Topalovski M & Brekken RA Matrix control of pancreatic cancer: New insights into fibronectin signaling. Cancer Lett 381, 252–258 (2016). [DOI] [PMC free article] [PubMed] [Google Scholar]
- 40.Amrutkar M, Aasrum M, Verbeke CS & Gladhaug IP Secretion of fibronectin by human pancreatic stellate cells promotes chemoresistance to gemcitabine in pancreatic cancer cells. BMC Cancer 19, 596 (2019). [DOI] [PMC free article] [PubMed] [Google Scholar]
- 41.Feig C et al. The pancreas cancer microenvironment. Clinical cancer research : an official journal of the American Association for Cancer Research 18, 4266–4276 (2012). [DOI] [PMC free article] [PubMed] [Google Scholar]
- 42.Liu X, Zhou L, Chen Y, Jiang X & Jiang J CircRNF13 Promotes the Malignant Progression of Pancreatic Cancer through Targeting miR-139-5p/IGF1R Axis. J Oncol 2021, 6945046 (2021). [DOI] [PMC free article] [PubMed] [Google Scholar]
- 43.Bao B, Yu X & Zheng W MiR-139-5p Targeting CCNB1 Modulates Proliferation, Migration, Invasion and Cell Cycle in Lung Adenocarcinoma. Mol Biotechnol 64, 852–860 (2022). [DOI] [PubMed] [Google Scholar]
- 44.Jin SS, Lin CJ, Lin XF, Zheng JZ & Guan HQ Silencing lncRNA NEAT1 reduces nonalcoholic fatty liver fat deposition by regulating the miR-139-5p/c-Jun/SREBP-1c pathway. Ann Hepatol 27, 100584 (2022). [DOI] [PubMed] [Google Scholar]
- 45.Seguin L et al. An integrin beta(3)-KRAS-RalB complex drives tumour stemness and resistance to EGFR inhibition. Nature cell biology 16, 457–468 (2014). [DOI] [PMC free article] [PubMed] [Google Scholar]
- 46.Desgrosellier JS et al. Integrin alphavbeta3 drives slug activation and stemness in the pregnant and neoplastic mammary gland. Developmental cell 30, 295–308 (2014). [DOI] [PMC free article] [PubMed] [Google Scholar]
- 47.Desgrosellier JS et al. An integrin alpha(v)beta(3)-c-Src oncogenic unit promotes anchorage-independence and tumor progression. Nature medicine 15, 1163–1169 (2009). [DOI] [PMC free article] [PubMed] [Google Scholar]
- 48.Sun Q et al. Proapoptotic PUMA targets stem-like breast cancer cells to suppress metastasis. The Journal of clinical investigation 128, 531–544 (2018). [DOI] [PMC free article] [PubMed] [Google Scholar]
- 49.Cheresh DA & Spiro RC Biosynthetic and functional properties of an Arg-Gly-Asp-directed receptor involved in human melanoma cell attachment to vitronectin, fibrinogen, and von Willebrand factor. The Journal of biological chemistry 262, 17703–17711 (1987). [PubMed] [Google Scholar]
- 50.Hu Y & Smyth GK ELDA: extreme limiting dilution analysis for comparing depleted and enriched populations in stem cell and other assays. J Immunol Methods 347, 70–78 (2009). [DOI] [PubMed] [Google Scholar]
- 51.Xie S et al. sRNAPrimerDB: comprehensive primer design and search web service for small non-coding RNAs. Bioinformatics 35, 1566–1572 (2019). [DOI] [PubMed] [Google Scholar]
- 52.Hellewell AL, Rosini S & Adams JC A Rapid, Scalable Method for the Isolation, Functional Study, and Analysis of Cell-derived Extracellular Matrix. Journal of visualized experiments : JoVE (2017). [DOI] [PMC free article] [PubMed] [Google Scholar]
- 53.Seguin L et al. Galectin-3, a Druggable Vulnerability for KRAS-Addicted Cancers. Cancer discovery 7, 1464–1479 (2017). [DOI] [PMC free article] [PubMed] [Google Scholar]
- 54.Cosset E et al. Glut3 Addiction Is a Druggable Vulnerability for a Molecularly Defined Subpopulation of Glioblastoma. Cancer cell 32, 856–868 e855 (2017). [DOI] [PMC free article] [PubMed] [Google Scholar]
Associated Data
This section collects any data citations, data availability statements, or supplementary materials included in this article.
Supplementary Materials
Data Availability Statement
RNA-seq data that support the findings of this study have been deposited in the Gene Expressing Omnibus (GEO) under accession code GSE198002.
The human pancreatic adenocarcinoma data were derived from the TCGA Research Network: http://cancergenome.nih.gov/ and http://www.cbioportal.org/. The TNMplot public dataset that supports the findings of this study is available in https://tnmplot.com/analysis/ or details of source data files.
All other data supporting the findings of this study are available from the corresponding author on reasonable request.


