

Abstract
We describe a genomic DNA-based signal sequence trap method, signal-exon trap (SET), for the identification of genes encoding secreted and membrane-bound proteins. SET is based on the coupling of an exon trap to the translation of captured exons, which allows screening of the exon-encoded polypeptides for signal peptide function. Since most signal sequences are expected to be located in the 5′-terminal exons of genes, we first demonstrate that trapping of these exons is feasible. To test the applicability of SET for the screening of complex genomic DNA, we evaluated two critical features of the method. Specificity was assessed by the analysis of random genomic DNA and efficiency was demonstrated by screening a 425 kb YAC known to contain the genes of four secretory or membrane-bound proteins. All trapped clones contained a translation initiation signal followed by a hydrophobic stretch of amino acids representing either a known signal peptide, transmembrane domain or novel sequence. Our results suggest that SET is a potentially useful method for the isolation of signal sequence-containing genes and may find application in the discovery of novel members of known secretory gene clusters, as well as in other positional cloning approaches.
INTRODUCTION
Intercellular signaling mediated by secreted and membrane-bound proteins plays an important role in many fundamental cellular and organismal functions. Historically, secreted factors and their receptors have been identified using a functional approach, by the tedious procedure of establishing specific bioassay systems for each molecule. Recently, a structural approach was proposed for the cloning of cDNAs encoding secreted and membrane proteins without the need for functional assays (1). The signal sequence trap method takes advantage of a common functional motif present in most secreted and type I membrane proteins, the N-terminal signal peptide, which is responsible for targeting the nascent polypeptide chain to the secretory pathway (2). In signal sequence trapping, cDNA fragments are cloned upstream of a reporter gene to produce fusion proteins. Signal sequence-containing cDNAs target the reporter to the cell surface where it is detected by fluorescence microscopy (1). Although this method, as well as various adaptations employing different reporters (3,4), has been successfully used to identify secreted and membrane proteins, cDNA-based signal sequence trapping has two fundamental limitations. First, unequal representation of different messages makes the identification of weakly expressed genes difficult. The use of normalized cDNA libraries reduces but does not eliminate this problem (5). Second, the choice of cDNA source limits the scope of the analysis to those genes that are expressed in the selected tissue at the time of analysis. Therefore, the identification of genes that are expressed transiently or in response to particular external stimuli is inefficient by cDNA-based approaches. These problems are illustrated by our survey of the database of expressed sequence tags (dbEST) indicating that several cytokines (e.g. IL-3, IL-5, IL-17 and IFNα) are not represented among the ~2 800 000 cDNA sequences in the database.
The analysis of genomic DNA instead of cDNA provides a solution to the problem of representation, because genomic DNA is inherently normalized and every gene is accessible regardless of expression pattern. Therefore, we developed a method, signal-exon trap (SET), for the cloning of signal sequence-containing genes from genomic DNA. SET combines features of the exon trap (6) and signal sequence trap methods: exons are not only trapped but also translated, which enables screening for signal peptide function. In addition, we developed a sensitive assay suitable for large-scale screening by employing a cytoplasmically inactive, secretory pathway-specific reporter enzyme, dipeptidyl peptidase IV/CD26 (manuscript in preparation). We addressed three critical questions in the course of developing SET. First, since a considerable fraction of signal sequences are expected to reside within the 5′-terminal exons of genes and trapping of such exons has not yet been demonstrated, we examined whether 5′-terminal exons can be trapped. Second, we tested whether the signals utilized in SET provide sufficient specificity for the analysis of complex genomic DNA. Finally, we determined the efficiency of this method for the isolation of secretory genes. Our data indicate that SET is a useful gene identification method with potential applications in the positional cloning of receptors and their ligands, as well as in the discovery of new members of secretory gene clusters.
MATERIALS AND METHODS
Vector construction
The pSET vectors were constructed from the pJT-2 eukaryotic expression vector (7) by replacing the SV40 late region intron with a synthetic intron containing multiple cloning sites and a splice acceptor (SA) site. To enable in-frame fusions between trapped exons and the reporter, three versions of the vector (pSETa, b and c) were prepared. Double-stranded DNA fragments, generated by annealing and subsequent primer extension of the ‘upper’ and one of the ‘lower’ oligonucleotides (Table 1), were digested with PpuMI and BclI and inserted into PpuMI/BamHI-digested pJT-2 vector. A truncated form of rat CD26 (ΔCD26) lacking the signal-anchor region was PCR amplified from a cDNA clone (8) using primers ΔCD26-f and ΔCD26-r (Table 1), digested with BamHI and NotI and ligated into BglII/NotI-digested pSET vectors, immediately 3′ of the SA site. To prevent translation of the reporter without splicing, a synthetic translational terminator (Term-f and Term-r; Table 1) was inserted at the BamHI site of the vector.
Table 1. Oligonucleotides used for vector construction and PCR analyses.

For construction of the pSET-C3 plasmids, a 1.27 kb fragment of the complement component C3 gene (9) was PCR amplified (C3-f and C3-r; Table 1) from mouse genomic DNA. This genomic fragment, which contains the first exon of the C3 gene, was digested with BclI and ligated into BamHI-digested pSETa (in-frame) and pSETb (out-of-frame) vectors.
For cytoplasmic expression of the reporter enzyme, a double-stranded DNA fragment (Kozak-f or Kozak-r; Table 1) containing a consensus translation initiation site (10) was ligated into SalI/NotI-digested pJT-2 vector. ΔCD26 cDNA was then PCR amplified using the primers described earlier, digested with NotI and inserted into the NotI site, resulting in the icΔCD26 vector.
Various genomic constructs of the IL-13 gene were made by cloning of PCR amplified fragments into the pSETb vector following SalI/EcoRI double digestion. The following PCR primers were used to generate the constructs shown in Figure 3: 1, f1-r1; 2, f1-r2; 3, f1-r3; 4, f2-r2; 5, f2-r3 (Table 1).
Figure 3.

Effect of genomic insert size on the SET signal. Various genomic fragments (open horizontal bars) of the human IL-13 gene were inserted into the pSETb vector. Increasing the length of the fusion partner of the secreted reporter did not have a major effect on enzymatic activity (constructs 1–3). Extending the genomic inserts 5′ of the first exon (constructs 4 and 5), however, resulted in significantly (*, P < 0.01) diminished activities (mean ± SD, n = 3). Exons of the IL-13 gene are represented by numbered boxes. The signal sequence is indicated by black and the coding regions by gray boxes.
Cell culture, electroporation and CD26 activity assay
COS-7 cells were maintained in DMEM containing 10% fetal calf serum. Electroporations were performed in 0.4 cm gap electroporation cuvettes (Bio-Rad) or in 96-well plates using a 96-well electroporator head as described (11). CD26 enzymatic activity in cell culture supernatants was determined using an antibody capture assay described previously (11).
Library construction and screening
Mouse genomic DNA was digested with BamHI, fractionated on Sephacryl S-500 HR columns (Gibco BRL) and ligated into BamHI-digested, alkaline phosphatase-treated pSETb vector. Average insert size was ~2.6 kb. Bacterial colonies were inoculated into the wells of 96-well plates containing 300 µl Terrific Broth medium supplemented with 100 µg/ml ampicillin and 7% glycerol, using an automated colony picking system (BioPick). After 16–24 h growth at 37°C, bacterial cultures were pooled by transferring 100 µl from each of 12 wells into a single well of a square-well plate (Beckman). The original plates were frozen at –80°C and the pool plates were used for 96-well plate-based plasmid preparation (Qiagen). Plasmid DNA was solubilized in 40 µl DMEM and 10–20 µl (5–10 µg) was used for 96-well electroporation. Following the screening of cell culture supernatants for CD26 enzymatic activity, bacterial clones corresponding to positive pools were retrieved from the frozen master plates and analyzed individually. The sequences of genomic inserts and RT–PCR products (see below) from positive clones were determined by cycle sequencing.
For the YAC screening experiment, a 425 kb YAC (A94G6) from the human 5q31 cytokine gene cluster (12) was gel purified by pulsed-field gel electrophoresis and cloned into the SalI site of pSET vectors following partial digest with Sau3AI and partial filling-in with Klenow enzyme (13). Average insert size in the library was ~1.1 kb. Plasmid minipreps of clones were screened individually in 96-well format as described above.
RNA amplification, determination of splicing pattern and sequence analyses
Total cellular RNA was harvested 24 h after transfection with SET-positive plasmids using RNeasy columns (Qiagen). DNase I treatment and reverse transcription of 5 µg RNA with random primers was performed using the SuperScriptII Preamplification System (Gibco BRL) according to the manufacturer’s instructions. PCR was performed with Taq polymerase (Boehringer Mannheim) using a PTC-100 thermal cycler (MJ Research). For exon amplification, primers A, A* and B were used (Table 1). Amplification products larger than 126 bp obtained with primers A and B and no product with A* and B indicates the presence of a trapped internal exon; a 126 bp product obtained with A and B and a product of any size with A* and B indicates the presence of a trapped 5′-terminal exon (see Fig. 2A for primer locations and Fig. 2B for a representative example). Typically, 25–30 amplification cycles were performed, consisting of 30 s at 94°C, 30 s at 55°C and 1 min at 72°C. Amplified products were cloned using a TA cloning system (Invitrogen). Sequence analyses were performed using the Wisconsin Package, OpenVMS v.9.0 (GCG), the RepeatMasker2 program (http://ftp.genome.washington.edu ) and the SignalP v.1.1 program (14).
Figure 2.
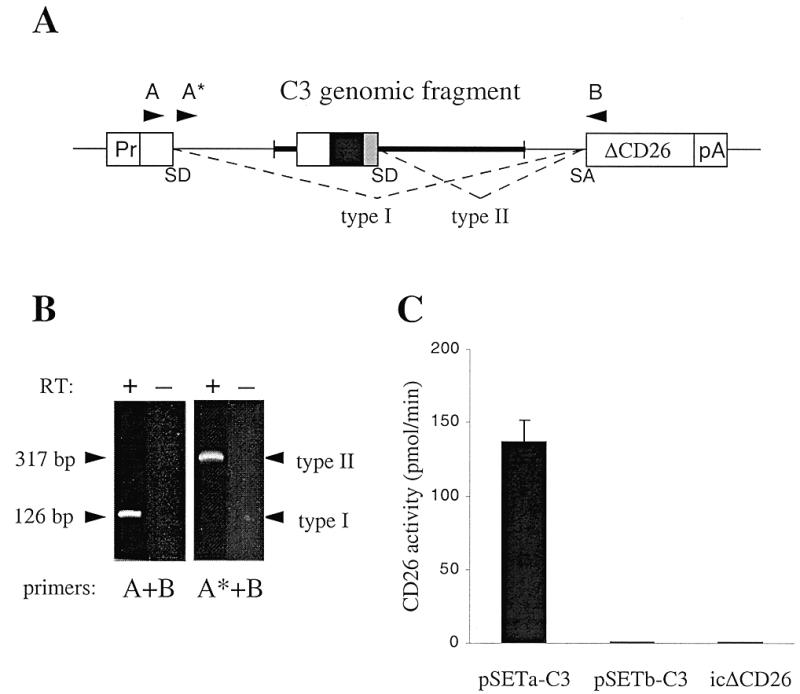
SET analysis of a 5′-terminal exon with a signal sequence. (A) Schematic representation of the pSET-C3 constructs. A genomic DNA fragment (bold line) containing the 5′-terminal exon of the complement component C3 gene was inserted into the pSETa (in-frame) and pSETb (out-of-frame) vectors. RNA derived from these constructs can be spliced in two different ways. The single SD site provided by the C3 5′-terminal exon may be disregarded by the splicing machinery leading to removal of the entire SV40 intron and genomic insert (type I splicing). Alternatively, the C3 exon-derived SD site may be utilized instead of the vector-derived SD site, resulting in retention of the C3 exon and 5′ genomic sequences (type II splicing). Splicing events can be analyzed by RT–PCR using vector-based primers A, A* and B (arrowheads). (B) RT–PCR analysis of pSETa-C3-transfected COS-7 cells. Total RNA was isolated from transfected cells and used for cDNA synthesis in the presence (+) and absence (–) of reverse transcriptase. As confirmed by sequencing, the products amplified with the A+B and A*+B primer pairs [see (A)] represent type I and type II splicing events, respectively. (C) CD26 activities of culture media. COS-7 cells were transfected with pSETa-C3 (in-frame), pSETb-C3 (out-of-frame) and icΔCD26, a construct expressing intracellular (cytosolic) CD26 enzyme. Data are the mean (± SD) of three transfection experiments.
RESULTS
Vector design and experimental strategy
The strategy for SET is outlined in Figure 1. The pSET vector is a transient expression vector designed for the insertion of genomic DNA fragments within the intron of the SV40 late transcript (15). The reporter gene, a 5′-truncated rat CD26 cDNA fragment (ΔCD26) with the translation start site and signal-anchor sequence (16) deleted, is downstream of the SV40 SA site and is followed by the SV40 polyadenylation signal.
Figure 1.

Outline of the SET procedure. Genomic DNA fragments are inserted into the pSET vectors (with three reading frames of the reporter, as indicated) at the multiple cloning site (MCS). After transfection into COS-7 cells exons are retained in the mature RNA (exon trap). In the presence of an N-terminal signal sequence (black box) with a translation initiation site (white arrowhead) a fusion protein is generated with the ΔCD26 reporter, followed by secretion into the culture medium (signal trap). Enzymatic activity of the secreted fusion protein is assayed in the cell culture supernatant. The trapped exon harboring the signal sequence can be recovered from RNA isolated from transfected COS-7 cells by RT–PCR using vector-based primers (A and B). Pr, SV40 promoter; SD, splice donor site; SA, splice acceptor site; pA, SV40 polyadenylation signal; *, stop codon to eliminate translation of the reporter in the absence of appropriate splicing (see text for details).
Upon transfection of COS-7 cells with the pSET vector, transcription of the reporter is initiated from the SV40 promoter, followed by splicing of the SV40 intron. When a genomic fragment containing an exon in sense orientation is inserted into the cloning site, the exon is retained in the mature mRNA and this trapped exon can be identified by reverse transcription-coupled PCR (RT–PCR). In the presence of a translation initiation site within the exon, a fusion protein containing the reporter is produced. Furthermore, if the trapped exon codes for a cleavable signal peptide, the fusion protein is directed to the secretory pathway, resulting in the appearance of CD26 enzymatic activity in the cell culture supernatant. To achieve in-frame fusion of any captured exon with the reporter, we constructed three versions of the pSET vector (pSETa–c) with different phasings of ΔCD26 with respect to the SA site (Fig. 1).
Preliminary screening results with the pSET vectors indicated that a major source of false positives are genomic fragments with cryptic SA sites leading to the retention of downstream genomic sequences in the spliced mRNA (data not shown). Randomly occurring hydrophobic peptides translated from these transcripts (17) target the fusion protein to the secretory pathway, resulting in false positives. To eliminate these events, translational termination codons were introduced into the pSET vectors downstream of the cloning site (asterisk in Fig. 1). In this arrangement, the presence of a functional splice donor (SD) site within the genomic fragment is required for fusion protein production.
A typical SET screening experiment is performed in two steps. First, SET-positive clones are identified based on secretion of the reporter, as described in Materials and Methods. In the second step, individual positive clones are analyzed by RT–PCR to identify the trapped sequences and to determine the pattern of splicing (internal versus 5′-terminal exon), as described below.
SET analysis of a known signal sequence-containing exon
Internal exons containing two splicing signals (SA and SD) can be trapped with high efficiency (18). However, a significant number of signal sequences are expected to be located within 5′-terminal exons (19). These exons lack the SA site and, as a consequence, could be spliced out from the vector-derived pre-mRNA. Therefore, we first tested the feasibility of 5′-terminal exon trapping with the pSET vector. A 1.27 kb genomic DNA fragment containing the 5′-terminal exon of the mouse complement component C3 gene was inserted into the pSETa vector (pSETa-C3, Fig. 2A). This exon codes for a 24 amino acid N-terminal cleavable signal peptide and three additional amino acids, preceded by a 5′-untranslated region of 55 bp (9). The pSETa-C3 construct was transfected into COS-7 cells and RNA was isolated 24 h later. RT–PCR using primers flanking the splicing signals of the vector (primers A and B, Fig. 2A) produced a single 126 bp product containing vector-derived sequences only (Fig. 2B, lane 1), indicating that the SV40 intron and the genomic fragment were effectively spliced out (type I splicing, Fig. 2A) with no insert-derived sequences trapped. We reasoned, however, that splicing events involving the C3 exon-derived SD site (type II splicing, Fig. 2A) may have escaped detection, because of the excess amount and preferential amplification of the shorter type I template. Indeed, amplification with an SV40 intron-specific primer (A*, Fig. 2A) and primer B produced a 317 bp type II product, containing the C3 exon and upstream sequences (Fig. 2B, lane 3). These data demonstrate that 5′-terminal exon trapping can be achieved with the pSET vector.
Next, we determined if the amount of type II mRNAs retaining the C3 exon was sufficient to generate detectable secreted reporter activity. CD26 enzymatic activity was readily detectable in the cell culture supernatants of COS-7 cells transfected with the in-frame pSETa-C3 construct (Fig. 2C). When we introduced the same C3 genomic fragment into an out-of-frame vector (pSETb-C3) no signal could be detected (Fig. 2C), indicating that the appearance of enzymatic activity in the supernatant required in-frame fusion between exonic and reporter sequences. It was possible that the activity we measured in the supernatant of cells transfected with pSETa-C3 was due to the non-specific release of cytoplasmic fusion protein following cell death. To exclude this possibility, we expressed an intracellular form of the reporter (icΔCD26) by inserting a translation initiation site (10) into the ΔCD26 cDNA. Cells expressing icΔCD26 did not exhibit detectable enzymatic activity (Fig. 2C), consistent with our observation that CD26 is a secretory pathway-specific reporter (manuscript in preparation). Taken together, our data suggest that 5′-terminal, signal sequence-containing exons can be specifically detected in genomic DNA fragments with the SET system.
Effect of fusion partner and genomic fragment length on SET performance
Depending on the coding capacity of the genomic DNA fragment inserted into the pSET vector, the ΔCD26 reporter is secreted with variable N-terminal fusion partners. It was therefore important to determine if different fusion partners have an effect on the enzymatic activity of the fusion proteins. We selected the IL-13 gene for these studies because of its small size (<3 kb) and because its signal sequence is within the 5′-terminal exon (20). Genomic DNA fragments containing one, two or three exons of the IL-13 gene were inserted into the pSETb vector and transfected into COS-7 cells (Fig. 3). Since the three IL-13 introns have the same phasing, all inserts were expected to generate in-frame fusions in the pSETb vector. Accordingly, all fragments were positive (Fig. 3). Increasing the length of the N-terminal fusion from 24 to 77 residues (constructs 1–3) did not have a significant effect on CD26 activity. These data demonstrate that ΔCD26 is a robust reporter that can tolerate various fusion partners of different lengths without an apparent change in enzymatic activity. However, extension of the constructs with 1.1 kb of 5′ genomic DNA (constructs 4 and 5) resulted in significantly (5- to 6-fold) reduced enzymatic activities when compared to their shorter versions (constructs 2 and 3). Since the shorter and 5′-extended constructs generate identical fusion proteins, the drop in activity must be due to lower amounts of the secreted protein. Although we cannot exclude the possibility of sequence-specific effects on expression, the distance between the 5′-end of the genomic insert and the SD site of the first exon may be an important factor in trapping 5′-terminal exons (see Discussion).
Specificity of the SET method
As an initial assessment of specificity, we determined the frequency of SET-positive fragments in complex pools of genomic DNA. Preliminary pooling experiments indicated that the CD26 enzymatic assay is sufficiently sensitive to detect a single SET-positive clone in a pool of 100, although the signal gradually decreases with increasing pool complexity (data not shown). Total genomic DNA was shotgun cloned into the pSETb vector and assayed in pools of 12 clones (~31 kb) as described in Materials and Methods. Screening of ~6.2 Mb genomic DNA resulted in three positive clones (T1–T3, Fig. 4). Identification of the trapped sequences by RT–PCR and sequencing indicated that all three clones contained in-frame translation initiation sites and coded for hydrophobic peptides scoring positive in a signal peptide prediction program (14). T1 showed no similarity to sequences in GenBank and the predicted signal sequence of T2 partially overlapped with a B2 repetitive element, suggesting that the latter clone was a false positive. The genomic sequence of the third clone, T3, was nearly identical (98%) in its entire 1.1 kb length to an IAPE retrotransposon (21). RT–PCR cloning of the trapped T3 subfragment revealed that it was spliced on both sides (i.e. as an internal exon; Fig. 4) and encoded the signal peptide of Env, a viral membrane protein. The presence of an exon at a similar position within the IAPE genome has been demonstrated (22), indicating that the identification of T3 represents a genuine SET event. Taken together, the low frequency of SET-positive genomic clones suggests that the occurrence of false positives will not constitute a major problem in screening experiments.
Figure 4.

Summary of SET screening experiments. All the clones obtained from the random genomic DNA (above dashed line) and YAC (below dashed line) screening experiments are shown except for yeast-derived clones. SET-positive clones were isolated as described in Materials and Methods. Trapped sequences were identified by RT–PCR and used for homology (GenBank) and repeat (RepeatMasker2) searches, as well as for signal sequence prediction (14). All trapped sequences contained in-frame translation initiation sites and a hydrophobic stretch of amino acids, characterized as known signal peptide (SP), transmembrane domain (TM) or predicted (+, strong; +/–, weak) signal peptide. Splicing patterns, determined by comparing trapped and genomic insert sequences, are shown by indicating sequences removed during splicing (dotted lines). Solid and open boxes represent vector- and insert-derived exons, respectively. Confirmed or putative signal sequences are depicted by gray shading. A cryptic exon within the OCTN2 gene is labeled by crosshatching.
Efficiency of the SET method
To assess the efficiency of the SET method, we screened a defined genomic region with a known number of target genes and determined how many of these can be identified. A 425 kb human YAC (A94G6) from the 5q31 cytokine gene cluster region was chosen for this experiment, because this YAC contains three potential SET target genes: IL-4, IL-5 and IL-13 (12). Screening YAC A94G6 at ~2-fold coverage resulted in 10 positive clones, three of which contained yeast sequences and were excluded from further analysis (Fig. 4 and data not shown). Sequencing of the genomic inserts of clones Y1 and Y2 revealed that they contained the signal peptide-encoding first exons of the IL-5 and IL-13 genes, respectively. In addition to exon 1, Y2 also contained exons 2 and 3 of the IL-13 gene. As demonstrated by RT–PCR analysis, all of the trapped exons have been spliced to the ΔCD26 reporter as expected (Fig. 4). Clones Y3 and Y4 contained exon 2 of an organic cation/carnitine transporter (OCTN2) within overlapping genomic fragments (23). This exon codes for the entire second predicted transmembrane domain (TM2) of OCTN2, but is devoid of a translation initiation site. RT–PCR analysis revealed that an apparently cryptic exon was co-trapped with exon 2 of OCTN2, providing a start signal for translation (Fig. 4). The resulting hydrophobic fusion peptide scored positive in signal peptide prediction (14). Two additional SET-positive clones (Y5 and Y6) did not show significant similarities to sequences in GenBank and may represent novel genes. Finally, the sequence trapped from clone Y7 was part of a LINE-2 repetitive element, indicating that this clone was a false positive. In conclusion, we identified two of the three SET target genes and the gene of an integral membrane protein from YAC A94G6.
DISCUSSION
While structural information about the genome is rapidly increasing, large-scale functional analysis remains a challenging task. To facilitate the identification of molecules mediating interactions between cells and their environment, we developed a novel genomic screening method, signal-exon trapping (SET). Our approach targets genes coding for proteins with N-terminal cleavable signal peptides, including virtually all secreted and a large fraction of integral membrane proteins (24). The novelty of the SET method is that exon trapping is coupled with translation of the trapped exons, allowing functional screening for exon-encoded signal peptides (Fig. 1).
SET is based on the screening of genomic DNA. This feature offers an important advantage over cDNA-based methods: genes with restricted expression patterns can be readily isolated without the preliminary knowledge of the tissue or conditions of expression. However, after the isolation of exon candidates, genuine transcription must be verified and the corresponding cDNA cloned. Therefore, the site of expression must eventually be identified. In silico screening of the dbEST database, which contains sequences representing most human genes, is an effective first approach to find cDNAs corresponding to an exon candidate. In the absence of a dbEST hit, RT–PCR screening of a panel of tissues can lead to a cDNA source.
A survey of the exon–intron structures of vertebrate genes showed that in about two thirds of the genes the translation initiation site is located within the 5′-terminal exon (19). Therefore, to target N-terminal signal sequences, the trapping of both internal and 5′-terminal exons must be achieved. While efficient internal exon trapping systems using vectors with two splicing signals (SD and SA) have been described (18,25), trapping of 5′-terminal exons has not yet been reported. Therefore, we tested whether 5′-terminal exons can also be trapped with an internal exon trap vector. Using a PCR primer located downstream of the SD site (A*, Fig. 2A) we demonstrated that a 5′-terminal exon was trapped in some of the vector-derived transcripts (Fig 2B). The relative inefficiency of trapping is not surprising, because splicing factors bound to the vector- and insert-derived SD sites are expected to compete for interaction with cap-binding proteins during the process of 5′-terminal exon definition (26). Due to its proximity to the cap site, the vector-derived SD site is more likely to define the 3′-boundary of the first exon, leading to splicing out of the entire intron from the majority of transcripts. The fraction of transcripts retaining the exon, however, proved to be sufficient to produce readily detectable amounts of the reporter enzyme (Figs 2C and 3). These data demonstrate that signal sequence-containing 5′-terminal exons can be detected by the SET system.
The analysis of test constructs revealed an important feature of the SET assay. Increased length of the genomic fragment upstream of a 5′-terminal exon significantly reduced the amount of secreted reporter (Fig. 3). Although the role of specific upstream sequences cannot be excluded, this effect is likely to be due to inefficient splicing. For a 5′-terminal exon to be trapped, the entire genomic fragment upstream of the SD site has to be defined by the splicing machinery as part of an extended 5′-terminal exon (type II splicing, Fig. 2A). However, it is likely that, similarly to internal exons (27), there is a size constraint on the recognition of 5′-terminal exons and, as a consequence, long upstream sequences result in preferential type I splicing and elimination of the insert from the mRNA. Insert size, therefore, is a critical parameter influencing the sensitivity of SET detection and should be taken into account in genomic library preparation with the pSET vectors. Our results suggest that a genomic insert size of ~1 kb facilitates reliable identification of signal sequence-containing 5′-terminal exons.
For a genomic fragment to be positive in the SET system, three sequence features must be present in a 5′→3′ orientation: (i) a translation initiation site; (ii) an open reading frame coding for a cleavable signal peptide; and (iii) a SD site. To test whether selection for these signals provides sufficient specificity for the analysis of complex DNA, we analyzed 6.2 Mb of random genomic DNA. Only three clones were identified in this experiment (Fig. 4), suggesting that the overall frequency of false positives does not constitute a major problem in SET screening. Alternatively, low efficiency of the method may be responsible for the few positives obtained. To discriminate between these possibilities, we screened a 425 kb YAC containing three known target genes of the 5q31 cytokine gene cluster. Two of these, IL-5 and IL-13, have been successfully identified (Fig. 4). The third target, IL-4, may have been missed due to the use of Sau3AI restriction enzyme for YAC subcloning. This enzyme has a recognition site between the signal sequence and the SD site of the 5′-terminal exon of the IL-4 gene; cleavage by Sau3AI could have reduced the frequency of genomic fragments suitable for trapping this exon. Two overlapping clones (Y3 and Y4, Fig. 4) represent an interesting example of a semi-specific SET event. Whereas the trapped exon and signal sequence are genuine features of the OCTN2 gene, the presence of a cryptic upstream exon providing a translation initiation site and a putative signal peptidase cleavage site downstream of the signal sequence (14) apparently both contributed to the detection of these clones. Finally, two clones have unknown genomic inserts (Y5 and Y6) and one clone represents a false positive trapping event (Y7).
The rates of false positives and false negatives are important characteristics of all screening methods. In SET, we observed one false positive event out of two characterized clones (50%) in the random genomic experiment and two of four (50%) in the YAC screening experiment. Some of the false positive clones (two of nine or 22%) represent genome-wide repetitive elements, which can be easily recognized and excluded from further analysis. The rate of false negatives in SET can be estimated from the YAC screening experiment, where one of the three (33%) targets was missed. As discussed earlier, the single false negative event could probably be eliminated by improved experimental design, e.g. by employing mechanical shearing instead of enzymatic restriction of DNA during SET library construction.
It should be pointed out that the frequency of SET-positive clones per kb of genomic DNA was ~30-fold higher in the YAC screening experiment than in the random genomic analysis. This difference can most likely be attributed to the combined effect of multiple factors, including: (i) the clustering of cytokine genes in the region covered by the YAC clone; (ii) the average insert size in the YAC-specific library (~1.1 kb) being more optimal for the trapping of 5′-terminal exons than that in the random genomic library (~2.6 kb); and (iii) the use of all three pSET vectors for YAC screening, but only pSETb for the random genomic analysis.
In summary, we have described a novel functional genomic approach, SET, for the identification of genes encoding secreted and membrane proteins. SET offers distinct advantages over existing signal sequence traps. First, since it is a genomic DNA-based rather than cDNA-based strategy, genes with restricted patterns and levels of expression are accessible. Second, by targeting selected genomic regions (e.g. a cytokine gene cluster), SET can facilitate function-oriented gene discovery. Our initial characterization of the new method demonstrated that it is specific and efficient in the analysis of complex genomic DNA. Therefore, SET has the potential to be a useful tool for gene discovery in secretory gene clusters or other genomic regions of interest.
Acknowledgments
ACKNOWLEDGEMENTS
The authors acknowledge the technical assistance provided by Vicky Trester, Susan Cupples, William Sampson, Laarni Antonio and David Grosshans. YAC clone A94G6 was provided by Dr Edward M. Rubin. We are grateful to Drs Karen Reue and Henry A. Choy for critical reading of the manuscript.
REFERENCES
- 1.Tashiro K., Tada,H., Heilker,R., Shirozu,M., Nakano,T. and Honjo,T. (1993) Science, 261, 600–603. [DOI] [PubMed] [Google Scholar]
- 2.von Heijne G. (1990) J. Membr. Biol., 115, 195–201. [DOI] [PubMed] [Google Scholar]
- 3.Klein R.D., Gu,Q., Goddard,A. and Rosenthal,A. (1996) Proc. Natl Acad. Sci. USA, 93, 7108–7113. [DOI] [PMC free article] [PubMed] [Google Scholar]
- 4.Chen H. and Leder,P. (1999) Nucleic Acids Res., 27, 1219–1222. [DOI] [PMC free article] [PubMed] [Google Scholar]
- 5.Soares M.B., Bonaldo,M.F., Jelene,P., Su,L., Lawton,L. and Efstratiadis,A. (1994) Proc. Natl Acad. Sci. USA, 91, 9228–9232. [DOI] [PMC free article] [PubMed] [Google Scholar]
- 6.Buckler A.J., Chang,D.D., Graw,S.L., Brook,J.D., Haber,D.A., Sharp,P.A. and Housman,D.E. (1991) Proc. Natl Acad. Sci. USA, 88, 4005–4009. [DOI] [PMC free article] [PubMed] [Google Scholar]
- 7.Wen D., Peles,E., Cupples,R., Suggs,S.V., Bacus,S.S., Luo,Y., Trail,G., Hu,S., Silbiger,S.M., Levy,R.B. et al. (1992) Cell, 69, 559–572. [DOI] [PubMed] [Google Scholar]
- 8.Hong W. and Doyle,D. (1987) Proc. Natl Acad. Sci. USA, 84, 7962–7966. [DOI] [PMC free article] [PubMed] [Google Scholar]
- 9.Wiebauer K., Domdey,H., Diggelmann,H. and Fey,G. (1982) Proc. Natl Acad. Sci. USA, 79, 7077–7081. [DOI] [PMC free article] [PubMed] [Google Scholar]
- 10.Kozak M. (1984) Nucleic Acids Res., 12, 857–871. [DOI] [PMC free article] [PubMed] [Google Scholar]
- 11.Péterfy M., Gyuris,T., Austin,B., Ostresh,M. and Takács,L. (1995) Methods Mol. Cell. Biol., 5, 353–362. [Google Scholar]
- 12.Frazer K.A., Ueda,Y., Zhu,Y., Gifford,V.R., Garofalo,M.R., Mohandas,N., Martin,C.H., Palazzolo,M.J., Cheng,J.-F. and Rubin,E.M. (1997) Genome Res., 7, 495–512. [DOI] [PubMed] [Google Scholar]
- 13.Zabarovsky E.R. and Allikmets,R.L. (1986) Gene, 42, 119–123. [DOI] [PubMed] [Google Scholar]
- 14.Nielsen H., Engelbrecht,J., Brunak,S. and von Heijne,G. (1997) Protein Eng., 10, 1–6. [DOI] [PubMed] [Google Scholar]
- 15.Takebe Y., Seiki,M., Fujisawa,J., Hoy,P., Yokota,K., Arai,K., Yoshida,M. and Arai,N. (1988) Mol. Cell. Biol., 8, 466–472. [DOI] [PMC free article] [PubMed] [Google Scholar]
- 16.Ogata S., Misumi,Y. and Ikehara,Y. (1989) J. Biol. Chem., 264, 3596–3601. [PubMed] [Google Scholar]
- 17.Kaiser C.A., Preuss,D., Grisafi,P. and Botstein,D. (1987) Science, 235, 312–317. [DOI] [PubMed] [Google Scholar]
- 18.Church D.M., Stotler,C.J., Rutter,J.L., Murrell,J.R., Trofatter,J.A. and Buckler,A.J. (1994) Nature Genet., 6, 98–105. [DOI] [PubMed] [Google Scholar]
- 19.Hawkins J.D. (1988) Nucleic Acids Res., 16, 9893–9908. [DOI] [PMC free article] [PubMed] [Google Scholar]
- 20.Smirnov D.V., Smirnova,M.G., Korobko,V.G. and Frolova,E.I. (1995) Gene, 155, 277–281. [DOI] [PubMed] [Google Scholar]
- 21.Reuss F.U. and Schaller,H.C. (1991) J. Virol., 65, 5702–5709. [DOI] [PMC free article] [PubMed] [Google Scholar]
- 22.Puech A., Dupressoir,A., Loireau,M.P., Mattei,M.G. and Heidmann,T. (1997) J. Biol. Chem., 272, 5995–6003. [DOI] [PubMed] [Google Scholar]
- 23.Wu X., Prasad,P.D., Leibach,F.H. and Ganapathy,V. (1998) Biochem. Biophys. Res. Commun., 246, 589–595. [DOI] [PubMed] [Google Scholar]
- 24.High S. and Dobberstein,B. (1992) In Neupert,W. and Lill,R. (eds), Membrane Biogenesis and Protein Targeting. Elsevier, Amsterdam, The Netherlands, pp. 105–118.
- 25.Nehls M., Pfeifer,D., Micklem,G., Schmoor,C. and Boehm,T. (1994) Curr. Biol., 4, 983–989. [DOI] [PubMed] [Google Scholar]
- 26.Lewis J.D. and Izaurralde,E. (1997) Eur. J. Biochem., 247, 461–469. [DOI] [PubMed] [Google Scholar]
- 27.Berget S. (1995) J. Biol. Chem., 270, 2411–2414. [DOI] [PubMed] [Google Scholar]