

Abstract
The ability to suppress actions that lead to a negative outcome and explore alternative actions is necessary for optimal decision making. Although the basal ganglia (BG) have been implicated in these processes1–5, the circuit mechanisms underlying action selection and exploration remain unclear. Here, using a simple lateralized licking task, we show that indirect striatal projection neurons (iSPN) in the BG contribute to these processes through modulation of the superior colliculus (SC). Optogenetic activation of iSPNs suppresses contraversive licking and promotes ipsiversive licking. Activity in lateral SC (lSC), a region downstream of the BG, is necessary for task performance and predicts lick direction. Furthermore, iSPN activation suppresses ipsilateral lSC, but surprisingly excites contralateral lSC, explaining the emergence of ipsiversive licking. Optogenetic inactivation reveals inter-collicular competition whereby each SC hemisphere inhibits the other, thus allowing the indirect pathway to disinhibit the contralateral lSC and trigger licking. Lastly, inactivating iSPNs impairs suppression of devalued but previously rewarded licking and reduces exploratory licking. Our results reveal that iSPNs engage the competitive interaction between lSC hemispheres to trigger a motor action and suggest a general circuit mechanism for exploration during action selection.
Main
Activities of direct and indirect pathway striatal projection neurons (dSPN and iSPN) are thought to reinforce and punish actions associated with good and bad outcomes, respectively6–9. iSPN activation can also acutely suppresses movement2,6,10–13. To examine if iSPNs also mediate exploration, we measured the behavioral consequences of transiently activating iSPNs in thirsty mice preforming a licking task for water rewards. Mice were trained on a lateralized licking task in which a brief (50 ms) auditory cue (tone A or B) indicated the spout (left vs. right) at which a lick would trigger a water reward (Fig.1a–b, ED Fig.1a). We categorized the outcome of each trial, based on the timing and direction of the first lick (the “choice” lick), as either correct (rewarded with water), incorrect, or miss (no licks within 500 ms after tone onset) (ED Fig.1b–c).
Fig.1 |. iSPN activation in ventrolateral striatum induces ipsiversive movements.

a, Stimulation protocol: CoChR (green) was expressed in Adora2a-Cre mouse and implanted with two tapered fibers. Each circle (blue) indicates a stimulation site.
b. Trial structure of the lateralized licking task.
c. Stimulation protocol: the laser (light blue) is turned on in a random subset (~30%) of trials for 100 ms starting 25 ms after tone onset.
d. Each row shows behavior in a single trial with each dot representing a lick to the left (blue) or right (red) port timed relative to tone onset. Trials are sorted by trial type (top: left-cued trials, bottom: right-cued trials) and further divided into no stimulation trials (black) and optogenetic stimulation trials (light blue). The far-right column shows the trial outcomes labeled as correct (gray), incorrect (green), or miss (orange).
e. Summary of functional perturbations (percentage of correct choices, Δcorrect) induced by optogenetic stimulation on left- or right-cued trials. Each circle indicates a striatal stimulation site with the color and size denoting the effect size and p-value (bootstrap), respectively (n=5 mice, 9 sessions). Stimulation in the VLS most perturbed performance (Δcorrect=−82%, P<1e-5).
f. Trial outcomes with and without VLS stimulation (n=9 sessions) showing that stimulation (light blue bars) significantly decreased correct (grey), and increased incorrect (green) and miss (orange) rates (P**<0.001, P<0.01, two-tailed t-test). correct (grey).
We activated iSPNs in 8 striatal regions on separate trials (4 sites per fiber) on the right side of the brain. Brief unilateral iSPN stimulation immediately after tone onset decreased the fraction of correct outcomes (Fig.1d–e). The effect was specific to ventrolateral striatum (VLS) during left-cued (contralateral) trials, which induced errors consisting largely of incorrect choice licks to the right (ipsilateral) side (Fig.1e–f, ED Fig.1d). The outcomes of left-cued trials following the stimulation trial were unaffected, indicating that the stimulation protocol did not cause a persistent change in behavior or action value2,7 (ED Fig.1e). When mice selected the correct spout despite the stimulation, licks were delayed relative to in control trials, suggesting that iSPNs might also control lick timing11 (ED Fig.1f).
Ipsiversive licking after iSPN activation could result from inhibiting contraversive licking, or promoting ipsiversive licking. To distinguish these, we devalued the right spout by omitting reward even after correct choices (ED Fig.2a–d). The mice with bilateral tapered fibers targeting each VLS were trained to perform the main task, and optogenetically stimulated before and after extinction of the right spout (ED Fig.2a, c). Pre-extinction stimulation of left VLS produced incorrect licking, consistent with the effects reported above (ED Fig.2a). After extinction, mice no longer licked to the devalued spout in no-stimulation right-cued trials, causing an increase in the fraction of miss trials (ED Fig.2a). However, iSPN stimulation in the left VLS during right-cued trials caused mice to lick to the left (ipsilateral) spout (ED Fig.2a- b). This suggests that ipsiversive licking triggered by iSPN stimulation is not purely the consequence of suppressing licking to the contralateral side and indicates that iSPNs can trigger execution of a learned motor action. In contrast, stimulating iSPNs in the right VLS lost its ability to trigger ipsiversive licking after extinction, suggesting that iSPN simulation causes mice to switch to an alternative ipsiversive motor program only if it is a valuable option (ED Fig.2c–d). Bilateral iSPN stimulation increased misses but not incorrect choices, indicating that action switching is a unique consequence of unilateral iSPN stimulation (ED Fig.2c). Overall, these and further results (ED Fig.2f–h) indicate that unilateral iSPN activation can cause ipsiversive licking, if it is a reinforced motor program, and even in the absence of contraversive licking suppression. Interestingly, inactivation of dSPNs did not mimic iSPN activation as it induced misses on both contraversive and ipsiversive cued trials (ED Fig.3).
Bilateral push-pull modulation of lSC
The superior colliculus (SC) is downstream of BG, implicated in decision-making and choice competition14–20, and necessary for licking behavior21. We hypothesized that the behavioral phenotype induced by iSPN stimulation might arise from modulation of lSC activity. Consistent with this hypothesis, SNr neurons downstream of VLS (VLSSNr) bilaterally innervate contralateral and ipsilateral lSC22, regions whose activity is necessary for contraversive licking in our task (ED Fig.4)
To uncover the impact of iSPN activation on lSC, we use multi-electrode silicon probes to record from lSC in mice performing the task and stimulated right VLS iSPNs in a random subset of trials. In trials without stimulation, activity of individual lSC units displayed trial type selectivity for lick direction (Fig.2b). Mean selectivity (the difference in activities in trials cued to preferred vs. non-preferred directions) emerged gradually after tone onset and was maintained before the first lick, indicating lSC has information that could drive the upcoming lick direction (Fig.2c). As a population, lSC neurons fired more during contraversive than ipsiversive trials, and twice as many units were contraversive than ipsiversive lick-preferring (ED Fig.4e–j). Thus, lSC activity is higher before and during contraversive licking, consistent with lSC involvement in generating contraversive licking.
Figure 2 |. Bilateral and opposite modulation of lSC hemispheres by iSPN activation.

a. Schematic of extracellular recording in lSC on either side of the brain in Adora-Cre mice expressing CoChR in VLS and performing the task.
b. Peri-stimulus time histogram of activities of two example units. Correct left (blue) and right (red) cued trials are shown, aligned to either tone onset or the 1st lick (dashed lines).
c. Firing rate (orange) and firing rate selectivity (light blue) aligned to tone onset and 1st lick (dashed lines). Solid line shows the average and shaded areas the SEM across units (n=673 units; 7 mice).
d. Schematic of stimulation of iSPN in the right VLS while recording in the right (top) or left (bottom) lSC.
e. Peri-stimulus time histograms of activities for two example units recorded in either right (top) or left (bottom) lSC in left- (blue) and right- (red) cued trials either without (no stim, left panels) or with (stim, right panels) optogenetic stimulation (shown in light blue).
f. Average firing rate of lSC units in the right (top) and left (bottom) lSC during left- (blue) and right- (red) cued trials (stimulation in blue/red; no stimulation in grey). Only units that had directional selectivity during no stimulation trials are shown (right SC: n=249, left SC: n=186). Stimulation decreased activity of neurons in the right SC (left trials: P<1e-19; right trials: P<1e-10, two-tailed t-test) and increased activity of neurons in the left SC (left trials: P<1e-8; right trials: P<1e-5, two-tailed t-test comparing average activity during the 100 ms of stimulation).
g. Fractions of units that were significantly modulated. Cells were excited (red), inhibited (blue) or showed no change (grey). There were more inhibited than excited units in right SC (left trial: P<1e-10; right trial: P<1e-10; two-tailed binomial test), and more excited than inhibited units in the left SC (left trial: P<1e-26; right trials: P<1e-15; two-tailed binomial test).
During stimulation trials, units in the right lSC were suppressed by right iSPN stimulation whereas in the opposite hemisphere (i.e. left lSC) units were excited by the stimulation (Fig.2d–g) (some units on both sides that were unaffected; ED Fig.5a). The effect of iSPN activation was stronger in left-cued trials for which behavior was affected. The stimulation also specifically modulated contraversive lick-preferring units but not ipsiversive lick-preferring units, consistent with the function of lSC in driving contraversive licking (ED Fig.5b, d), and suggesting a high-degree of synaptic specificity within nuclei innervated by BG outputs.
In a subset of sessions, stimulation caused enough of both incorrect and miss trials to compare the activity in these two kinds of errors. In those sessions, we found that left SC, but not right SC activity during stimulation predicted behavioral outcome, with higher firing rates during incorrect licking compared to during miss trials (ED Fig.5c). In a subset of mice (4/7), we also stimulated iSPNs during the ITI, which occasionally triggered licks to the ipsilateral side (ED Fig.2h). We observed a similar pattern of inhibition and excitation of lSC hemispheres when the stimulation was applied during the ITI, with activity in left SC differentiating behavioral outcome (ED Fig.5e–g). Overall, iSPN activation caused push-pull modulation of lSC hemispheres, with the magnitude of contralateral lSC excitation predicting the behavioral outcome after stimulation.
Competition between lSC hemispheres
We hypothesized that lSC in one hemisphere tonically suppresses lSC in the other, forming a competitive network, such that inhibiting one lSC via iSPN activation might disinhibit the opposite lSC. Consistent with this hypothesis, we first confirmed the existence of an interhemispheric projection between lSCs (ED Fig.6a). Furthermore, brief unilateral inhibition of right lSC with an inhibitory opsin (Jaws; 400 ms pulse starting 25 ms after tone onset delivered randomly in ~20% of trials) recapitulated the incorrect licking phenotype observed via iSPN activation (Fig.3a–b, ED Fig.6b). Surprisingly, similar inhibition the intermediate reticular formation (IRt), a region downstream of VLSSNr, failed to increase incorrect licking, but instead increased misses on both left- and right-cued trials (ED Fig.6c–f). These results suggest that lSC, but not IRt, mediates the effect of iSPN activation.
Figure 3 |. Unilateral inhibition of lSC mimics iSPN activation.

a. Schematic illustrating Jaws expression in the right lSC in wild type mice (WT).
b. lSC inhibition caused a significant decrease in correct and increase in incorrect rates (P*<0.05, two-tailed t-test) in left trials (n=6 mice).
c. Schematic illustrating the optical fiber in the right lSC and recording electrode in the left lSC.
d. Mean firing rate of all left lSC units in left- (left panel) and right- (right panel) cued trials with (blue/red) and without (grey) stimulation (n=152 units, 4 mice). The laser-on period is shown in purple. Stimulation (right lSC inactivation) increased firing rate for both left and right trials (left trials: P<1e-18; right trials: P<1e-8, two-tailed t-test). Only directionally selective units are shown.
e. Fractions of units that were significantly excited (red) or inhibited (blue) and that were unaffected (grey). There were more excited vs inhibited units (left trials: P<1e-99; right trials: P<1e-3; two-tailed binomial test).
To functionally confirm the existence of inter-lSC competitive interactions, we performed extracellular recordings in lSC while unilaterally inhibiting the right lSC (Fig.3c). Jaws activation reliably suppressed activity in the illuminated region (ED Fig.6g–i) and, consistent with inter-lSC competition, increased activity in the left (contralateral) lSC (Fig.3d, e). The effect was stronger during left trials, specific to contraversive-preferring units, and magnitude of the effect predicted behavioral outcomes, in a similar fashion as that observed after iSPN activation (Fig.3d, e, ED Fig.6j–k). Overall, lSC inhibition recapitulated the behavioral and neural phenotypes induced with iSPN activation.
iSPN activity is necessary for lose-switch behavior
As iSPNs are activated during negative outcomes3,23, we hypothesized that iSPN activity might be necessary for ‘lose-switch’ behavior, namely to suppress unrewarded actions while switching to an alternative action. To test this hypothesis, we inactivated iSPNs in mice expressing an inhibitory opsin GtACR1 in the indirect pathway (R26-CAG-LNL-GtACR1-ts-FRed-Kv2.124; Adora2a-Cre) (ED Fig.7a). We compared the effect of right VLS iSPN inactivation during normal task performance (baseline session) and after omitting rewards on the left spout (extinction session) (Fig.4a). iSPN activity was not required for correct licking to the contralateral spout during the baseline session (Fig.4b–c). During extinction day 1, mice learned to suppress the unrewarded action (left licks) by increasing miss trials and also explored the right spout by increasing incorrect trials, even though right licks during left-cued trials were never rewarded. Inactivating iSPN impaired the ability to suppress left licks, and reduced exploratory licking to the right side (Fig.4b–c). Exploration of the right port during left-cued trials reduced over days suggesting the existence of another mechanism underlying suppression of exploratory licks that were never rewarded (ED Fig.7c). Right iSPN inactivation during the baseline session also impaired normal performance on right trials (non-devalued side), suggesting that iSPNs suppress off-target actions (ED Fig.7b).
Figure 4 |. iSPN activity is necessary for suppression of unrewarded action and for exploration of an alternative action.
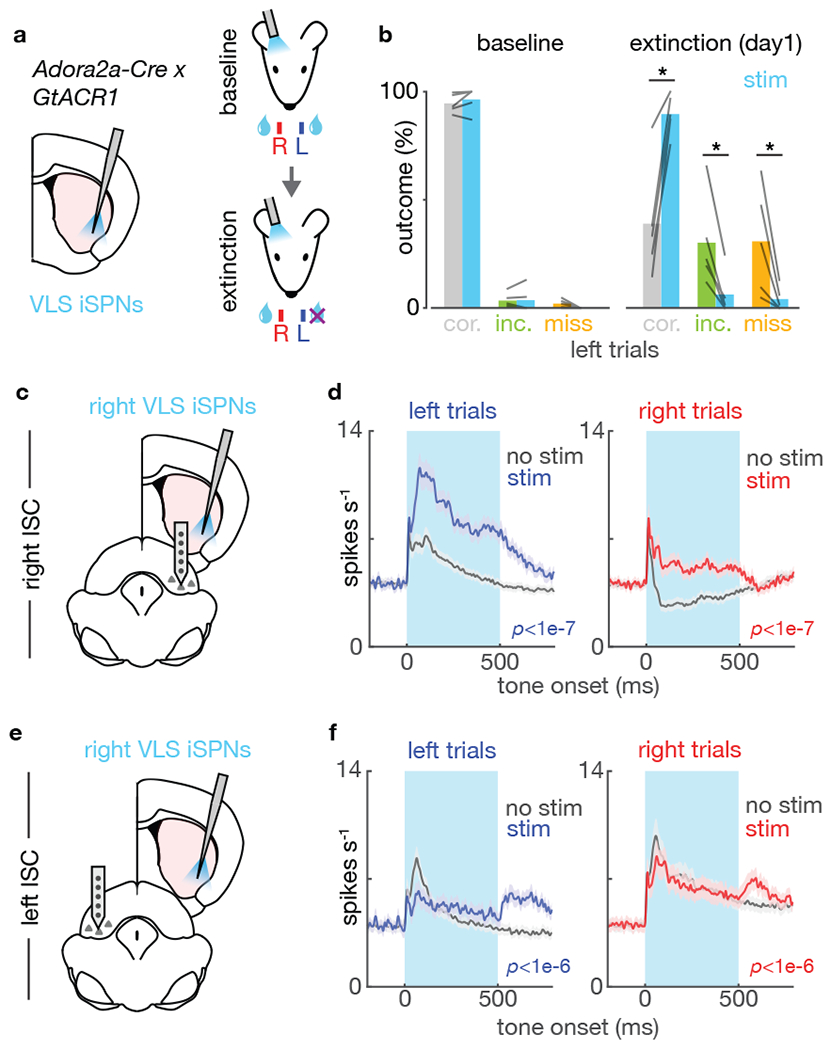
a. Schematic showing a tapered fiber targeting right VLS in an Adora2a-Cre; GtACR1 mouse expressing the inhibitory opsin in iSPN. iSPN in VLS were inactivated during baseline and after extinction on the left spout.
b. iSPN inactivation significantly increased correct rate and decreased incorrect and miss rates in left trials (P*<0.05, two-tailed t-test) (n=5 mice).
c. iSPN in the right VLS were inactivated while an extracellular recording was performed in the right lSC (same side).
d. Mean firing rate of all directionally selective right lSC units in left- (left panel) and right- (right panel) cued trials during stimulation (blue/red) and no stimulation trials (right lSC=179 units, 5 mice). The laser-on period is shown in light blue. P-values shown for stim vs no stim in the first 100ms window after laser onset (two-tailed t-test, see Methods).
e, f As in panels c, d for recordings on the left lSC (contralateral of the stimulation side) (left lSC=166 units, 5 mice). P-values shown for stim vs no stim (two-tailed t-test).
To understand the electrophysiological correlates of these effects, we recorded activity in left or right lSC after mice had undergone extinction (Fig.4d,f). iSPN inhibition caused robust excitation on the right (ipsilateral) and inhibition on the left (contralateral) lSC in the first 100ms window during inactivation, the opposite of what was observed with iSPN activation (Fig.4e,g,ED Fig.7e). Changes in activity in lSC in each hemisphere in optogenetic suppression trials predicted the behavioral outcome, suggesting a causal role of lSC in driving behavior (ED Fig.7f,g). Furthermore, optogenetic gain and loss of iSPN activity pushed lSC population activity selectively along the dimension that best discriminated upcoming lick choice (ED Fig.8–9). Thus, iSPN activity is necessary to implement ‘lose-switch’ behavior via bilateral modulation of lSC dynamics.
Discussion
Although many studies have optogenetically activated iSPNs and reported behavioral consequences, only a few have simultaneously recorded activity downstream to understand the impact of the manipulation6,8,12. We found that iSPN activation excites neurons in the contralateral lSC, indicating that the impact of iSPN activity on downstream areas is more complex than predicted by classic models of the BG.
Mechanistically, given the direct connection between lSC hemispheres, long-range inhibitory projections or excitatory projections innervating local inhibitory neurons could mediate the excitatory effect25–29. An intermediate region outside colliculus could also mediate this effect30,31. In addition, the VLSSNr projection directly to the contralateral lSC that we described could also contribute32,33 (ED Fig.10a–d).
Although we studied lateralized action selection, it is possible that a similar mechanism for exploration might exist for pairs of categorically different actions (e.g. licking vs locomotion). Previous studies have found switching between non-lateralized actions by activating iSPNs 3,34,35. One possibility is that distinct regions within SC represent distinct actions and receive input from distinct BG topographical zones, such that competition between categorically different actions might occur locally within one SC hemisphere.
Previous studies have shown that iSPNs are preferentially active after mice experience negative outcomes3,23,36. Thus, we propose that the function of iSPNs is to drive exploration after the occurrence of a negative outcome (ED Fig.10). In this model, the ‘negative reward prediction error’ signaled by dips in dopamine neuron activity and concentration37,38 strengthens inputs onto iSPNs39–41 such that the subsequently increased iSPN activity more effectively suppresses the corresponding action. If SC tracks all the actions available to an animal, iSPN suppression of one action in SC would disinhibit an alternative action. Our findings suggest that iSPN and iSPN-dependent regulation of lSC implement this computation, allowing animals to optimally navigate the decision landscape.
Methods
Mice.
All mouse handling and manipulations were performed in accordance with protocols approved by the Harvard Standing Committee on Animal Care, following guidelines described in the US National Institutes of Health Guide for the Care and Use of Laboratory Animals. For behavioral experiments, we used male and female (3~6 months old) Adora2a-Cre42 (B6.FVB(Cg)-Tg(Adora2a-cre)KG139Gsat/Mmucd, 036158-UCD) from C57BL/6J backgrounds acquired from MMRRC UC Davis. For muscimol infusion experiments (ED Fig.4d) and lSC/IRt jaws inhibition experiments (Fig.3, ED Fig.6c–f), wild type (C57BL/6NCrl, Charles River) mice (2 months old) were used. For iSPN inhibition experiment (Fig.4), used male and female (~2 months old) Adora2a-Cre mice crossed with R26-CAG-LNL-GtACR1-ts-FRed-Kv2.124 reporter mouse (The Jackson Laboratory, stock # 033089). For dSPN inhibition experiment (ED Fig.3), used male and female (~3 months old) Drd1a-Cre42 mice (B6.FVB(Cg)-Tg(Drd1-cre)EY262Gsat/Mmucd, 030989-UCD) crossed with R26-CAG-LNL-GtACR1-ts-FRed-Kv2.1 reporter mouse. All transgenic mice used for experiments were heterozygous for the relevant cre allele. Mice were housed on a 12 h/12 h dark/light reversed cycle.
Surgery and viral injection.
All mice underwent headpost/fiber surgery before training, and craniotomy surgery after training, prior to electrophysiology. This minimized the duration of brain surface being exposed. Mice were anaesthetized with isoflurane (2.5% in 80% oxygen). Using a stereotaxic frame (David Kopf Instruments, model 1900), mouse’s skull was exposed and leveled (David Kopf Instruments, Model 1905). The patch of skin covering the skull was cut and removed. ~300 μm diameter craniotomy was made with a drill (David Kopf Instruments, Model 1911) for each viral injection. Viruses were injected using a pulled glass pipette (Drummond Scientific Company pipettes) that was cut at beveled (~ 30 degrees, 35 ~ 50um inner diameter), and a syringe pump (Harvard Apparatus, #84850). Viruses were frontloaded at a rate of 500nl/min, then the pipette slowly lowered into the target region. The pipette was first lowered 300 μm deeper than the target dorsoventral coordinates. The pipette was left in the brain for 5 minutes before injection began, at a rate of 75 nl/min. After infusion, the pipette was left in place for a 5 minutes before it was slowly withdrawn. For fiber implants, a stereotaxic cannula holder (SCH_1.25, Doric) was used to hold the fiber and slowly lower the fiber into the brain. The fiber and headpost were secured on the skull using loctite gel (McMaster-Carr 74765A65) and zip kicker (Pacer Technology). A wall surrounding the site of recording was made using loctite to contain the saline bath for electrophysiology grounding. The site of recording was marked, and the wall was filled with silicone gel (Kwik-Sil, World Precision Instruments). Mice were given pre- and post-operative oral carprofen (MediGel CPF, 5 mg/kg/day) as an analgesic, and monitored for at least 5 days. For craniotomy surgery, the silicon was removed and a craniotomy was made by drilling the skull with a 340 um diameter drill bit. The craniotomy was extended 300um medial/lateral and anterior posterior. Care was taken not to damage or puncture dura, as it resulted in more infection of the craniotomy.
Viral injection for striatal tapered fibers photostimulation was done in a similar way as previously described22. Briefly, AAV2/9-hSyn-FLEX-CoChR-GFP (UNC vector core) was injected in the medial and lateral part of striatum (titer: 5x10¹² gc/ml, injection volume: 300 nl per site, total 1200 nl). Lateral striatum virus injection and fiber implant was done at an angle. A total of 4 injections were done spanning the entire striatum. All coordinates were as follows (AP/ML/DV relative to bregma and dura, in mm): DMSVMS: 0.5/1.25/−3.25 and 2.15; DLSVLS: 0.5/3.4/−3.35 and −2.15, at 14.5 degrees; lateral SC: −3.5/1.4/2.25). Two tapered fibers (0.66 NA, emitting length 2 mm, implant length 2.5 mm, Optogenix) were implanted in the right striatum for mapping the site of biggest effect for iSPN photostimulation experiment (Fig. 1). For all other striatal stimulation experiments, only one fiber was implanted, with the tip targeting VLS.
For Jaws inhibition experiment, we injected AAV9-hSyn-Jaws-KGC-GFP-ER2 (UNC vector core) in either lSC (−3.5/1.4/−2.25) or IRt (−6.4/1/4.25). Coordinates for lSC and IRt were based on projection pattern of VLS recipient SNr (for lSC and IRT, titer: 1.8~3x10¹² gc/ml, injection volume: 500 nl per site). For lSC inhibition, either a tapered fiber (0.39 NA, emitting length 1 mm, implant length 1.5 mm, Optogenix) or a cleaved fiber (MFC_200/230-0.48_3mm_MF1.25_FL) were implanted 250um above the injection site. For IRt inhibition, a tapered fiber (0.66 NA, emitting length 2 mm, implant length 2.5 mm, Optogenix) was implanted 250um above the injection site.
Anatomy of SNr and SC projection.
We analyzed anatomy data from previously published work22. Briefly, for mapping VLS recipient SNr projection (ED Fig.4a–c), ~75 nl of AAV2/1-hSyn-Cre (1x10e13gc/ml, University of Pennsylvania Vector Core or Addgene AV-1-PV2676, titer: 1x10¹³ gc/ml) was injected into VLS (+0.5/2.25/−3). This was followed by an injection of AVV2/1-FLEX-TdTom (University of Pennsylvania Vector Core, titer: 1x10¹³ gc/ml) into SNr (−3.2/1.5/−4.5). Mice were perfused four weeks post injection. For mapping lSC topography, ~150nl of AAV2/1.hSyn.Flpo (Plasmid from Addgene #60663, packaged in Boston Children Hospital Viral Core, titer: 7.9x10¹² gc/ml) was injected into tjM1 (+2.5/+2/−0.25), followed by 100nl of AAV2/1.Ef1a.fDIO.EYFP (Addgene #55641, packaged in Boston Children Hospital Viral Core, titer: 4x10¹² gc/ml) in lateral SC (−3.4/+1.5/−2.1). This method allowed us to label the lateral part of SC involved in licking.
Histology and immunohistochemistry.
Mice were euthanized and perfused transcardially with 1M PBS followed by 4% PFA (1M). After 24 hours post-fix in 4% PFA, brains were equilibrated in 30% sucrose solution until they sank at the bottom. Brains were then sliced (50um thick) using a cryostat. Slices were mounted on slide glasses with DAPI mounting medium (VECTASHIELD, H-1200) and imaged under a widefield microscope with a 10x objective (VS120 OLYMPUS). In some mice, for localizing the location of the tapered fibers, we immuno-stained for glial fibrillary acidic protein or GFAP (Agilent Technologies, Z033429-2, 1:500 dilution ratio).
Behavior.
We designed a lateralized licking task in which mice had to select between two lateralized actions and report their decision by licking the relevant spout instructed by the tone frequency. Mice were headfixed and placed inside a plastic tube43. Each trial began by an inter-trial-interval (ITI) during which mice were required to withhold licking. ITIs were chosen randomly between 2000 ~ 4000 ms. Any lick during the ITI reset the clock but did not change the ITI duration. If no licks were detected during the ITI, a 50 ms duration tone of either low (tone A, 3kHz) or high (tone B, 12kHz) frequency was played. Mice had to lick the left spout (tone A) or right spout (tone B), after which a small water drop (1 ~ 1.5ul) was immediately dispensed from the corresponding spout. Not licking within a response window (500 ms relative to tone onset) resulted in a miss trial, and a time out period (6000 ms). Each session lasted for 45~60 min or until the mouse had multiple consecutive miss trails (~10 miss trials).
Mice were trained in a series of stages in order to reach final expert performance. Mice were first water deprived (up to 85% baseline weight) and habituated to head fixation. This was followed by water delivery on the rig via one of the spout centered in front of their mouth. A dummy version of the final task was used in which only one tone type was played, with a shorter ITI (1000 ~ 2000 ms), longer response window (1000 ms) and shorter time out period (1000 ms). This version of the task was meant to teach the mouse to associate the tone with licking. A small water drop was manually dispensed initially when the tone was played to help the training. Mice were then trained to lick sideways by positioning one of the side spout at the center initially and gradually moving it to the final position. Mice learned to track the position of the spout and lick sideways within 1 ~ 3 days. The same procedure was repeated for both sides, at least two times for each side (each spout ~60 rewards delivery per repetition). Mice were then trained on the final task. Duration of ITI, response window and time out period was gradually adjusted to the final values. During the training phase, we repeated the same tone after an incorrect trial, in order to prevent the mice from learning a strategy of licking only one spout and still collecting rewards.
Mice were trained for at least two weeks (from habituation), after which they were trained until they reached 75% correct performance. For extinction (Fig.4, ED Fig.2a–g), mice underwent the same training procedure, after which the one of the spout was devalued by not dispensing any water reward even after a correct lick. During extinction, we removed timeout period given that mice learned to not lick to the devalued spout. We also trained mice to lick only one spout (ED Fig.2f, g). Mice underwent the same procedure but was only ever exposed to the left spout throughout training. The right spout was still present and available to the mouse.
Behavioral set-up.
Behavioral data was acquired and saved using Arduino (MEGA 2560) and CoolTerm. Licks were detected by recording the voltage drop between the spout and the tube, similar to previously described studies43,, . The inside of the tube was taped with copper foil and grounded. Solenoids (The Lee Company, part number LHQA0531220H) were connected to a 20ml syringes, acting as water reservoirs, and opened for a short duration to deliver water rewards. Water reward size was calibrated via adjusting solenoids opening time (~20 ms). Water delivery spouts were made using blunt syringes needles (18 gauges). They were glued in parallel, separated by 6.5mm, and connected to the solenoids via tubing (Cole-Parmer, # EW-06460-34). A speaker (Madiasound, parts number: tw025a20) connected to an amplifier (FOSTEX, parts number: AP05) was positioned underneath the tube, connected to the Arduino to deliver tones during the task.
In order to monitor the licking behavior, a CMOS camera (FL3-U3-13S2M-CS, PointGrey) was positioned on the side. Live camera was used to both place the spouts in front of the jaw and monitor behavioral phenotype after photostimulation.
Photostimulation.
We photoactivated iSPN in striatum by expressing CoChR in striatum and delivering blue light (473nm laser, Optoengine). For functional mapping, two tapered fibers (0.66 NA, emitting length 2 mm, implant length 2.5 mm, Optogenix) were implanted to stimulate a total 8 striatal sites using an optical setup used previously. Only one fiber was stimulated per session (4 sites per session). Stimulation was randomly interleaved, and was deployed 20 ~ 30% of the time, to minimize persistent behavioral phenotype due to repeated stimulation. We did not observe any gross persistent effect on baseline performance across session due to stimulation. Each photostimulation session consisted of stimulation trials on both left and right trials, across 4 striatal sites from one fiber. We ran two sessions per fiber per mouse. For other experiments (extinction, one spout training and extracellular recording), only one fiber was implanted per hemisphere, and only one site (VLS) was targeted for photostimulation. We calibrated the power level for each depth by adjusting the power at the end of the patchcord (before fiber entry) to be 100 uw. Stimulation consisted of a constant 100 ms pulse, delivered 25 ms after tone onset. In order to stimulate distinct depths along the tapered fiber, we used an optical system for delivering different modes of light onto the back of a high NA patchcord (0.66 NA) connecting the tapered fiber, similar to the work previously described22. A custom code in Matlab was used to control the optical set-up via a data acquisition interface (National Instrument) and communicate with the Arduino.
For lSC and IRt inhibition experiment, we delivered a single pulse of red light (400ms constant pulse, 8~16mW, 637nm) on ~20% of all trials interleaved randomly. For iSPN/dSPN inhibition experiment, we delivered a single pulse of blue light (500ms, aligned to the onset of the tone onset, constant pulse, 2mW, 473nm) on ~20% of all trials interleaved randomly.
For all photostimulation experiments, we checked with a camera position on the side, if the stimulation caused any erratic orofacial behavior, or whether the stimulation caused mice to protrude their tongue but not reach the spout.
Electrophysiology.
We performed in-vivo extracellular recoding in lateral superior colliculus while mice were performing the licking task. Mice underwent viral and fiber implant surgery, after which they were trained on the main task for two weeks. Recording mice only received a single fiber in the lateral part, targeting VLS. iSPN in VLS were stimulated to characterize the behavioral phenotype. All recorded mice show similar behavioral phenotype as reported in previous experiments where only stimulation was performed. One day before the first recording session, one small craniotomy above each lateral SC were made (~0.5 mm in diameter). Care was taken to not remove the dura when drilling through the skull. The craniotomies were covered with silicon gel (Kwik-Sil, World Precision Instruments). During subsequent recording sessions, the silicon gel was removed and the craniotomy was filled with clean saline solution. 64 channel silicon probes (A2x32-5mm-25-200-177 or A4x16-Poly2-5mm-23s-200-177, NeuroNexus Technologies) were lowered slowly in brain until it reached the target depth (lSC: −2.2 ~ −2.6 mm relative to dura). We explored different location within the craniotomy in order to record from diverse locations within lSC. We dispensed water rewards while lowering the probe and looked for signals locked to rhythmic licking. Cells within a narrow layer spanning about 400um around lSC consistently fired in relation to licking. Once reaching the target depth, we left the probes for an additional 5 minutes for the surrounding tissue stabilize before starting the recording session. For most mice, only a single depth along the tapered fiber (VLS) was stimulated while recording.
We alternated the recoding location of lateral SC (ipsi or contra relative to fiber location) every day and later analyzed lSC units separately based on recording location (Fig.2, 4). We performed recording until the craniotomies became too unhealthy to record from, performance degraded due to repeated insertion of the silicon probe, or the number of observable units in lSC dramatically decreased (range: over 2 weeks). During the last session, we marked the center of the craniotomy with probes coated with Dil and later confirmed the recording location in histological slices.
Signals were acquired through OmniPlex Neural Recording Data Acquisition System (Plexon Inc). Signals from each channel were filtered (analog filter 0.1-7500 Hz; digital filter 0.77Hz Highpass), digitized at 40kHz, and single units were manually sorted using Offline Sorter (v3.3.5, Plexon Inc). Units were first detected using a hard threshold (below −44.63uV). Neighboring channels were grouped into tetrodes to aid sorting. Principal Component feature space was visually inspected and used to manually draw boundaries of each putative single unit cluster. Artifacts due to spout contact were clearly visible in all channels and easily removed using non-linear energy/energy dimension.
Muscimol infusion.
We infused muscimol (Sigma-Aldrich) in lateral SC unilaterally while mice were performing the lateralized licking task (ED Fig.4d). A craniotomy (~0.6mm diameter) was made above each lateral SC one day prior to muscimol infusion. We used a glass pipette frontloaded with muscimol via a syringe pump (see Surgery and viral injection). While the mouse headfixed, the silicon gel above the craniotomy was removed and the injection pipette was slowly lowered into the target depth (2200um below dura). The pipette was left in the brain for 5 minutes before starting the behavioral session. When the mouse had performed 200 ~ 250 trials, we started infusing muscimol (450-500ng/ul)21 at a rate of 50nl/min and a total volume of 100-150nl. All mice displayed licking deficit within the first 5 minutes of the start of infusion. We compared the performance pre and post muscimol infusion. For post muscimol infusion trials, we analyzed the last 200 trials of the session in order to take into account the time for muscimol to diffuse in the tissue. After 1 hour, we aborted the session, the pipette was slowly raised, and the craniotomy was covered with fresh silicon gel. Some mice received a mixture of muscimol and Cholera Toxin Subunit B (Recombinant) Alexa Fluor (647 conjugate, Thermo Scientific) to localize site of infusion. All mice fully recovered from previous muscimol infusion session and no performance deficit was observed on the next session, during pre-infusion control trials. At one infusion site, we noticed that baseline performance was low from the beginning, possibly due to damage from the infusion pipette being lowered into the brain. Each mouse received two infusion sessions (one per site), and all sessions were combined for the analysis.
Behavioral data analyses.
We categorized each trial outcome as correct, incorrect or miss. Correct trials were trials in which mice liked the correct spout (tone A-left, tone B-right) within a response window (500ms). Incorrect trials were trials in which mice licked the wrong spout. Miss trials were trials in which mice did not initiate any licks within the response window. We quantified mouse’s performance by counting the fraction of correct, incorrect and miss trials for a given session (Fig. 1).
Functional map of striatal site effective at changing behavior was determined using hierarchical bootstrapping to account for variability across mice, sessions and trials (Fig.1e, ED Fig.1d). We tested against the null hypothesis that the stimulation did not change the fraction of correct/incorrect/miss trials. In each round of bootstrapping, we re-sampled data by separately replacing from mice, sessions within each mouse, and trials (both stim and no trials shuffled) within each session. We then computed the performance change on the re-sampled data set. Bootstrapping 105 times produced a distribution of performance changes that reflected the behavioral variability, and the one-tailed p-value was the fraction of times in which bootstrapped data produced equal or greater change in performance then that observed. To compare performance changes after VLS iSPN stimulation, we performed t-test (two-tailed) on the percentage outcome for stim and no stim trials across all sessions. For extinction experiment, for each mouse, we quantified the fraction of correct/incorrect/miss trials during stim/no stim trials for left and right trials, and before/after extinction. We ran at least two stimulation session for each condition (pre vs post extinction) and averaged the percentage outcome across sessions. In order to test if extinction changed the probability of licking incorrectly, we first computed the change in incorrect rate after stimulation (Δincorrect) to account for baseline incorrect rate and compared it before and after extinction.
Electrophysiological data analyses.
We collected extracellular recording data for iSPN activation experiments from 7 mice, 71 individual session, comprising of 617 units (left SC/right SC=294/379). For lSC inhibition experiments, data came from 4 mice, 29 individual sessions, comprising of 252 units. For iSPN inhibition experiments, data came from 5 mice, 47 individual sessions, comprising of 503 units (left SC/right SC=224/279).
All units were pooled together for analysis. We smoothed the firing rate traces with a gaussian window for display purposes (Individual units: 20ms window, mean across units: 10ms window). For each unit, we determined its coding preference (contra preferring vs ipsi preferring) by comparing the spike count in the first 100ms window after tone onset during left vs right correct trials (two-tailed t-test, p<0.05). Each unit was categorized into contra preferring, ipsi preferring, or no preference if it did not pass the p-value threshold. Contra and ipsi preferring units were termed ‘selective units’. To compute selectivity, for each unit we computed the mean firing rate during preferred minus anti preferred trial type. Selectivity was then averaged across units to give a measure of population selectivity (Fig.2c). In order to test for bias in the population selectivity, we compared spikes count during ipsi vs contra in 200ms window after tone onset (ED Fig.4f). Coding preference could reflect distinct cell type within SC (e.g. excitatory vs inhibitory). However, we did not observe any difference in spike waveform features, although contra preferring units tended to have higher mean firing rate (ED Fig.4j).
To quantify the effect of stimulation on lSC activity, we grouped all units recorded on the left SC or right SC and computed the change in firing rate after stimulation Δspikes s−1=no stim spikes s−1-stim spikes s−1). We quantified whether the effect of stimulation was significant by comparing the spike counts during the stimulation window (100ms) vs control window (25 ~ 125ms relative to tone onset for iSPN activation and lSC inhibition, 0ms~100ms for iSPN inhibition). The first 100ms window was chosen given that mice took on average at least 100ms to contact the spout with the tongue (ED Fig. 1c). Thus, activity during this window is unlikely to reflect pure efference copy, but rather activity causal to upcoming behavior. Each unit was categorized into significantly excited, inhibited, or no change (ED Fig.4f). The above analyses were done only for all selective units.
In order to test whether the lSC activity after stimulation could predict behavioral outcome, we analyzed a subset of sessions during we had more 5 trials for each outcome (miss and incorrect). We compared the spike counts during the 100ms stimulation window vs control window (25 ~ 125ms relative to tone onset) (ED Fig.5c, 6l). A similar analysis was performed for iSPN inactivation experiment (ED Fig.7f). For left trials, we asked if changes in lSC activity could predict left lick vs no lick. For right trials, we asked if changes in lSC activity could predict left lick vs right lick.
In a subset of mice Adora2a-Cre mice used for initial behavioral experiments (4/7), we stimulated iSPN during ITI period. This allowed us to test the effect of stimulation on lSC activity at resting state, without the interaction with the tone. We conducted similar analysis as above, to test whether the lSC activity after iSPN stimulation could predict behavioral outcome, by analyzing the spikes count during the stimulation window (ED Fig.5e–g).
Dimensionality reduction.
We applied targeted dimensionality reduction technique similar to previous studies in order to understand the effect of stimulation on lSC activity44,45. We assumed all n units from different sessions/mice could have been recorded simultaneously and were pooled together to make a trial-averaged matrix x (n × t dimensions) aligned to 1st lick, with each row representing a single unit, and each column representing a single time bin. We found an n × 1 vector, in the n dimensional activity space that maximally separated the response vectors in correct lick left trials (x(t)left) and correct lick right trials (x(t)right), termed the coding direction (CD). CD was computed by subtracting the activity of left – right trials during a 200ms window centered around the time of 1st lick (−100 ~ +100ms relative to spout contact), and divided by it’s length, giving a unit vector CD. Projecting activity along CD (CDTx) allowed us to separate trajectory for left vs right trials (ED Fig.8c, 9c). By construction, CDTx was positive during left trials. Although CD was computed using the time of 1st lick, we used activity x aligned to tone onset for computing projections, to make comparison between stimulation and no-stimulation trials easier. Separability for trial type was defined as the difference between left vs right trials projection along a specific dimension (e.g. CD). We also explored different time windows for the choice of CD (0~100ms relative to tone onset, −100~0ms relative to spout contact), and obtained similar separability for left vs right trials (ED Fig.9a, c).
In order to capture the remaining variance in the data, we built a matrix consisting of trial-averaged activity for n units during left and right trials, with t time bins. Left and right trials were concatenated, giving a n × 2t matrix. We then removed the component along CD by subtracting the projection along CD giving x⊥CD = x − (CD)(CDTx), which is the subspace orthogonal to CD. We then applied standard PCA to this x⊥CD, giving PCs that capture variance orthogonal to CD. We used time points −400 ~ +400ms relative to tone onset for PCA. Data was centered, but not normalized, thus preserving differences in firing rate across units. Only correct control trials were used to compute the CD and PCs. We also tried to use PCA without computing and subtracting CD. This gave similar results as the approach mentioned above, with PC2 separating left vs right correct trials.
In order to understand the effect of iSPNs stimulation on lSC activity, we projected stimulation trials activity matrix onto different dimensions (CD, PC1~PC5). Importantly, stimulation trials were not used to compute different dimensions. To quantify the magnitude of stimulation along specific dimensions, we computed the difference between stimulation and no stimulation trial projection along specific dimensions (ED Fig.9b). We took all correct/incorrect/miss trials for no stimulation trials, in order to make stim vs no stim comparison fair. For iSPN inactivation, we computed CD by taking the left trials stimulation correct trials and right trials no stimulation trials. This was because extinction caused mice to no longer lick during left no stimulation trials. For iSPN inactivation, we computed CD by taking the correct left stimulation trials and right trials control trials. This was because extinction caused mice to no longer lick during control trials (ED Fig.8d).
All error bars for projections along lower dimensional space were computed using bootstrapping across units. Every bootstrap consisted of resampling units with replacement and computing CD and PCs de novo (5000 times). P-values were the fraction of times a bootstrap resulted in the opposite sign of that experimentally obtained. PCA results after bootstrapping can be unstable (sign flipping) due to the indeterminacy of the sign of PCA loadings. We used an approach previously described46 to assign a sign to PCs that most resembles the direction of the data after each bootstrap. For each PCs, we changed the sign of the PCs so that the sum over the dot product of the PC and data points would be greater than zero: . For each PCs, we explored and chose different timepoints that did not result sign flipping.
Software and Statistical analyses.
Custom Matlab (2016b) code and Arduino code was used to collect data behavioral data and slice physiology data. OlyVIA 2.9/ImageJ1.46r was used to process and analyze histology data. FlyCapture2 was used to monitor behavior. OmniPlex1.16.1 was used to acquire Ephys data. Matlab (2016b) and Excel16.38 was used to analyze all data. Offline Sorter v3.3.5 was used to sort spikes for ephy data.
All statistical analyses were performed using custom code written in Matlab. We used two-tailed t-test for all statistical comparisons unless stated otherwise. For functional mapping of striatum (Fig.1e), we used bootstrap (see Behavioral data analyses and Dimensionality reduction). The significance level was not corrected for multiple comparisons. No statistical methods were used to predetermine sample sizes, but our sample sizes are similar to those reported in previous publications. Data distribution was assumed to be normal, but this was not formally tested.
Schematics.
Mouse diagram was modified with permission from the author of a previously published article along with the publisher’s license47. Mouse coroncal section diagrams were modified from Paxinos Brain Atlas48.
Extended Data
ED Fig.1 |. Histology, baseline behavior, and effects of iSPN stimulation on the next trial.

a. Example histology (left) showing CoChR expression (green) and the tapered fiber location as revealed by glial fibrillary acidic protein (GFAP) staining (magenta). Scale bar: 1 mm. The CoChR expression in striatum averaged across mice is also shown (right).
b. Baseline expert behavior after two weeks of training. Percentages of correct (grey), incorrect (green) and miss (orange) outcomes for left- and right-cued trials (n=7 mice).
c. left, Median lick latency measured from tone onset to spout contact for left- (blue) and right- (red) cued trials. right, Mode of inter-trial-interval for licks to the left (blue) and right (red) ports.
d. Functional map of optogenetic perturbations at 8 striatal sites showing changes in percentages of incorrect (left) and miss (right) outcomes (see Fig.1e). The color and size of each circle denote the effect size and p-value (bootstrap), respectively (n=5 mice, 9 sessions).
e. Effect of VLS iSPN stimulation on the next trial (n+1 trial) relative to control trials (excluding all n+1 trials). For n+1 trials, only those following left-cued trials were included as optogenetic stimulation only affected left-cued trials (i.e. contraversive to the stimulation site in the right striatum) (n=7 mice) (see Fig.1e; Methods) (n.s.: P>0.05, two-tailed t-test).
f. Median latency to first lick in no stimulation trials (separated into left vs. right; blue/red) and stimulation trials (sorted into incorrect vs. correct; green/grey). Correct licks during stimulation trials to the left were delayed compared to those during no stimulation trials (P*<0.05, two-tailed t-test) (left licks: n= 6 sessions, right licks: n=9 sessions, see Methods).
ED Fig.2 |. Context-dependent effect of iSPN stimulation.

a, c. Effect of devaluating one motor program by extinction. An example session from one mouse showing the effects of iSPN stimulation on the left (a) or right (c) hemisphere before (pre-extinction, top) and after (post-extinction, bottom) devaluation of the right port. Each dot represents licking either to the left (blue) or right (red). Trials (rows) are sorted by being no stimulation (black) and stimulation trials (light blue). Only trials with licking cued to the port contralateral to optogenetic stimulation (right in a, left in c) are shown.
b, d. Percentages of each outcome type for pre- (black, left) and post- (purple, right) extinction optogenetic stimulation trials (stim, light blue) and control trials (no stim, black). Outcomes are color-coded grey (correct), green (incorrect), and orange (miss) (n=5 mice). The selection of the incorrect port following optogenetic stimulation of iSPN on the right striatum significantly decreased after extinction (P<0.0125, one-tailed t-test), whereas it remained the same for iSPN stimulation on the left (P=0.65, one-tailed t-test).
e. Effect of bilateral iSPN stimulation. Summary plots for the outcomes for no stimulation (black) and stimulation (light blue) trials, during left- (center) and right- (right) cued trials (n = 5 mice). Optogenetic stimulation significantly decreased the correct outcome rate and increased the miss outcome rate but did not change the incorrect outcome rate (**P < 0.001, two-tailed t-test; n.s.: P > 0.05).
f. left, We trained a group of mice to only lick to the left spout, while still having access to both spouts. Right iSPN stimulation in these mice failed to induce licking of the right spout, supporting that stimulation-induced licking is not a hardwired motor program. right, Stimulation decreased correct outcome rate and increased the miss outcome rate, but failed to increase incorrect outcome rate (i.e. the rate of licking to the right spout which the mice were never trained to lick) (**P < 1 × 1e–8, two-tailed t-test; n.s.: P > 0.05).
g. As in panel f for left VLS iSPN stimulation (*P < 0.05, two-tailed t-test; n.s.: P > 0.05).
h. In mice trained on the main two-spout task, we also observed that iSPN stimulation during the inter-trial-interval (ITI), when mice rarely licked, induced ipsiversive licking although this effect emerged only after multiple stimulation sessions. Plots showing change in probability of licking after optogenetic stimulation during the ITI relative to control trials (n = 10 mice for 1st and 2nd session, n = 9 mice for 3rd session). Stimulation caused ipsilateral licking from 2nd session onward, and weakly suppressed contralateral licking relative to baseline (***P < 1x1e-4, **P < 0.005, *P < 0.05).
ED Fig.3 |. Unilateral inactivation of the direct pathway in VLS suppresses licking on both sides.

a. Schematic showing strategy to inhibit striatal direct pathway. Mice expressing an inhibitory opsin GtACR1 in the direct pathway (R26-CAG-LNL-GtACR1-ts-FRed-Kv2.1 x Drd1a-Cre, see methods) was implanted with a tapered fiber in the right VLS.
b. Example session during which a mouse underwent direct pathway inactivation similar to the experiment described in Fig.4b (see Methods). Trials are sorted by trial type similar to that described in Fig.1d.
c. Percentage trial outcome for contra trials (top) and ipsi trials (bottom). Unilateral direct pathway inactivation lead to a decrease in correct rate and an increase in miss trial rate (P***<0.0005, two-tailed t-test; n=5 mice, power = 2mW).
d. Change in miss trials percentage for different power levels (0.2, 0.5 and 2mW).
ED Fig.4 |. VLS recipient SNr projection, effect of muscimol infusion in lSC, and direction selectivity of activity in lSC.

a-c. AAV1-Cre mediated anterograde tracing of SNr neurons downstream of VLS shows that VLS recipient SNr (VLSSNr) sends bilateral projections to contralateral and ipsilateral lSC. Interestingly, this bilateral projection was largely specific to lSC. a. left, Schematic of the AAV1-Cre anterograde trans-synaptic mapping strategy to reveal the projections of VLS-recipient SNr (VLSSNr).
b. Example histology of superior colliculus: VLSSNr (green) projects to both ipsilateral lSC (i-lSC) and contralateral lSC (c-lSC). SNr is outlined with a white dotted line. Scale bars: 1mm (left panel), 100 μm (3 insets in right column).
c. left column, Schematics of coronal sections and coordinates relative to bregma. VM: ventromedial thalamus; Pf: parafasciular nucleus; SC: superior colliculus; IRt/PCRt: intermediate reticular formation/parvocellular reticular formation. right column, histological examples showing SNr axons (green) labelled via anterograde tracing (see Main text, Fig.3b) and DAPI (purple). The left and right columns show contralateral and ipsilateral sides, respectively, relative to the labeled SNr cell bodies (i.e. the injection side). Midline crossing SNr axons were only seen in lateral SC. Similar results were observed in total of n=3 mice. Scale bars: 200 μm.
d. Activity in lSC was necessary for the lateralized licking in the task, as muscimol, a GABAA receptor agonist, infused into lSC unilaterally reduced task performance only on trials in which the correct selection port was contralateral to the infusion site. left, Muscimol was infused unilaterally in lSC as the mouse performed the task. right, percentages of correct trials before (baseline, grey) and after (muscimol, purple) infusion. Muscimol infusion significantly impaired performance of contralateral cued trials (n=8 lSC sites, 4 mice, P**<1e-6, two-tailed t-test).
e. left, Example histological section showing recording probe location (green = Dil). right, location of all probe tip location (cross). Each cross depicts one mouse.
f. left, Each dot shows the average activity of one unit in the first 200 ms after tone onset (spikes/s) during contraversive trials plotted versus that in ipsiversive trials. The directional selectivity of each unit is color-coded (purple: contra; green: ipsi; grey: no preference). Overall population activity was higher during contraversive trials (P<1e-8, two-tailed t-test). right, Numbers of cells preferring contraversive or ipsiversive licking trials, or having no preference (contra-preferring: 296/673, ipsi-preferring: 139/673, no preference: 238/673).
g. Mean firing rate of contraversive preferring (purple), ipsiversive preferring (green) and no preference (grey) units shown aligned to tone onset (dashed line) during contralateral and ipsilateral cued trials (contra: n= 296, ipsi: n=139; mean ± s.e.m. across units).
h. Mean firing rate (z-scored relative to firing during the ITI, left) and selectivity (spikes/s, right) of all lSC units. Each row shows data for a single unit, sorted by coding preference (right column for each panel). For each coding preference, units are sorted by the timing of peak firing relative to baseline.
i. Selectivity (spikes/s; activity in preferred – anti-preferred trials) aligned to tone onset (left) or 1st lick (right) for contraversive- and ipsiversive-preferring neurons (mean ± s.e.m across units).
j. Mean firing rate, peak-valley timing and spike width of waveforms of units in each coding group. No significant differences were observed between groups.
ED Fig.5 |. Detailed analysis of lSC activity modulation after iSPN stimulation.

a. Example units that were not significantly modulated by stimulation. Peri-stimulus histogram showing no stimulation trials (left) and stimulation trials (right, light blue=laser on) during left- (blue) and right- (red) cued trials.
b. Changes in firing rate (similar as in Fig.2i) but with data separated for contraversive preferring, ipsiversive preferring and no-preference units during left-cued trials (left column) and right-cued trials (right column) in right lSC (top row) and left lSC (bottom row). Only contraversive preferring neurons were significant modulated by iSPN activation in both left and right trials in left and right lSC (p-values for two-tailed t-test in the 100ms window after stimulation onset are shown).
c. Changes in firing rate induced by stimulation (Δspikes s−1 = activity in stim trials – activity in no stim trials) for units in the right (top) and left (bottom) lSC for stimulation trials but including only data from the subset of sessions that had both incorrect and miss outcomes (incorrect: blue, miss: grey; Methods) and separating trials based on outcome. Changes in firing rates in right SC did not differ (n=129, P=0.40, two-tailed t-test) but changes were larger in left SC during incorrect licking vs miss trials (n=64, P=0.01, two-tailed t-test). Firing rate are show as mean ± s.e.m. across units.
d. Fractions of neurons that were excited, inhibited, or unchanged by optogenetic stimulation in left- and right-cued trials for contraversive-lick-preferring (left), ipsiversive-lick-preferring (middle), and untuned (no pref, right) groups (similar analysis as Fig.2g) recorded in the left or right SC.
e. iSPN activation during the ITI (e-f). Example units recorded in the left SC (left panel) and right SC (right panel). Peri-stimulus histogram shows trials during which the stimulation did (red/blue) or did not (grey) induce licking. Firing rates are given as mean ± s.e.m across trials.
f. Average changes in firing rate after stimulation (Δspikes s−1) in left SC (left panel) and right SC (right panel) grouped by behavioral outcome (red/blue=lick; grey=no lick). Firing rates shown as mean ± s.e.m across units (left SC: n=225; right SC: n=201).
g. Average firing rates during the 100 ms stimulation window for stimulation trials without (y-axis) vs. with (x-axis) licking. Each dot represents a single unit. P-values show significance of modulation (two-tailed t-test).
ED Fig.6 |. lSC anatomical projection, IRt inhibition, and analysis of lSC/IRt activity after lSC inactivation.

a. left, Schematic showing strategy to label lSC via anterograde transsynaptic cre (AAV1.Flpo, grey) in tjM1, with injection of anterograde tracer (AAV.fDIO.EYFP, green) in the lSC. right, Sagittal section showing the cell bodies around the injection site and the axonal projection on the contralateral lSC. Scale bar, 1 mm (left panel), 200 μm (2 insets in right column).
b. left, Coronal section showing expression of Jaws in lSC. Inset shows cell bodies around the injection site. Scale bar, 1 mm (main panel), 50 μm (inset in top right corner). right, optical fiber tip locations.
c. Coronal section showing expression of Jaws in IRt. Inset shows cell bodies around the injection site. Scale bar, 1 mm (main panel), 50 μm (inset in top right corner).
d. Schematic illustrating Jaws expression in right IRt in wild type mice.
e. Example session showing (as in Fig.1d) the effect of IRt inhibition on performance in left and right cued trials, as indicated. The purple rectangle shows the time of laser activation (n=4 mice).
f. Quantification of trial outcomes (n=4 mice). Percentages of correct, incorrect and miss outcomes in no stimulation (grey, green and orange) and stimulation trials (purple) in left (left panel) or right (right panel) cued trials. IRt inhibition caused a significant decrease in correct rate (P*<0.05, two-tailed t-test) and increase in incorrect and miss rates (P*<0.05, two-tailed t-test) in right trials.
g. Example unit in lSC that was suppressed via red laser stimulation of Jaws expressed in lSC. Laser on period is shown in purple.
h. Normalized firing rate of all units recorded during left (left panel) and right (right panel) trials with stimulation (blue/red) and without (grey) stimulation.
i. Quantification of Jaws inhibition for all units during left (blue) and right (red) trials (n=14 units; P*<0.05, P**<0.005, two-tailed t-test).
j. Fraction of cells that were significantly modulated by contralateral lSC inhibition (similar as in Fig.3j, but repeated for different coding groups).
k. Changes in firing rate after contralateral lSC inhibition (Δspikes s−1 = activity in stim trials – activity in no stim trials) for ipsiversive- (green) and contraversive (purple) preferring units during left (left panel) or right (right panel) trials. contraversive preferring but not ipsiversive preferring units were significantly modulated by contralateral lSC inhibition (p-values from two-tailed t-test shown for each group).
l. Same as in h but sorted by trial outcome (incorrect=blue, miss=grey). lSC activity after contralateral lSC inhibition differentiated incorrect vs miss trials, with higher excitation during incorrect trials (P<1e-7, two-tailed t-test).
ED Fig.7 |. GtACR1 histology and detailed analysis of effects of iSPN inactivation on task performance and lSC activity.

a. left, Coronal section showing expression of GtACR1 in striatum in an Adora2a-Cre mouse crossed with a conditional GtACR1 mouse (see Methods). middle, Inset showing the expression of GtACR1 in iSPN. right, Coronal section showing the tapered fiber location as revealed by glial fibrillary acidic protein (GFAP) staining (magenta). Scale bar, 1 mm (left), 50 μm (middle), 1 mm (right).
b. similar to Fig.4c but for ipsiversive trials relative to fiber location (right trials, see main text) during a baseline session (left) and during extinction day1 (right). iSPN inactivation caused a significant decrease in correct rate, and significant increase in correct rate during baseline sessions (P*<0.05, two-tailed t-test).
c. Quantification of percentage trial outcome for contraversive/ipsiversive trials during no stimulation and stimulation trials across session number.
d. Number of units in each coding group (contra/ipsi/no preference) in left and right SC in mice after left spout extinction.
e. Fractions of units that were significantly modulated (as in Fig.2g). There were more excited than inhibited units in right SC (left trial: P<1e-7; right trials: P<1e-99; two-tailed binomial test), whereas there were more inhibited than excited units in the left SC (left trial: P<1e-7; right trials: P<0.05; two-tailed binomial test).
f. As Fig.4g, but sorted by behavioral outcome (see Main text). Color indicates the behavioral outcome upon iSPN inactivation (blue: left lick; red: right lick; grey: no lick). Change in firing rate in both trial types and both left and right lSC differentiated behavioral outcome (p-values shown for two-tailed t-test during 100ms window after laser onset).
g. Schematic diagram summarizing the results shown in panel e. The size of arrow indicates the relative magnitude of modulation (to be compared only across behavioral outcomes and not across recorded location).
ED Fig.8 |. Low-dimensional projection of lSC activity reveals logic of iSPNs modulation of lSC.

As the activity of neurons in lSC during the task is complex and heterogenous, we used dimensionality reduction to examine if, as a whole, neuronal population dynamics in lSC could be related to behavior and help explain effects of iSPN activity manipulation. Using only activity from trials without optogenetic stimulation, we projected lSC activity onto an axis (termed coding direction, CD) that best discriminated upcoming lick choice (see Methods). The projection onto CD represents the linear combination of activity in lSC (as might be calculated by a hypothetical downstream neuron) that allows maximal choice discrimination. As expected, lSC activity along CD discriminated correct trial types (c, left panel). Furthermore, optogenetic iSPN activation pushed lSC activity along the CD away from contraversive (left) and towards ipsiversive (right) choice (c, middle and right panels), even though activity in the optogenetic trials was not used to calculate the CD. Optogenetic modulation along other dimensions orthogonal to CD (calculated by PCA on the residual non-CD activity) was minimal, indicating that iSPN activity specifically modulates lSC neural population along a trajectory that determines lick choice as opposed to behavioral features, such as lick timing (see ED Fig.9e, f). After extinction of the left spout, lSC activity no longer moved along the CD towards the left-choice despite delivery of the left cue, consistent with lack of left-port licking in these trials (d, left panel). However, after extinction of the left spout, iSPN inactivation pushed lSC activity along the CD towards the left choice (d, middle and right panel). Thus, following extinction, activity in VLS iSPN was necessary for suppression of left-choice activity in the lSC. Phrased differently, iSPN activity specifically modulates lSC activity along a choice axis away from an activity space that no longer leads to valuable outcomes.
a. Schematic showing lSC neural trajectory for left (blue) and right (red) trials. Trajectories maximally diverge along the axis termed coding direction (CD, see methods)
b. Schematic showing lSC units (circle) on each hemispheres projecting onto a hypothetical downstream neuron (grey circle), which controls lick direction. Projection onto CD can be thought of as activity of a hypothetical neuron whose weights achieve maximal lick choice separation (see methods).
c. Mean neural trajectories of lSC (both hemispheres combined, see Methods) projected onto CD during iSPNs activation experiment (see Fig.2, Main Text). Grey dotted line shows the timing of the tone onset (t=0). left, Control trials in which mice either licked left (blue) or right (red) without stimulation. middle, Left cued trials during no stim (blue) and stim trials (light blue). right, Right cued trials during no stim (red) and stim (light blue) trials.
d. Mean neural trajectories of lSC (both hemispheres combined, see Methods) projected onto CD during iSPNs inactivation experiment after extinction (see Fig.4, Main Text). Traces plotted as panel c.
ED Fig.9 |. Detailed analysis of low dimensional projection of lSC activity.

a. Activity projections onto PCs, and different coding directions. Left (blue) and right (red) trials are shown relative to tone onset. Coding direction was defined during −100~0ms window relative to tone onset (left, CD1), 0~100ms relative to tone (center, CD2) and 100~0ms relative to first lick (right, CD3) (see Methods). CD1 was used as a control.
b. PCA on the original data (without first calculating and removing CD2 information as in Figure 5). Left/right lick (i.e. choice) information is found in PC2 (2nd column).
c. Left-right choice selectivity measured from the projection of the neural activity along the indicated axes. Selectivity measures how separable the trajectories are along the selected axis. The given P-values are for comparison by one sample two tailed t-test (P***<0.0005, P*<0.05). The trajectories are well-separable along different choice axes. PCs did not reliably discriminate trial type compared to CD (except for PC5).
d. Explained variance along each dimension (see Methods). CD explained the most variance in the data (20.5 ± 2.3%). Explained variances for CD, CD+PC1+PC2, and CD+PC1~PC5 are shown. All error bars show bootstrapped standard error across units.
e. Projections of neural activity as a function of time relative to the tone onset shown along PC3 (left), PC4 (middle) and PC5 (right). Data are shown for left- (top, blue) and right- (bottom, red) cued trials. The dotted lines show activity in no stim trials and thick lines that in stim trials. Light blue rectangle shows stimulation on window.
f. Changes in activity during the stimulation window (100 ms) for each projection after stimulation (Δproject. modulation) along different dimensions during left- (blue) and right- (red) cued trials. Stimulation modulates activity the mostly along CD. P-values show significance of modulation (two-tailed t-test).
g. similar analysis as panel f for iSPN inactivation (Main Fig.4, ED Fig.8d, see methods). P-values show significance of modulation (two-tailed t-test).
ED Fig.10 |. Circuit mechanism of contra lSC excitation, and model of exploration via iSPNs-Colliculus.

a-d. Potential circuit mechanisms by which iSPN could excite contra lSC. Color indicates the direction of modulation after iSPN activation, and shapes indicates cell type (triangle: excitatory; circle: inhibitory). Note that all these mechanisms are not mutually exclusive and a combination of these might occur together. We provide evidence for model a and b, in which inhibition lSC in one hemisphere disinhibit lSC on the opposite hemisphere (Fig. 3).
a. Long-range inhibitory projection crossing the midline could mediate contra lSC excitation. In this scenario, iSPN will cause SNr to be excited, suppressing ipsi lSC, which in turn will disinhibit contra lSC.
b. Long-range excitatory projection innervating local inhibitory interneurons could mediate this effect.
c. A region outside SC (grey patch) could mediate the disinhibitory effect (e.g. nucleus isthmus; see main text).
d. Separate population of SNr neurons could innervate ipsi and contra lSC. In this scenario, iSPN activation would lead to bidirectional modulation of SNr neurons, with ipsi lSC projecting SNr neurons being excited, and contra lSC projecting SNr neurons being inhibited.
e. Schematic diagram of the exploration model proposed. iSPN integrate information about the outcome of specific action performed in a specific context. The function of iSPN to learn which actions lead to a negative outcome and suppress them in the future. iSPN can then suppress the target action that lead to the negative outcome. Via disinhibition within SC, this leads to a rapid execution of a competing motor program. Although the circuit from specific iSPN to target action is hardwired, competitive interaction within SC is more dynamic and tunable so the same activation of iSPN can lead to different actions depending on the availability of the competing motor program.
Acknowledgements
We thank members of the Sabatini laboratory and W. Regehr, M. Andermann, N. Uchida S. Gershman for helpful discussions. We thank J. Levasseur for mouse husbandry and genotyping, and J. Saulnier and L. Worth for laboratory administration. We thank W. Kuwamoto, J. Grande, M. Ambrosino, B. Pryor, E. Lubbers and R. Griep for assistance with behavioral experiments and histology. This work was supported by the NIH (NINDS NS103226, U19NS113201), a P30 Core Center Grant (NINDS NS072030), an Iljou Foundation scholarship and a grant from the Simons Collaborative on the Global Brain.
Footnotes
Declaration of Interests
Dr. Sabatini is a founder and holds private equity in Optogenix. Tapered fibers that are commercially available from Optogenix were used as tools in the research.
Code availability. The code used for analysis (Matlab) is also available from the corresponding author upon reasonable request.
Competing interests. B.L.S. is a founder of and holds private equity in Optogenix. Tapered fibers commercially available from Optogenix were used as tools in the research.
Data availability.
The data that support the findings of this study are available from the corresponding author upon reasonable request.
References
- 1.Amita H & Hikosaka O Indirect pathway from caudate tail mediates rejection of bad objects in periphery. Sci. Adv 5, eaaw9297 (2019). [DOI] [PMC free article] [PubMed] [Google Scholar]
- 2.Tai L-H, Lee AM, Benavidez N, Bonci A & Wilbrecht L Transient stimulation of distinct subpopulations of striatal neurons mimics changes in action value. Nat. Neurosci 15, 1281–1289 (2012). [DOI] [PMC free article] [PubMed] [Google Scholar]
- 3.Nonomura S et al. Monitoring and Updating of Action Selection for Goal-Directed Behavior through the Striatal Direct and Indirect Pathways. Neuron 99, 1302–1314.e5 (2018). [DOI] [PubMed] [Google Scholar]
- 4.Parker NF et al. Reward and choice encoding in terminals of midbrain dopamine neurons depends on striatal target. Nat. Neurosci 19, 845–854 (2016). [DOI] [PMC free article] [PubMed] [Google Scholar]
- 5.Cox J & Witten IB Striatal circuits for reward learning and decision-making. Nat. Rev. Neurosci 20, 482–494 (2019). [DOI] [PMC free article] [PubMed] [Google Scholar]
- 6.Kravitz AV et al. Regulation of parkinsonian motor behaviours by optogenetic control of basal ganglia circuitry. Nature 466, 622–626 (2010). [DOI] [PMC free article] [PubMed] [Google Scholar]
- 7.Kravitz AV, Tye LD & Kreitzer AC Distinct roles for direct and indirect pathway striatal neurons in reinforcement. Nat. Neurosci 15, 816–818 (2012). [DOI] [PMC free article] [PubMed] [Google Scholar]
- 8.Roseberry TK et al. Cell-Type-Specific Control of Brainstem Locomotor Circuits by Basal Ganglia. Cell 164, 526–537 (2016). [DOI] [PMC free article] [PubMed] [Google Scholar]
- 9.Smith Y, Bevan MD, Shink E & Bolam JP Microcircuitry of the direct and indirect pathways of the basal ganglia. Neuroscience 86, 353–387 (1998). [DOI] [PubMed] [Google Scholar]
- 10.Sheng M, Lu D, Shen Z & Poo M Emergence of stable striatal D1R and D2R neuronal ensembles with distinct firing sequence during motor learning. Proc. Natl. Acad. Sci 116, 11038–11047 (2019). [DOI] [PMC free article] [PubMed] [Google Scholar]
- 11.Bakhurin KI et al. Opponent regulation of action performance and timing by striatonigral and striatopallidal pathways. eLife 9, e54831 (2020). [DOI] [PMC free article] [PubMed] [Google Scholar]
- 12.Freeze BS, Kravitz AV, Hammack N, Berke JD & Kreitzer AC Control of Basal Ganglia Output by Direct and Indirect Pathway Projection Neurons. J. Neurosci 33, 18531–18539 (2013). [DOI] [PMC free article] [PubMed] [Google Scholar]
- 13.Garr E & Delamater AR Chemogenetic inhibition in the dorsal striatum reveals regional specificity of direct and indirect pathway control of action sequencing. Neurobiol. Learn. Mem 169, 107169 (2020). [DOI] [PMC free article] [PubMed] [Google Scholar]
- 14.McPeek RM & Keller EL Deficits in saccade target selection after inactivation of superior colliculus. Nat. Neurosci 7, 757–763 (2004). [DOI] [PubMed] [Google Scholar]
- 15.Song J-H, Rafal RD & McPeek RM Deficits in reach target selection during inactivation of the midbrain superior colliculus. Proc. Natl. Acad. Sci 108, E1433–E1440 (2011). [DOI] [PMC free article] [PubMed] [Google Scholar]
- 16.Mana S & Chevalier G Honeycomb-like structure of the intermediate layers of the rat superior colliculus: afferent and efferent connections. Neuroscience 103, 673–693 (2001). [DOI] [PubMed] [Google Scholar]
- 17.Hikosaka O, Takikawa Y & Kawagoe R Role of the Basal Ganglia in the Control of Purposive Saccadic Eye Movements. Physiol. Rev 80, 953–978 (2000). [DOI] [PubMed] [Google Scholar]
- 18.Felsen G & Mainen ZF Midbrain contributions to sensorimotor decision making. J. Neurophysiol 108, 135–147 (2012). [DOI] [PMC free article] [PubMed] [Google Scholar]
- 19.Kopec CD, Erlich JC, Brunton BW, Deisseroth K & Brody CD Cortical and Subcortical Contributions to Short-Term Memory for Orienting Movements. Neuron 88, 367–377 (2015). [DOI] [PMC free article] [PubMed] [Google Scholar]
- 20.Kaneda K, Isa K, Yanagawa Y & Isa T Nigral Inhibition of GABAergic Neurons in Mouse Superior Colliculus. J. Neurosci 28, 11071–11078 (2008). [DOI] [PMC free article] [PubMed] [Google Scholar]
- 21.Rossi MA et al. A GABAergic nigrotectal pathway for coordination of drinking behavior. Nat. Neurosci 19, 742–748 (2016). [DOI] [PMC free article] [PubMed] [Google Scholar]
- 22.Lee J, Wang W & Sabatini BL Anatomically segregated basal ganglia pathways allow parallel behavioral modulation. Nat. Neurosci 1–11 (2020) doi:10.1038/s41593-020-00712-5. [DOI] [PMC free article] [PubMed] [Google Scholar]
- 23.Shin JH, Kim D & Jung MW Differential coding of reward and movement information in the dorsomedial striatal direct and indirect pathways. Nat. Commun 9, 404 (2018). [DOI] [PMC free article] [PubMed] [Google Scholar]
- 24.Li N et al. Spatiotemporal constraints on optogenetic inactivation in cortical circuits. eLife 8, e48622 (2019). [DOI] [PMC free article] [PubMed] [Google Scholar]
- 25.Essig J, Hunt JB & Felsen G Inhibitory midbrain neurons mediate decision making. 10.1101/2020.02.25.965699 (2020) doi: 10.1101/2020.02.25.965699. [DOI] [Google Scholar]
- 26.Takahashi M, Sugiuchi Y & Shinoda Y Topographic Organization of Excitatory and Inhibitory Commissural Connections in the Superior Colliculi and Their Functional Roles in Saccade Generation. J. Neurophysiol 104, 3146–3167 (2010). [DOI] [PubMed] [Google Scholar]
- 27.Sooksawate T, Isa K, Behan M, Yanagawa Y & Isa T Organization of GABAergic inhibition in the motor output layer of the superior colliculus. Eur. J. Neurosci 33, 421–432 (2011). [DOI] [PubMed] [Google Scholar]
- 28.Takahashi M, Sugiuchi Y, Izawa Y & Shinoda Y Commissural Excitation and Inhibition by the Superior Colliculus in Tectoreticular Neurons Projecting to Omnipause Neuron and Inhibitory Burst Neuron Regions. J. Neurophysiol 94, 1707–1726 (2005). [DOI] [PubMed] [Google Scholar]
- 29.Doykos TK, Gilmer JI, Person AL & Felsen G Monosynaptic Inputs to Excitatory and Inhibitory Neurons of the Intermediate and Deep Layers of the Superior Colliculus. bioRxiv 824250 (2019) doi: 10.1101/824250. [DOI] [PMC free article] [PubMed] [Google Scholar]
- 30.Mysore SP & Knudsen EI A shared inhibitory circuit for both exogenous and endogenous control of stimulus selection. Nat. Neurosci 16, 473–478 (2013). [DOI] [PMC free article] [PubMed] [Google Scholar]
- 31.Mysore SP & Knudsen EI The role of a midbrain network in competitive stimulus selection. Curr. Opin. Neurobiol 21, 653–660 (2011). [DOI] [PMC free article] [PubMed] [Google Scholar]
- 32.Jiang H, Stein BE & McHaffie JG Opposing basal ganglia processes shape midbrain visuomotor activity bilaterally. Nature 423, 982–986 (2003). [DOI] [PubMed] [Google Scholar]
- 33.Liu P & Basso MA Substantia Nigra Stimulation Influences Monkey Superior Colliculus Neuronal Activity Bilaterally. J. Neurophysiol 100, 1098–1112 (2008). [DOI] [PMC free article] [PubMed] [Google Scholar]
- 34.Geddes CE, Li H & Jin X Optogenetic Editing Reveals the Hierarchical Organization of Learned Action Sequences. Cell 174, 32–43.e15 (2018). [DOI] [PMC free article] [PubMed] [Google Scholar]
- 35.Tecuapetla F, Jin X, Lima SQ & Costa RM Complementary Contributions of Striatal Projection Pathways to Action Initiation and Execution. Cell 166, 703–715 (2016). [DOI] [PubMed] [Google Scholar]
- 36.Zalocusky KA et al. Nucleus accumbens D2R cells signal prior outcomes and control risky decision-making. Nature 531, 642–646 (2016). [DOI] [PMC free article] [PubMed] [Google Scholar]
- 37.Schultz W, Dayan P & Montague PR A Neural Substrate of Prediction and Reward. Science 275, 1593–1599 (1997). [DOI] [PubMed] [Google Scholar]
- 38.Cohen JY, Haesler S, Vong L, Lowell BB & Uchida N Neuron-type-specific signals for reward and punishment in the ventral tegmental area. Nature 482, 85–88 (2012). [DOI] [PMC free article] [PubMed] [Google Scholar]
- 39.Iino Y et al. Dopamine D2 receptors in discrimination learning and spine enlargement. Nature 579, 555–560 (2020). [DOI] [PubMed] [Google Scholar]
- 40.Yamaguchi T et al. Role of PKA signaling in D2 receptor-expressing neurons in the core of the nucleus accumbens in aversive learning. Proc. Natl. Acad. Sci. U. S. A 112, 11383–11388 (2015). [DOI] [PMC free article] [PubMed] [Google Scholar]
- 41.Lee SJ et al. Cell-type-specific asynchronous modulation of PKA by dopamine in learning. Nature 590, 451–456 (2021). [DOI] [PMC free article] [PubMed] [Google Scholar]
Additional References
- 42.Gerfen CR, Paletzki R & Heintz N GENSAT BAC Cre-Recombinase Driver Lines to Study the Functional Organization of Cerebral Cortical and Basal Ganglia Circuits. Neuron 80, 1368–1383 (2013). [DOI] [PMC free article] [PubMed] [Google Scholar]
- 43.Guo ZV et al. Flow of Cortical Activity Underlying a Tactile Decision in Mice. Neuron 81, 179–194 (2014). [DOI] [PMC free article] [PubMed] [Google Scholar]
- 44.Mante V, Sussillo D, Shenoy KV & Newsome WT Context-dependent computation by recurrent dynamics in prefrontal cortex. Nature 503, 78–84 (2013). [DOI] [PMC free article] [PubMed] [Google Scholar]
- 45.Li N, Daie K, Svoboda K & Druckmann S Robust neuronal dynamics in premotor cortex during motor planning. Nature 532, 459–464 (2016). [DOI] [PMC free article] [PubMed] [Google Scholar]
- 46.Bro R, Acar E & Kolda TG Resolving the sign ambiguity in the singular value decomposition. J. Chemom 22, 135–140 (2008). [Google Scholar]
- 47.Peron SP, Freeman J, Iyer V, Guo C & Svoboda K A Cellular Resolution Map of Barrel Cortex Activity during Tactile Behavior. Neuron 86, 783–799 (2015). [DOI] [PubMed] [Google Scholar]
- 48.Franklin KBJ & Paxinos G Paxinos and Franklin’s the Mouse Brain in Stereotaxic Coordinates, Compact: The Coronal Plates and Diagrams. (Academic Press, 2019). [Google Scholar]
Associated Data
This section collects any data citations, data availability statements, or supplementary materials included in this article.
Data Availability Statement
The data that support the findings of this study are available from the corresponding author upon reasonable request.