


Abstract
The human gene encoding α1-antitrypsin (α1AT, gene symbol PI) is highly expressed in the liver and in cultured hepatoma cells and, to a lesser extent, in macrophages, where transcription originates from a separate upstream promoter. α1AT maps to a region of human chromosome 14q32.1 that includes a related serine protease inhibitor (serpin) gene that encodes corticosteroid-binding globulin (CBG). We recently reported the chromatin organization of this ~130 kb region, as defined by DNase I hypersensitive sites (DHSs) and matrix-attachment regions, in expressing and non-expressing cells. Furthermore, we demonstrated that transfer of human chromosome 14 from non-expressing fibroblasts to rat hepatoma cells resulted in activation of both α1AT and CBG transcription and gene activation was accompanied by long range chromatin reorganization of the entire region. In this study, we transferred human chromosome 14 from fibroblasts to mouse macrophages and documented activation of α1AT but not CBG gene expression. RT–PCR experiments indicated that transcription of the human α1AT gene in the microcell hybrids initiated at the macrophage promoter. Furthermore, DHS mapping experiments revealed a distinctive chromatin configuration of the locus that resembled the structure found in human macrophage-like cell lines, with many DHSs around α1AT but few in CBG. Thus, mouse macrophage cell lines will provide a useful cell type to study the effects of targeted modifications of the human α1AT–CBG locus on the regulation of cell-specific gene activity and chromatin structure.
INTRODUCTION
The glycoprotein α1-antitrypsin (α1AT) is the most abundant serine protease inhibitor (serpin) in human plasma. Although α1AT can inhibit a wide range of serine proteases, its primary physiological target is neutrophil elastase. α1AT deficiencies are associated with increased risks of early onset pulmonary emphysema and/or juvenile liver cirrhosis. α1AT is synthesized predominantly in hepatocytes, but lower levels of expression are also found in extrahepatic tissues, particularly in blood monocytes and macrophages (1). It is believed that localized synthesis of α1AT by these cells plays a critical role in regulating the protease/protease inhibitor balance in various tissues (for reviews see 2–5).
α1AT is a prototypical acute phase protein and its plasma concentration increases 3- to 4-fold during host responses to inflammation or tissue injury. α1AT is also expressed in intestinal cells and derived colonic adenocarcinoma cell lines (6–8). Studies in transgenic mice have shown that other tissues express low levels of α1AT (9–13), but the physiological significance of these minor expression sites is not well defined.
Human α1AT (gene symbol PI) is encoded by a unique gene located on human chromosome 14q32.1 (14,15). This region includes five other serpin genes, including α1-antichymotrypsin (AACT), corticosteroid-binding globulin (CBG), kallistatin (KAL, gene symbol PI4), protein C inhibitor (PCI) and ATR (gene symbol PIL), an antitrypsin-related sequence that may be a pseudogene (16–18). We recently reported the genomic organization of this ~300 kb region and showed that the serpin gene cluster is organized into two distinct subclusters of three genes each with similar genomic organizations. The distal subcluster includes KAL, PCI and AACT, while the proximal subcluster, ~170 kb more centromeric, contains α1AT, ATR and CBG (19).
All protein-coding serpin genes in the 14q32.1 gene cluster are actively transcribed in the liver and cultured hepatoma cells. In contrast, all five genes are transcriptionally silent in most other cell types. However, a few cell types, such as macrophages and intestinal epithelial cells, express some but not all of these serpin genes. Therefore, this group of related genes provides a valuable model system to study the regulation of gene activity and chromatin structure in a large genomic region.
Chromatin structure plays an important role in regulating gene expression (for reviews see 20–26). To study mechanisms that control gene activity and the chromatin structure of the serpin locus, we characterized the proximal serpin gene subcluster in detail. The α1AT, ATR and CBG genes are arranged in a head-to-tail orientation, with ~12 kb between α1AT and ATR and ~40 kb between ATR and CBG (27). The chromatin structure of this ~130 kb region, as defined by DNase I hypersensitive sites (DHSs) (28,29), is very different between expressing and non-expressing human cells. For example, HepG2 hepatoma cells, which express high levels of both α1AT and CBG, displayed 29 DHSs in the ~130 kb interval from ~25 kb upstream of α1AT to ~20 kb downstream of CBG, whereas non-expressing HeLa S3 cells or primary diploid fibroblasts have only seven sites in this region. Furthermore, we demonstrated that microcell transfer of a neo-tagged human chromosome 14 from non-expressing mouse fibroblasts to rat hepatoma cells results in activation of both α1AT and CBG gene expression to recipient cell-typical levels, and activation was accompanied by long range chromatin reorganization of the entire region such that it recapitulated the chromatin structure of expressing cells. Similarly, when chromosome 14 was transferred to rat fibroblasts, α1AT and CBG were repressed and the region displayed a chromatin configuration similar to that of non-expressing cells (30).
In human monocytes and macrophages, α1AT transcription originates from a distinct promoter located ~2 kb upstream of the well-defined liver promoter, which is also active in enterocytes (7,31). In both hepatocytes and enterocytes, α1AT gene expression requires hepatocyte nuclear factors 1α and 4 (HNF-1α and HNF-4) (32–39). We recently demonstrated that the HNF-4/HNF-1α transactivation cascade also regulates CBG expression in hepatic cells and HNF-1α and HNF-4 play critical roles in the establishment of a hepatocyte-specific long range chromatin structure around both genes (40). In contrast, little is known about α1AT gene regulation in monocytes and macrophages. Transgenic mice that contain α1AT transgenes that include both promoters express human α1AT in both the liver and macrophages (9,10), but virtually nothing is known about cis-regulatory elements or trans-acting factors that regulate the activity of the macrophage promoter.
Because monocytic and macrophage cells express α1AT but not CBG, DHS analyses around these genes may provide insight into the chromatin domain organization (41) of the locus. In this study, we analyzed gene expression and chromatin structure of the proximal serpin gene subcluster in human ‘macrophage-like’ cell lines. In these cell lines, expression of α1AT could be induced by incubating the cells in medium containing phorbol esters. A detailed map of DHSs in the ~130 kb region around α1AT and CBG was generated and compared to the DHS maps of expressing (hepatoma) and non-expressing (HeLa S3) cells, as well as those of activated or extinguished alleles in rat hepatoma and fibroblast microcell hybrids. We demonstrate that transfer of human chromosome 14 from non-expressing fibroblasts to mouse macrophages resulted in activation of α1AT but not CBG gene expression, and this was accompanied by long range chromatin reorganization of the region. The chromatin configuration of the locus in macrophage microcell hybrids was similar to that of human macrophage-like cell lines. Therefore, although there is no significant expression of any of the murine α1AT genes in mouse macrophages due to the absence of macrophage-specific promoters (42), these cells provide a useful background to study macrophage-specific expression and organization of the human α1AT locus.
MATERIALS AND METHODS
Cell lines and culture conditions
The following human cell lines were obtained from the American Type Culture Collection (ATCC): the hepatocellular carcinoma cell line HepG2; the cervical carcinoma line HeLa S3; the colonic adenocarcinoma cell line Caco-2; the monocytic cell line THP-1; the histiocytic lymphoma cell line U-937; the promyelocytic leukemia cell line HL-60. The mouse macrophage cell line MH-S (derived by SV40 transformation of an adherent population of alveolar macrophages from a 7-week-old BALB/cJ mouse) and the rat fibroblast cell line Rat-2 were also obtained from ATCC. ML-1 is a human myeloblastic leukemia cell line (43). H30-1 is an HPRT-deficient derivative of HepG2 (44) and HeLa S3-neo1 is a neo-tagged, G418-resistant clone derived from HeLa S3 (unpublished data). F(14n)2, R(14n)5 and R(14n)6 are rat hepatoma and rat fibroblast microcell hybrids, respectively, that contain a single copy of human chromosome 14; they were prepared by transferring chromosome 14 from HDm-5, a mouse fibroblast (3T6) cell that contains a neo-marked human chromosome 14 derived from diploid fibroblasts (45), to Fao-1 rat hepatoma cells or Rat-2 rat fibroblasts as described (30,46). (EH4)6B and (EH4)6X, rat hepatoma variants that contain human chromosome 14 and express transfected HNF-4 expression plasmids, have been described (40). Mouse macrophage microcell hybrids were prepared similarly by transferring the neo-tagged human chromosome 14 from HDm-5 to the MH-S mouse macrophage cell line.
All cells were grown in 1:1 Ham’s F12:Dulbecco’s modified Eagle’s medium (F/DV) supplemented with 10% fetal bovine serum (Gibco). F(14n)2, R(14n)5 and R(14n)6 cells were grown in medium containing 250 µg/ml G418. (EH4)6B and (EH4)6X cells were grown in medium containing 500 µg/ml G418 and 300 µg/ml hygromycin B. Mouse macrophage microcell hybrids were grown in the presence of 100 µg/ml G418. Human cell lines HL-60, ML-1, THP-1 and U-937 were induced to differentiate into ‘macrophage-like’ cells by incubation in medium containing 50 ng/ml 12-O-tetradecanoylphorbol-13-acetate (TPA; Sigma) for 24–96 h.
RNA and DNA blot hybridizations
Cytoplasmic RNAs were isolated from the cells and analyzed on 1.2% agarose–formaldehyde gels as described (30). The different probes used were: α1AT, a 567 bp BamHI–DraI fragment from cosmid αATc1 (9) containing most exon II sequences of human α1AT; exon IB of α1AT, a 0.68 kb SphI–BamHI fragment from a subclone of cosmid αATc1 (9) containing 210 bp of macrophage-specific exon IB of α1AT (31) plus intronic sequences; CBG, an ~1.5 kb EcoRI fragment containing the full-length human CBG cDNA (47); AACT, an ~1.6 kb fragment derived from phACT235 (48) containing the full-length human AACT cDNA. As loading controls, filters were rehybridized with either a rat cyclophilin cDNA probe (49) or a human glyceraldehyde 3-phosphate dehydrogenase (GAPDH) cDNA probe (50). Alternatively, the intensities of ethidium bromide stained rRNA bands were compared. Relative levels of α1AT mRNAs in the various cell lines were estimated by comparing the autoradiographic intensities of the α1AT hybridization signals to those of serially diluted HepG2 cytoplasmic RNA.
Southern hybridizations of macrophage microcell hybrids were performed as described (30) using the following probes: neo, a 1.34 kb StuI–SmaI fragment from cosmid vector SuperCos1 (Stratagene); cathepsin G, a 1.39 kb PstI–XbaI fragment (containing exons III–V) derived from a 3.0 kb EcoRI subclone containing the complete human cathepsin G gene (51); CBG, an ~1 kb XhoI–EcoRI fragment from cosmid Ycos28 (19) located ~11 kb downstream of CBG exon 5; α1AT, the 567 bp BamHI–DraI fragment from cosmid αATc1 (9) described above; PCI, an ~1 kb SacI fragment from cosmid Ycos84 (19), located ~7 kb downstream of PCI exon V, between PCI and AACT.
RT–PCR analyses
Human α1AT transcripts originating from the macrophage promoter in mouse macrophage microcell hybrids were analyzed by RT–PCR using the Superscript™ One-Step™ RT–PCR System (Life Technologies). cDNA synthesis (using 1 µg of cytoplasmic RNA per assay in a 50 µl reaction volume) was usually performed at 53°C for 30 min, followed by a 2.5 min denaturation at 94°C. The cDNA was then subjected to 35 cycles of PCR amplification (20 s denaturation at 94°C, 30 s annealing at 57°C, 90 s extension at 72°C), followed by a final extension step of 10 min at 72°C. Occasionally, more stringent conditions (RT at 55°C and annealing during the PCR up to 65°C) were used. Amplified products were visualized on 1.2–2% agarose gels, purified by electroelution, sequenced directly or first subcloned into pGEM-2 (Promega) and then sequenced using an ABI PRISM 377 DNA Sequencer using α1AT and/or vector-specific primers. The various human α1AT primers used in these experiments were as follows: 1A (in exon IA, overlapping an EcoRI site, underlined), 5′-GCTGCCAGGAATTCCAGGTTGGAG-3′; 1A2, (in exon IA, overlapping a StuI site, underlined), 5′-CCTCCGAGGAAGGCCTAGCTGCTG-3′; 1Bf (the 5′-end of exon IB, forward primer to amplify and/or sequence downstream sequences), 5′-GGCGGCAGTAAGTCTTCAGC-3′; 1Br (the 3′-end of exon IB, reverse primer to amplify and/or sequence upstream sequences), 5′-GGCTCAGAAACCACAGCGTC-3′; 1Cf (5′-end of exon IC), 5′-CGTTGCCCCTCTGGATCCAC-3′; 1Cr (3′-end of exon IC), 5′-TCACTGTCCCAGGTCAGTGG-3′; 2r (in exon II, reverse primer for cDNA synthesis, overlapping a BsaAI site, underlined), 5′-CTTGAGTACCCTTCTCCACGTAATCG-3′; 2r2 (in exon II, reverse primer), 5′-GGGATGTATCTGTCTTCTGGGCAGC-3′; 2r3 (in exon II, reverse primer), 5′-GGTACGGAGGAGTTCCTGGAAGCC-3′.
DNase I hypersensitive site mapping
Nuclei of the various cell lines were isolated and digested with increasing concentrations of DNase I. Purified DNA was analyzed by Southern hybridization using a variety of unique sequence probes from the α1AT–ATR–CBG region as described (30,40). The same range of DNase I concentrations was used for each cell line.
RESULTS
Expression of α1AT in human ‘macrophage-like’ cell lines
In humans, the gene encoding α1AT is highly expressed in liver and hepatoma cell lines. Lower levels of expression are also found in other cells, such as blood monocytes, tissue macrophages and enterocytes (1,6). Monocytes and macrophages use a macrophage-specific promoter that is located ~2 kb upstream of the well-defined liver/enterocyte promoter (31).
We first determined whether α1AT was expressed in the following ‘macrophage-like’ human cell lines: the monocytic cell line THP-1, the myeloblastic leukemia cell line ML-1, the histiocytic lymphoma cell line U-937 and the promyelocytic leukemia cell line HL-60. Normally proliferating suspension cultures of these cells did not express α1AT mRNA that was detectable by northern hybridization (Fig. 1, lanes marked susp.). However, all four cell lines could be induced to differentiate into ‘macrophage-like’ cells by incubation in medium con-taining TPA. Upon differentiation, the cells adhered to plastic and could be maintained for at least 4 days. Steady-state levels of α1AT mRNA in the four cell lines after incubation with TPA for 24–96 h are shown in Figure 1. All four cell lines expressed α1AT after TPA treatment, although the levels and kinetics of expression varied among the different cell lines. ML-1 cells expressed the highest levels of α1AT mRNA among the four cell lines (Fig. 1) and α1AT mRNA levels in ML-1 cells cultured with TPA for 48 h approached those of HepG2 human hepatoma cells (Fig. 2, upper panel). TPA also induced α1AT mRNA expression in THP-1, U-937 and HL-60 cells, but to lower levels (Figs 1 and 2). Actively dividing Caco-2 cells, a human colonic adenocarcinoma cell line, expressed ~25-fold lower levels of α1AT mRNA than HepG2 cells; these levels were similar to those of U-937 or HL-60 cells treated with TPA for 24–72 h (Fig. 2).
Figure 1.
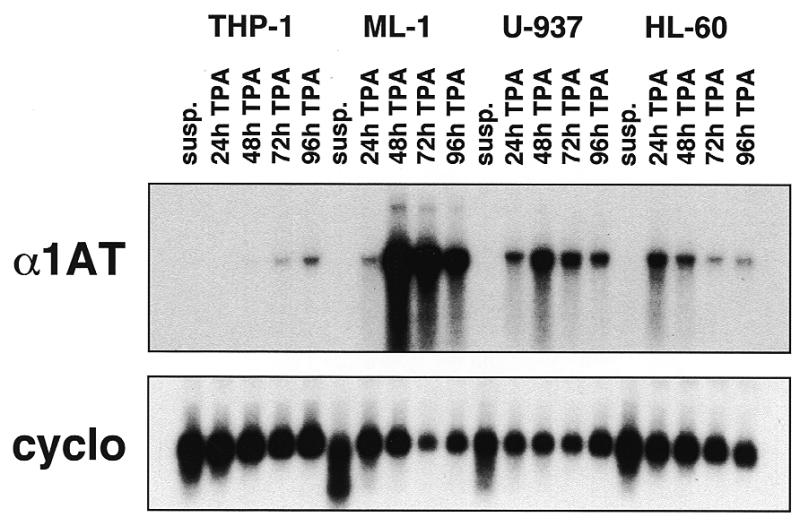
Expression of α1AT mRNA in human macrophage-like cell lines. The monocytic cell line THP-1, the myeloblastic leukemia cell line ML-1, the histiocytic lymphoma cell line U-937 and the promyelocytic leukemia cell line HL-60 were grown in suspension (susp.) or in medium supplemented with 50 ng/ml TPA for 0–96 h. Cytoplasmic RNAs (5 µg/lane) were analyzed by northern hybridization, using a probe covering most of human α1AT exon II. As a loading control, the filter was stripped and rehybridized to a cyclophilin (cyclo) probe.
Figure 2.
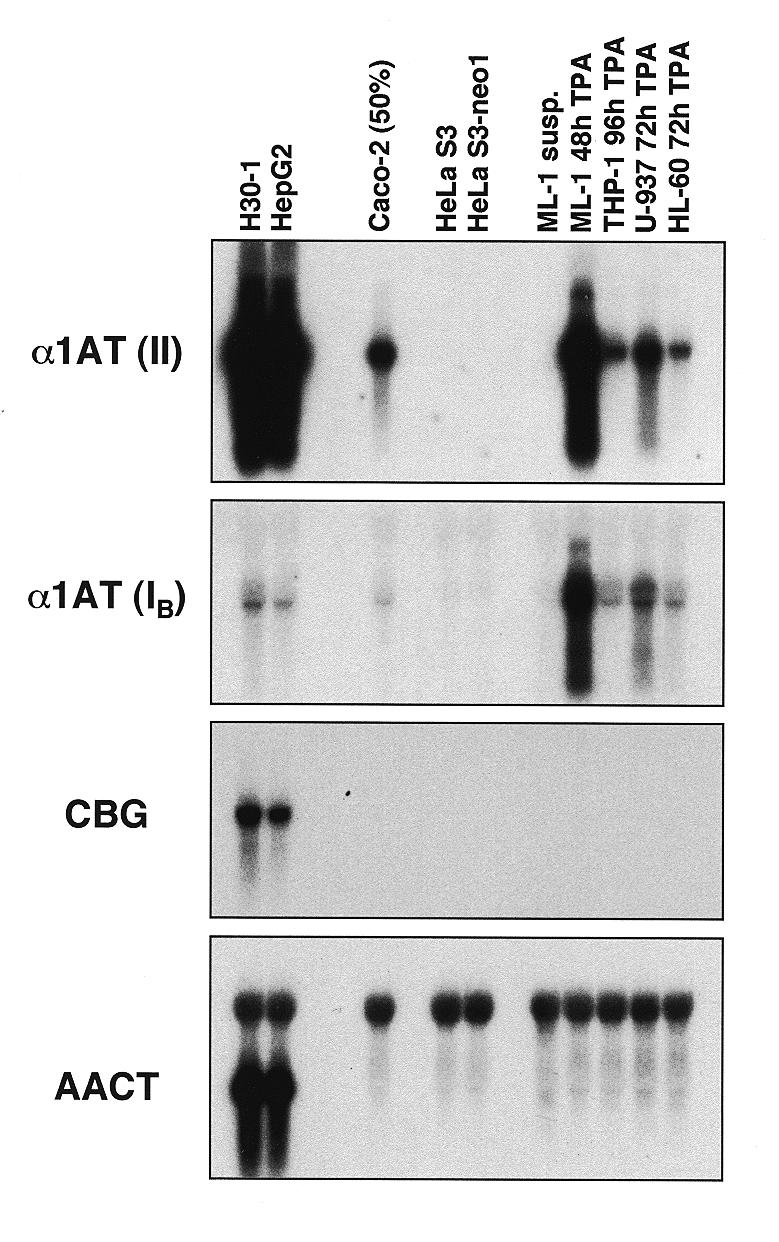
Expression of α1AT, CBG and AACT mRNAs in human cell lines. Aliquots of 5 µg of cytoplasmic RNA from the indicated cell lines were sequentially analyzed by northern blot hybridization using the following human probes: α1AT, a 567 bp BamHI–DraI fragment containing most exon II sequences of α1AT (II); exon IB of α1AT, a 0.68 kb SphI–BamHI fragment that contained the 210 bp of α1AT macrophage-specific exon IB plus intronic sequences (IB); CBG, an ~1.5 kb EcoRI fragment containing the full-length CBG cDNA; AACT, an ~1.6 kb fragment derived from clone phACT235 (48) containing the full-length AACT cDNA. This probe cross-hybridized with 28S rRNA. The various cell lines are described in Materials and Methods. Caco-2 cells were ~50% confluent at the time of RNA isolation.
Using a genomic α1AT probe spanning macrophage-specific exon IB, we verified that most, if not all, α1AT transcripts detected in TPA-induced macrophage-like cells originated from the upstream macrophage promoter (Fig. 2, second panel). The low signals observed in HepG2 and Caco-2 cells with this probe were likely due to weak initiation at the macrophage promoter in these cell lines. It has been shown previously that HepG2 and Caco-2 cells can initiate transcription from the macrophage promoter under some conditions, such as during modulation by the acute phase mediator interleukin 6 (IL-6) (7). None of the human ‘macrophage-like’ cell lines expressed CBG or AACT mRNAs detectable by northern hybridization, even after prolonged exposure of the RNA blots (Fig. 2, third and fourth panels, and data not shown).
Transfer of human chromosome 14 from fibroblasts to macrophage cell lines
We previously showed that microcell transfer of human chromosome 14 from fibroblasts to rat hepatoma cells resulted in activation of human α1AT and CBG gene expression, and activation was accompanied by long range chromatin reorganization of the entire ~130 kb region to a chromatin state typical of expressing cells (30,40). Mouse macrophages do not express α1AT mRNA because none of the murine α1AT genes contains a functional macrophage promoter (42). To determine whether murine macrophages would be a suitable cell type in which to study macrophage-specific expression of the human α1AT gene, we transferred human chromosome 14 to mouse macrophage MH-S cells.
A neo-marked human chromosome 14 was transferred from HDm-5, a mouse fibroblast microcell hybrid, to MH-S cells by microcell fusion. Independent microcell hybrid clones were obtained and tested for retention of an intact copy of human chromosome 14 by fluorescence in situ hybridization (FISH) and Southern marker analysis. Figure 3 shows an example of marker analysis of eight of the MH-S-derived microcell hybrid clones using probes from the neo insertion, cathepsin G (a single copy gene located at 14q11.2) and three probes from the 14q32.1 serpin gene cluster (CBG, α1AT and PCI). As negative and positive controls, the parental macrophage cell line MH-S, a rat hepatoma microcell hybrid containing human chromosome 14, F(14n)2 and the human hepatoma cell line HepG2 were used.
Figure 3.
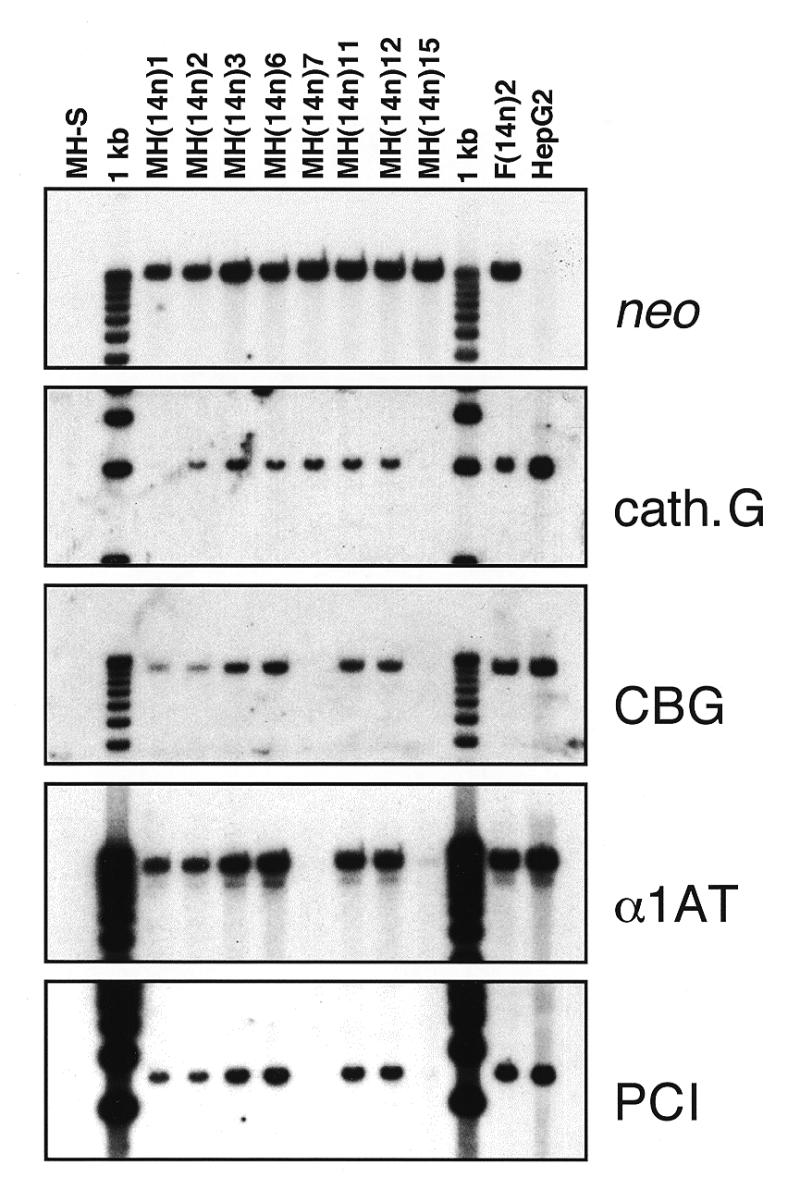
Genotype analysis of MH-S mouse/human macrophage hybrids. Genomic DNAs (3 µg/lane) from the parental mouse macrophage cell line (MH-S), various MH-S hybrids containing all or parts of human chromosome 14 [MH(14n)1, etc.], a rat hepatoma hybrid containing human chromosome 14 [F(14n)2] and a human hepatoma cell line (HepG2) were digested with EcoRI and analyzed by Southern blot hybridization. The various probes are described in Materials and Methods. The α1AT probe (an exon II fragment) cross-hybridized with the corresponding region of ATR, resulting in a faint ~7.7 kb band of hybridization below the ~9.6 kb α1AT band.
As expected, DNAs from all of the hybrid clones hybridized with a neo probe, but not all of them had an intact chromosome 14. For example, MH(14n)1 contained all three serpin genes but lacked the cathepsin G marker at 14q11.2, whereas MH(14n)7 lacked the serpin genes but contained cathepsin G. MH(14n)15 apparently contained a small human chromosome fragment that included neo but none of the other markers. However, many microcell hybrid clones, e.g. MH(14n)2, MH(14n)3, MH(14n)6, MH(14n)11 and MH(14n)12, contained an apparently intact human chromosome 14 by marker analysis (Fig. 3) and FISH (data not shown). The morphology of all of the MH-S-derived microcell hybrids was similar to that of their MH-S parent (Fig. 4).
Figure 4.
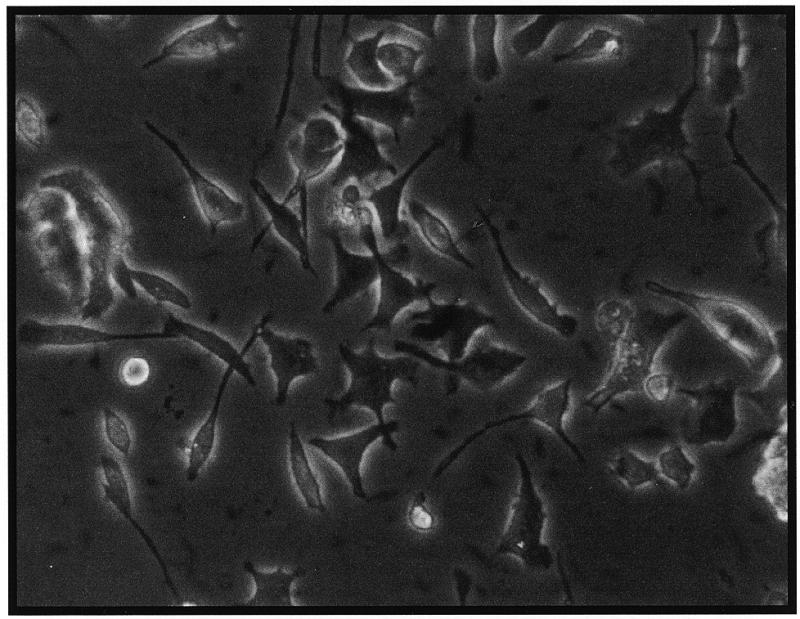
Morphology of MH-S mouse/human macrophage hybrids. Photographs of living MH(14n)6 cells were taken under phase contrast using Polaroid 667 film and scanned for reproduction using a UMAX PowerLook II scanner and Adobe Photoshop v.5.0 (Adobe Systems).
Activation of human α1AT expression in mouse macrophage microcell hybrids
To determine whether the mouse macrophage microcell hybrids expressed the human α1AT gene, cytoplasmic RNAs were prepared and steady-state levels of α1AT mRNA were assayed by northern hybridization. Figure 5A shows an example of this analysis in which two halves of the same gel (left and right panels) were hybridized with α1AT and GAPDH probes. α1AT mRNA was not expressed in the parental MH-S mouse macrophage cells, in Rat-2 fibroblasts or in Rat-2-derived microcell hybrids containing human chromosome 14 [R(14n)5 and R(14n)6, Fig. 5A]. α1AT mRNA was highly expressed in human HepG2 hepatoma cells and in Caco-2 colonic adenocarcinoma cells. Significantly, all of the MH-S macrophage-derived microcell hybrids that contained an intact human chromosome 14 [MH(14n)3, MH(14n)6, MH(14n)11 and MH(14n)12] expressed low but readily detectable levels of human α1AT mRNA. By comparing the autoradiographic intensities of these α1AT hybridization signals with those of control cell lines (e.g. Fig. 5A, right) or with serial dilutions of HepG2 RNA (not shown), we estimate that the MH(14n) hybrids expressed ~0.05–0.5% of the α1AT mRNA of HepG2 cells, where the gene is highly expressed from the hepatocyte promoter. Hybrid clones that had deleted the human serpin gene cluster (Fig. 3) did not express human α1AT mRNA [MH(14n)7 and MH(14n)15, Fig. 5A].
Figure 5.
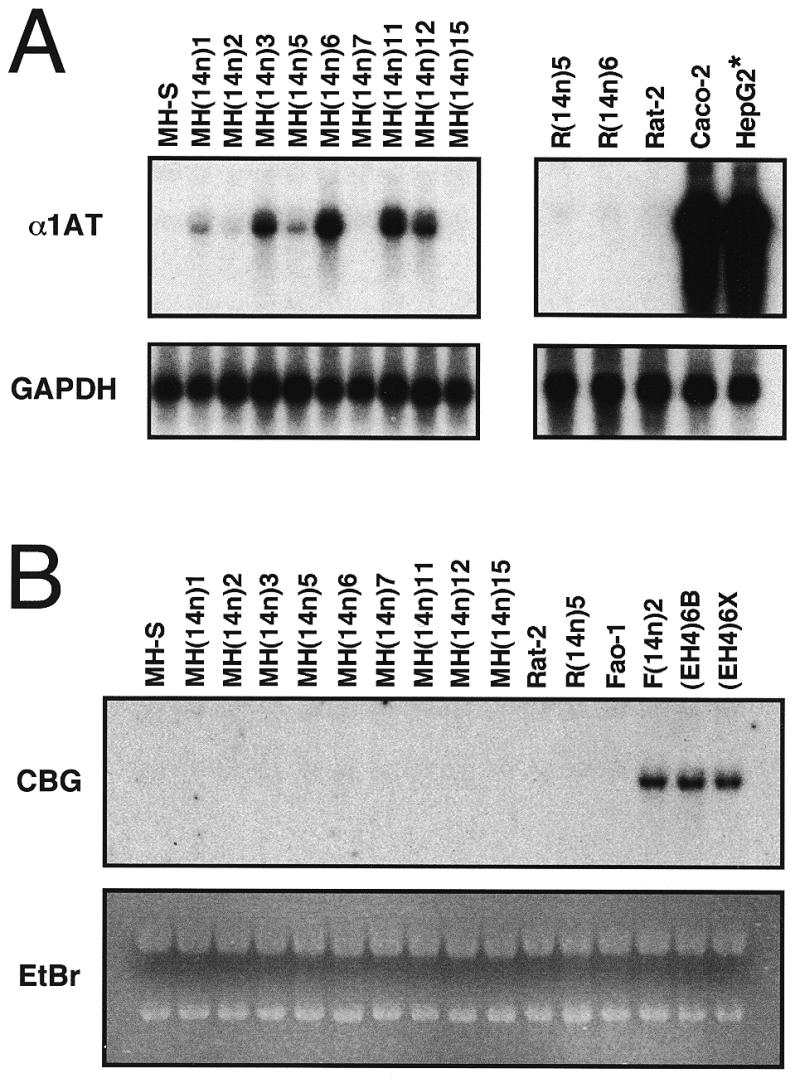
Activation of human α1AT but not CBG expression in mouse macrophage microcell hybrids. (A) Cytoplasmic RNAs (4 µg/lane) from parental or hybrid mouse macrophage cell lines (left) or control cell lines (right) were hybridized to a human α1AT exon II probe, then reprobed with a human GAPDH cDNA probe. The HepG2 lane contained only 200 ng of HepG2 RNA mixed with 4 µg of HeLa S3 RNA. (B) Cytoplasmic RNAs from the indicated cell lines (5 µg/lane) were hybridized to a full-length human CBG cDNA probe (CBG). As a loading control, ethidium bromide staining (EtBr) of the gel is shown.
Thus, although murine α1AT genes are not expressed in mouse macrophages (42), the human α1AT locus can be activated in MH-S cells and, as shown below, transcription initiates at the human macrophage-specific promoter. Furthermore, steady-state levels of human α1AT mRNA in the MH-S microcell hybrids were generally similar to those of human macrophage-like cell lines (Figs 1 and 2). Significantly, none of the macrophage microcell hybrids expressed human CBG (Fig. 5B). These results indicate that transfer of human chromosome 14 from fibroblasts to mouse macrophages activated α1AT but not CBG gene expression in a cell-specific fashion.
Macrophage microcell hybrids use the upstream α1AT promoter
The human α1AT gene is composed of seven exons: IA, IB, IC, II, III, IV and V. In hepatocytes and enterocytes, transcription starts within exon IC. In macrophages, there are two initiation sites in exon IA (Fig. 6A) and possibly one in exon IB (7). Because α1AT mRNA is expressed at low levels in macrophages and MH-S macrophage hybrids, northern hybridization was not sufficiently sensitive to detect α1AT mRNAs using a macrophage-specific α1AT probe containing exons IA, IB and the 5′-half of IC (data not shown). Therefore, we used RT–PCR to investigate whether MH-S hybrids utilized the macrophage-specific α1AT promoter.
Figure 6.

Macrophage-specific α1AT promoter utilization by mouse macrophage hybrids. (A) Schematic representation of the 5′-portion of the human α1AT gene. Exons are drawn to scale, with arrows indicating two previously mapped macrophage-specific transcription initiation sites. Approximate positions of the various primers used in RT–PCR experiments are indicated below the map by arrows. (B) Example of RT–PCR reactions using various primer pairs (indicated above each lane) with cytoplasmic RNA from the MH(14n)11 macrophage microcell hybrid cell line. An aliquot (10 µl) of each 50 µl reaction was loaded on a 1.5% agarose gel. Lanes 6, 11 and 15 (‘100 bp’) contained ~200 ng of the 100 bp ladder from Life Technologies; sizes (in bp) are indicated on the right. The first (lane 1) and last (lane 20) lanes of the gel (–) contained aliquots of RT–PCR reactions performed using RNA from non-expressing HeLa S3 cells. (C) A series of RT–PCR reactions using the 1A/2r primer pair (A) on cytoplasmic RNA from the indicated cell lines. ML-1 cells were induced with TPA for 24 h before RNA isolation.
Nine different primers, described in Materials and Methods, were used (Fig. 6A). Primers 1A and 2r were designed to overlap restriction sites found in exons IA and II of human α1AT (EcoRI and BsaAI, respectively) to facilitate the cloning of amplification products. Other primers in exons IA, IB, IC and II were designed and used in various combinations. Figure 6B shows the results of an experiment in which cytoplasmic RNA from the MH(14n)11 macrophage hybrid was reverse transcribed and PCR amplified using various primer pairs. Using primer pairs in exons IA/IB, IA/IC, IB/IC, IB/II and IC/II, various specific RT–PCR products were obtained. For example, the 1A2/1Br and 1A/1Br primer pairs generated a 330 and a 304 bp fragment, respectively (Fig. 6B, lanes 2 and 4, respectively), that perfectly matched published IA/IB exon structures (31). Similarly, the 1Cf/2r2, 1Cf/2r3 and 1Cf/2r pairs generated the expected 213, 476 and 669 bp amplification products (Fig. 6B, lanes 12, 13 and 14, respectively).
The 1A2/1Cr and 1A/1Cr primer pairs amplified two fragments that differed in size by ~200 bp (Fig. 6B, lanes 3 and 5). This was consistent with the amplification of two mRNA species, one containing exon IB and one in which IB had been removed by alternative splicing, as previously reported (7,31). However, an additional, faint band ~15–20 bp shorter than the upper band in each reaction (Fig. 6B, lanes 3 and 5) was consistently observed. These products, consistently ~15–20 bp shorter than the predicted size, were also observed using other primer pairs, such as 1Bf/1Cr and 1Bf/2r2 (Fig. 6B, lanes 7 and 8). They were also present, but poorly resolved, using primer pairs that yielded larger (>600 bp) amplification products (e.g. 1Bf/2r3 and1Bf/2r; Fig. 6B, lanes 9 and 10). These observations suggested that the splice donor of exon IB and/or the splice acceptor of exon IC might vary. This possibility was verified by DNA sequence analysis of the amplification products (below).
When primer pairs in exons IA and II were used (e.g. 1A/2r, 1A/2r3, 1A2/2r or 1A2/2r3), five bands were consistently amplified from macrophage RNA samples, whether from human macrophage-like cells (Fig. 6C, lane ML-1) or mouse macrophage microcell hybrids containing human chromosome 14 [Fig. 6B, lanes 16–19; Fig. 6C, lanes MH(14n)6 and MH(14n)11]. These products were also produced using hepatoma RNA samples [Fig. 6C, lanes HepG2 and F(14n)2], although the upper two bands were less abundant in HepG2 RNA than in other samples. None of these amplification products were obtained using RNA from non-expressing HeLa S3 cells or in water controls (Fig. 6B, lanes 1 and 20; Fig. 6C, lanes H2O and HeLa S3). These five bands were consistently observed even when the RT–PCR reactions were carried out under stringent conditions (cDNA synthesis at 55°C and annealing during PCR up to 65°C).
The nature of the five amplification products obtained using the 1A/2r primer pair (denoted I–V in Fig. 7A) was investigated by nucleotide sequencing. PCR reaction products were loaded on preparative agarose gels and the bands were purified by electroelution. Only the lower, most abundant amplification product, band I, could be sequenced directly: it consisted of α1AT exon IA spliced directly to exon II (Fig. 7). This transcript utilized the expected splice donor and acceptor sites in exons IA and II and represents a previously unreported splice variant of human α1AT. The other four amplified products (bands II–V) were also purified from the gels, but they could not be sequenced directly because they were heterogeneous.
Figure 7.

Sequence analysis of MH(14n) mouse macrophage hybrid RT–PCR products. (A) The gel shows an example of RT–PCR amplification of MH(14n)11 cytoplasmic RNA using the 1A/2r primer pair (see also Fig. 6A and C). Five bands were consistently obtained; the exon composition of three of them (I, III and V) is depicted on the right. Bands II and IV are heteroduplexes between bands I/III and I/V, respectively (see text). (B) Nucleotide sequence analysis of the various RT–PCR products amplified from MH(14n) hybrids. The first line is part of the genomic sequence of human α1AT (54). Exons are indicated by upper case and intronic sequences by lower case letters. Previously identified consensus GT…AG intron boundaries are underlined, as is the ATG translational start site at the beginning of exon II. New splice donor and acceptor sites identified in this study are indicated in italic (a GT 18 bp upstream of the 3′-end of exon IB and an ag 5 bp upstream of the 5′-end of exon IC). The sequences of various RT–PCR products in bands I, III and V (A) are indicated.
Bands III and V were subcloned in a plasmid vector and sequenced. As shown in Figure 7A, they represented mRNA species with the general structures IA–IC–II and IA–IB–IC–II, respectively. However, nucleotide sequencing of a number of independent subclones from each band revealed additional complexity; there were four different molecular species in band V and two in band III. The differences between these various sequences were all found at the 3′-end of exon IB and/or the 5′-end of IC, consistent with previous RT–PCR analyses (above). As shown in Figure 7B, a cryptic splice acceptor 3 bases upstream of the previously reported site 5′ of exon IC created two RNA products that differed by the presence or absence of an additional CAG triplet. Similarly, a cryptic splice donor site 18 bp upstream of the 3′-end of exon IB was also used; this resulted in an exon that was 18 bp shorter at the 3′-end than that previously reported. Thus, alternative splicing at these novel sites accounted for the two molecular species that were present in band III and the four in band V, as well as the shorter products seen in previous RT–PCR reactions (Fig. 6B). Other aspects of the sequences were consistent with the known structure of human α1AT genomic and cDNA (Fig. 7B).
Analysis of bands II and IV indicated that they were heteroduplexes between I and III and I and V, respectively. First, analysis of RT–PCR products on denaturing gels produced only three bands, I, III and V. Second, subcloning of highly purified bands II and IV yielded only bands I and III or I and V, respectively. Third, PCR reamplification of highly purified fragments II and IV yielded only fragments I and III and I and V, respectively, when approximately 10 cycles of amplification were employed. Bands II and IV began to accumulate in these mixtures after more than 20 cycles of amplification. These data indicate that bands II and IV do not represent unique cDNA species; rather, they are merely heteroduplexes between bands I and III and I and V, respectively. Thus, macrophage microcell hybrids containing human chromosome 14 expressed three different human α1AT mRNAs with the following general structures at their 5′-ends: IA–II…, IA–IB–II… and IA–IB–IC–II…. The IA–II mRNA was a discrete molecular species, but the IA–IB–II and IA–IB–IC–II isoforms were heterogeneous owing to alternative splice site selection at the end of exon IB and/or the beginning of exon IC. All of these RNAs were transcribed from the human macrophage-specific promoter.
Long range chromatin reorganization accompanies gene activation in macrophage microcell hybrids
We previously showed that there are 29 DHSs in the ~130 kb α1AT–ATR–CBG region in human hepatoma cells that express α1AT and CBG, but only seven DHSs in non-expressing cells. Furthermore, transfer of human chromosome 14 from non-expressing fibroblasts to expressing hepatoma cells resulted in activation of both α1AT and CBG gene expression and chromatin reorganization of the entire region (30), events that required HNF-1α and HNF-4 (40). To determine whether chromatin reorganization accompanied α1AT activation mediated by the macrophage-specific promoter, we mapped DHSs in human macrophage-like cell lines and macrophage microcell hybrids.
Nuclei from the human ML-1 cells grown in medium containing TPA for 48 h and from the MH(14n)6 macrophage microcell hybrid were isolated and treated with increasing concentrations of DNase I and DNA was purified, digested with appropriate restriction enzymes and analyzed by Southern hybridization as described (30,40). An example of this analysis is shown in Figure 8A, where the region at and ~5 kb upstream of the macrophage promoter of α1AT was analyzed. Both the human (ML-1) and hybrid cells [MH(14n)6] exhibited three strong DHSs at positions ~–4.1 kb, –2.2 kb and ~–0.15 kb. The DHSs at –4.1 and –2.2 kb were expression-associated, being present in both macrophages (Fig. 8A, left and center) and hepatic cells (30,40), but they were not found in non-expressing cells (Fig. 8A, right). The DHS at –0.15 kb was found in all cells examined (Fig. 8A; 30,40).
Figure 8.

DHS mapping in the α1AT–ATR–CBG region. Nuclei from the human macrophage-like cell line ML-1 grown in the presence of TPA for 48 h, a mouse macrophage microcell hybrid [MH(14n)6], a rat hepatoma microcell hybrid [F(14n)2] and a rat fibroblast microcell hybrid [R(14n)6], each of which contained human chromosome 14, were treated with increasing concentrations of DNase I, DNA was purified, digested with BglII and analyzed by Southern hybridization, using a 0.75 kb EcoRI–BamHI fragment from map position ~0.4 kb (A) or an ~1.6 kb EcoRI–BglII fragment from position ~101 kb (B). The diagrams below the blots indicate the positions of relevant restriction sites, DHSs and probes, using as coordinate 0 an EcoRI site in exon IA of α1AT. The faint band at ~11 kb in (B) is a residual signal from a previous hybridization of the filter. Size markers (in kb) are indicated, as are the positions of sub-bands generated by cleavage of the parental genomic fragments at specific DHSs. Open arrowheads indicate constitutive DHSs, while expression-associated DHSs are marked with filled arrowheads.
Another example of DHS mapping is shown in Figure 8B, where a region ~10–14 kb downstream of CBG was analyzed. In this case, the F(14n)2 rat hepatoma microcell hybrid showed a strong site at ~+98.7 kb. This DHS was expression-associated in hepatic versus non-hepatic cells (30,40). Consistent with this, no DHS was observed at +98.7 kb in either human or hybrid macrophage cell lines [Fig. 7B, ML-1 and MH(14n)6]. These data indicate that activation of α1AT in macrophage microcell hybrids was accompanied by macrophage-specific chromatin remodeling.
DHS mapping experiments were performed throughout the α1AT–CBG interval; the results are summarized in Figure 9. Human macrophage-like cells and mouse macrophage hybrids had very similar distributions of DHSs, differing by only two DHSs at ~+1.85 kb and ~+37.5 kb. This distribution of DHSs was macrophage-specific: it was distinctly different from those of both hepatic cells and non-expressing cells. Macrophage cells contained all seven constitutive DHSs mapped previously. In addition, ML-1 cells displayed 13 expression-associated DHSs, two of which (positions ~+55.1 and ~+61.5 kb) were macrophage specific, not being present in hepatic cells. Interestingly, one of these sites was within a matrix attachment region (MAR) (52), the only DHS in the entire region to be so located. Importantly, the distribution of DHSs around the α1AT gene (from ~–30 to +35 kb, Fig. 9) in macrophages was similar to hepatic cells, with six of 10 expression-associated sites in common. In contrast, only two of eight expression-associated DHSs in the CBG region (+45 to +105 kb, Fig. 9) were found in macrophages. Thus, the chromatin organization of the α1AT gene region in macrophages resembles that of expressing cells, but the region around CBG is more similar to that of non-expressing cells. This raises the intriguing possibility that the chromatin configurations of the two regions might be regulated independently. Finally, the reorganization of a previously inactive human serpin allele in macrophage microcell hybrids to a macrophage-specific chromatin state provides further evidence that differentiated mammalian cells contain all of the regulatory factors required for both the establishment and maintenance of cell-specific patterns of gene activity and chromatin structure. As such, both hepatoma and macrophage microcell hybrids should be useful tools for investigating these cell-specific regulatory mechanisms.
Figure 9.

Long range DHS map of various α1AT–ATR–CBG alleles. The map is drawn to scale, with position 0 being an EcoRI site in exon IA of α1AT. Exons are indicated as black boxes and arrows show the transcriptional orientations of the genes. MARs are shown as stippled boxes. DHSs are depicted above the map as vertical arrows. Long arrows indicate strong DHSs and short arrows weaker sites. The presence or absence of specific DHSs in various serpin alleles [HepG2, expressing human hepatoma allele; HeLa S3, non-expressing human allele; ML-1, human macrophage allele; F(14n)2, activated allele in rat hepatoma cells; R(14n)6, extinguished allele in rat fibroblasts; MH(14n)6, activated allele in mouse macrophage cells] is indicated above the map by + or – signs. For human macrophage-like ML-1, cells were incubated with TPA for 48 h prior to the preparation of nuclei. A small + indicates a DHS weaker than that of the expressed HepG2 allele.
DISCUSSION
The human serpin gene cluster at 14q32.1 provides an attractive model system to study relationships between gene activity and chromatin structure. Serpins are an ancient gene family whose various members have evolved to perform a wide variety of functions in vivo (53). As such, many serpin genes are specifically expressed in different cell types. For example, all five protein-coding serpin genes in the 14q32.1 cluster are highly expressed in liver cells, but they are transcriptionally inactive in most cell types. However, α1AT is also expressed in monocytes/macrophages and intestinal cells (1,6). Transcriptional mechanisms that regulate α1AT expression have been studied extensively and it is well established that two liver-enriched transactivators, HNF-1α and HNF-4, play major roles in activating α1AT transcription in hepatic (32–38) and intestinal (39) cells. We recently demonstrated that these transactivators also regulate CBG expression in liver cells (40).
Transcription of α1AT in human monocytes/macrophages is initiated at a macrophage-specific promoter that is located ~2 kb upstream of the well-characterized liver promoter. These studies suggest that there are two, perhaps three, transcription initiation sites in macrophages, as well as alternatively spliced transcripts (7,31). However, all of the α1AT transcripts of both macrophages and liver cells encode the same α1AT protein, as the ATG translation start site is located in exon II, which is present in all the transcripts (54). As an acute phase reactant, α1AT expression is modulated by humoral agents in both hepatocytes and monocytes, particularly by IL-6 (55–57). α1AT synthesis in monocytes is also modulated by bacterial lipopolysaccharide (58). Monocyte/macrophage cells appear to use the upstream promoter for both basal and modulated expression, whereas liver and intestinal cells primarily use the downstream promoter, although the macrophage promoter can be used during IL-6 modulated expression (7).
The chromatin structure of the α1AT–ATR–CBG region, as assessed by generalized sensitivity to DNase I and by distribution of DHSs, is correlated with gene activity in hepatic versus non-hepatic cells (30,40). Furthermore, transfer of human chromosome 14 from non-expressing cells to expressing cells resulted in the activation of α1AT and CBG transcription and chromatin reorganization of the entire >100 kb region (30). Both gene activation and chromatin remodeling in hepatic cells were dependent on HNF-1α and/or HNF-4 (40).
The existence of two distinct, cell-specific promoters in the human α1AT gene suggests that human monocytes and macrophages use different cis-acting elements and trans-acting factors to regulate α1AT transcription than those that activate gene expression from the liver promoter. The specific nuclear factors that activate the human monocyte/macrophage promoter have not yet been defined, but they are clearly distinct from HNF-1α and HNF-4, which are not expressed in macrophages. In mice, the number of expressed α1AT genes varies from one to five among different Mus species (59,60). Furthermore, it was recently demonstrated that mouse macrophages do not express α1AT because none of the murine α1AT genes contains a functional macrophage promoter. This led to the conclusion that mice with mutant α1AT alleles would not be a suitable model system for human α1AT deficiency syndromes (42). However, transgenic mouse strains containing human α1AT transgenes do seem to express transgene sequences in macrophages (9,10,13), suggesting that this heterologous system might be useful for studies of macrophage-specific expression of human α1AT.
To explore this issue, we studied human α1AT expression in human ‘macrophage-like’ cell lines and in macrophage microcell hybrids. The four human lines we tested could all be induced to differentiate into ‘macrophage-like’ cells upon addition of TPA and α1AT mRNA expression was activated in each cell line. We mapped DHSs in the ~130 kb region around α1AT and CBG in TPA-induced ML-1 cells and found a distribution of DHSs that was distinct from that of both hepatic cells and non-expressing cells. In particular, the DHS map of the human macrophage allele revealed many expression-associated DHSs around α1AT, which was expressed, but few around CBG, which was not. Expression-associated DHSs in the α1AT promoter and 5′-flanking region were also detected in the three other human ‘macrophage-like’ cell lines, demonstrating the existence of a macrophage-specific chromatin configuration in all four lines (data not shown).
To determine whether human α1AT expression could be activated in murine macrophages, we transferred human chromosome 14 from fibroblasts to MH-S cells, an SV40-transformed mouse macrophage cell line. These microcell hybrids activated expression of the human α1AT gene, but human CBG was not expressed. RT–PCR analyses demonstrated that most if not all of these human transcripts initiated within the upstream macrophage promoter. Interestingly, sequencing the amplified cDNA products revealed a number of alternatively spliced α1AT transcripts. Two of these mRNA isoforms had the following structures: IA–IB–IC–II–III–IV–V and IA–IC–II–III–IV–V (Fig. 7), as previously reported (7,31,61). However, additional transcripts were amplified from both human macrophage-like cells, hepatoma cells and microcell hybrids, but not from non-expressing cells. One predominant amplification product had the general structure IA–II–III–IV–V, an mRNA species whose existence had not been described previously. We also observed mRNA isoforms that were derived from alternative splice donor/acceptor site utilization at the exon IB and/or IC boundaries; these mRNAs had not been recognized previously. The possible roles of these different α1AT mRNA isoforms in regulating mRNA stability and/or translational efficiency (7) in different cell types remain to be established.
The distributions of DHSs in the >100 kb region around α1AT and CBG in human macrophage-like cells and macrophage microcell hybrids were similar, but they were distinctly different from those of both hepatic cells and non-expressing cells. In macrophages, the region around CBG resembled the structure of non-expressing cells and extinguished microcell hybrids, with few expression-associated DHSs. However, there were many expression-associated DHSs in and around the α1AT gene (e.g. positions ~–20.9, ~–12.8, ~–4.1, ~–2.2, ~+13.4 and ~+18 kb), most of which had been mapped previously in human hepatoma cells and hepatoma microcell hybrids (30,40). These DHSs may be involved in regulatory mechanisms that are common to both cell types, such as modulation by IL-6 and other humoral agents (55–57). As observed previously, the similar DHS maps of the human α1AT–ATR–CBG locus in human cells and in mouse or rat microcell hybrids suggests that the trans-acting factors responsible for DHS formation are conserved between humans and rodents (30).
Detailed comparisons of DHS maps of the various cell lines identified expression-associated DHSs that appeared liver-specific in both the α1AT (e.g. positions ~–18.9, ~–5.5, ~–3.4 and ~+51.9 kb, Fig. 9) and CBG gene regions (e.g. positions ~+68.9, ~+79.3 and ~+98.7 kb). Other sites found exclusively in human HepG2 hepatoma cells (positions –10, +42 and +60 kb) might be associated with regulatory regions necessary for high level α1AT expression in human hepatic cells. The seven constitutive DHSs described previously (30) were found in all cell types tested.
The ~40 kb region between ATR and CBG is an interesting intergenic interval that contains both constitutive and expression-associated DHSs. Two of these expression-associated DHSs appear to be macrophage specific. This interval also contains three MARs, each of which is composed predominantly of repetitive DNA (52). Targeted mutagenesis of this interval (62) should allow us to determine whether any of these elements play a role in regulating α1AT and/or CBG gene activity or in defining the chromatin domain structure of the locus.
The studies described in this report indicate that somatic cell hybrids provide a useful experimental system in which the expression of cell-specific genes can be altered in dramatic and reproducible ways. Together with recent studies of the α1AT–ATR–CBG locus in hepatoma cells and fibroblasts (30,40), the data presented here demonstrate that these changes in gene activity are correlated with long range chromatin remodeling of the affected loci to recipient cell-typical states. The mapping of chromatin features in this region provides a framework for the rational design of targeting constructs and for subsequent analysis of specific mutant serpin alleles generated by homologous recombination (62).
Acknowledgments
ACKNOWLEDGEMENTS
We thank Mark Marsden for help with the microcell fusions, Lianjun Xu for assistance with cloning and sequencing of RT–PCR products and Stephanie Namciu for critical comments on the manuscript. These studies were supported by grant GM26449 from the National Institute of General Medical Sciences. P.R. was supported by fellowships from the Swiss National Science Foundation, the Swiss League against Cancer and the Schweizerische Stiftung für Medizinisch-Biologische Stipendien.
REFERENCES
- 1.Perlmutter D.H., Cole,F.S., Kilbridge,P., Rossing,T.H. and Colten,H.R. (1985) Proc. Natl Acad. Sci. USA, 82, 795–799. [DOI] [PMC free article] [PubMed] [Google Scholar]
- 2.Crystal R.G. (1989) Trends Genet., 5, 411–417. [DOI] [PubMed] [Google Scholar]
- 3.Crystal R.G. (1990) J. Clin. Invest., 85, 1343–1352. [DOI] [PMC free article] [PubMed] [Google Scholar]
- 4.Povey S. (1990) Mol. Biol. Med., 7, 161–172. [PubMed] [Google Scholar]
- 5.Perlmutter D.H. (1998) Semin. Liver Dis., 18, 217–225. [DOI] [PubMed] [Google Scholar]
- 6.Perlmutter D.H., Daniels,J.D., Auerbach,H.S., De Schryver-Kecskemeti,K., Winter,H.S. and Alpers,D.H. (1989) J. Biol. Chem., 264, 9485–9490. [PubMed] [Google Scholar]
- 7.Hafeez W., Ciliberto,G. and Perlmutter,D.H. (1992) J. Clin. Invest., 89, 1214–1222. [DOI] [PMC free article] [PubMed] [Google Scholar]
- 8.Molmenti E.P., Perlmutter,D.H. and Rubin,D.C. (1993) J. Clin. Invest., 92, 2022–2034. [DOI] [PMC free article] [PubMed] [Google Scholar]
- 9.Kelsey G.D., Povey,S., Bygrave,A.E. and Lovell-Badge,R.H. (1987) Genes Dev., 1, 161–171. [DOI] [PubMed] [Google Scholar]
- 10.Ruther U., Tripodi,M., Cortese,R. and Wagner,E.F. (1987) Nucleic Acids Res., 15, 7519–7529. [DOI] [PMC free article] [PubMed] [Google Scholar]
- 11.Sifers R.N., Carlson,J.A., Clift,S.M., DeMayo,F.J., Bullock,D.W. and Woo,S.L. (1987) Nucleic Acids Res., 15, 1459–1475. [DOI] [PMC free article] [PubMed] [Google Scholar]
- 12.Carlson J.A., Rogers,B.B., Sifers,R.N., Hawkins,H.K., Finegold,M.J. and Woo,S.L. (1988) J. Clin. Invest., 82, 26–36. [DOI] [PMC free article] [PubMed] [Google Scholar]
- 13.Koopman P., Povey,S. and Lovell-Badge,R.H. (1989) Genes Dev., 3, 16–25. [DOI] [PubMed] [Google Scholar]
- 14.Rabin M., Watson,M., Kidd,V., Woo,S.L., Breg,W.R. and Ruddle,F.H. (1986) Somat. Cell Mol. Genet., 12, 209–214. [DOI] [PubMed] [Google Scholar]
- 15.Purrello M., Alhadeff,B., Whittington,E., Buckton,K.E., Daniel,A., Arnaud,P., Rocchi,M., Archidiacono,N., Filippi,G. and Siniscalco,M. (1987) Cytogenet. Cell Genet., 44, 32–40. [DOI] [PubMed] [Google Scholar]
- 16.Bao J.J., Reed-Fourquet,L., Sifers,R.N., Kidd,V.J. and Woo,S.L. (1988) Genomics, 2, 165–173. [DOI] [PubMed] [Google Scholar]
- 17.Hofker M.H., Nelen,M., Klasen,E.C., Nukiwa,T., Curiel,D., Crystal,R.G. and Frants,R.R. (1988) Biochem. Biophys. Res. Commun., 155, 634–642. [DOI] [PubMed] [Google Scholar]
- 18.Kelsey G.D., Parkar,M. and Povey,S. (1988) Ann. Hum. Genet., 52, 151–160. [DOI] [PubMed] [Google Scholar]
- 19.Rollini P. and Fournier,R.E.K. (1997) Genomics, 46, 409–415. [DOI] [PubMed] [Google Scholar]
- 20.Felsenfeld G. (1992) Nature, 355, 219–224. [DOI] [PubMed] [Google Scholar]
- 21.Brownell J.E. and Allis,C.D. (1996) Curr. Opin. Genet. Dev., 6, 176–184. [DOI] [PubMed] [Google Scholar]
- 22.Kingston R.E., Bunker,C.A. and Imbalzano,A.N. (1996) Genes Dev., 10, 905–920. [DOI] [PubMed] [Google Scholar]
- 23.Tsukiyama T. and Wu,C. (1997) Curr. Opin. Genet. Dev., 7, 182–191. [DOI] [PubMed] [Google Scholar]
- 24.Wolffe A.P., Wong,J. and Pruss,D. (1997) Genes Cells, 2, 291–302. [DOI] [PubMed] [Google Scholar]
- 25.Kadonaga J.T. (1998) Cell, 92, 307–313. [DOI] [PubMed] [Google Scholar]
- 26.Struhl K. (1998) Genes Dev., 12, 599–606. [DOI] [PubMed] [Google Scholar]
- 27.Rollini P. and Fournier,R.E.K. (1997) Mamm. Genome, 8, 913–916. [DOI] [PubMed] [Google Scholar]
- 28.Elgin S.C. (1988) J. Biol. Chem., 263, 19259–19262. [PubMed] [Google Scholar]
- 29.Gross D.S. and Garrard,W.T. (1988) Annu. Rev. Biochem., 57, 159–197. [DOI] [PubMed] [Google Scholar]
- 30.Rollini P. and Fournier,R.E.K. (1999) Genomics, 56, 22–30. [DOI] [PubMed] [Google Scholar]
- 31.Perlino E., Cortese,R. and Ciliberto,G. (1987) EMBO J., 6, 2767–2771. [DOI] [PMC free article] [PubMed] [Google Scholar]
- 32.Courtois G., Morgan,J.G., Campbell,L.A., Fourel,G. and Crabtree,G.R. (1987) Science, 238, 688–692. [DOI] [PubMed] [Google Scholar]
- 33.De Simone V., Ciliberto,G., Hardon,E., Paonessa,G., Palla,F., Lundberg,L. and Cortese,R. (1987) EMBO J., 6, 2759–2766. [DOI] [PMC free article] [PubMed] [Google Scholar]
- 34.Li Y., Shen,R.F., Tsai,S.Y. and Woo,S.L. (1988) Mol. Cell. Biol., 8, 4362–4369. [DOI] [PMC free article] [PubMed] [Google Scholar]
- 35.Monaci P., Nicosia,A. and Cortese,R. (1988) EMBO J., 7, 2075–2087. [DOI] [PMC free article] [PubMed] [Google Scholar]
- 36.Costa R.H., Grayson,D.R. and Darnell,J.E.,Jr (1989) Mol. Cell. Biol., 9, 1415–1425. [DOI] [PMC free article] [PubMed] [Google Scholar]
- 37.Bulla G.A., DeSimone,V., Cortese,R. and Fournier,R.E.K. (1992) Genes Dev., 6, 316–327. [DOI] [PubMed] [Google Scholar]
- 38.Bulla G.A. and Fournier,R.E.K. (1994) Mol. Cell. Biol., 14, 7086–7094. [DOI] [PMC free article] [PubMed] [Google Scholar]
- 39.Hu C. and Perlmutter,D.H. (1999) Am. J. Physiol., 276, G1181–G1194. [Google Scholar]
- 40.Rollini P. and Fournier,R.E.K. (1999) Proc. Natl Acad. Sci. USA, 96, 10308–10313. [DOI] [PMC free article] [PubMed] [Google Scholar]
- 41.Dillon N. and Grosveld,F. (1994) Curr. Opin. Genet. Dev., 4, 260–264. [DOI] [PubMed] [Google Scholar]
- 42.Tardiff J. and Krauter,K.S. (1998) Nucleic Acids Res., 26, 3794–3799. [DOI] [PMC free article] [PubMed] [Google Scholar]
- 43.Herrmann R., Han,T., Barcos,M.P., Lok,M.S. and Henderson,E.S. (1980) Cancer, 46, 1383–1388. [DOI] [PubMed] [Google Scholar]
- 44.Porter M.B. and Fournier,R.E.K. (1996) Somat. Cell Mol. Genet., 22, 341–348. [DOI] [PubMed] [Google Scholar]
- 45.Lugo T.G., Handelin,B., Killary,A.M., Housman,D.E. and Fournier,R.E.K. (1987) Mol. Cell. Biol., 7, 2814–2820. [DOI] [PMC free article] [PubMed] [Google Scholar]
- 46.Shapero M.H., Langston,A.A. and Fournier,R.E.K. (1994) Somat. Cell Mol. Genet., 20, 215–231. [DOI] [PubMed] [Google Scholar]
- 47.Hammond G.L., Smith,C.L., Goping,I.S., Underhill,D.A., Harley,M.J., Reventos,J., Musto,N.A., Gunsalus,G.L. and Bardin,C.W. (1987) Proc. Natl Acad. Sci. USA, 84, 5153–5157. [DOI] [PMC free article] [PubMed] [Google Scholar]
- 48.Chandra T., Stackhouse,R., Kidd,V.J., Robson,K.J. and Woo,S.L. (1983) Biochemistry, 22, 5055–5061. [DOI] [PubMed] [Google Scholar]
- 49.Danielson P.E., Forss-Petter,S., Brow,M.A., Calavetta,L., Douglass,J., Milner,R.J. and Sutcliffe,J.G. (1988) DNA, 7, 261–267. [DOI] [PubMed] [Google Scholar]
- 50.Tso J.Y., Sun,X.H., Kao,T.H., Reece,K.S. and Wu,R. (1985) Nucleic Acids Res., 13, 2485–2502. [DOI] [PMC free article] [PubMed] [Google Scholar]
- 51.Hohn P.A., Popescu,N.C., Hanson,R.D., Salvesen,G. and Ley,T.J. (1989) J. Biol. Chem., 264, 13412–13419. [PubMed] [Google Scholar]
- 52.Rollini P., Namciu,S.J., Marsden,M.D. and Fournier,R.E.K. (1999) Nucleic Acids Res., 27, 3779–3791. [DOI] [PMC free article] [PubMed] [Google Scholar]
- 53.Potempa J., Korzus,E. and Travis,J. (1994) J. Biol. Chem., 269, 15957–15960. [PubMed] [Google Scholar]
- 54.Long G.L., Chandra,T., Woo,S.L., Davie,E.W. and Kurachi,K. (1984) Biochemistry, 23, 4828–4837. [DOI] [PubMed] [Google Scholar]
- 55.Gauldie J., Richards,C., Harnish,D., Lansdorp,P. and Baumann,H. (1987) Proc. Natl Acad. Sci. USA, 84, 7251–7255. [DOI] [PMC free article] [PubMed] [Google Scholar]
- 56.Castell J.V., Gomez-Lechon,M.J., David,M., Hirano,T., Kishimoto,T. and Heinrich,P.C. (1988) FEBS Lett., 232, 347–350. [DOI] [PubMed] [Google Scholar]
- 57.Perlmutter D.H., May,L.T. and Sehgal,P.B. (1989) J. Clin. Invest., 84, 138–144. [DOI] [PMC free article] [PubMed] [Google Scholar]
- 58.Barbey-Morel C., Pierce,J.A., Campbell,E.J. and Perlmutter,D.H. (1987) J. Exp. Med., 166, 1041–1054. [DOI] [PMC free article] [PubMed] [Google Scholar]
- 59.Borriello F. and Krauter,K.S. (1991) Proc. Natl Acad. Sci. USA, 88, 9417–9421. [DOI] [PMC free article] [PubMed] [Google Scholar]
- 60.Goodwin R.L., Baumann,H. and Berger,F.G. (1996) Mol. Biol. Evol., 13, 346–358. [DOI] [PubMed] [Google Scholar]
- 61.Kalsheker N. and Swanson,T. (1990) Biochem. Biophys. Res. Commun., 172, 1116–1121. [DOI] [PubMed] [Google Scholar]
- 62.Dieken E.S., Epner,E.M., Fiering,S., Fournier,R.E.K. and Groudine,M. (1996) Nature Genet., 12, 174–182. [DOI] [PubMed] [Google Scholar]