

Abstract
Objective:
This study assesses the psychometric properties of the four- and eight-item versions of the Patient-Reported Outcomes Measurement Information System (PROMIS) Pediatric Psychological Stress Measure (PPSM) for use with Latino immigrant adolescents.
Background:
Immigrant Latino youth are exposed to numerous stressors that can have consequences affecting health well into adulthood. However, few studies have assessed the suitability of psychosocial measures for this group.
Methods:
Participants included 286 first- and second-generation immigrant Latino youth in middle school in an urban school district in the United States. Analyses included tests for reliability, validity, item characteristics, and measurement invariance across differing levels of acculturation and gender groups.
Results:
Both the four- and the eight-item PPSM are internally consistent, have strong construct validity, and strict factorial invariance across differing levels of acculturation. The four-item PPSM demonstrates strict invariance, but the eight-item version shows only configural invariance by gender.
Conclusion:
The PPSM is a rigorous measure when assessing immigrant Latino youth stress level. The four-item PPSM is brief, simple to administer, and appropriate for use with Latino youth across differing levels of acculturation and gender groups.
Implications:
The four-item PPSM lessens respondent fatigue and may be incorporated into tools practitioners and researchers use to assess perceived stress among immigrant Latino youth.
Keywords: acculturation, immigrant, item response theory, Latino, measurement invariance, stress
Over the past several decades, culture has become an increasingly important consideration when examining the accuracy of psychosocial measures and assessments (Arafat et al., 2016). Assessing the psychometric properties of scales used with immigrant populations is particularly important because properties can vary by acculturation (e.g., Greenfield, 1997; Tan et al., 2020). Perceived stress as a determinant of health has a long history in the biological and psychological sciences, including studies on immigrant health (e.g., Araújo & Borrell, 2006; Kaestner et al., 2009; Vega & Rumbaut, 1991). Despite the rapid growth of Latino immigrants to the United States (Lopez et al., 2015), few studies have assessed the validity and reliability of instruments used to measure stress among Latino immigrant youth. To address this gap, we examined the performance of the Pediatric Psychological Stress Measure (PPSM) on a sample of Latino immigrant youth. Specifically, we assessed the PPSM for (a) factor structure and dimensionality, (b) item properties such as difficulty and discrimination, and (c) invariance across different gender groups and levels of acculturation
VALIDITY OF SELF-REPORT QUESTIONNAIRES
The validity of survey measures can be influenced by aspects of respondents’ culture, which includes regional deviations in language and dialect (Smith et al., 2005), differences in beliefs and values (Benitez et al., 2016), and how questions and response options are construed and understood (Davis et al., 2011). When culture is not properly assessed and accounted for, it can introduce systematic bias into research findings (Choi & Pak, 2005). Developing or adapting culturally appropriate measures for the U.S. Latino immigrant population is important, particularly because projections suggest that 88% of the U.S. population growth over the next 50 years will be attributed to immigrants and their offspring, the vast majority of whom will be of Latino descent (Lopez et al., 2015). Additionally, among Latino children in the United States, the majority (52%) have at least one parent who was born outside of the United States (Pew Research Center, 2015) and thus are considered either first-generation (born outside the United States to foreign nationals) or second-generation (born in the United States to at least one foreign born parent) immigrants. Despite the rapid growth of the U.S. Latino population, few rigorously tested instruments have been identified for use with this population (Kumpfer et al., 2015). The use of insufficiently tested instruments can affect scientific advances, including the development of effective prevention and treatment interventions (Knight et al., 2009; Schinke et al., 2016) needed to eliminate or reduce existing health disparities.
Culture is widely understood to create a context that influences perceptions and regulates behaviors. Importantly, immigrant youth who live between two cultures may be measurably different across a variety of areas compared with youth from their parents’ country of origin and to youth from the host culture (Berry & Sabatier, 2010). The merging of two cultures, or acculturation, has been defined as a sociocultural process in which members of one cultural group adopt the beliefs and behaviors of another group (e.g., Lopez-Class et al., 2011). Acculturation, however, is not synonymous with assimilation. Rather, individuals tend to adopt aspects of the host culture while maintaining aspects of their heritage culture, forming a bicultural identity (Phinney, 1993). This new cultural identity can influence family structure, process, and development (Santiago-Rivera et al., 2002), as well as how discriminatory and stigmatizing events are perceived (Viruell-Fuentes, 2007). Cervantes and colleagues (2013) found that the number of stressors reported and the cognitive appraisal of stress varied by generational status (a proxy for acculturation). Others have found that youth vary significantly by level of acculturation on numerous behaviors, such as alcohol and drug use, sexuality, suicide attempts (e.g., Peña et al., 2008; Potochnick & Perreira, 2010), mental health outcomes (Martinez, 2006), and physical health (Major & O’Brien, 2005). However, measures that have not been appropriately validated for a given cultural group can lead to inaccurate conclusions, which can in turn lead to potentially harmful interventions (Allden, et al., 2009; Wessels, 2009) and waste scarce resources.
PSYCHOLOGICAL STRESS, HEALTH, AND LATINO YOUTH
Traumatic experiences and chronic stress exposure increase risk of physical disease, mental disorders, and generally lower the quality and longevity of life (Campbell et al., 2016; Long et al., 2011; Wright, 2009). A rapidly expanding literature around adverse childhood experiences, or ACEs, links environmental stressors in childhood to later-life behavioral problems, disease, and morbidity (e.g., Barr et al., 1996; Campbell et al., 2016). Although some studies show the prevalence of ACEs in low-income Latino children is comparable to general rates among all U.S. children (Loria & Caughy, 2018), these studies typically use a version of the standard measure created by Feliti and Anda (1997) and do not assess for common stressors among Latino children such as fear of deportation, acculturative stress, and discrimination. This omission is critical because nearly 75% of immigrant Latino youth report living in constant fear of either being deported or having someone they know deported (Yoshikawa et al., 2017). Chronic fear is associated with psychological distress that, in turn, influences cognitive, social, and emotional well-being (Danese & McEwen, 2012) and can be particularly detrimental when coping mechanisms are inadequate (Flores et al., 2004). Individuals who fail to develop effective coping strategies against these and other stressors as children, may suffer from problems with immune system response (Cohen & Manuck, 1995; Danese & McEwen, 2012) and diminished psychological and behavioral health (McEwen, 2002) which can extend into adulthood (Bar-On et al., 2003).
Stress is generally defined as a cognitive appraisal of a situation in which external demands exceed the adaptive resources of the individual (Cohen et al, 1983; Lazarus, 2006). Early attempts aimed at understanding perceived stress and its relationship with mental and physical health resulted in the development of the Perceived Stress Scale (PSS) by Cohen et al. (1983). The PSS was designed to measure “the degree to which individuals appraise situations in their lives as stressful” (Cohen, 1986, p. 716) and is a widely used measure of psychosocial stress. The PSS consists of 14 items that are used to evaluate the degree to which people perceive life as unpredictable, uncontrollable, and overwhelming (Cohen, 1978). The PSS includes questions intended to evaluate current levels of stress by tapping into general beliefs about perceived stress and avoiding the attempt to provide a list of specific life events that risks missing important areas for the population of interest. As a result, scores are not biased by the content of events or by disparity in recall of past life experiences. Unfortunately, although the PSS is a valid instrument for use with adults, it has poor psychometric properties when applied with adolescents (Cohen et al., 1983; Cohen & Williamson, 1988).
PROMIS PPSM
The PPSM is an adaptation of the PSS for children and adolescents (Bevans et al., 2012) and is part of the Patient-Reported Outcome Measurement Information System (PROMIS). PROMIS was established in 2004 by the National Institutes of Health (NIH) to develop a standardized set of self-report measures of health and well-being for research and clinical practice (Cella et al., 2007). Like the PSS, the PPSM does not rely on domain specific items; instead, it includes items that tap cognitive-perceptual disruption and perceptions of controllability and manageability. Unlike the PSS, the PPSM uses developmentally appropriate language that is more sensitive to changes in children and adolescents’ perceived stress responses than are traditional adult measures (Bevans et al., 2012). Thus, PPSM is designed specifically for youth of different cultural, linguistic, and developmental background and consists of easy-to-understand items for children aged 8 to 17 (Bevans et al., 2010). Bevans and colleagues (2018) developed two short forms of the unidimensional PPSM, a four-item and an eight-item version based on item parameters (i.e., discrimination and difficulty) and the fact that the items represented key stress experiences. The psychometric properties of the short forms were evaluated with two samples of children between ages 8 and 17 with diverse ethnic and developmental backgrounds. Bevans and colleagues report that both the four- and 8-item versions of the PPSM are unidimensional, internally consistent, provide precise measurement across a wide range of stress severity levels, and are free from differential item functioning (DIF) by gender, age (8–12 vs. 13–17), race (White vs. non-White), and ethnicity (Hispanic vs. non-Hispanic). The present study extends the work of Bevans and colleagues (2018) by examining the psychometric properties of the eight- and four-item versions of the PPSM with a sample of immigrant Latino youth aged 12 to 15 years. The current study is the first to provide evidence that the PPSM is valid to use with Latino immigrant adolescents and asses its measurement invariance by the level of acculturation and gender.
METHODS
Participants and procedure
We investigated the psychometric properties of the four- and eight-item versions of the PPSM for use with immigrant Latino youth by analyzing survey responses from 286 (150 female) seventh- and eighth-grade immigrant Latino youth residing in a south-central U.S. state. The participants were part of a larger study that examined the long-term effects of ¡Unidos Se Puede!, a positive youth development intervention designed for Latino families (Cox, 2017). The majority of the youth participants (86%) received free or reduced lunch, 60% were second- generation and 40% first-generation, and 26% completed the survey in Spanish. All measures were administered using the online survey platform, Qualtrics (Qualtrics, Provo, UT). Approval for this study was obtained from the associated university’s Institutional Review Board.
Measures
Perceived stress
Participants completed the PPSM (Bevans et al., 2018) and rated each item along a 5-point Likert-type scale ranging from 0 (never) to 4 (always) such that higher scores indicate greater level of perceived stress. All eight items asked the participants about their psychological stress experience within the last week. The first four items correspond to the four-item PPSM of the full eight-item PPSM. Cronbach’s alpha is .90 for the four-item PPSM and .93 for the eight-item PPSM. The Spanish version of the scale was provided on the NIH Toolbox and verified for accuracy by staff on our research group (see Table 1 for a list of scale items).
TABLE 1.
Standardized factor loadings for eight-item and four-item scales from unidimensional CFAs
| Item | Factor loadings | SE | p value |
|---|---|---|---|
| I felt stressed. | .78/.79a | .03/.03 | <.001 |
| I felt that my problems kept piling up. | .85/.89 | .02/.02 | <.001 |
| I felt overwhelmed. | .84/.85 | .03/.03 | <.001 |
| I felt unable to manage things in my life. | .84/.80 | .02/.03 | <.001 |
| Everything bothered me (PPSM-8). | .75 | .03 | <.001 |
| I felt under pressure (PPSM-8). | .78 | .03 | <.001 |
| I had trouble concentrating (PPSM-8). | .73 | .03 | <.001 |
| I felt I had too much going on (PPSM-8). | .79 | .03 | <.001 |
| Confirmatory factor model fit | PPSM-8 | PPSM-4 | |
| χ2 (df) | 31.75* (20) | 1.52 (2) | — |
| CFI/FLI | .98/.98 | 1.00/1.00 | — |
| RMSEA | .05 | .00 | — |
| RMSEA 90% CI | 0.006–0.074 | 0.000–0.108 | |
| SRMR | .02 | .00 | — |
| AIC | 5,567.18 | 2,861.63 |
Note. AIC = Akaike information criterion; CFI = comparative fit index; CI = confidence interval; PPSM-8 = eight-item PPSM; PPSM-4 = four-item PPSM; PPSM = Pediatric Psychological Stress Measure; RMSEA = root mean square error of approximation; SRMR: standardized root mean square residual; TLI = Tucker-Lewis index.
In the factor loadings column of the table, the loadings of the PPSM-8 are listed before the slash sign and the loadings of the PPSM-4 are listed after the slash sign.
p < .05.
Anxiety
The Neuro-QoL Anxiety (Choi et al., 2010) was used to assess adolescents’ anxiety. The Neuro-QoL Anxiety consists of eight items and uses a 5-point Likert-type scale ranging from 0 (never) to 4 (always), such that higher scores indicating greater anxiety. Sample items of the scale include: “In the past 7 days, I worry about my health getting worse,” and “In the past 7 days, being worried made it hard for me to be with my friends.” The scale is internally consistent with a Cronbach alpha of .81.
Depression
The Neuro-QoL Depression (Choi et al., 2010) was utilized to measure adolescents’ depression level. Participants rated each of the eight items along a 5-point Likert-type scale ranging from 0 (never) to 4 (always), such that higher scores indicate more perceived depression. Sample items include: “In the past 7 days, I felt everything in my life went wrong,” and “In the past 7 days, it was hard for me to have fun.” The scale is internally consistent with a Cronbach’s alpha of .92.
Acculturation
Generational status was used as a proxy for acculturation, and was measured by a single binary item, “Were you born in United States?” Participants responding “Yes” (coded yes = 1) were categorized as second-generation individuals and participants responding “No” (coded no = 0) were categorized as first-generation individuals. Other studies have used generation status as a proxy for acculturation (Corral & Landrine, 2008; Pérez-Stable et al., 2001).
Analytic plan
First, we examined the factor structure using confirmatory factor analysis (CFA). Second, we examined the item properties from an item response theory (IRT) perspective (Lord & Novick, 1968). Because IRT is a model-based framework that presupposes an underlying latent trait that is dependent on both a person’s responses and the parameters of the items (Embretson & Reise, 2000), it allows simultaneous estimation of item parameters while also estimating participants’ trait levels in a manner that is distinct from a total score calculation used in classical test theory. Third, we tested measurement invariance (i.e., configural, weak factorial, strong factorial, and strict factorial) of the PPSM for different levels of acculturation and gender groups. Measurement invariance is necessary when making comparisons between groups as it reflects the extent to which a construct can be meaningfully discussed within each group and has a similar meaning across groups (Cheung & Rensvold, 2002). Although a variety of techniques have been used to assess measurement invariance (Hui & Triandis, 1985), there is general agreement that the multigroup confirmatory analysis model represents the most powerful and versatile approach to test measurement invariance (Jöreskog & Moustaki, 2001). Finally, we tested for associations of the PPSM with measures of anxiety and depression to determine construct validity. Mplus 8.4 was used to conduct all analyses (Muthén & Muthén, 2019). There were few missing data for any variable (<1%), and missing data were handled using full information maximum likelihood.
RESULTS
Preliminary item analyses
First, we examined the descriptive statistics such as mean, variance, frequency, skewness, and kurtosis of each of the eight items of the PPSM. The means of the items varied between .88 and 1.25 out of a possible range from 0 to 4. All eight items were highly skewed in the positive direction, with almost half of the participants endorsing the lowest possible response categories. Preliminary analyses indicated a violation of the assumption of multivariate normality, so we proceeded to use robust standard errors and Satorra-Bentler’s scaled χ2.
CFA model fitting
Both the four-item and the eight-item stress measures were fitted to a confirmatory factor model. The eight-item one-factor model had good fit with indices at or exceeding recommended cutoff points: comparative fit index (CFI) = .98, Tucker-Lewis index (TLI) = .98, root mean square error of approximation (RMSEA) = .04, and standardized root mean square residual (SRMR) = .02, with the exception of a marginally significant chi-squared value of 31.75 (p = .046). Moreover, as indicated by the standardized path coefficients, the relative strength of the factor loadings was all greater than the recommended .7 (Kline, 2015). The four-item, one-factor model had an excellent fit with all fit indices exceeding the recommended cutoff points (CFI = 1.00, TLI = 1.00, RMSEA = .00, SRMR = .00) and a statistically insignificant chi-squared value of 1.52 (p > .05). Factor loadings of the four-item measure were greater than .7. The excellent fit of the four-item model to the data was also supported by a lower Akaike information criterion compared with the eight-item measure (see Table 1).
IRT analyses
Item parameter estimates
To further investigate the properties of the eight- and four-item PPSM, we examined their slope (discrimination) and threshold parameters (difficulty) using a graded response model (Samejima, 1969, 1996). The discrimination parameter reflects the degree to which an item differentiates between adolescents with varying stress levels. Difficulty parameter reflects the level of stress experience at which there is an equal probability of endorsing two contiguous response categories (e.g., never and rarely). All slope parameters were significantly different from 0, suggesting that the items differentiate between participants who differ in the underlying level of perceived stress. The thresholds for difficulty are positive in all steps except the very first. The thresholds for all items gradually increased, indicating the absence of redundant response options. The standard errors for thresholds (b1 to b4) are small, ranging from .07 to .22. However, b3 and b4 have bigger standard errors compared with to b1 and b2, suggesting that participants did not use the full range of the Likert-type scale with upper levels not being well endorsed (see Table 2).
TABLE 2.
PROMIS PPSM item statistics
| Item descriptive statistics | IRT parametersa | ||||||||
|---|---|---|---|---|---|---|---|---|---|
| Item | M | SD | % Floor (never) | % Ceiling (always) | a | b1 | b2 | b3 | b4 |
| I felt stressed. | 1.25 | 1.16 | 33.45 | 4.18 | 2.69/2.77 | −.48/−.48 | .32/.33 | 1.16/1.17 | 2.06/2.03 |
| I felt that my problems kept piling up. | 1.11 | 1.20 | 42.51 | 4.53 | 3.72/4.86 | −.18/−.17 | .50/.50 | 1.12/1.10 | 1.84/1.75 |
| I felt overwhelmed. | .94 | 1.09 | 48.08 | 2.44 | 3.81/3.80 | −.03/−.02 | .56/.58 | 1.39/1.42 | 2.10/2.08 |
| I felt unable to manage things in my life. | .97 | 1.11 | 46.69 | 2.79 | 3.77/3.12 | −.06/−.06 | .54/.57 | 1.31/1.39 | 2.10/2.18 |
| Everything bothered me (PPSM-8). | .88 | 1.08 | 48.78 | 3.14 | 2.67 | −.01 | .82 | 1.47 | 2.23 |
| I felt under pressure (PPSM-8). | .93 | 1.11 | 49.83 | 2.79 | 3.01 | .01 | .58 | 1.37 | 2.24 |
| I had trouble concentrating (PPSM-8). | 1.22 | 1.15 | 32.40 | 4.18 | 2.17 | −.57 | .49 | 1.21 | 2.24 |
| I felt I had too much going on (PPSM-8). | 1.16 | 1.19 | 40.07 | 4.53 | 2.97 | −.25 | .39 | 1.15 | 1.97 |
Note. a = IRT discrimination parameter; b1–4 = IRT difficulty parameters; IRT = item response theory; PPSM = Pediatric Psychological Stress Measure; PPSM-8 = eight-item PPSM, PPSM-4 = four-item PPSM; PROMIS = Patient-Reported Outcomes Measurement Information System.
In the IRT parameters section of the table, the discrimination and difficulty coefficients of the PPSM-8 are listed before the slash sign and the ones of the PPSM-4 are listed after the slash sign.
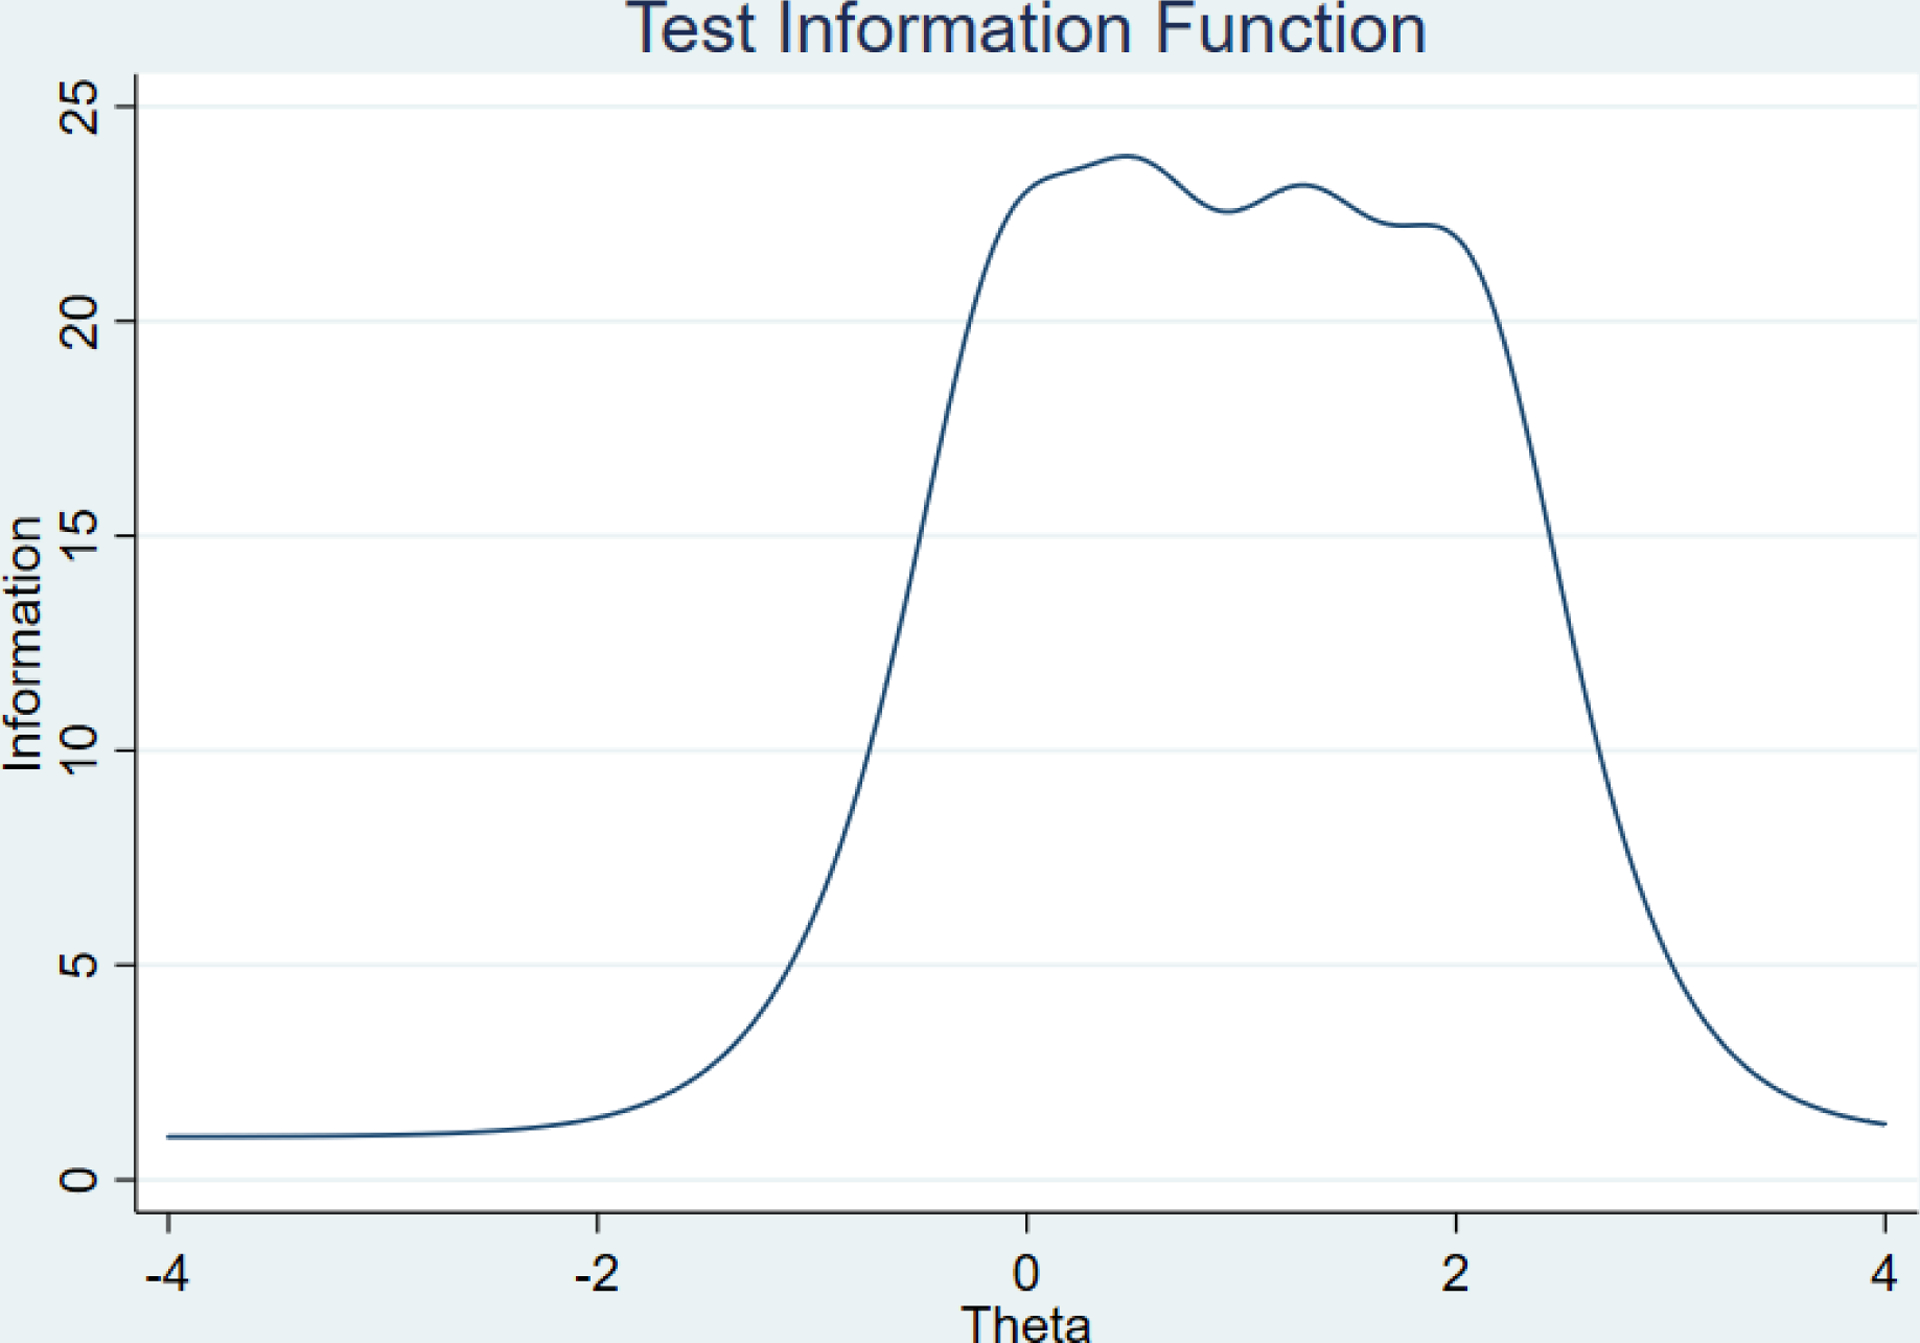
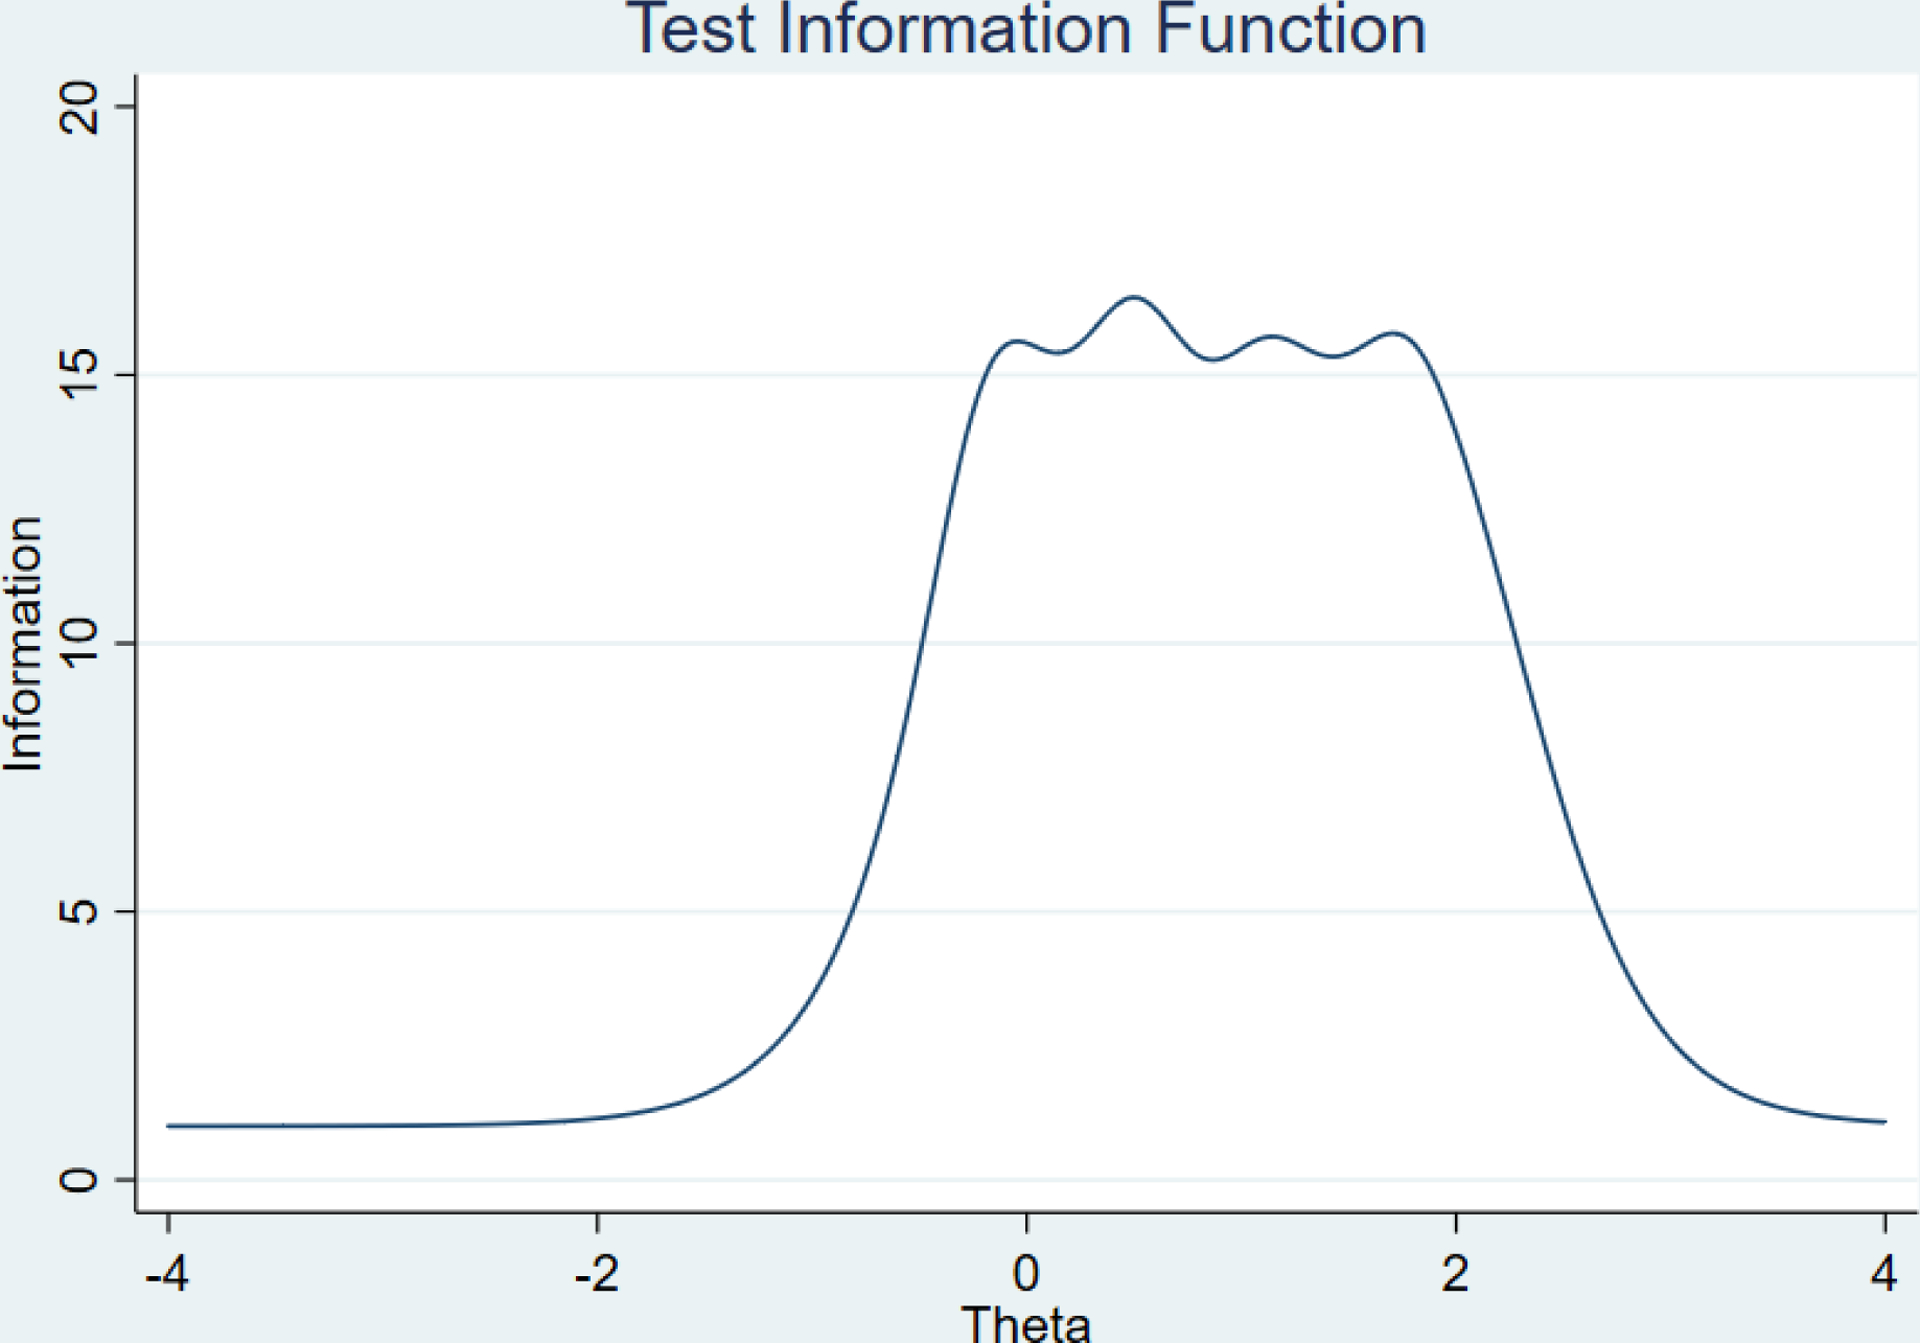
Item information function and test information
Fisher information functions for both the eight- and four-item PPSM are illustrated in the figures. Because an item’s information function is calculated as the inverse of its variance along the latent trait continuum, items with high information across a given length of the continuum provide particularly precise estimates of person parameters across that portion of the latent trait continuum (Baker, 2001). As Figures 1 and 2 indicate, Items 2, 3, and 4 provide the most information. Although both forms of the PROMIS PPSM cover the same range of information about stress, the test information functions suggest that eight-item PPSM has higher test information compared with the four-item PPSM (Figures 3 and 4). Finally, test information functions indicate that both forms of the measure are lacking information for those individuals with very high level of stress or very low level of stress.
FIGURE 1.

Item information curves for the eight-item Pediatric Psychological Stress Measure (PPSM). These indicate most items are particularly informative between 0 to 2 on the latent trait continuum.
FIGURE 2.
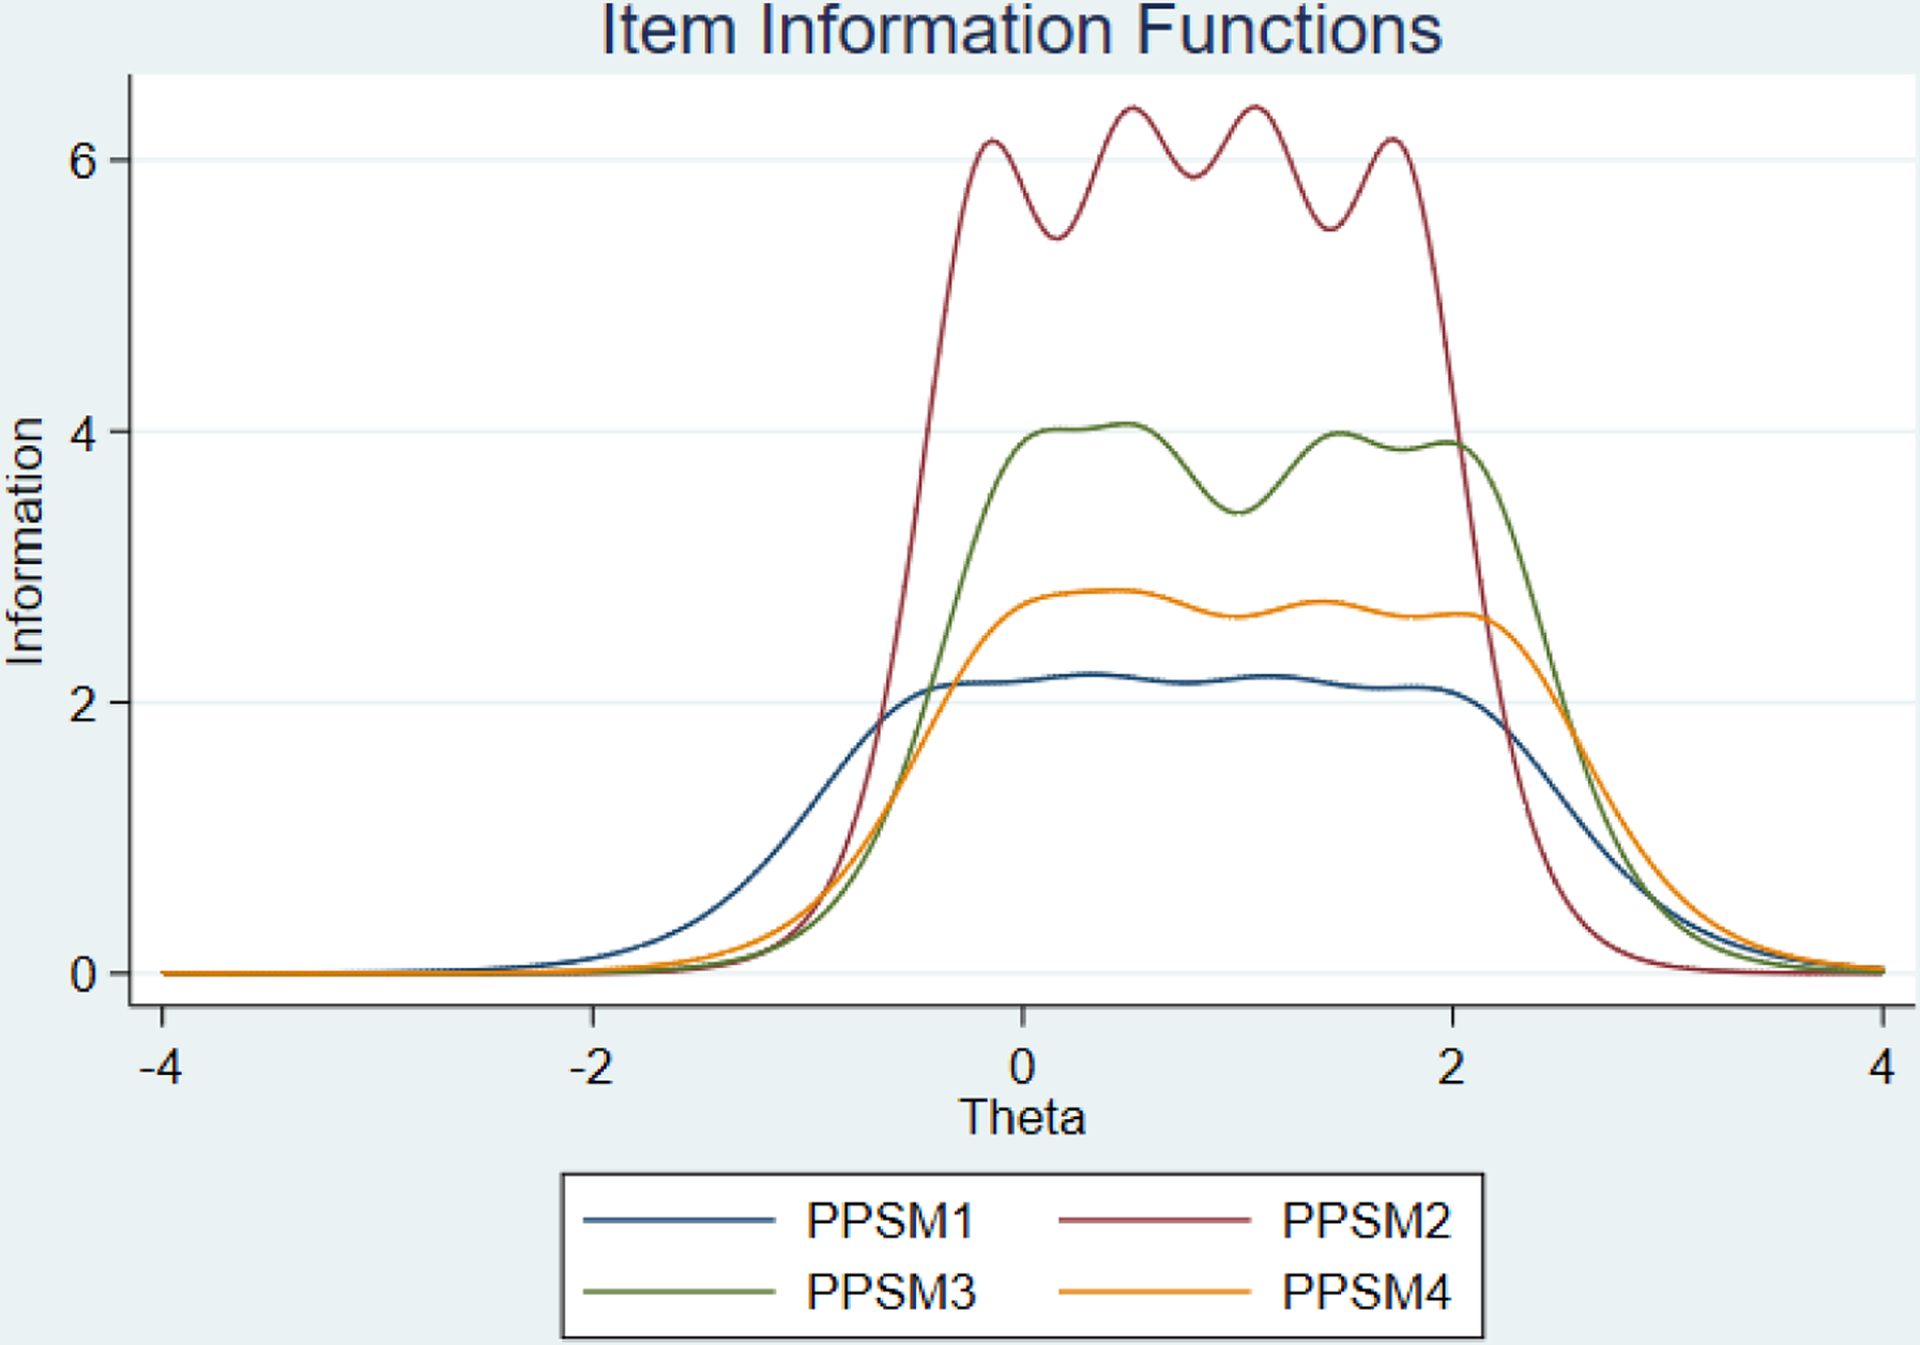
Item information curves for the four-item Pediatric Psychological Stress Measure (PPSM). Similar to eight-item PPSM, items are particularly informative between 0 to 2 on the latent trait continuum.
FIGURE 3.
Test information function for the four-item Pediatric Psychological Stress Measure (PPSM). Test information function is a measure of the amount of information provided by the item responses on the four-item PPSM.
FIGURE 4.
Test information function for the eight-item Pediatric Psychological Stress Measure (PPSM). Test information function is a measure of the amount of information provided by the item responses on the eight-item PPSM.
Measurement invariance
We tested for measurement invariance to examine whether the model holds across gender groups and levels of acculturation. In other words, we addressed the question of whether the same latent variable (psychological stress) is being measured across multiple groups within a confirmatory factor analysis framework. When evidence for measurement invariance is apparent, it ensures that the group comparisons are meaningful, the same construct is measured across groups, and group differences reflect true group differences. Measurement invariance is a hierarchical procedure of analysis in which we iteratively imposed an increasing number of equality constraints on three item parameters (i.e., item factor loadings, item intercepts, item residuals) and test whether the constrained model varies significantly from the previous less constrained model. A standard classification for the different levels of invariance are configural, weak factorial, strong factorial, and strict factorial. At a configural level of invariance, we freed all three of the aforementioned item parameters. At the level of weak factorial invariance, we constrained the item factor loadings to be the same across groups but allowed the item thresholds and item residuals to be freely estimated across groups. For strong factorial invariance, we constrained the item thresholds in addition to item factor loadings and freely estimated the item residuals. Finally, at the strict level of factorial invariance, we constrained all three of the item parameters to be equal across groups.
Tests of invariance by level of acculturation
For the eight-item PPSM, we found no significant differences in model fit after each level of constraint was imposed and thus concluded strict factorial invariance for the eight-item PPSM (see Table 3). We followed the same procedures for the four-item PPSM and similarly found strict factorial invariance. This suggests that comparisons between more acculturated versus less acculturated youth are appropriate using both the eight- and the four-item PPSM.
TABLE 3.
Tests of measurement invariance of the PPSM across acculturation levels
| Model | χ2 (df) | CFI/TLI | RMSEA | SRMR | p valuea |
|---|---|---|---|---|---|
| Eight-item PPSM | |||||
| Configural invariance | 51.01 (40) | .98/.98 | .04 | .03 | — |
| Weak factorial invariance | 59.99 (47) | .98/.98 | .04 | .04 | .25 |
| Strong factorial invariance | 70.98 (54) | .98/.98 | .05 | .04 | .09 |
| Strict factorial invariance | 77.85 (62) | .98/.98 | .04 | .05 | .50 |
| Four-item PPSM | |||||
| Configural invariance | 3.34 (4) | 1.00/1.00 | .00 | .01 | — |
| Weak factorial invariance | 7.48 (7) | .99/.99 | .02 | .03 | .18 |
| Strong factorial invariance | 10.65 (10) | .99/.99 | .02 | .03 | .37 |
| Strict factorial invariance | 12.65 (14) | 1.00/1.00 | .00 | .03 | .70 |
Note. First generation, n = 167; second generation, n = 106. CFI = comparative fit index; PPSM = Pediatric Psychological Stress Measure; RMSEA = root mean square error of approximation; SRMR: standardized root mean square residual; TLI = Tucker–Lewis index.
χ2 test.
Tests of invariance by gender
Although we found configural invariance for the eight-item PPSM, constraining the factor loadings to be equal across males and females significantly worsened model fit. This suggests that eight-item version of the PPSM is limited to configural invariance by gender. That is, the number of factors and the pattern of factor-construct relationships are identical across different gender groups and can be used with either males or females, but between gender comparisons of stress may not be appropriate. In contrast to the eight-item PPSM, strict factorial invariance was attained for the four-item PPSM across gender groups. This indicates that using the four-item PPSM allows for comparisons of factor variances, covariances, means, and residuals across male and female participants (Table 4). The unexpected jump from configural invariance of the eight-item PPSM to strict factorial invariance of the four-item PPSM across gender groups may be due to one or more items that function differently for males compared with females in our sample.
TABLE 4.
Tests of Measurement Invariance of the PPSM across Gender Groups
| Model | χ2 (df) | CFI/TLI | RMSEA | SRMR | p valuea |
|---|---|---|---|---|---|
| Eight-item PPSM | |||||
| Configural invariance | 69.11* (40) | .97/.96 | .07 | .03 | — |
| Weak factorial invariance | 85.30* (47) | .96/.96 | .07 | .06 | .01 |
| Strong factorial invariance | 97.53* (54) | .96/.96 | .07 | .05 | — |
| Strict factorial invariance | 106.65* (62) | .96/.96 | .07 | .06 | — |
| Four-item PPSM | |||||
| Configural invariance | 11.16* (4) | .98/.95 | .11 | .02 | — |
| Weak factorial invariance | 15.06* (7) | .98/.96 | .09 | .04 | .30 |
| Strong factorial invariance | 20.04* (10) | .98/.97 | .08 | .04 | .22 |
| Strict factorial invariance | 27.20* (14) | .97/.97 | .08 | .05 | .12 |
Note. CFI = comparative fit index; PPSM = Pediatric Psychological Stress Measure; RMSEA = root mean square error of approximation; SRMR: standardized root mean square residual; TLI = Tucker-Lewis index.
χ2 test.
p < .05;
male, n = 133; female, n = 150.
Construct validity
Following Bevans and colleagues (2018), we examined construct concurrent validity by assessing for associations between the PPSM and measures of anxiety and depression. Analyses showed significant correlations for the four- and eight-item PPSM and depression (r = .75, p < .01; r = .72, p < .01, respectively) and with anxiety (r = .57, p < .01; r = .55, p < .01, respectively).
DISCUSSION
The aim of the current study, which has not been addressed in other studies to our knowledge, was to validate the two short forms of the PPSM for use with immigrant Latino youth. Using four tests (confirmatory factor analyses, IRT, tests of measurement invariance, and construct validity), we concluded that the eight- and four-item PPSM scales are valid for use with immigrant Latino youth across different levels of acculturation and gender groups, albeit with some important caveats for making comparisons by gender using the eight-item version.
We believe that the four-item PPSM is preferred for several reasons. First, the four-item PPSM had a slightly better overall fit to the data compared with the eight-item PPSM. Second, IRT analyses suggested that while all eight items discriminate between participants on their underlying levels of perceived stress, there was considerable redundancy with Items 5 through 8. That is, the available information is mostly captured by Items 1 through 4, and Items 5 through 8 add little additional information. The test information functions suggested that although both forms of the PPSM covered a range of information about stress, information is lacking for individuals with the lowest and highest levels of perceived stress. Third, tests of measurement invariance indicated that the four-item version of the scale exhibited strict factorial invariance across differing levels of acculturation and across gender groups while the eight-item PPSM exhibited only configural invariance across gender groups. The strict factorial invariance of the four-item PPSM indicated that participants of different acculturation levels and genders endorsed the items similarly. In other words, the four-item PPSM could be used to compare Latino youth from differing levels of acculturation and from different gender groups to each other and that these measurements could be meaningfully understood. Fourth, although both forms of the PPSM showed strong construct validity, the four-item PPSM had slightly higher correlations with anxiety and depression, two public health concerns associated with increased risk for substance use (Glantz, 2002) and suicide (Harwood et al., 2001). Fifth, the four-item PPSM is shorter and more parsimonious.
Notwithstanding the slightly superior psychometric qualities of the four-item version relative to the eight-item version of the PPSM, the eight-item version provides slightly more information. This may be an important consideration in predictive analyses that assess the association of stress with other variables and mean comparisons of stress between genders is not the objective of the study. In sum, our findings support the use of either version of the PPSM with caution being exercised when using the eight-item PPSM to make gender comparisons among Latino immigrant youth.
Limitations
The apparent advantages of the PPSM for use with immigrant Latino youth should be understood in light of several limitations. First, Latinos are a heterogeneous population. Our study was conducted using a sample of youth of primarily Mexican heritage residing in a south-central state and may not generalize to all Latino populations across the United States. Second, this study used generational status as a proxy for acculturation and used a sample consisting of first- and second-generation individuals only. Results may look somewhat different for further generations or when a more comprehensive approach to measuring acculturation is used.
Future research
Psychological stress is a mental health construct. Hence, studies tracking patterns of interindividual variability and intraindividual change using longitudinal methods may be an informative line of research particularly in the context of a wider range of outcome variables that map onto other mental and behavioral health constructs, such as cognitive functioning, aggression, and coping. Additionally, longitudinal data may be useful to assess the stress measures’ predictive validity and responsiveness to change. Such data could be used to test the hypothesis that stress experiences reflect early signs of more severe health issues.
Implications
Both short forms of the PPSM may be added to the toolbox of assessments practitioners and researchers may use with immigrant Latino youth as they allow meaningful comparisons of psychological stress between more and less acculturated youth. Due to its strict factorial invariance, the four-item PPSM better informs questions about whether paths to and from stress are equal for males and females, while the eight-item version may provide slightly more information for use in analyses.
For the past 3 decades, immigration policies have become increasingly hostile using deportation to regulate immigration (De Genova, 2013). Fear of deportation and living with the negative stigma attached to being an immigrant can produce chronic stress that is implicated in many different physical, emotional, and behavioral health outcomes. Therefore, having a valid measure of stress is essential for family scientists to understand how the migration experience affects immigrant families, to design and evaluate culturally appropriate interventions to assist these families, and to help promote the reduction of health inequities in society. Because science is only as good as its measures, the PPSM is an important tool that increases family scientists’ ability to draw accurate conclusions and promote the science around stress and coping strategies among Latino immigrant youth.
In conclusion, the PROMIS PPSM provides a robust assessment of youth stress level that can be used in research and practice setting with immigrant Latino youth. Unlike other measures, the four-item PPSM is brief, simple to administer, and is appropriate for use with Latino youth across differing levels of acculturation and gender groups.
Acknowledgments
The writing of this manuscript was supported by funding from the U.S. Department of Agriculture, National Institute of Food and Agriculture, Children Youth and Families at Risk Grants (2017-41520-26875 to R.C. and 2014-41520-22189 to K.G.), the National Institute on Drug Abuse Grant (R15DA049232 to R.C.), and the George Kaiser Family Foundation.
REFERENCES
- Allden K, Jones L, Weissbecker I, Wessells M, Bolton P, Betancourt TS, Hijazi Z, Galappatti A, Yamount R, Patel P, & Sumathipala A (2009). Mental health and psychosocial support in crisis and conflict: report of the Mental Health Working Group. Prehospital and Disaster Medicine, 24(Suppl. 2), 217–227. [DOI] [PubMed] [Google Scholar]
- Arafat SY, Chowdhury HR, Qusar MS, & Hafez MA (2016). Cross cultural adaptation & psychometric validation of research instruments: A methodological review. Journal of Behavioral Health, 5(3), 129–136. [Google Scholar]
- Araújo BY, & Borrell LN (2006). Understanding the link between discrimination, mental health outcomes, and life chances among Latinos. Hispanic Journal of Behavioral Sciences, 28(2), 245–266. [Google Scholar]
- Baker F (2001). The basics of item response theory. University of Maryland. [Google Scholar]
- Bar-On R, Tranel D, Denburg NL, & Bechara A (2003). Exploring the neurological substrate of emotional and social intelligence. Brain, 126(8), 1790–1800. [DOI] [PubMed] [Google Scholar]
- Barr RG, Boyce WT, & Zeltzer LK (1996). The stress-illness association in children: A perspective from the biobehavioral interface. In Haggerty RJ, Sherrold LR, Garmezy N, & Rutter M (Eds.), Stress, risk, and resilience in children and adolescents (pp. 182–224). Cambridge University Press. [Google Scholar]
- Benitez I, He J, Van de Vijver FJR, & Padilla JL (2016). Linking extreme response style to response processes: A cross-cultural mixed methods approach. International Journal of Psychology, 51(6), 464–473. [DOI] [PubMed] [Google Scholar]
- Berry JW, & Sabatier C (2010). Acculturation, discrimination, and adaptation among second generation immigrant youth in Montreal and Paris. International Journal of Intercultural Relations, 34(3), 191–207. [Google Scholar]
- Bevans KB, Gardner W, Pajer KA, Becker B, Carle A, Tucker CA, & Forrest CB (2018). Psychometric evaluation of the PROMIS® pediatric psychological and physical stress experiences measures. Journal of Pediatric Psychology, 43(6), 678–692. [DOI] [PMC free article] [PubMed] [Google Scholar]
- Bevans KB, Gardner W, Pajer K, Riley AW, & Forrest CB (2012). Qualitative development of the PROMIS® pediatric stress response item banks. Journal of Pediatric Psychology, 38(2), 173–191. [DOI] [PMC free article] [PubMed] [Google Scholar]
- Bevans KB, Moon J, Riley AW, & Forrest CB (2010). Conceptual and methodological advances in child reported outcomes measurement. Pharmacoeconomics and Outcomes Research, 10(4), 385–396. [DOI] [PMC free article] [PubMed] [Google Scholar]
- Campbell JA, Walker RJ, & Egede LE (2016). Associations between adverse childhood experiences, high-risk behaviors, and morbidity in adulthood. American Journal of Preventive Medicine, 50(3), 344–352. [DOI] [PMC free article] [PubMed] [Google Scholar]
- Cella D, Yount S, Rothrock N, Gershon R, Cook K, Reeve B, … PROMIS Cooperative Group. (2007). The Patient-Reported Outcomes Measurement Information System (PROMIS): Progress of an NIH Roadmap cooperative group during its first two years. Medical Care, 45(5, Suppl. 1), 3–11. [DOI] [PMC free article] [PubMed] [Google Scholar]
- Cervantes RC, Padilla AM, Napper LE, & Goldbach JT (2013). Acculturation-related stress and mental health outcomes among three generations of Hispanic adolescents. Hispanic Journal of Behavioral Sciences, 35(4), 451–468. [Google Scholar]
- Cheung GW, & Rensvold RB (2002). Evaluating goodness-of-fit indexes for testing measurement invariance. Structural Equation Modeling, 9(2), 233–255. [Google Scholar]
- Choi B, & Pak A (2005). A catalog of biases in questionnaires. Preventing Chronic Disease, 2, 1–13. [PMC free article] [PubMed] [Google Scholar]
- Choi SW, Reise SP, Pilkonis PA., Hays RD, & Cella D (2010). Efficiency of static and computer adaptive short forms compared to full-length measures of depressive symptoms. Quality of Life Research, 19(1), 125–136. [DOI] [PMC free article] [PubMed] [Google Scholar]
- Cohen S (1978). Environmental load and the allocation of attention. In Baum A, Singer JE, & Valins S (Eds.) Advances in environmental psychology (Vol. 1, pp. 1–29). Lawrence Erlbaum Associates. [Google Scholar]
- Cohen S (1986). Contrasting the Hassles Scale and the Perceived Stress Scale: Who is really measuring appraised stress? American Psychologist, 41(6), 716–718. [Google Scholar]
- Cohen S, Kamarck T, & Mermelstein R (1983). A global measure of perceived stress. Journal of Health and Social Behaviour, 24(4), 386–396. [PubMed] [Google Scholar]
- Cohen S, & Manuck SB (1995). Stress, reactivity, and disease. Psychosomatic Medicine, 57(5), 423–426. [DOI] [PubMed] [Google Scholar]
- Cohen S, & Williamson G (1988). Psychological stress in a probability sample of the United States. In Spacapan S & Oskamp S (Eds.), The social psychology of health: Claremont Symposium on Applied Social Psychology (pp. 31–67). Sage Publications. [Google Scholar]
- Corral I, & Landrine H (2008). Acculturation and ethnic-minority health behavior: A test of the operant model. Health Psychology, 27(6), 737–745. [DOI] [PubMed] [Google Scholar]
- Cox RB (2017). Promoting resilience with the Unidos Se Puede program: An example of translational research for Latino families. Family Relations, 66(4), 712–728. [Google Scholar]
- Danese A, & McEwen BS (2012). Adverse childhood experiences, allostasis, allostatic load, and age-related disease. Physiology & Behavior, 106(1), 29–39. [DOI] [PubMed] [Google Scholar]
- Davis RE, Resnicow K, & Couper MP (2011). Survey response styles, acculturation, and culture among a sample of Mexican American adults. Journal of Cross-Cultural Psychology, 42(7), 1219–1236. [DOI] [PMC free article] [PubMed] [Google Scholar]
- De Genova N (2013). Spectacles of migrant “illegality”: The scene of exclusion, the obscene of inclusion. Ethnic and Racial Studies, 36(7), 1180–1198. 10.1080/01419870.2013.783710 [DOI] [Google Scholar]
- Embretson SE, & Reise SP (2000). Item response theory for psychologists. Lawrence Erlbaum Associates. [Google Scholar]
- Felitti VJ, & Anda RF (1997). The Adverse Childhood Experiences (ACE) Study. Centers for Disease Control and Prevention. [Google Scholar]
- Flores E, Tschann JM, VanOss Marin B, & Pantoja P (2004). Marital conflict and acculturation among Mexican American husbands and wives. Cultural Diversity and Ethnic Minority Psychology, 10(1), 39–52. [DOI] [PubMed] [Google Scholar]
- Glantz MD (2002). Introduction to the special issue on the impact of childhood psychopathology interventions on subsequent substance abuse: Pieces of the puzzle. Journal of Consulting and Clinical Psychology, 70(6), 1203–1206. [PubMed] [Google Scholar]
- Greenfield PM (1997). You can’t take it with you: Why ability assessments don’t cross cultures. American Psychologist, 52(10), 1115–1124. [Google Scholar]
- Harwood D, Hawton K, Hope T, & Jacoby R (2001). Psychiatric disorder and personality factors associated with suicide in older people: A descriptive and case–control study. International Journal of Geriatric Psychiatry, 16(2), 155–165. [DOI] [PubMed] [Google Scholar]
- Hui CH, & Triandis HC (1985). Measurement in cross-cultural psychology: A review and comparison of strategies. Journal of Cross-Cultural Psychology, 16(2), 131–152. [Google Scholar]
- Jöreskog KG, & Moustaki I (2001). Factor analysis of ordinal variables: A comparison of three approaches. Multivariate Behavioral Research, 36(3), 347–387. [DOI] [PubMed] [Google Scholar]
- Kaestner R, Pearson JA, Keene D, & Geronimus AT (2009). Stress, allostatic load, and health of Mexican immigrants. Social Science Quarterly, 90(5), 1089–1111. [DOI] [PMC free article] [PubMed] [Google Scholar]
- Kline P (2015). A handbook of test construction (psychology revivals): Introduction to psychometric design. Routledge. [Google Scholar]
- Knight GP, Roosa MW, & Umaña-Taylor AJ (2009). Studying ethnic minority and economically disadvantaged populations: Methodological challenges and best practices. American Psychological Association. [Google Scholar]
- Kumpfer KL, Magalhães C, Xie J, & Kanse S (2015). Cultural and gender adaptations of evidence-based family interventions. In Van Ryzin MJ, Kumpfer KL, Fosco GM, & Greenberg MT (Eds.), Family-based prevention programs for children and adolescents: Theory, Research, and Large-scale Dissemination (pp. 256–282). Psychology Press. [Google Scholar]
- Lazarus RS (2006). Stress and emotion: A new synthesis. Springer. [Google Scholar]
- Long KA, Ewing LJ, Cohen S, Skoner D, Gentile D, Koehrsen J, Howe C, Thompson AL, Rosen RK, Ganley M, & Marsland AL (2011). Preliminary evidence for the feasibility of a stress management intervention for 7- to 12-year-olds with asthma. Journal of Asthma, 48(2), 162–170. [DOI] [PubMed] [Google Scholar]
- Lopez MH, Passel J, & Rohal M (2015). Modern immigration wave brings 59 million to US, driving population growth and change through 2065: Views of immigration’s impact on US society mixed. Pew Research Center. [Google Scholar]
- Lopez-Class M, Castro FG, & Ramirez AG (2011). Conceptions of acculturation: A review and statement of critical issues. Social Science & Medicine, 72(9), 1555–1562. [DOI] [PubMed] [Google Scholar]
- Lord FM, & Novick MR (1968). Statistical theories of mental test scores. Addison-Wesley. [Google Scholar]
- Loria H, & Caughy M (2018). Prevalence of adverse childhood experiences in low-income Latino immigrant and nonimmigrant children. The Journal of Pediatrics, 192, 209–215. [DOI] [PubMed] [Google Scholar]
- Major B, & O’Brien LT (2005). The social psychology of stigma. Annual Review Psychology, 56, 393–421. [DOI] [PubMed] [Google Scholar]
- Martinez CR Jr. (2006). Effects of differential family acculturation on Latino adolescent substance use. Family Relations, 55(3), 306–317. [Google Scholar]
- McEwen B (2002). The end of stress as we know it. Joseph Henry. [Google Scholar]
- Muthén LK, & Muthén BO (2019). Mplus 8.4 Muthén & Muthén. [Google Scholar]
- Peña JB, Wyman PA, Brown CH, Matthieu MM, Olivares TE, Hartel D, & Zayas LH (2008). Immigration generation status and its association with suicide attempts, substance use, and depressive symptoms among Latino adolescents in the USA. Prevention Science, 9(4), 299–310. [DOI] [PMC free article] [PubMed] [Google Scholar]
- Pérez-Stable EJ, Ramirez A, Villareal R, Talavera GA, Trapido E, Suarez L, Marti J, & McAlister A (2001). Cigarette smoking behavior among US Latino men and women from different countries of origin. American Journal of Public Health, 91(9), 1424–1430. [DOI] [PMC free article] [PubMed] [Google Scholar]
- Pew Research Center. (2015). Modern immigration wave brings 59 million to U.S., driving population growth and change through 2065. http://www.pewhispanic.org/files/2015/09/2015-09-28_modern-immigration-wave_REPORT.pdf.
- Phinney JS (1993). A three-stage model of ethnic identity development in adolescence. In Bernal ME & Knight GP (Eds.), Ethnic identity: Formation and transmission among Hispanic and other minorities (pp. 61–79). State University of New York–Albany. [Google Scholar]
- Potochnick SR, & Perreira KM (2010). Depression and anxiety among first-generation immigrant Latino youth: Key correlates and implications for future research. The Journal of Nervous and Mental Disease, 198(7), 470–477. [DOI] [PMC free article] [PubMed] [Google Scholar]
- Samejima F (1969). Estimation of latent ability using a pattern of graded scores (Psychometrika Monograph Supplement, No. 17). Psychometric Society. [Google Scholar]
- Samejima F (1996). The graded response model. In van der Linden WJ & Hambleton RK (Eds.), Handbook of modern item response theory (pp. 85–101). Springer. [Google Scholar]
- Santiago-Rivera AL, Arredondo P, & Gallardo-Cooper M (2002). Counseling Latinos and la familia. Sage Publications. [Google Scholar]
- Schinke S, Schwinn T, Hopkins J, & Wahlstrom L (2016). Drug abuse risk and protective factors among Hispanic adolescents. Preventive Medicine Reports, 3, 185–188. [DOI] [PMC free article] [PubMed] [Google Scholar]
- Smith TW, Mohler PP, Harkness J, & Onodera N (2005). Methods of assessing and calibrating response scales across countries and languages. Comparative Sociology, 4(3), 365–415. [Google Scholar]
- Tan YW, Burgess GH, & Green RJ (2020). The effects of acculturation on neuropsychological test performance: A systematic literature review. The Clinical Neuropsychologist, 35(3), 1–31. [DOI] [PubMed] [Google Scholar]
- Vega WA, & Rumbaut RG (1991). Ethnic minorities and mental health. Annual Review of Sociology, 17(1), 351–383. [Google Scholar]
- Viruell-Fuentes EA (2007). Beyond acculturation: immigration, discrimination, and health research among Mexicans in the United States. Social Science & Medicine, 65(7), 1524–1535. [DOI] [PubMed] [Google Scholar]
- Wessells MG (2009). Do no harm: Toward contextually appropriate psychosocial support in international emergencies. American Psychologist, 64(8), 842–854. [DOI] [PubMed] [Google Scholar]
- Wright RJ (2009). Stress and acquired glucocorticoid resistance: A relationship hanging in the balance. Journal of Allergy and Clinical Immunology, 123(4), 831–832. [DOI] [PMC free article] [PubMed] [Google Scholar]
- Yoshikawa H, Suárez-Orozco C, & Gonzales RG (2017). Unauthorized status and youth development in the United States: Consensus statement of the society for research on adolescence. Journal of Research on Adolescence, 27(1), 4–19. [DOI] [PubMed] [Google Scholar]