


Abstract
The goal of the present study is to identify genes that respond to iron availability. Suppression subtraction hybridization (SSH) was used to generate cDNA libraries from iron loaded and control human astrocytoma cells (SW1088). The cDNA libraries were screened with antisense cDNA probes obtained from mRNA isolated from astrocytoma cells exposed to three conditions: (i) normal media (control), (ii) deferoxamine treated (iron deficient) or (iii) iron loaded. The screening of the cDNA libraries with antisense probes from the three conditions enhanced the screening efficiency and decreased the number of false positives. Positive clones were identified and sequenced. The genes of interest were further analyzed by determining changes in hybridization signal on northern blots from astrocytoma cells exposed to iron or deferoxamine over different time intervals. Our analysis identified cDNAs corresponding to known iron responsive genes such as L-chain ferritin, but also revealed a number of mRNAs with novel sequences and mRNAs previously not known to be responsive to iron such as one of the ABC transporters and Thy-1 glycoprotein. Thus our results suggest that the expression of a number of genes may be influenced by changes in iron availability.
INTRODUCTION
Iron is an essential factor in many important cell functions, including growth, immunological response and energy production (1–3). Loss of cellular iron homeostasis is a significant event and can lead to cell death (4,5). Iron imbalance is a component of numerous diseases including Alzheimer’s Disease, Parkinson’s Disease and some cancers (6–10). Although post-transcriptional gene regulation by the interaction of cytoplasmic iron regulatory proteins (IRPs) and an iron responsive element (IRE) on select mRNAs is a very active research area (11–14), this mechanism is available only to a small number of genes that are directly associated with iron metabolism. There is relatively little data on whether or not gene transcription may be modified by changes in cellular iron status although suggestive evidence is mounting. For example, iron binding sites on DNA have been reported, suggesting iron availability may influence gene transcription (15–17). Furthermore, lactoferrin and ferritin, both iron transport proteins, can be found in cell nuclei (18,19), and lactoferrin binds to a specific DNA sequence (20). Our previous work found that a number of novel genes and known genes responded to iron chelation (21). Thus, we hypothesize that increases or decreases in iron availability can influence gene transcription. The results of this study may be helpful in understanding the physiological and pathological actions of iron and could provide clues that iron may play an extensive role in gene regulation. Here we report our results for identification of the mRNAs responding to changes in iron availability by using a model of astrocytoma cells and an improved method for screening differentially expressed genes.
MATERIALS AND METHODS
Cell culture
Human astrocytoma cells (SW1088 from ATCC) were cultured in 150 mm Petri dishes with 5% carbon dioxide at 37°C. The culture medium for the control group was Dulbecco’s Modified Eagle’s Medium supplemented with 10% fetal bovine serum, 4 mM sodium l-glutamine, 100 U/ml penicillin G and 100 U/ml streptomycin and 0.25 µg/ml amphotericin B. To examine effects of iron, astrocytoma cells were cultured in control media, control media plus 100 µg/ml of ferric ammonium citrate (Sigma, St Louis, MO) for 48 h, control media plus 50 µM deferoxamine mesylate (Sigma) for 6 h. Except for the addition of deferoxamine mesylate or ferric ammonium citrate to the culture media, all culture was treated identically.
Isolation of total RNA and poly(A)+ mRNA
RNeasy Midi Kit and Oligotex Midi mRNA Kit (Qiagen, Valencia, CA) were used for the isolation and purification of total RNA and poly(A)+ mRNA respectively from cultured human astrocytoma cells. The protocol was followed according to the manufacturer’s specifications. Approximately 4 × 10⁷ cells were used for total RNA isolation and 600 µg of total RNA was used for isolation of poly(A)+ mRNA.
Establishing cDNA libraries by suppression subtractive hybridization (SSH)
Poly(A)+ mRNA (1.5 µg) from control and iron-loaded astrocytoma cells was used to generate cDNA libraries by SSH as previously reported (21). Forward SSH (subtraction of control from iron-loaded) and backward SSH (subtraction of iron-loaded from control) were performed using PCR-Select cDNA Subtraction Kit (Clontech, Palo Alto, CA). PCR products from SSH were directly ligated into plasmid vector pGEM T-easy and transferred into JM109 competent cells (Promega, Madison, WI).
Screening of cDNA clones with antisense probes from three iron conditions
Radio-labeled (32P) single-strand cDNA probes were synthesized by reverse transcription of poly(A)+ mRNA from human astrocytoma cells treated with one of three conditions: normal culture media, 50 µM/l of deferoxamine mesylate for 6 h or 100 µg/ml of ferric ammonium citrate for 24 h. The poly(A)+ mRNA (0.1 µg) was first denatured for 5 min at 70°C and then placed on ice for 2 min. The following components (shown in final concentrations) were added to the denatured mRNA: 25 U of Ribonuclease Inhibitor (Promega), 50 mM Tris–HCl, pH 8.3, 75 mM KCl, 3 mM MgCl2, 10 mM DTT, 0.5 mM dNTP (without dCTP), 1 µM oligonucleotides dT16 primer, 100 µCi [α-32P]dCTP (3000 Ci/mmol; Amersham, Arlington Heights, IL) and 200 U MMLV reverse transcriptase (Promega) to a final volume of 25 µl. This mixture was incubated at 37°C for 1.5 h. STE SELECT-D, G-25 Spin Column (5 Primer→3 Primer, Boulder, CO) was used to remove unincorporated [32P]dCTP. The specific activity of the cDNA probes was >1 × 10⁹ c.p.m./µg DNA.
The clones with cDNA inserts from SSH were randomly chosen and cultured in 96-well culture plates and then used to amplify the cDNA. The PCR reaction was performed according to the protocol for PCR-Select cDNA Subtraction Kit (Clontech). A 10 µl aliquot of PCR reaction was denatured by adding equal amounts of 0.6 N sodium hydroxide at room temperature for 10 min. Subsequently, 4 µl of 1 M Tris–HCl (pH 7.2) and 30 µl of 0.2 N hydrocloride acid was added to neutralize the reaction. An aliquot of 8 µl of the denatured cDNA was applied to nitrocellulose membrane using a slot blot device. This process was repeated to make three identical copies of each blot.
The nitrocellulose membranes were incubated in a pre-hybridization solution consisting of 6× SSC, 5× Denharts, 0.1% SDS, 100 µg/ml sheared salmon DNA and 10 nM oligonucleotides dT30 at 68°C for 2 h. Subsequently, equal amounts of heat denatured 32P-labeled cDNA probes (~2 × 10⁷ c.p.m.) from each experimental condition and control were respectively added to the hybridization solution and the membranes were incubated at 68°C for ~36 h. Following incubation, the membranes were washed with 1× SSC, 0.1% SDS for 20 min, and then 0.2× SSC, 0.1% SDS three times (20 min each) at 68°C. The nitrocellulose membrane was then exposed to Kodak XAR film for 6, 12, 24 or 72 h. From the screening of the cDNA libraries with antisense cDNA probes, positive clones were chosen for sequencing and further analysis.
DNA sequencing and gene identification
The cDNA inserts of positive clones were amplified under the PCR conditions described above. The PCR products were applied to a 1.5% agarose gel and specific DNA bands were excised under UV light and purified by DNA gel extraction kit (Qiagen). These DNA samples were used as templates for PCR sequencing. Most of the cDNA inserts obtained from the positive clones were sequenced with gel purified PCR fragments. Some of the cDNA inserts were sequenced in plasmid with T7 and/or SP6 primers. All the sequencing was performed in the Core Facility Center of Hershey Medical Center using an automatic fluorescent DNA sequencer. The cDNA sequences were compared to GenBank by Advanced Blast 2.0 (http://www.ncbi.nlm.nih.gov/cgi-bin/BLAST/ ).
Northern blot analysis
Total RNA was obtained from control astrocytoma cells and astrocytoma cells from the following conditions: treatment with 50 µM deferoxamine mesylate for 1 or 6 h; treatment with 100 µg/ml of ferric ammonium citrate for 1, 6, 24 or 48 h.
Total RNA (20 µg) from each group was separated on 1.0% formaldehyde denatured agarose and transferred to nitrocellulose membrane. PCR-amplified cDNA insert (25 ng) was labeled with 50 µCi [32P]dCTP (3000 Ci/mmol; Amersham) by random primer labeling. Hybridization and washing conditions were the same as described above in screening of cDNA clones with antisense probes except without oligonucleotides dT30 in the prehybridization solution. For standardization of RNA loading, 28S rRNA was hybridized with an antisense RNA probe that was transcribed from an oligonucleotide containing a T7 RNA polymerase promoter (GCGAGCTCAGGGAGGA-CAGAAACCTCCCGTTATAGTGAGTCGTATTA).
RESULTS
After SSH, a total of 192 clones from each cDNA library were randomly chosen and screened by three antisense cDNA probes on slot blots. The type of results observed with this analysis and the benefits of this approach for determining positive clones are illustrated in Figure 1. After sequencing 36 positive clones, 28 species of mRNA were revealed when the library obtained from forward subtraction was probed. Probing of the backward substraction cDNA library (Fig. 2) resulted in 22 species of mRNA out of 37 positive clones.
Figure 1.

A schematic for the type of responses seen with reverse northern screening. Screening cDNA libraries with antisense cDNA probes obtained from three different conditions rather than the traditional two conditions improves screening efficiency and sensitivity. The types of outcomes obtained as a result of the reverse northern blot analysis are shown in this schematic. Lane 1, hybridization is performed with single-strand antisense probes from astrocytoma cells treated with deferoxamine mesylate at 50 µM for 6 h; lane 2, hybridization with antisense probes from control (standard media) astrocytoma cells; lane 3, hybridization with antisense probes from astrocytoma cells treated with ferric ammonium citrate at 100 µg/ml for 48 h. In A, B and C are examples of genes that would be chosen for further analysis as having increased expression following iron exposure. The genes have higher expression than control A and C or higher than iron in the presence of iron deprivation B. In D, E and F are examples of gene expression that would have been interpreted as a decreased response to iron. The genes in D and F are elevated in the presence of deferoxamine but in E the gene expression is the same as control but decreased in the iron exposed group. The genes represented in G, H and I are examples of other types of responses observed ranging from no response to iron status (I) or inconsistent response to iron status (G and H). The advantage of using three treatment conditions can clearly be seen in B, E, G and H. B and E would not have been chosen as a candidate of iron response and G and H would be the false iron responsive clones if the comparison was only performed between two conditions.
Figure 2.

Results from reverse northern blot analysis. The cDNAs obtained from SSH backward subtraction (iron loaded subtracted from control) SSH was applied to three nitrocellulose membranes. Each slot represents a different cDNA but the same cDNA is located in the same position in each blot (e.g. slot A1 contains the same cDNA in each blot). The blots were then probed with antisense cDNA obtained from astrocytoma cells cultured under normal conditions, iron depletion or iron loading. These blots show a typical hybridization pattern for the three conditions. Positive clones are then chosen for further analysis. The following are positive clones: A4, 7, 8, 9, 11; B2, 4, 5, 6, 8; C1, 2, 5, 10 and 11.
Of the 28 genes identified as increasing expression following iron treatment, 18 were further analyzed. A time-dependent increase in expression of these mRNAs to iron was seen using a northern blot analysis for 15 of the mRNAs. Three of the mRNAs did not show an increase over time with iron exposure. Of the 28 mRNAs that were identified on slot blots with antisense probes as being stimulated with iron exposure, six of them have novel sequences. Of these six novel genes, five showed increased expression on northern blot when the cells were exposed to iron. The genes that were identified as increasing mRNA levels upon iron exposure included the L-chain of ferritin. The amount of L-ferritin mRNA of this gene detected by northern blot analysis increased sharply after iron loading for 24 h but its expression level did not change from control in the presence of deferoxamine. Those mRNAs which were elevated following iron loading are reported in Table 1. Representative northern blot results from iron stimulated mRNAs are shown in Figure 3.
Table 1. cDNAs from screening of the forward subtraction (control subtracted from iron-loaded) cDNA library with three antisense probes.
| Gene name | Confirmed by northern blot |
|---|---|
| Novel mRNA species: iron stimulated gene (ISG) 1 (GenBank no.: AF188519) | Yes |
| Novel mRNA species: ISG2 (GenBank no.: AF188521) | Yes |
| Novel mRNA species: ISG3 (GenBank no.: AF188522) | Yes |
| Novel mRNA species: ISG4 (GenBank no.: AF188523) | Yes |
| Novel mRNA species: ISG5 (GenBank no.: AF188524) | Yes |
| Human glutathione peroxidase (GPX1) mRNA | Yes |
| Homo sapiens mRNA for ferritin L-chain | Yes |
| Human autoantigen calreticulin mRNA | Yes |
| Human saposin proteins A–D mRNA | Yes |
| Human cellular retino-binding protein mRNA | Yes |
| Human Sec61-complex beta-subunit mRNA | Yes |
| Human ribosomal protein S9 mRNA | Yes |
| Human P66shc (SHC) mRNA | Yes |
| Human mRNA for DNA-binding protein TAXREB107 | Yes |
| Human 78K glucose-regulated protein mRNA | Yes |
| Novel gene: ASM (gene from astrocytoma cell line) 3 (GenBank no.: AF188520) | No |
| Human GSA mRNA for alpha subunit of GsGTP binding protein | No |
| Human mRNA for LLREP3 | No |
Figure 3.

Northern analysis of genes whose transcription was stimulated by iron loading. The cDNAs that were chosen from sequencing were hybridized to total RNA isolated from astrocytoma cells exposed to iron or deferoxamine for different times and control. The following novel (see Table 1 for GenBank number) and known genes are examples of those considered positive responders to iron and are represented in the northern blot analysis shown in this figure: A, iron stimulated gene 1 (novel gene, 1.0 kb); B, iron stimulated gene 2 (novel gene, 0.3 kb); C, p66SHC protein; D, ribosomal protein S9; E, calreticulin; F, L-ferritin. G is 28S rRNA (used as total RNA loading control). Lane 1, deferoxamine treatment (6 h); lane 2, deferoxamine treatment (1 h); lane 3, normal culture media (control condition); lane 4, iron loading (1 h); lane 5, iron loading (6 h); lane 6, iron loading (24 h); lane 7, iron loading (48 h).
Table 2 is a list of mRNAs that were identified as being inhibited by iron loading. There were 22 species of mRNA that were identified by screening the backward subtracted cDNA library with antisense cDNA probes from the untreated astrocytoma cells, iron-loaded astrocytoma cells or astrocytoma cells exposed to deferoxamine. Of these mRNAs, five have novel sequences. The changes in the expression of all the novel mRNAs were confirmed by northern blot analysis using RNA from the astrocytoma cells exposed to deferoxamine or iron for various times. Of the 16 remaining known mRNAs, the decrease in expression following iron loading was confirmed in 12 of them with northern blot analysis. The decrease in expression could not be confirmed by northern blot analysis for two mRNAs and the remaining mRNAs were not examined on northern blots. Representative results from the northern analysis of iron inhibited mRNAs are shown in Figure 4.
Table 2. cDNA from screening of the backward subtraction (iron-loaded subtracted from control) cDNA library with three antisense probes.
| Gene name | Confirmed by northern blot |
|---|---|
| Novel gene: iron inhibited gene (IRIG) 1 (GenBank no.: AF188525) | Yes |
| Novel gene: IRIG2 (GenBank no.: AF188526) | Yes |
| Novel gene: IRIG3 (GenBank no.: AF188527) | Yes |
| Novel gene: IRIG4 (GenBank no.: AF188528) | Yes |
| Novel gene: IRIG5 (GenBank no.: AF188529) | Yes |
| Homo sapiens mRNA from ASM 2 | Yes |
| Homo sapiens mRNA for putative ABC transporter | Yes |
| Homo sapiens STE20-like kinase3 mRNA | Yes |
| Homo sapiens mRNA for stathmin | Yes |
| Human spliceosomal protein (SAP 62) gene | Yes |
| Human thymosin beta-4 mRNA | Yes |
| Homo sapiens clone 23942 alpha enolase mRNA | Yes |
| Homo sapiens SR protein family, pre-mRNA splicing factor (SRp20) mRNA | Yes |
| Homo sapiens clone 24408 2-oxoglutarate carrier protein mRNA | Yes |
| Human Thy-1 glycoprotein gene | Yes |
| Homo sapiens hnRNP JKTBP mRNA | Yes |
| Homo sapiens mRNA for KIAA0544 | Yes |
| Human mRNA for LLRep3 | No |
| Homo sapiens mRNA for Miz-1 protein | No |
Figure 4.
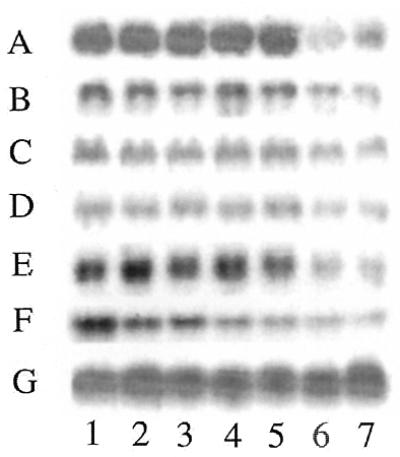
Northern analysis of cloned genes whose transcription was negatively regulated by iron availability. The cDNAs that were chosen from sequencing were hybridized to total RNA isolated from astrocytoma cells exposed to iron or deferoxamine for different times and control. The following novel and known genes are examples of those considered which decreased expression in response to iron and are represented in the northern blot analysis shown in this figure: A, iron inhibited gene 1 (novel gene, 1.0 kb); B, iron inhibited gene 2 (novel gene, 1.8 kb); C, ABC transporter; D, STE20-like kinase 3; E, pre-mRNA splicing factor (srp20); F, enolase alpha subunit; G, 28S rRNA (RNA loading control). Lane 1, deferoxamine treatment (6 h); lane 2, deferoxamine treatment (1 h); lane 3, normal culture media (control condition); lane 4, iron loading (1 h); lane 5, iron loading (6 h); lane 6, iron loading (24 h); lane 7, iron loading (48 h).
DISCUSSION
Our results revealed a number of both novel and known genes that responded to cellular iron availability. Although iron can influence the post-transcriptional regulation of genes associated with cellular iron management by the interaction of IRPs with mRNA containing IREs (11–14), our study indicates cellular iron status has a much broader influence on gene expression. The known mRNAs identified from the combination of forward subtraction of SSH and screening with antisense probes included the mRNA for L-ferritin whose function is directly related to iron metabolism and served as a positive control for our technical approach. Other genes directly associated with cellular iron management functions were not identified. Our selection process for choosing genes responding to cellular iron status for additional analysis was based on the amount of change in the mRNA. The initial screening was performed without knowledge of the mRNA sequence. Some mRNAs such as those for transferrin receptors and H-ferritin are known to respond more at the post-transcriptional level than the transcriptional level and thus likely did not change their level of expression sufficiently for us to have blindly selected them for analysis (22,23). The mRNAs encoding glutathione peroxidase, calreticulin, sec61-complex β subunit and 78K glucose-regulated protein whose functions are related to cellular stress also increased expression in the iron loaded group. The increase in amounts of mRNA for these proteins may indicate that iron loading is stressful to cells and the increase in these mRNAs is a part of a protective response. The increased expression of the mRNAs for prosaposin proteins A–D may also be related to their cell protective action to prevent cell damage or death induced by iron loading (24,25).
The amounts of mRNAs for p66 shc protein, cellular retino-binding protein and ribosomal protein S9, whose functions are not related to iron, based on current knowledge, also had different levels of expression relative to iron availability. The mRNA for ribosomal protein S9 had a higher level of expression than control and deferoxamine treated cells (Fig. 3D) and clearly is associated with increasing iron availability. The mRNA expression for p66 shc protein is not increased above control following iron loading but is higher than in the deferoxamine treated group (Fig. 3C). Thus, expression of this mRNA may only respond to low levels of iron and does not increase beyond the control level with iron loading. Deferoxamine is well-established as an iron chelator (26,27) and was developed from a natural iron binding sideramine (ferrioxamine B). The binding constant of deferoxamine for Fe+++ is appreciably higher (Fe+++:1031) than other metallic ions (102–1014). Therefore, we can believe the chelation of Fe+++ by deferoxamine is highly selective and the gene expression pattern changes are related to iron changes. But we cannot completely rule out some influence by other metals.
A surprising result was that iron exposure resulted in downregulation of genes encoding products involved in energy production such as α-enolase and 2-oxoglutarate carrier protein. Perhaps these genes are more important in the maintenance of cellular energy supply in low iron conditions. Alternatively perhaps, iron loading shifts cells from energy production to self-preservation. A decrease in energy production would decrease the oxygen consumption and minimize production of naturally occurring reactive oxygen species.
An increase in iron availability may also affect RNA transcription, editing and maturation because genes for spliceosomal protein (SAP 62), pre-mRNA splicing factor (SRp20) and hnRNP JKTBP had lower expression when cells were iron loaded. The relationship of iron loading to the decreased expression of genes for an ABC transporter, stathmin, thymosin beta-4 and Thy-1 glycoprotein is not immediately clear but very intriguing. For example, stathmin is a cytosolic phosphoprotein that is related to cell proliferation and differentiation and its expression is commonly increased with cell growth (28–30). Thy-1 mRNA was also decreased by iron-loading. Thy-1 is expressed on T-cells (31) and is highly expressed in brain (32). The function of Thy-1 in the brain is related to suppression of neuritic outgrowth. Iron loading thus may influence the proliferative capacity and neuritic outgrowth of cells. This observation is potentially significant for tumor cell growth and maturation of process bearing cells of the nervous system.
There are some technical advantages of the method presented herein which should also be addressed. Traditionally, although SSH has greatly improved the efficiency of subtraction analysis, there are still a high percentage of false positive clones. Furthermore, SSH can only be performed between two conditions. By adding the step of screening the cDNA library obtained by SSH with antisense cDNA obtained from three conditions (iron loaded, control and iron deprived) we provide the opportunity for comparison of gene expression among three or more conditions. In addition, false positive clones are more easily excluded resulting in an improvement in the sensitivity and specificity of the screening process. From the screening process, candidate clones were chosen based on a consistent expression between iron depletion and iron loading. As we demonstrated, most of these candidates can be confirmed on northern blot analysis. However, a few candidate genes did not respond as predicted on northern blot analysis. A consistent observation for the candidate genes from the screening that were not confirmed by northern blot was that all of these ultimately false positive clones had relatively strong or weak signals on both slot blots and northern blot analyses. This observation suggests that the signal intensity outside of the normal range on slot blots may be indicative of a false positive.
In conclusion, we provide evidence that the expression of a number of genes, both novel and known, is regulated by cellular iron availability at the mRNA level. Our results also demonstrate that screening of cDNA libraries from SSH with antisense probes from three iron conditions will decrease the number of false positive clones and the genes obtained will have a high correlation to results obtained by northern blot analysis. This technology can be adapted to identify gene expression profiles in cells stimulated by numerous other stimuli such as cytokines, oxidative stress and other metals.
Acknowledgments
ACKNOWLEDGEMENTS
The authors gratefully acknowledge Drs Robert Milner and Michael Chorney for their comments in the preparation of this manuscript. This research was supported by a NIH grant (NS34280).
REFERENCES
- 1.Weiss G., Widner,B., Zoller,H., Schobersberger,W. and Fuchs,D. (1998) Br. J. Anaesth., 81 (Suppl. 1), 6–9. [PubMed] [Google Scholar]
- 2.Weiss G., Wachter,H. and Fuchs,D. (1995) Immunol. Today, 16, 495–500. [DOI] [PubMed] [Google Scholar]
- 3.Richardson D.R. (1997) Can. J. Physiol. Pharmacol., 75, 1164–1180. [PubMed] [Google Scholar]
- 4.Stal P. (1995) Dig. Dis., 13, 205–222. [DOI] [PubMed] [Google Scholar]
- 5.Jellinger K.A. (1999) Drugs Aging, 14, 115–140. [DOI] [PubMed] [Google Scholar]
- 6.Smith M.A., Harris,P.L., Sayre,L.M. and Perry,G. (1997) Proc. Natl Acad. Sci. USA, 94, 9866–9868. [DOI] [PMC free article] [PubMed] [Google Scholar]
- 7.Ben-Shachar D., Eshel,G., Riederer,P. and Youdim,M.B. (1992) Ann. Neurol., 32 (Suppl.), S105–S110. [DOI] [PubMed] [Google Scholar]
- 8.Sussman H.H. (1992) Pathobiology, 60, 2–9. [DOI] [PubMed] [Google Scholar]
- 9.LeVine S.M. (1997) Brain Res., 760, 298–303. [DOI] [PubMed] [Google Scholar]
- 10.Elliott R.L., Elliott,M.C., Wang,F. and Head,J.F. (1993) Ann. NY Acad. Sci., 698, 159–166. [DOI] [PubMed] [Google Scholar]
- 11.Mikulits W., Schranzhofer,M., Beug,H. and Mullner,E.W. (1999) Mutat. Res., 437, 219–230. [DOI] [PubMed] [Google Scholar]
- 12.Kim H.Y., Klausner,R.D. and Rouault,T.A. (1995) J. Biol. Chem., 270, 4983–4986. [DOI] [PubMed] [Google Scholar]
- 13.Gegout V., Schlegl,J., Schlager,B., Hentze,M.W., Reinbolt,J., Ehresmann,B., Ehresmann,C. and Romby,P. (1999) J. Biol. Chem., 274, 15052–15058. [DOI] [PubMed] [Google Scholar]
- 14.Toth I., Yuan,L., Rogers,J.T., Boyce,H. and Bridges,K.R. (1999) J. Biol. Chem., 274, 4467–4473. [DOI] [PubMed] [Google Scholar]
- 15.Dancis A., Roman,D.G., Anderson,G.J., Hinnebusch,A.G. and Klausner,R.D. (1992) Proc. Natl Acad. Sci. USA, 89, 3869–3873. [DOI] [PMC free article] [PubMed] [Google Scholar]
- 16.Neilands J.B. (1995) J. Biol. Chem., 270, 26723–26726. [DOI] [PubMed] [Google Scholar]
- 17.Henle E.S., Han,Z., Tang,N., Rai,P., Luo,Y. and Linn,S. (1999) J. Biol. Chem., 274, 962–971. [DOI] [PubMed] [Google Scholar]
- 18.Cai C.X., Birk,D.E. and Linsenmayer,T.F. (1997) J. Biol. Chem., 272, 12831–12839. [DOI] [PubMed] [Google Scholar]
- 19.Garre C., Bianchi-Scarra,G., Sirito,M., Musso,M. and Ravazzolo,R. (1992) J. Cell. Physiol., 153, 477–482. [DOI] [PubMed] [Google Scholar]
- 20.He J. and Furmanski,P. (1995) Nature, 373, 721–724. [DOI] [PubMed] [Google Scholar]
- 21.Ye Z. and Connor,J.R. (1999) Biochem. Biophys. Res. Commun., 264, 709–713. [DOI] [PubMed] [Google Scholar]
- 22.Chan L.N. and Gerhardt,E.M. (1992) J. Biol. Chem., 267, 8254–8259. [PubMed] [Google Scholar]
- 23.White K. and Munro,H.N. (1988) J. Biol. Chem., 263, 8938–8942. [PubMed] [Google Scholar]
- 24.Tsuboi K., Hiraiwa,M. and O’Brien,J.S. (1998) Brain Res. Dev. Brain Res., 110, 249–255. [DOI] [PubMed] [Google Scholar]
- 25.Hiraiwa M., Taylor,E.M., Campana,W.M., Darin,S.J. and O’Brien,J.S. (1997) Proc. Natl Acad. Sci. USA, 94, 4778–4781. [DOI] [PMC free article] [PubMed] [Google Scholar]
- 26.Richardson D.R. and Ponka,P. (1998) Am. J. Hematol., 58, 299–305. [DOI] [PubMed] [Google Scholar]
- 27.Keberle H. (1964) Ann. NY Acad. Sci., 119, 758. [DOI] [PubMed] [Google Scholar]
- 28.Koppel J., Loyer,P., Maucuer,A., Rehak,P., Manceau,V., Guguen-Guillouzo,C. and Sobel,A. (1993) FEBS Lett., 331, 65–70. [DOI] [PubMed] [Google Scholar]
- 29.Lovric J., Dammeier,S., Kieser,A., Mischak,H. and Kolch,W. (1998) J. Biol. Chem., 273, 22848–22855. [PubMed] [Google Scholar]
- 30.Mistry S.J. and Atweh,G.F. (1999) Anticancer Res., 19, 573–577. [PubMed] [Google Scholar]
- 31.Seki T., Moriuchi,T., Chang,H.C., Denome,R. and Silver,J. (1985) Nature, 313, 485–487. [DOI] [PubMed] [Google Scholar]
- 32.Kemshead J.T., Ritter,M.A., Cotmore,S.F. and Greaves,M.F. (1982) Brain Res., 236, 451–461. [DOI] [PubMed] [Google Scholar]