Abstract
Polycystic ovary syndrome (PCOS) is the most common endocrinopathy in women. In PCOS, insulin resistance and hyperandrogenism could drive the increased risk for cardiometabolic disease. Aldo-keto reductase family 1 member C3 (AKR1C3) is induced by insulin in PCOS adipocytes and is the predominant enzyme for potent androgen formation causing ligand-dependent androgen receptor (AR) activation. AR induces fatty acid synthase (FASN), a central enzyme for de novo lipogenesis. To investigate how insulin signaling induces AKR1C3 to promote lipid overload through induction of FASN, we used differentiated human Simpson–Golabi–Behmel syndrome adipocytes as a model for PCOS adipocytes. Induction of AKR1C3 and FASN was shown to be dependent on phosphoinositide 3-kinase/protein kinase B/ mammalian target of rapamycin/nuclear factor-erythroid 2-related factor 2 using pharmacological and genetic manipulation. FASN induction was shown to be AKR1C3 and AR dependent. Monofunctional AKR1C3 inhibitors, which competitively inhibit AKR1C3, did not block FASN induction, whereas bifunctional inhibitors, which competitively inhibit AKR1C3 and attenuate AR signaling by increasing AR degradation and ubiquitination, did suggesting a nonenzymatic role for AKR1C3 to stabilize AR. AKR1C3 and AR interacted as seen by co-immunoprecipitation, proximity ligation assay, and co-occupancy on FASN locus using chromatin immunoprecipitation–quantitative polymerase chain reaction assays in a ligand-dependent and ligand-independent manner. In the absence of androgens, bifunctional inhibitors prevented lipid droplet formation, whereas monofunctional inhibitors did not. We propose that AKR1C3 has 2 roles in PCOS: to catalyze potent androgen formation in adipocytes promoting hyperandrogenism and to induce FASN by stabilizing AR in the absence of androgens. AKR1C3 may be a therapeutic target for bifunctional inhibitors to reduce cardiometabolic disease in PCOS women.
Keywords: adipocyte differentiation, cell signaling, Simpson–Golabei–Behmel syndrome, insulin resistance, lipid overload
Polycystic ovary syndrome (PCOS) is the most prevalent endocrine disorder in women, affecting approximately 8% to 13% of reproductive-aged women (1-4). To be diagnosed with PCOS, a patient must have 2 of the 3 following symptoms according to the Rotterdam criteria: oligo-anovulation, polycystic ovarian morphology, or hyperandrogenism (1, 4). PCOS women have an increased risk for developing comorbidities such as type 2 diabetes mellitus, obesity, and metabolic syndrome. In PCOS, insulin resistance (IR) correlates with androgen excess (AE) and an increased risk for cardiometabolic disease (5-10). However, it is unknown how IR and AE interact to promote cardiometabolic disease in PCOS women, which creates a major barrier for treatment of these comorbidities in these patients.
Aldo-keto reductase family 1 member C3 (AKR1C3; also known as type 5 17β-hydroxysteroid dehydrogenase) could be the missing link between IR and AE in PCOS. AKR1C3 is induced by insulin in PCOS adipocytes and in peripheral tissues catalyzes the conversion of Δ4-androstene-3,17-dione (4AD) to testosterone (T) and 5α-androstane-3,17-dione to 5α-dihydrotestosterone (DHT) (9, 11). Of the 17β-hydroxysteroid dehydrogenases that convert 4AD to T in human adipose tissue, AKR1C3 is the most highly expressed in adipocytes (12). AKR1C3 expression correlates with adiposity in normal obesity (12, 13) and obesity in PCOS (14, 15). During differentiation, AKR1C3 is upregulated in PCOS adipocytes vs control adipocytes (15, 16). Recently, we showed that in a model of PCOS adipocytes, insulin-induced AKR1C3 preferentially converted 11-oxygenated androgen substrates, derived from the adrenals, to 11-keto-testosterone (17). AKR1C3 may drive AE in PCOS through the production of potent androgens to activate androgen receptor (AR) in adipocytes.
AKR1C3 is induced by insulin and upregulated during differentiation of PCOS adipocytes (15, 16, 18), but the signal transduction pathway responsible is unknown. Classically, insulin receptor activation signals through the phosphoinositide 3-kinase (PI3K)/protein kinase B (AKT)/mammalian target of rapamycin (mTOR) axis, which is important for growth and proliferation (19-21). Dysregulation of this axis has been associated with PCOS (22, 23). Therefore, AKR1C3 induction may be dependent on this pathway.
Fatty acid synthase (FASN) is known to be AR dependent in prostate cancer cells (24), which may also be true in adipose tissue. FASN is insulin dependent and the central enzyme for de novo lipogenesis (DNL), because it catalyzes the formation of palmitate, the precursor to longer chain fatty acids (25). Therefore, overexpression of AKR1C3 could lead to ligand-dependent activation of AR and induce FASN to upregulate DNL in PCOS adipocytes. This would drive lipid overload to result in more insulin secretion to promote DNL through a feed forward mechanism via insulin induction of AKR1C3.
AKR1C3 has other properties in addition to its enzymatic function, where it can stabilize AR in prostate cancer cells (26, 27). Whether insulin induction of AKR1C3 could stabilize AR during adipogenesis and enhance FASN expression is unknown.
We investigated the signal transduction pathway by which insulin induces AKR1C3 and FASN by reverse transcription-quantitative polymerase chain reaction (RT-qPCR) and immunoblot using both pharmacological and genetic approaches. We explored whether FASN is regulated by AKR1C3 and AR and interrogated the mechanism of induction during adipogenesis. For these experiments, we utilized human Simpson–Golabi–Behmel syndrome (SGBS) subcutaneous preadipocytes differentiating into mature adipocytes, which have been used as a model for PCOS adipocytes by O’Reilly et al (15, 18). These investigators compared subcutaneous adipocytes from patients with PCOS with SGBS adipocytes and found them to be similar. SGBS preadipocytes retain insulin induction of AKR1C3 and insulin induced T production. SGBS adipocytes show an increase in DNL and a decrease in β-fatty acid oxidation stimulated by T and DHT. These properties are similar to PCOS adipocytes. Previously, we determined that insulin-induced AKR1C3 forms potent androgens that may drive hyperandrogenism in PCOS (17). Here we report on the mechanism by which AR and insulin-induced AKR1C3 interact as regulators of FASN in adipocytes, which may drive DNL promoting lipid overload in PCOS women.
Materials and Methods
Chemicals and Reagents
Wortmannin was purchased from Sigma (St. Louis, MO). MK2206, rapamycin, ML385, MG132, and TVB2640 were purchased from Selleck Chemicals (Houston, TX). Enzalutamide was purchased from Med Chem Express (Monmouth Junction, NJ). Indomethacin was purchased from ICN Biomedicals Inc (Costa Mesa, CA). Allstar Negative Control siRNA and silencing siRNAs for nuclear factor-erythroid 2-related factor 2 (NRF2) (Hs_NFE2L2_7, SI03246950), AKR1C3 (Hs_AKR1C3_4, SI00055279), and AR (Hs_AR_6, SI02757265) were purchased from Qiagen (Hilden, Germany). DHT was purchased from Steraloids (Newport, RI). Steroid identity and purity were assessed by UV high-performance liquid chromatography when possible, followed by high-resolution mass spectrometry (HRMS). All chemicals were of the highest grade available. BMT4-158 (3-((4-Nitronaphthalen-1-yl)amino)benzoate), BMT4-159 (2-{[3-(trifluoromethyl)phenyl]amino}-benzoic acid), ASP9521 (1-{1-[(5-methoxy-1H-indol-2-yl)carbonyl] piperidin-4-yl}-2-methylpropan-2-ol), and GTx-560 (6-hydroxy-4-(34,5-trifluorophenyl)-1(2H)-isoquinolinone) were synthesized in house according to published methods (28, 29).
SGBS Cell Culture and Differentiation
SGBS preadipocytes were grown and differentiated into mature adipocytes over 14 days based on the protocol from the Wabitsch laboratory (30). Preadipocytes were passaged in growth media (Dulbecco’s modified Eagle’s medium/F12, 10% fetal bovine serum, 1% penicillin/streptomycin, 33 µM biotin, 17 µM pantothenic acid), and were maintained up to 50 generations at a growth rate of 2 generations per 3 days. In preparation for differentiation, preadipocytes were seeded into 6-cm dishes (Corning, NY) and grown for 3 days to reach 600 000 cells at 90% confluency. After 3 days of growth, cells were washed with phosphate-buffered saline (PBS) and quick differentiation was initiated with differentiation medium (growth medium without fetal bovine serum) containing 10 µg/mL apo-Transferrin, 20 nM insulin, 100 nM cortisol, 200 pM triiodothyronine, 25 nM dexamethasone, 250 µM isobutylmethylxanthine, and 2 µM rosiglitazone. After 4 days, the quick differentiation medium was replaced with the same differentiation medium minus 25 nM dexamethasone, 250 µM isobutylmethylxanthine, and 2 µM rosiglitazone. Cells were phenotyped using Oil Red O (Sigma) staining for lipid droplet formation, which was normalized to cell count by Hoechst nuclei staining (Thermo, Waltham, MA) and imaged using a Biotek Cytation 5 plate reader.
RNA was extracted with 600 µL of lysis buffer with 2-mercaptoethanol by RNeasy mini kit (Qiagen) and treated with DNase (Qiagen) as per the manufacturers protocol. RNA concentrations were determined with a Nanodrop ND-2000.
Cellular extracts were harvested on ice with 100 µL of RIPA buffer (Pierce/Thermo, Waltham, MA) containing 1:100 Protease Inhibitor (Sigma), homogenized by syringe, and spun for 10 minutes at 15 000 rpm at 4 °C. Protein concentrations were determined by bicinchoninic acid assay (Pierce/Thermo).
Cells were treated on day 4 with wortmannin (100 nM-10 µM), MK2206 (100 nM-20 µM), rapamycin (100 pM-1 nM), ML385 (100 nM-25 µM), or enzalutamide also known as MDV3100 (10-50 µM) dissolved in dimethyl sulfoxide and harvested for RNA on day 7 or protein on day 9. Transient transfections were conducted on day 9 using 2% HiPerFect Transfection Reagent (Qiagen) and 40 nM NRF2 or AR siRNA in Opti-MEM medium for 24 hours followed by harvest for protein. For inhibition of AKR1C3 experiments, cells were treated on day 4 with 30 µM BMT4-159, ASP9521, indomethacin, BMT4-158, or GTx-560 dissolved in dimethyl sulfoxide and harvested on day 14 for RNA or protein, or cells were transfected with AKR1C3 siRNA on day 14 for 24 hours followed by harvest for protein. To quantify lipid droplet formation, cells were treated on day 4 with 1 µM ML385, 30 µM BMT4-158, 30 µM GTx-560, 30 µM enzalutamide, or 10 nM TVB2640 and were stained for lipids on day 14. Cells were stained with 80 nM Sytox Green (Thermo) and 2 µM Hoechst for 30 minutes to measure cell viability after the various treatment conditions (Fig. S1 (31)).
RT-qPCR Assay
RNA was reverse-transcribed to cDNA using High Capacity RNA to cDNA kit (Applied Biosystems/Thermo, Waltham, MA). Expression was measured by QuantiTect SYBR Green PCR Master Mix (Qiagen) in the Chromo4 System. The conditions for the real-time PCR for AKR1C3 were 95 °C for 15 minutes followed by 40 cycles of 94 °C for 15 seconds (denaturation), 57 °C (annealing temperature) for 30 seconds, and 72 °C (extension temperature) for 30 seconds. The conditions for the real-time PCR for FASN were 95 °C for 15 minutes followed by 40 cycles of 95 °C for 30 seconds (denaturation), 60 °C (annealing temperature) for 30 seconds. The conditions for the real-time PCR for αTubulin were 95 °C for 15 minutes followed by 40 cycles of 94 °C for 15 seconds (denaturation), 51 °C (annealing temperature) for 30 seconds, and 72 °C (extension temperature) for 30 seconds. Standard curves were generated using full-length standards (2 500 000-0.025 fg) as previously described by us (32). Full-length standards were generated from their appropriately sequenced cDNA plasmids (pcDNA3-AKR1C3, pCMV-FASN (transOMIC technologies, Huntsville, AL), pCMV-αTubulin (a gift provided by the Dominguez laboratory at the University of Pennsylvania)). PCR product standards were generated for AKR1C3 with the following: forward primer 5′-GAA GTA AAG CTT TGG AGG TC-3′ and reverse primer 5′-GTC AAC ATA GTC CAA TTG AGC-3′. PCR product standards were generated for FASN with the following: forward primer 5′-ACA GGG ACA ACC TGG AGT TCT-3′ and reverse primer 5′-CTG TGG TCC CAC TTG ATG AGT-3′. PCR product standards were generated for αTubulin with the following: forward primer 5′-AGA CTT GGA ACC CAC AGT CA-3′ and reverse primer 5′-AAG AAG CCC TGA AGA CCG-3′. All samples were analyzed in triplicate.
Immunoblot Assay
Protein extracts (20 µg) were heated at 100 °C for 10 minutes in Laemmli buffer and loaded on 9% sodium dodecyl sulfate (SDS) polyacrylamide gels. Gels were transferred to PVDF membranes and blocked with 5% blocking buffer (Bio-Rad, Hercules, CA) in Tris-buffered saline containing 0.1% Tween 20 (TBST) for 1 hour at room temperature. Blots were then incubated with the following primary antibodies: 1:500 murine antihuman AKR1C3 (33) (AB_476751; A6229; Sigma), 1:1000 rabbit antihuman FASN (AB_2100798; 3189; Cell Signaling Technology, Danvers, MA), 1:500 murine antihuman AR (AB_626671; sc-7305; Santa Cruz; Dallas, TX), 1:500 rabbit antihuman mTOR (AB_330978; 2972; Cell Signaling), 1:500 rabbit antihuman phospho-mTOR (Ser2448) (AB_330970; 2971; Cell Signaling), or 1:3000 murine antihuman αTubulin (AB_521686; NB100-690; Novus Biologicals, Littleton, CO) in 5% blocking buffer in TBST overnight at 4 °C. Blots were washed in TBST and developed with 1:2000 murine-IgG BP-HRP (AB_2687626; sc-516102 now sold as sc-525409; Santa Cruz) or 1:1500 murine antirabbit IgG-HRP (AB_628497; sc-2357; Santa Cruz) in 5% blocking buffer in TBST for 1 hour at room temperature. Recombinant AKR1C3 or FASN expressed in HEK293 cells were used as positive controls. After probing for phospho-mTOR, blots were incubated with stripping buffer (2% SDS, 62.5 mM Tris HCl, 0.8% 2-mercaptoethanol) for 20 minutes. Blots were then reblocked and probed for total mTOR as described above. Bands were then detected using ECL Western Blotting Substrate (Thermo) and imaged with a ChemiDoc MP Imaging System (Bio-Rad). Band intensity for proteins of interest was quantified by Image Lab software (Bio-Rad) and normalized to the loading control αTubulin.
Ubiquitination Assay
Protein extracts (20 µg) were combined with 0.4 µg of rabbit antihuman AR (AB_10691711; 5153; Cell Signaling Technology) overnight at 4 °C on a LabQuake tube rotator. Antibody–protein complexes were then combined with 30 µL of Protein G Dynabeads (Thermo) and rotated 2 hours at 4 °C. The beads were prewashed in 500 µL of 25 mM citric acid, 50 mM sodium phosphate pH 5.0 (IP wash buffer) for 2 minutes followed by pulldown on the Dynamagnet (Thermo) (2×). After incubation, bead–antibody–protein complexes were washed with 500 µL of IP wash buffer for 2 minutes (3×). Complexes were then eluted with 40 µL of 100 mM citric acid, pH 2.0 (IP elution buffer) and rotated at room temperature for 2 minutes. Eluates were neutralized with 10 µL of 1.5 M Tris-HCl, pH 8.8 and combined with 10 µL of Laemmli buffer followed by heating at 100 °C for 10 minutes. Samples were then analyzed by immunoblot using 1:1000 murine antihuman ubiquitin (AB_2762364; sc-8017; Santa Cruz) primary antibody as described above.
Immunofluorescence Assay
Cells were differentiated in 96-well plates (Corning) and washed with PBS. Samples were then fixed in 4% paraformaldehyde for 20 minutes, washed with PBS, and permeabilized with 0.2% Triton X-100 (Thermo) for 20 minutes, and then washed with PBS. Samples were then blocked in 3% bovine serum albumin (Sigma) in PBST (PBS containing 0.1% Tween 20) for 1 hour at room temperature. Samples were then incubated with 1:50 murine antihuman AR (AB_626671) and 1:50 rabbit antihuman AKR1C3 (AB_2922995; ab209899; abcam, Waltham, MA) in 3% bovine serum albumin in PBST overnight at 4 °C. Samples were washed in PBST, followed by incubation with 1:200 goat antimurine IgG-FITC (AB_631735, sc-2010, Santa Cruz) for 1 hour in 3% bovine serum albumin in PBST to detect AR and washed in PBST. Samples were then incubated with 1:150 murine antirabbit IgG-Texas Red (AB_628500, sc-3917, Santa Cruz) for 1 hour in 3% bovine serum albumin in PBST to detect AKR1C3 and washed in PBS. Samples were counterstained with 2 µM Hoechst dye for 15 minutes in PBS and imaged using a Biotek Cytation 5 plate reader with 4′,6-diamidino-2-phenylindole (DAPI), green fluorescent protein, and Texas Red filter cubes under 4 × magnification.
Co-immunoprecipitation Assay
Protein extracts (20 µg) were combined with 0.8 µg of murine antihuman AR (AB_626671) and compared with murine isotype control (AB_737182; sc-2025; Santa Cruz). Pulldowns were performed as described above and analyzed by immunoblot.
Proximity Ligation Assay
Using Duolink in situ red kit (Sigma), cells were first differentiated in 96-well plates and washed with PBS. Samples were fixed in 4% paraformaldehyde for 20 minutes, washed with PBS, permeabilized with 0.2% Triton X-100 for 20 minutes, and then washed with PBS. Samples were blocked with Duolink blocking solution for 1 hour at 37 °C. Samples were then incubated with 1:50 murine antihuman AR (AB_626671) and 1:50 rabbit antihuman AKR1C3 (AB_2922995) in Duolink antibody diluent overnight at 4 °C. Samples were then washed, treated with antirabbit PLUS oligonucleotide conjugate and antimouse MINUS oligonucleotide conjugate secondary antibodies (1 hour), DNA ligase (30 minutes), and DNA polymerase (100 minutes) sequentially at 37 °C as per protocol. A positive signal is visualized as red fluorescent dots due to amplification of ligated complementary oligonucleotides. After final washes, samples were than counterstained with 2 µM Hoechst dye for 15 minutes in PBS and imaged using a Biotek Cytation 5 plate reader with Texas Red and DAPI filter cubes under 4× magnification.
Chromatin Immunoprecipitation-qPCR Assay
Cells were treated with 10 nM DHT for 24 hours following differentiation. SGBS chromatin immunoprecipitation (ChIP) DNA was prepared based on a previously published method (34). Medium was removed and 6-cm dishes were fixed with 1% formaldehyde for 8 minutes. Fixation was quenched using a final concentration of 125 mM glycine and incubated for 5 minutes shaking periodically. Cells were washed twice in cold PBS and harvested in 100 µL of ChIP lysis buffer (1% SDS, 10 mM EDTA, 1:100 protease inhibitors, 50 mM Tris-HCl, pH 8.1). Lysates were then sonicated using a QSonica Microplate Horn System at 80% amplitude, 20 cycles of 30 seconds on and 60 seconds off, at 3 °C to sheer DNA between 200 and 800 base pairs. Lysates (∼20 µg) were diluted 1:10 in ChIP dilution buffer (0.01% SDS, 1.1% Triton X-100, 1.2 mM EDTA, 167 mM NaCl, 1:100 protease inhibitors, 16.7 mM Tris-HCl, pH 8.1) with 0.4 µg of rabbit antihuman AR (AB_10691711) or rabbit antihuman AKR1C3 (AB_2922995) compared against rabbit isotype control (AB_2687931; ab172730; abcam). Samples were rotated overnight at 4 °C. Antibody–protein–DNA complexes were then combined with 40 µL of Protein G Dynabeads (Thermo) and rotated for 2 hours at 4 °C. The beads were prewashed in 500 µL of 1.2 mM EDTA, 16.7 mM Tris-HCl, pH 8.1 for 2 minutes followed by pulldown on the Dynamagnet (Thermo) (2×). After incubation, bead–antibody–protein–DNA complexes were washed successively for 2 minutes with 500 µL of the following buffers: low salt wash buffer (0.1% SDS, 1% Triton X-100, 2 mM EDTA, 150 mM NaCl, 20 mM Tris-HCl, pH 8.1), high salt wash buffer (0.1% SDS, 1% Triton X-100, 2 mM EDTA, 500 mM NaCl, 20 mM Tris-HCl, pH 8.1), and LiCl wash buffer (0.25 M LiCl, 1% Nonidet P-40, 1% sodium deoxycholate, 1 mM EDTA, 10 mM Tris-HCl, pH 8.1). The samples were then washed twice with 500 µL of TE buffer (1 mM EDTA, 10 mM Tris-HCl, pH 8.1). Complexes were then eluted with 500 µL of ChIP elution buffer (0.5% SDS, 10 mM EDTA, 25 mM Tris-HCl, pH 7.5) by rotating for 30 minutes at room temperature. Eluates were then treated with 40 µg of ChIP grade Protease K (Thermo) to get a final concentration of 80 ng/µL (at least 1.2 U of total activity) and incubated overnight at 65 °C to reverse cross-links and digest any remaining protein. Samples were then transferred to glass centrifuge tubes and 500 µL of extraction reagent (25:24:1 phenol/chloroform/isoamyl alcohol; Thermo) was added. Samples were vortexed for 1 minute and centrifuged at 37 °C for 5 minutes. The upper DNA aqueous fraction was removed and placed in a clean tube. The remaining phenol layer was re-extracted with 200 µL of water to recover any remaining DNA. After vortexing and centrifugation, the aqueous fractions were combined. Finally, the samples were extracted with another 500 µL of extraction reagent, and the final upper aqueous fraction (∼700 µL) was removed after vortexing and centrifugation. To precipitate the DNA, 150 µL of sodium acetate, pH 5.2 (0.5 M) and 100 µg of glycogen (0.1 µg/µL) as a carrier were added. Ethanol (2.2 mL) was added (2.5 × the volume) and kept at −20 °C for at least 1 hour. Samples were then spun at 13 000 rpm and 4 °C for 30 minutes. After decanting the supernatant, the samples were washed with 70% ethanol and spun down for 10 minutes at the same conditions. DNA pellets were then dried and resuspended in TE buffer.
DNA purity was accessed using an Agilent 2100 Bioanalyzer system. 250 ng of DNA were loaded and expression was measured by QuantiTect SYBR Green PCR Master Mix (Qiagen) in the Chromo4 System. The conditions for the real-time PCR were 95 °C for 15 minutes followed by 40 cycles of 95 °C for 15 seconds (denaturation), 55 °C (annealing temperature) for 15 seconds, and 72 °C (extension temperature) for 30 seconds. PCR products were generated for FASN ARE1 with the following: forward primer 5′-TAT GAC ACC CAG GGC TTT CGT TCA-3′ and reverse primer 5′-TAA CGT TCC CTG CGC GTT TAC AGA-3′. PCR products were generated for FASN ARE2 with the following: forward primer 5′-CGG TAG AGC TCT TGC ACA CA-3′ and reverse primer 5′-GGG TGC TTC TGT TAG CGA AT-3′. PCR products were generated for FASN ARE3 with the following: forward primer 5′-CTA CTT CTC CCG TGC CAC TC-3′ and reverse primer 5′-TCT CTC CCC TTC GAT GTG TC-3′ as previously reported (35). Fold enrichments was determined by using the formula: 2^-(delta C(t) between experimental and control conditions).
Lipid Droplet Staining Assay
Oil Red O (Sigma) working stain (stock: 3.5 mg/mL in isopropanol) is made by diluting 6 parts of the stock solution to 4 parts water and incubated for 20 minutes followed by filtration. Cells were fixed in 4% paraformaldehyde for 30 minutes followed by equilibration in 60% isopropanol for 5 minutes. Cells are then stained with Oil Red O for 10 minutes and washed 4× with PBS. Cells were counterstained with 2 µM Hoechst dye for 15 minutes in PBS and imaged using a Biotek Cytation 5 plate reader. Lipid droplets were viewed under 4× magnification color brightfield and total lipid area was normalized to cell count (nuclei viewed under DAPI filter cube).
Statistical Analysis
All statistical tests were computed using PRISM graphpad (version 9.0). Each treatment condition was assessed for normality using the Shaprio-Wilk test and QQ plots when appropriate. Significance was determined using a 1-way analysis of variance (ANOVA) with a Bonferroni correction for multiple comparisons when compared against the control condition with an alpha of .05 (*).
Results
Insulin Induction of AKR1C3 and FASN Are PI3K/AKT/mTOR Dependent in SGBS Adipocytes
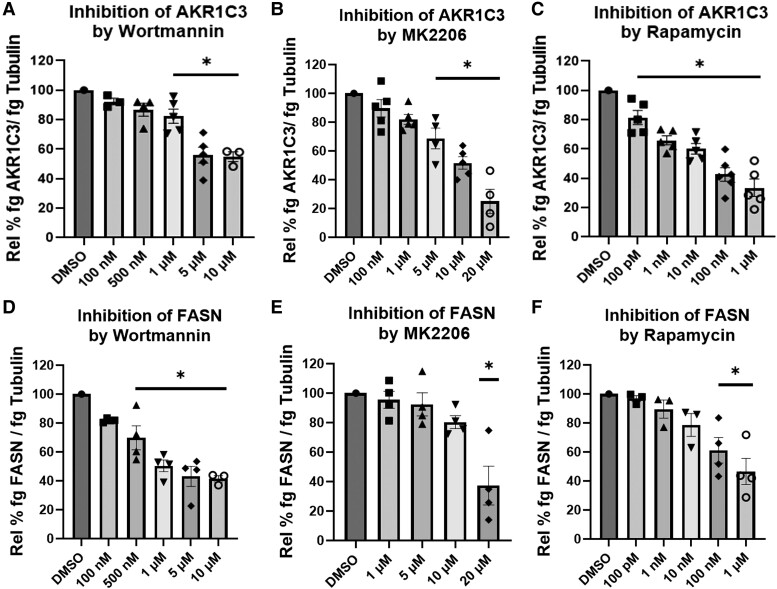
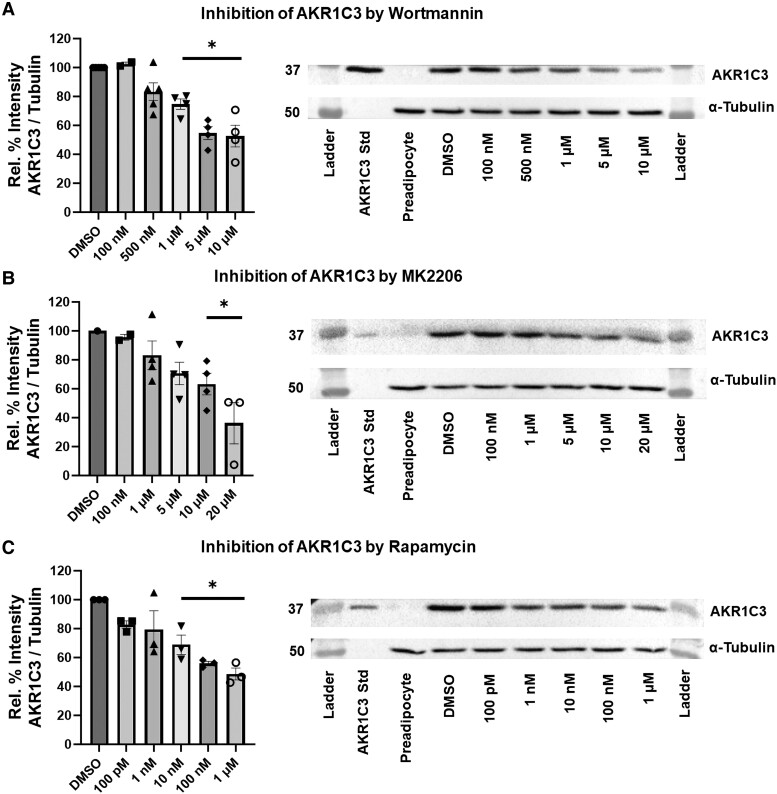
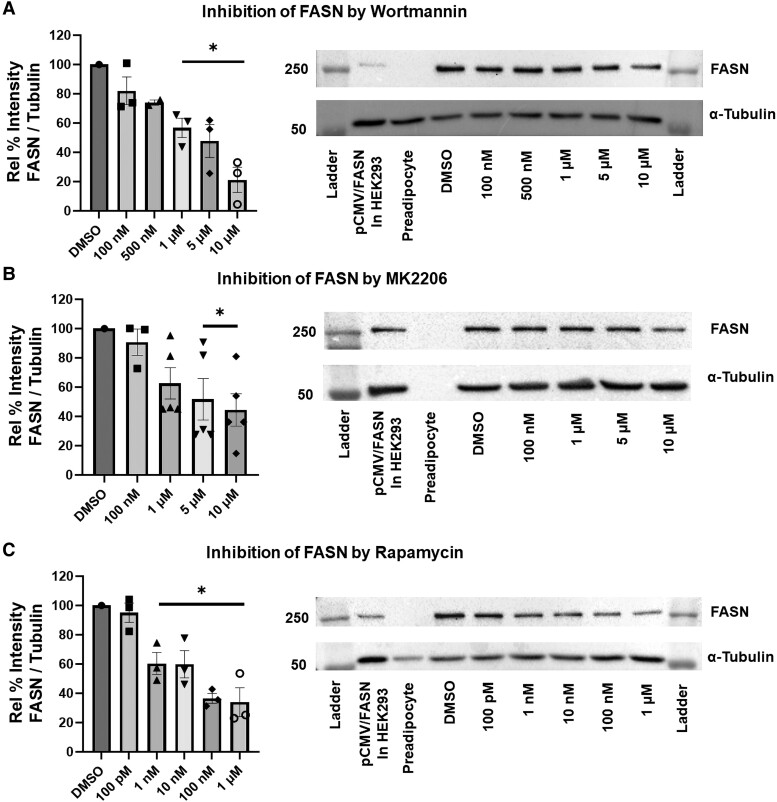
We investigated whether insulin induction of AKR1C3 and FASN were dependent on the PI3K/AKT/mTOR pathway. Treatment with varying concentrations of wortmannin (PI3K inhibitor), MK2206 (AKT inhibitor), or rapamycin (mTOR inhibitor) downregulated expression of AKR1C3 and FASN at the RNA and protein levels (Figs. 1-3). This indicated that the insulin induction of AKR1C3 or FASN is dependent on the PI3K/AKT/mTOR signaling axis. Inhibition of kinase activity was validated by inhibition of phospho-mTOR expression (Fig. S2 (36)).
Figure 1.
Insulin-induced AKR1C3 and FASN are PI3K/AKT/mTOR dependent at the RNA level in SGBS adipocytes: using (A, D) wortmannin, (B, E) MK2206, or (C, F) rapamycin to inhibit PI3K/AKT/mTOR signaling, AKR1C3 and FASN expression were measured by RT-qPCR. Mean ± SEM was given for each condition (n = 3-6), and significance was determined by a 1-way ANOVA with *P < .05.
Figure 2.
Insulin-induced AKR1C3 is PI3K/AKT/mTOR dependent at the protein level in SGBS adipocytes: using (A) wortmannin, (B) MK2206, or (C) rapamycin to inhibit PI3K/AKT/mTOR signaling, AKR1C3 expression was measured by immunoblot with representative blots shown. Mean ± SEM was given for each condition (n = 2-5), and significance was determined by a 1-way ANOVA with *P < .05.
Figure 3.
Insulin-induced FASN is PI3K/AKT/mTOR dependent at the protein level in SGBS adipocytes: using (A) wortmannin, (B) MK2206, or (C) rapamycin to inhibit PI3K/AKT/mTOR signaling, FASN expression was measured by immunoblot with representative blots shown. Mean ± SEM was given for each condition (n = 2-5), and significance was determined by a 1-way ANOVA with *P < .05.
AKR1C3 and FASN Are NRF2 Dependent in SGBS Adipocytes
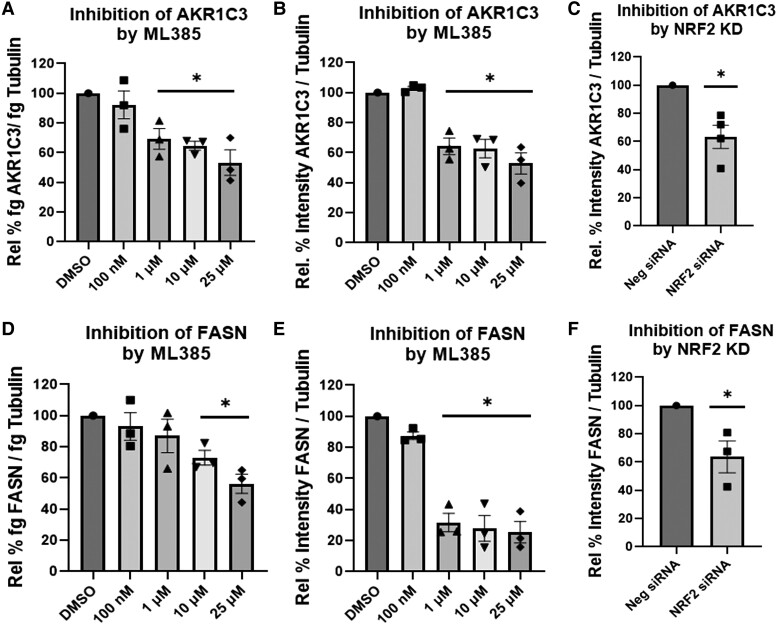
NRF2 is a known transcription factor that binds to the antioxidant response elements on AKR1C3 (37–39) that may be implicated in the insulin induction of AKR1C3 in adipocytes. Treatment with varying concentrations of ML385 (binds to the Neh1 [leucine zipper] domain of NRF2 and blocks formation of the NRF2: small-Maf heterodimer) (40) downregulated AKR1C3 and FASN expression at the RNA and protein levels (Fig. 4A and 4B, 4D and 4E). NRF2 siRNA also downregulated expression of AKR1C3 and FASN (Fig. 4C and 4F). This indicated that AKR1C3 and FASN are NRF2 dependent in differentiating adipocytes.
Figure 4.
AKR1C3 and FASN are NRF2 dependent in SGBS adipocytes: using (A, B and D,E) ML385, a specific NRF2 inhibitor, AKR1C3, and FASN expression were measured by RT-qPCR or immunoblot. (C, F) Transient transfection with NRF2 siRNA was preformed followed by measuring AKR1C3 and FASN expression by immunoblot. Mean ± SEM was given for each condition (n = 3-4), and significance was determined by a 1-way ANOVA with *P < .05.
Induction of FASN Is AKR1C3 and AR Dependent in SGBS Adipocytes
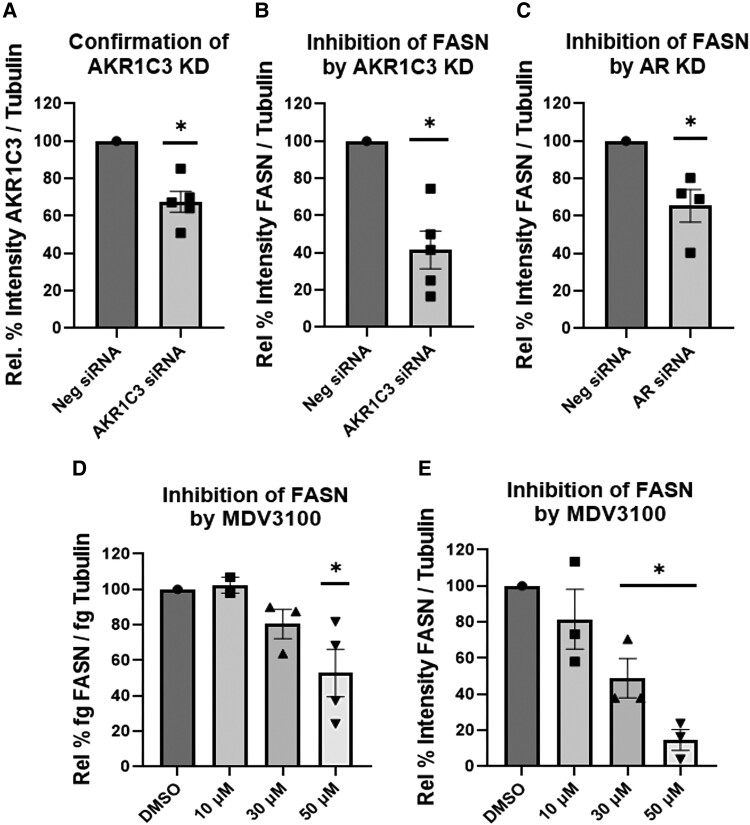
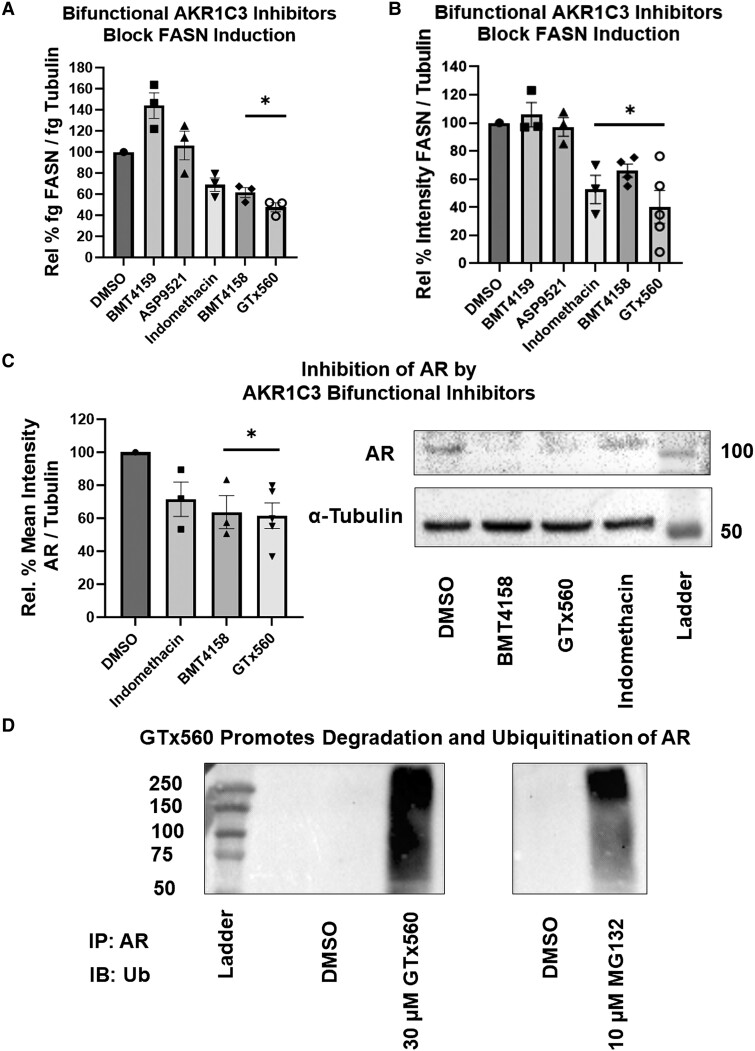
To examine whether induction of FASN is dependent on AKR1C3 and in turn dependent on AR, we conducted siRNA knockdown of AKR1C3 or AR. Cells transfected with AKR1C3 or AR siRNA downregulated FASN expression (Fig. 5A-5C). Treatment with enzalutamide, an AR antagonist and AR degrader (41), also downregulated FASN at the RNA and protein levels (Fig. 5D and 5E). Strikingly, there are no androgens in the culture media and their absence was confirmed by ultrahigh-performance liquid chromatography (UPLC)-HRMS assay with a limit of detection at 1 pg (17). These data indicated that FASN is AKR1C3 and AR dependent without added androgens. Cells were treated with a panel of AKR1C3 inhibitors that consist of monofunctional and bifunctional AKR1C3 inhibitors. The monofunctional inhibitors, BMT4-159 and ASP9521, are competitive AKR1C3 inhibitors, whereas the bifunctional inhibitors, GTx-560, BMT4-158, and indomethacin, are competitive AKR1C3 inhibitors, which also disrupt AR signaling. GTx-560 inhibits the coactivator function of AKR1C3 on AR (29, 42). BMT4-158 is an AR antagonist and degrades AR (29), and indomethacin downregulates AR by proteasomal degradation (26). Treatment with the bifunctional AKR1C3 inhibitors blocked the induction of FASN at the RNA and protein levels, whereas the monofunctional AKR1C3 inhibitors did not (Fig. 6A and 6B). Treatment with BMT4-158 and GTx-560 downregulated AR (Fig. 6C), while GTx-560 additionally increased ubiquitination and degradation of AR (Fig. 6D) in a proteasome dependent manner (Fig. S3 (43)). These data support the concept that AKR1C3 stabilizes AR, which results in induction of FASN.
Figure 5.
FASN is AKR1C3 and AR dependent in SGBS adipocytes: transient transfection with AKR1C3 siRNA was preformed followed by measuring (A) AKR1C3 or (B) FASN expression by immunoblot. (C) Transient transfection with AR siRNA was preformed and FASN expression was measured by immunoblot. Adipocytes were treated with MDV3100, AR antagonist and degrader, and FASN expression was measured by (D) RT-qPCR or (E) immunoblot. Mean ± SEM was given for each condition (n = 2-5), and significance was determined by a 1-way ANOVA with *P < .05.
Figure 6.
AKR1C3 stabilizes AR to regulate FASN in SGBS adipocytes: SGBS adipocytes were treated with various AKR1C3 inhibitors (30 µM) and FASN expression was measured by (A) RT-qPCR or (B) immunoblot. AR expression was quantified after treatment with 30 µM AKR1C3 bifunctional inhibitors by (C) immunoblot or (D) samples were subject to Co-IP with AR antibody and probed for ubiquitin (Ub). MG132 (10 µM), proteasome inhibitor, was utilized as a positive control for an AR ubiquitin smear, since AR is degraded by the proteasome after ubiquitination. Mean ± SEM was given for each condition (n = 3-5), and significance was determined by a 1-way ANOVA with *P < .05.
Lack of FASN Induction by AR Ligands
Since FASN was downregulated by enzalutamide, we conducted RT-qPCR assays to determine whether 3 different AR agonists could induce FASN at the RNA level. We found that T, DHT, and 11-keto-testosterone were unable to induce FASN in a concentration dependent manner. Exogenous androgens could not induce FASN beyond the level already achieved by differentiation. This indicated that FASN is AKR1C3 and AR dependent but independent of added androgens in SGBS adipocytes (Fig. S4 (44)).
AKR1C3 Interacts With AR on FASN in SGBS Adipocytes
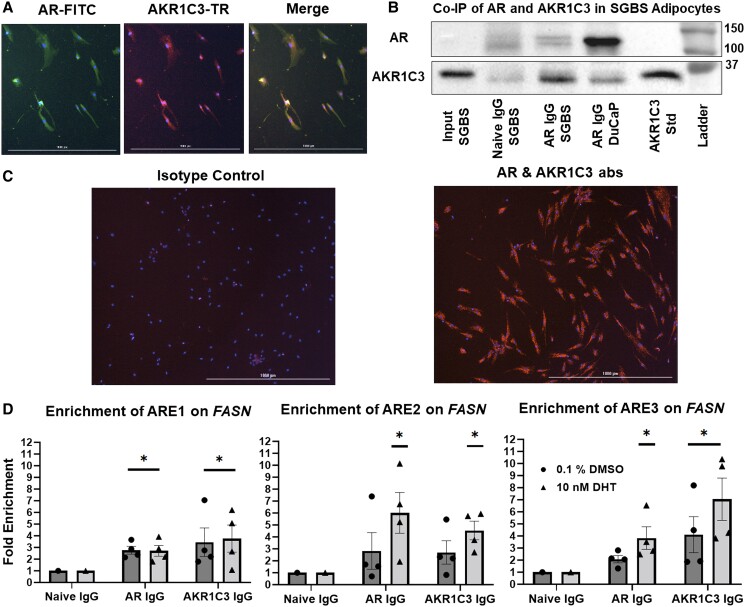
AKR1C3 is known to interact with AR in prostate cancer cells (26, 27). To determine whether this interaction occurs in adipocytes, we first conducted immunofluorescence staining. AKR1C3 was shown to be coexpressed with AR in the cytoplasm of SGBS adipocytes, where AKR1C3 and AR are prominently expressed prior to translocation to the nucleus (Fig. 7A). Next, we showed that AR does interact with AKR1C3 by co-immunoprecipitation (Co-IP) after pulldown with an AR antibody in SGBS cell lysate (Fig. 7B) and by proximity ligation assay (PLA) in fixed SGBS adipocytes with AR and AKR1C3 antibodies (Fig. 7C). We conducted ChIP-qPCR assays to determine if this interaction takes place in the nucleus on the FASN locus. Using 3 reported AR enhancer domains (ARE1-3) on FASN, which contain classical ARE inverted repeat motifs (35), we determined that AR and AKR1C3 bind to FASN AREs in a DHT dependent manner. However, enrichment of ARE1 occurred in the presence or absence of DHT. These data indicated that both proteins bind to FASN in the absence of added androgens (Fig. 7D).
Figure 7.
AKR1C3 and AR interaction regulates FASN in SGBS adipocytes: (A) SGBS adipocytes were fixed and stained for immunofluorescence with AR and AKR1C3 antibodies. (B) Co-IP(s) were performed with SGBS lysates by IP for AR and probing for AKR1C3. IP in DuCaP cells was used as a positive control. (C) PLA was performed on SGBS cells with AR and AKR1C3 antibodies. (D) ChIP-qPCR was conducted for 3 AREs in enhancer regions of FASN locus ± 10 nM DHT after IP for AR or AKR1C3. Mean ± SEM was given for each condition (n = 3-4), and significance was determined by a 1-way ANOVA with *P < .05 against fold enrichment of 1.
AKR1C3 Regulates Lipid Droplet Formation in SGBS Adipocytes
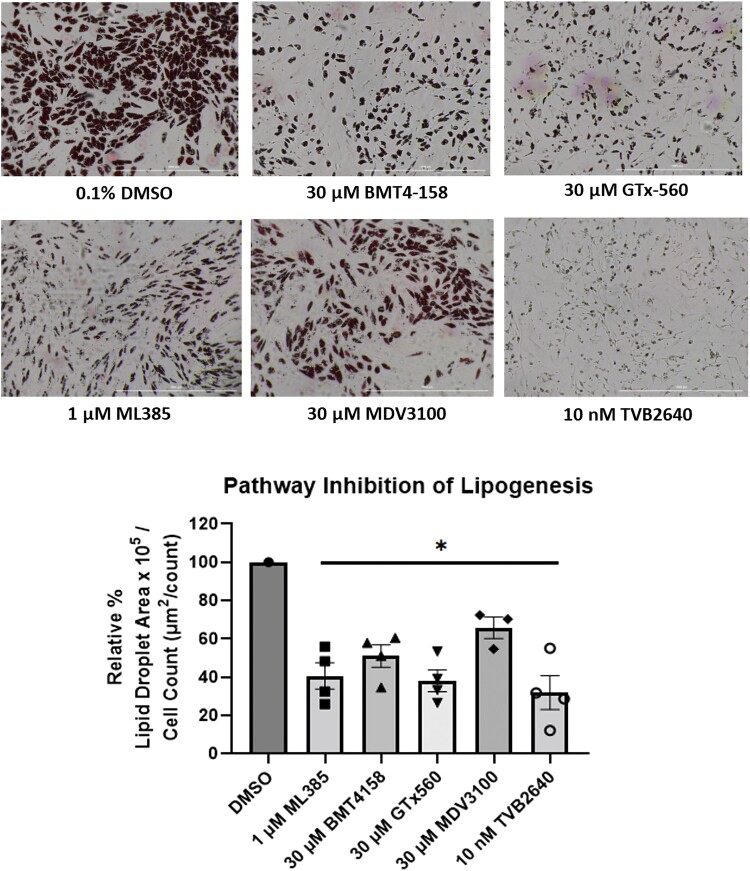
Treatment with ML385, BMT4-158, GTx-560, or enzalutamide downregulated lipid droplet formation (Fig. 8). TVB2640 (FASN inhibitor) produced a similar phenotype and showed that FASN is responsible for the visible lipid droplet formation in SGBS adipocytes. Therefore, inhibition of AKR1C3 or AR, which downregulated FASN, prevented lipid droplet formation in adipocytes.
Figure 8.
AKR1C3 regulates DNL in SGBS adipocytes: SGBS adipocytes were treated with pathway inhibitors and lipid droplet formation was quantified relative to cell count. Mean ± SEM was given for each condition (n = 3-4), and significance was determined by a 1-way ANOVA with *P < .05.
Discussion
AE and IR correlate with increased risk for cardiometabolic disease in PCOS women (5-10), but the mechanism of this disease progression is unknown. We have demonstrated that insulin dependent signaling induces AKR1C3 in differentiating adipocytes and that AKR1C3 is required for FASN expression and DNL.
Insulin induction of AKR1C3 is dependent on the PI3K/AKT/mTOR signaling axis and NRF2, a known transcription factor for AKR1C3, in adipocytes. Others reported that AKR1C3 is not PI3K dependent in fully differentiated adipocytes (45). In contrast, we have blocked the insulin induction of AKR1C3 in actively differentiating adipocytes using inhibitors of PI3K, AKT, mTOR, and NRF2. Across our experiments, there was a consistent reduction in AKR1C3 expression by 50%. We have reported a background induction of AKR1C3 during adipogenesis in the absence of insulin (17). Therefore, we could not completely eliminate the induction of AKR1C3 because there may be other noninsulin signaling pathways that induce AKR1C3. However, the PI3K/AKT/mTOR/NRF2 pathway accounts for all the AKR1C3 induction due to insulin. Our work elucidates how insulin activation at the cellular membrane leads to induction of AKR1C3.
We found that FASN expression was also dependent on the PI3K/AKT/mTOR/NRF2 signaling axis. Since both AKR1C3 and FASN were regulated by the same pathway, we investigated whether AKR1C3 regulates the induction of FASN. Genetic knockdown of either AKR1C3 or AR downregulated FASN, indicating that FASN is both AKR1C3 and AR dependent. We failed to see induction of FASN by 3 different AR agonists, yet FASN induction was dependent on AR. We hypothesized that there may be a basal level of AR activation that is sufficient for FASN induction without added androgens. Treatment with enzalutamide, an AR antagonist and AR degrader, confirmed this hypothesis. As FASN is dependent on both AKR1C3 and AR in the absence of exogenous androgens, we hypothesized that the known ability of AKR1C3 to stabilize AR (26, 27) may be sufficient for FASN induction.
We examined the effect of 2 classes of AKR1C3 inhibitors on FASN expression. Monofunctional inhibitors, BMT4-159 and ASP9521, did not downregulate FASN expression, whereas bifunctional inhibitors, indomethacin, BMT4-158, and GTx-560 downregulated FASN. The difference in effect between the 2 classes of inhibitors indicated that the catalytic activity of AKR1C3 is not required to regulate FASN. AKR1C3 is known to stabilize AR and indomethacin reverses this effect by increasing AR ubiquitination (26). We previously reported that BMT4-158 increases AR degradation in the presence and absence of DHT (29). Here, we showed that GTx-560 increases ubiquitination of AR. These agents have a common mechanism of destabilizing AR and suggests that the function of AKR1C3 is to stabilize AR thus inducing FASN.
We utilized various assays to determine if AKR1C3 interacts with AR in SGBS adipocytes. We visualized coexpression of the 2 proteins by immunofluorescence and confirmed their interaction by Co-IP and PLA in SGBS adipocytes. Using ChIP-qPCR, we determined the AKR1C3-AR interaction takes place on the FASN locus in the nucleus. We observed enhanced binding of AR to AREs on the FASN enhancer in a DHT-dependent manner. We showed that AKR1C3 was bound to the same AREs demonstrating that AKR1C3 lies in close proximity to AR on FASN. Since AKR1C3 was bound to the AREs in a DHT dependent manner and AKR1C3 has no known nuclear localization sequence, AKR1C3 was translocated to the nucleus by ligand-bound AR supporting interaction between these 2 proteins. We observed AKR1C3 and AR bound to the FASN AREs in the absence of exogenous androgens. The Dehm group showed that ARE1 was the most functionally active site compared with ARE2 and ARE3 by luciferase reporter gene assays (35). Most strikingly, we saw no androgen dependent binding of AR and AKR1C3 on ARE1. This indicated there is a basal level of AR activation bound to the FASN locus without androgens, which may be sufficient to induce FASN. This may explain why FASN could not be induced by exogenous androgens. Since we saw co-occupancy of AR and AKR1C3 on the AREs, AKR1C3 may stabilize AR not only in the cytoplasm but also in the nucleus on the FASN locus. This event could promote FASN induction explaining why FASN is dependent on AKR1C3 and AR.
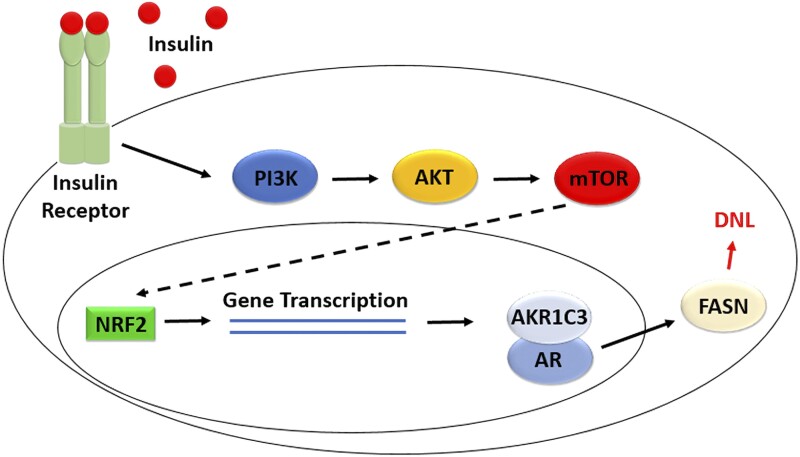
Finally, we showed that inhibition of the insulin signaling pathway, AKR1C3, or AR downregulated lipid droplet formation in the absence of androgens. The bifunctional AKR1C3 inhibitors downregulated FASN and inhibited DNL, whereas the monofunctional AKR1C3 inhibitors did not downregulate FASN and did not inhibit DNL (Fig. S5 (46)). This indicated that the catalytic activity of AKR1C3 is not required to regulate DNL. These data showed how the proposed pathway of FASN induction by AR and insulin-induced AKR1C3 regulates lipid formation in differentiating SGBS adipocytes (Fig. 9).
Figure 9.
Insulin-induced AKR1C3 interacts with AR to induce FASN to regulate DNL in SGBS adipocytes in the absence of added androgens.
Our experiments elucidated how insulin signaling induces AKR1C3 and how AKR1C3, by stabilizing AR, induces FASN in SGBS adipocytes. Our model of PCOS adipocytes, which recapitulated increased AKR1C3 expression in the adipocytes of PCOS women, reveals a unique role of AKR1C3 in regulating DNL due to insulin induction and how IR may drive the increased cardiometabolic risk in women with PCOS. We have previously reported that increased expression of AKR1C3 led to increased potent androgen production in SGBS adipocytes (17). Hyperandrogenism could just be a by-product of AKR1C3 expression in adipocytes that is independent of its ability to increase cardiometabolic disease in PCOS. The unique role of insulin-induced AKR1C3 is to induce FASN independent of exogenous androgens and its enzymatic function by stabilizing AR. We observed AR bound to ARE1 without DHT and there was not increased binding with DHT. Therefore, FASN may already be maximally expressed during differentiation, which is why adding androgens had no effect.
The ability of AR to activate gene transcription without ligand has been previously observed. Possible mechanisms include variation in the menu of coactivators/corepressors (47, 48), direct phosphorylation of AR (49, 50), or phosphorylation of the coactivators like SRC-1 (51) to enhance AR activity. Additionally, there may be cross-talk with other nuclear receptors that could drive AR activation (52). The N-terminal domain may be critical for AR activation without ligand. This domain may be a site for coactivator binding to promote AR constitutive transcriptional activity (53, 54). Therefore, AR splice variants that lack the ligand binding domain can be critical players for this constitutive AR response. Regardless of the mechanism of AR activation in the absence of androgens, AR is known to drive gene transcription without ligand. Therefore, proteins such as AKR1C3 can stabilize AR, making it available to be regulated by these other mechanisms to promote DNA binding and gene transcription.
There are a number of weaknesses in our study. Even though androgens did not induce FASN, they may induce other key enzymes in the lipogenesis pathway (eg, acetyl CoA carboxylase), inhibit lipolysis, or inhibit fatty acid β-oxidation either of which could promote lipid overload. O’Reilly et al showed that when 4AD to T conversion was blocked in subcutaneous adipose tissue with an AKR1C3 monofunctional inhibitor incorporation of [14C]-acetate into total lipid was attenuated (15). However, the effect of androgens on lipogenesis may be independent of FASN, since in SGBS adipocytes T and DHT induced acetyl CoA carboxylase and inhibited fatty acid β-oxidation (15). Furthermore, the effects we observed on FASN and lipid droplet formation were seen in the absence of added androgens further supporting the nonenzymatic role of AKR1C3.
Our experiments were only conducted with 1 cell type that analyzed the intracrine changes stimulated with insulin. As a result, we could only study DNL from adipocytes. It is unknown how these differentiating adipocytes might be affected by lipid metabolism elsewhere and by paracrine hormones or other cytokine networks. It is unknown how factors such as high-density lipoprotein, low-density lipoprotein, very–low-density lipoprotein, and chylomicrons may affect the regulation of fatty acid uptake, lipolysis, or β-fatty acid oxidation in our studies. It is possible that the effects observed in adipocytes could become exacerbated once we consider fat production from other tissues and fat intake due to a Western diet.
Our cellular model is dependent on a fixed amount of insulin. However, as patients with PCOS develop IR this would increase insulin secretion and dysregulate insulin signaling further. In our system, we only modeled physiological insulin stimulation, and a future direction is to determine how IR alters AKR1C3 and FASN induction in adipocytes. O’Reilly et al, showed that SGBS adipocytes mirror the properties of subcutaneous adipocytes from patients with PCOS (15, 18). Although, the SGBS adipocyte model allowed us to conduct these detailed mechanistic studies, it will be important to validate our mechanism in adipocytes from patients with PCOS to determine if insulin alone can drive DNL or if androgens can induce FASN. A clinical study with sufficient sample size across the 4 different phenotypes of women with PCOS would be required to further support these findings. Additionally, endogenous androgens in SGBS adipocytes that are below the limit of detection of our UPLC-HRMS assay (<1 pg) (17) may have activated AR.
Together our work emphasizes how AKR1C3 may be a missing link to understand the mechanistic interplay of how AE and IR may promote the increased cardiometabolic risk in PCOS women. Correlation studies exist that link these components of the syndrome, but the lack of mechanistic studies have made it difficult to understand why this increased risk occurs. Although insulin-induced AKR1C3 in adipocytes may contribute to hyperandrogenism in PCOS, we have implicated insulin-induced AKR1C3 in the induction of FASN in an androgen-independent manner. AKR1C3 induction of FASN would increase lipid overload in PCOS adipocytes, which presents AKR1C3 as a potential therapeutic target for bifunctional inhibitors to reduce the increased risk of cardiometabolic disease in PCOS women.
Abbreviations
- 4AD
Δ4-androstene-3,17-dione
- AE
androgen excess
- AKR1C3
aldo-keto reductase family 1 member C3
- AKT
protein kinase B
- ANOVA
analysis of variance
- AR
androgen receptor
- ARE
AR response element
- ChIP
chromatin immunoprecipitation
- Co-IP
co-immunoprecipitation
- DAPI
4′,6-diamidino-2-phenylindole
- DHT
5α-dihydrotestosterone
- DNL
de novo lipogenesis
- FASN
fatty acid synthase
- HRMS
high-resolution mass spectrometry
- IR
insulin resistance
- mTOR
mammalian target of rapamycin
- NRF2
nuclear factor-erythroid 2-related factor 2
- PBS
phosphate-buffered saline
- PBST
PBS containing 0.1% Tween 20
- PCOS
polycystic ovary syndrome
- PI3K
phosphoinositide 3-kinase
- PLA
proximity ligation assay
- RT-qPCR
reverse transcription quantitative polymerase chain reaction
- SDS
sodium dodecyl sulfate
- SGBS
Simpson–Golabi–Behmel syndrome
- T
testosterone
- TBST
Tris-buffered saline containing 0.1% Tween 20
- UPLC
ultrahigh-performance liquid chromatography
Contributor Information
Ryan D Paulukinas, Department of Systems Pharmacology and Translational Therapeutics, University of Pennsylvania, Philadelphia 19104-6061, PA, USA; Center of Excellence in Environmental Toxicology, Perelman School of Medicine, University of Pennsylvania, Philadelphia 19104-6061, PA, USA.
Trevor M Penning, Department of Systems Pharmacology and Translational Therapeutics, University of Pennsylvania, Philadelphia 19104-6061, PA, USA; Center of Excellence in Environmental Toxicology, Perelman School of Medicine, University of Pennsylvania, Philadelphia 19104-6061, PA, USA.
Funding
This work was supported by grants from the National Institutes of Health as follows: P30-ES013508 (awarded to T.M.P.) and R.D.P. was supported by T32-ES019851.
Disclosures
T.M.P. is founder of Penzymes, LLC; he is a consultant for Propella therapeutics and member of the Expert Panel for the Research Institute of Fragrance Materials.
Data Availability
Original data generated and analyzed during this study are included in this published article or in the data repositories listed in the references.
References
- 1. Teede HJ, Misso ML, Costello MF, et al. Recommendations from the international evidence-based guideline for the assessment and management of polycystic ovary syndrome. Hum Reprod (Oxford, England). 2018;33(9):1602-1618. [DOI] [PMC free article] [PubMed] [Google Scholar]
- 2. Franks S, Gharani N, Waterworth D, et al. Genetics of polycystic ovary syndrome. Mol Cell Endocrinol. 1998;145(1-2):123-128. [DOI] [PubMed] [Google Scholar]
- 3. Goodman NF, Cobin RH, Futterweit W, Glueck JS, Legro RS, Carmina E. American Association of Clinical Endocrinologists, American College of Endocrinology, and Androgen Excess and PCOS Society Disease State Clinical Review: Guide to the best practice in the evaluation and treatment of polycystic ovarian syndrome – part 1. Endocr Practice. 2015;21(11):1291-1300. [DOI] [PubMed] [Google Scholar]
- 4. Hoeger KM, Dokras A, Piltonen T. Update on PCOS: consequences, challenges, and guiding treatment. J Clin Endocrinol Metab. 2021;106(3):e1071-e1083. [DOI] [PubMed] [Google Scholar]
- 5. Falsetti L, Galbignani E. Long-term treatment with the combination ethinylestradiol and cyproterone acetate in polycystic ovary syndrome. Contraception. 1990;42(6):611-619. [DOI] [PubMed] [Google Scholar]
- 6. Falsetti L, Pasinetti E. Effects of long-term administration of an oral contraceptive containing ethinylestradiol and cyproterone acetate on lipid metabolism in women with polycystic ovary syndrome. Acta Obstet Gynecol Scand. 1995;74(1):56-60. [DOI] [PubMed] [Google Scholar]
- 7. Halperin IJ, Kumar SS, Stroup DF, Laredo SE. The association between the combined oral contraceptive pill and insulin resistance, dysglycemia and dyslipidemia in women with polycystic ovary syndrome: a systematic review and meta-analysis of observational studies. Hum Reprod (Oxford, England). 2011;26(1):191-201. [DOI] [PubMed] [Google Scholar]
- 8. Coenen CM, Thomas CM, Borm GF, Hollanders JM, Rolland R. Changes in androgens during treatment with four low-dose contraceptives. Contraception. 1996;53(3):171-176. [DOI] [PubMed] [Google Scholar]
- 9. Penning TM. AKR1C3 (type 5 17beta-hydroxysteroid dehydrogenase/prostaglandin F synthase): roles in malignancy and endocrine disorders. Mol Cell Endocrinol. 2019;489:82-91. [DOI] [PMC free article] [PubMed] [Google Scholar]
- 10. Franks S, Gharani N, Gilling-Smith C. Polycystic ovary syndrome: evidence for a primary disorder of ovarian steroidogenesis. J Steroid Biochemistry Mol Biol. 1999;69(1-6):269-272. [DOI] [PubMed] [Google Scholar]
- 11. Penning TM, Wangtrakuldee P, Auchus RJ. Structural and functional biology of Aldo-Keto reductase steroid-transforming enzymes. Endocr Rev. 2019;40(2):447-475. [DOI] [PMC free article] [PubMed] [Google Scholar]
- 12. Quinkler M, Sinha B, Tomlinson JW, Bujalska IJ, Stewart PM, Arlt W. Androgen generation in adipose tissue in women with simple obesity–a site-specific role for 17beta-hydroxysteroid dehydrogenase type 5. J Endocrinol. 2004;183(2):331-342. [DOI] [PubMed] [Google Scholar]
- 13. Blouin K, Blanchette S, Richard C, Dupont P, Luu-The V, Tchernof A. Expression and activity of steroid aldoketoreductases 1C in omental adipose tissue are positive correlates of adiposity in women. Am J Physiol Endocrinol Metab. 2005;288(2):E398-E404. [DOI] [PubMed] [Google Scholar]
- 14. Wang L, Li S, Zhao A, et al. The expression of sex steroid synthesis and inactivation enzymes in subcutaneous adipose tissue of PCOS patients. J Steroid Biochem Mol Biol. 2012;132(1-2):120-126. [DOI] [PubMed] [Google Scholar]
- 15. O’Reilly MW, Kempegowda P, Walsh M, et al. AKR1C3-mediated adipose androgen generation drives lipotoxicity in women with polycystic ovary syndrome. J Clin Endocrinol Metab. 2017;102(9):3327-3339. [DOI] [PMC free article] [PubMed] [Google Scholar]
- 16. Dumesic DA, Tulberg A, McNamara M, et al. Serum testosterone to androstenedione ratio predicts metabolic health in normal-weight polycystic ovary syndrome women. J Endocr Soc. 2021;5(11):bvab158. [DOI] [PMC free article] [PubMed] [Google Scholar]
- 17. Paulukinas RD, Mesaros CA, Penning TM. Conversion of classical and 11-oxygenated androgens by insulin-induced AKR1C3 in a model of human PCOS adipocytes. Endocrinology. 2022;163(7):bqac068. [DOI] [PMC free article] [PubMed] [Google Scholar]
- 18. O’Reilly M, Gathercole L, Capper F, Arlt W, Tomlinson J. Effect of insulin on AKR1C3 expression in female adipose tissue: in-vivo and in-vitro study of adipose androgen generation in polycystic ovary syndrome. Lancet (London, England). 2015;385(Suppl 1):S16. [DOI] [PubMed] [Google Scholar]
- 19. Lee J, Pilch PF. The insulin receptor: structure, function, and signaling. Am J Physiol. 1994;266(2):C319-C334. [DOI] [PubMed] [Google Scholar]
- 20. Sutherland C, O'Brien RM, Granner DK. Insulin action gene regulation. In: Madame Curie Bioscience Database [Internet]. Landes Bioscience; 2000–2013. Accessed September 27, 2022. https://www.ncbi.nlm.nih.gov/books/NBK6471/
- 21. Fantl WJ, Johnson DE, Williams LT. Signalling by receptor tyrosine kinases. Annu Rev Biochem. 1993;62(1):453-481. [DOI] [PubMed] [Google Scholar]
- 22. Li T, Mo H, Chen W, et al. Role of the PI3K-Akt signaling pathway in the pathogenesis of polycystic ovary syndrome. Reprod Sci. 2017;24(5):646-655. [DOI] [PubMed] [Google Scholar]
- 23. Dunaif A. Insulin resistance and the polycystic ovary syndrome: mechanism and implications for pathogenesis. Endocr Rev. 1997;18(6):774-800. [DOI] [PubMed] [Google Scholar]
- 24. Swinnen JV, Esquenet M, Goossens K, Heyns W, Verhoeven G. Androgens stimulate fatty acid synthase in the human prostate cancer cell line LNCaP. Cancer Res. 1997;57(6):1086-1090. [PubMed] [Google Scholar]
- 25. Wang Y, Jones Voy B, Urs S, et al. The human fatty acid synthase gene and de novo lipogenesis are coordinately regulated in human adipose tissue. J Nutr. 2004;134(5):1032-1038. [DOI] [PubMed] [Google Scholar]
- 26. Liu C, Yang JC, Armstrong CM, et al. AKR1C3 promotes AR-V7 protein stabilization and confers resistance to AR-targeted therapies in advanced prostate cancer. Mol Cancer Therap. 2019;18(10):1875-1886. [DOI] [PMC free article] [PubMed] [Google Scholar]
- 27. Wang B, Wu S, Fang Y, et al. The AKR1C3/AR-V7 complex maintains CRPC tumour growth by repressing B4GALT1 expression. J Cell Mol Med. 2020;24(20):12032-12043. [DOI] [PMC free article] [PubMed] [Google Scholar]
- 28. Adeniji AO, Twenter BM, Byrns MC, et al. Development of potent and selective inhibitors of aldo-keto reductase 1C3 (type 5 17β-hydroxysteroid dehydrogenase) based on N-phenyl-aminobenzoates and their structure-activity relationships. J Med Chem. 2012;55(5):2311-2323. [DOI] [PMC free article] [PubMed] [Google Scholar]
- 29. Wangtrakuldee P, Adeniji AO, Zang T, et al. A 3-(4-nitronaphthen-1-yl) amino-benzoate analog as a bifunctional AKR1C3 inhibitor and AR antagonist: head to head comparison with other advanced AKR1C3 targeted therapeutics. J Steroid Biochem Mol Biol. 2019;192:105283. [DOI] [PMC free article] [PubMed] [Google Scholar]
- 30. Fischer-Posovszky P, Newell FS, Wabitsch M, Tornqvist HE. Human SGBS cells - a unique tool for studies of human fat cell biology. Obes Facts. 2008;1(4):184-189. [DOI] [PMC free article] [PubMed] [Google Scholar]
- 31. Paulukinas RD, Penning TM. Insulin-induced AKR1C3 induces fatty acid synthase in a model of human PCOS adipocytes: Figure S1. Figshare Repository. Deposited 25 January 2023. 10.6084/m9.figshare.21957131.v1 [DOI] [PMC free article] [PubMed]
- 32. Bauman DR, Steckelbroeck S, Peehl DM, Penning TM. Transcript profiling of the androgen signal in normal prostate, benign prostatic hyperplasia, and prostate cancer. Endocrinology. 2006;147(12):5806-5816. [DOI] [PubMed] [Google Scholar]
- 33. Lin HK, Steckelbroeck S, Fung KM, Jones AN, Penning TM. Characterization of a monoclonal antibody for human aldo-keto reductase AKR1C3 (type 2 3alpha-hydroxysteroid dehydrogenase/type 5 17beta-hydroxysteroid dehydrogenase); immunohistochemical detection in breast and prostate. Steroids. 2004;69(13-14):795-801. [DOI] [PubMed] [Google Scholar]
- 34. Galhardo M, Sinkkonen L, Berninger P, Lin J, Sauter T, Heinäniemi M. ChIP-seq profiling of the active chromatin marker H3K4me3 and PPARγ, CEBPα and LXR target genes in human SGBS adipocytes. Genom Data. 2014;2:230-236. [DOI] [PMC free article] [PubMed] [Google Scholar]
- 35. Chan SC, Selth LA, Li Y, et al. Targeting chromatin binding regulation of constitutively active AR variants to overcome prostate cancer resistance to endocrine-based therapies. Nucleic Acids Res. 2015;43(12):5880-5897. [DOI] [PMC free article] [PubMed] [Google Scholar]
- 36. Paulukinas RD, Penning TM. Insulin-induced AKR1C3 induces fatty acid synthase in a model of human PCOS adipocytes: Figure S2. Figshare Repository. Deposited 25 January 2023. 10.6084/m9.figshare.21957137.v1 [DOI] [PMC free article] [PubMed]
- 37. Agyeman AS, Chaerkady R, Shaw PG, et al. Transcriptomic and proteomic profiling of KEAP1 disrupted and sulforaphane-treated human breast epithelial cells reveals common expression profiles. Breast Cancer Res Treat. 2012;132(1):175-187. [DOI] [PMC free article] [PubMed] [Google Scholar]
- 38. MacLeod AK, McMahon M, Plummer SM, et al. Characterization of the cancer chemopreventive NRF2-dependent gene battery in human keratinocytes: demonstration that the KEAP1-NRF2 pathway, and not the BACH1-NRF2 pathway, controls cytoprotection against electrophiles as well as redox-cycling compounds. Carcinogenesis. 2009;30(9):1571-1580. [DOI] [PMC free article] [PubMed] [Google Scholar]
- 39. Pan D, Yang W, Zeng Y, et al. AKR1C3 Regulated by NRF2/MAFG complex promotes proliferation via stabilizing PARP1 in hepatocellular carcinoma. Oncogene. 2022;41(31):3846-3858. [DOI] [PubMed] [Google Scholar]
- 40. Singh A, Venkannagari S, Oh KH, et al. Small molecule inhibitor of NRF2 selectively intervenes therapeutic resistance in KEAP1-deficient NSCLC tumors. ACS Chem Biol. 2016;11(11):3214-3225. [DOI] [PMC free article] [PubMed] [Google Scholar]
- 41. Erb HHH, Oster MA, Gelbrich N, et al. Enzalutamide-induced proteolytic degradation of the androgen receptor in prostate cancer cells is mediated only to a limited extent by the proteasome system. Anticancer Res. 2021;41(7):3271-3279. [DOI] [PubMed] [Google Scholar]
- 42. Yepuru M, Wu Z, Kulkarni A, et al. Steroidogenic enzyme AKR1C3 is a novel androgen receptor-selective coactivator that promotes prostate cancer growth. Clin Cancer Res. 2013;19(20):5613-5625. [DOI] [PubMed] [Google Scholar]
- 43. Paulukinas RD, Penning TM. Insulin-induced AKR1C3 induces fatty acid synthase in a model of human PCOS adipocytes: Figure S3. Figshare Repository. Deposited 25 January 2023. 10.6084/m9.figshare.21957146.v1 [DOI] [PMC free article] [PubMed]
- 44. Paulukinas RD, Penning TM. Insulin-induced AKR1C3 induces fatty acid synthase in a model of human PCOS adipocytes: Figure S4. Figshare Repository. Deposited 25 January 2023. 10.6084/m9.figshare.21957149.v1 [DOI] [PMC free article] [PubMed]
- 45. Amer SA, Alzanati NG, Warren A, Tarbox R, Khan R. Excess androgen production in subcutaneous adipose tissue of women with polycystic ovarian syndrome is not related to insulin or LH.J Endocrinol. Published online February 1, 2019. Doi: 10.1530/JOE-18-0674 [DOI] [PubMed]
- 46. Paulukinas RD, Penning TM. Insulin-induced AKR1C3 induces fatty acid synthase in a model of human PCOS adipocytes: Figure S5. Figshare Repository. Deposited 25 January 2023. 10.6084/m9.figshare.21957152.v1 [DOI] [PMC free article] [PubMed]
- 47. Ma H, Hong H, Huang SM, et al. Multiple signal input and output domains of the 160-kilodalton nuclear receptor coactivator proteins. Mol Cell Biol. 1999;19(9):6164-6173. [DOI] [PMC free article] [PubMed] [Google Scholar]
- 48. Long MD, Jacobi JJ, Singh PK, et al. Reduced NCOR2 expression accelerates androgen deprivation therapy failure in prostate cancer. Cell Rep. 2021;37(11):110109. [DOI] [PMC free article] [PubMed] [Google Scholar]
- 49. Nazareth LV, Weigel NL. Activation of the human androgen receptor through a protein kinase A signaling pathway. J Biol Chem. 1996;271(33):19900-19907. [DOI] [PubMed] [Google Scholar]
- 50. Sadar MD. Androgen-independent induction of prostate-specific antigen gene expression via cross-talk between the androgen receptor and protein kinase A signal transduction pathways. J Biol Chem. 1999;274(12):7777-7783. [DOI] [PubMed] [Google Scholar]
- 51. Ueda T, Mawji NR, Bruchovsky N, Sadar MD. Ligand-independent activation of the androgen receptor by interleukin-6 and the role of steroid receptor coactivator-1 in prostate cancer cells. J Biol Chem. 2002;277(41):38087-38094. [DOI] [PubMed] [Google Scholar]
- 52. Long MD, Singh PK, Russell JR, et al. The miR-96 and RARγ signaling axis governs androgen signaling and prostate cancer progression. Oncogene. 2019;38(3):421-444. [DOI] [PMC free article] [PubMed] [Google Scholar]
- 53. Dehm SM, Tindall DJ. Ligand-independent androgen receptor activity is activation function-2-independent and resistant to antiandrogens in androgen refractory prostate cancer cells. J Biol Chem. 2006;281(38):27882-27893. [DOI] [PubMed] [Google Scholar]
- 54. Quayle SN, Mawji NR, Wang J, Sadar MD. Androgen receptor decoy molecules block the growth of prostate cancer. Proc Natl Acad Sci U S A. 2007;104(4):1331-1336. [DOI] [PMC free article] [PubMed] [Google Scholar]
Associated Data
This section collects any data citations, data availability statements, or supplementary materials included in this article.
Data Availability Statement
Original data generated and analyzed during this study are included in this published article or in the data repositories listed in the references.


