

Abstract
Insect decline is a major threat to ecosystems around the world as they provide many important functions, such as pollination or pest control. Pollution is one of the main reasons for the decline, alongside changes in land use, global warming, and invasive species. While negative impacts of pesticides are well‐studied, there is still a lack of knowledge about the effects of other anthropogenic pollutants, such as airborne particulate matter, on insects. To address this, we exposed workers of the bumblebee Bombus terrestris to sublethal doses of diesel exhaust particles (DEPs) and brake dust, orally or via air. After 7 days, we looked at the composition of the gut microbiome and tracked changes in gene expression. While there were no changes in the other treatments, oral DEP exposure significantly altered the structure of the gut microbiome. In particular, the core bacterium Snodgrassella had a decreased abundance in the DEP treatment. Similarly, transcriptome analysis revealed changes in gene expression after oral DEP exposure, but not in the other treatments. The changes are related to metabolism and signal transduction, which indicates a general stress response. Taken together, our results suggest potential health effects of DEP exposure on insects, here shown in bumblebees, as gut dysbiosis may increase the susceptibility of bumblebees to pathogens, while a general stress response may lower available energy resources. Those effects may exacerbate under natural conditions where insects face a multiple‐stressor environment.
Keywords: air pollution, brake dust, insect decline, particulate matter, pollinator, transcriptome
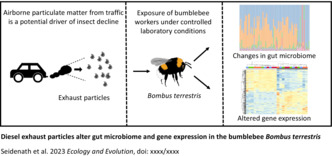
Here we studied if airborne particulate matter from traffic is a potential driver of insect decline. We exposed workers of the bumblebee Bombus terrestris to sublethal doses of diesel exhaust particles and brake dust, orally or via air. Oral exposure to diesel exhaust particles changed microbiome composition and altered gene expression.
1. INTRODUCTION
Global biodiversity loss is one of the major challenges humanity currently faces (Díaz et al., 2006; Dirzo et al., 2014). Especially the rapid decline in insects is cause for concern, as they provide or contribute to many important ecosystem functions such as pollination, nutrient cycling, pest control, and linking trophic levels (Cardoso et al., 2020; Noriega et al., 2018). Pollution is one of the major reasons for the decline alongside intensification of land use, climate change, and invasive species (Miličić et al., 2021; Sánchez‐Bayo & Wyckhuys, 2019).
Pesticides harm insects on many different levels ranging from subtle changes in the gut microbiome over behavioral changes to increased mortality (Desneux et al., 2007; Motta et al., 2018; Ndakidemi et al., 2016). Other anthropogenic pollutants might also contribute to the observed declines in insects, but their impacts are often less well‐studied (Cameron & Sadd, 2020; Feldhaar & Otti, 2020; Sánchez‐Bayo & Wyckhuys, 2019). Airborne particulate matter deriving from traffic or industrial processes has become ubiquitous in the environment (Gieré & Querol, 2010; Zereini & Wiseman, 2010). While the harmful effects on mammals, in particular humans, have been intensively studied, research investigating the impact on insects remains scarce (Kim et al., 2015; Valavanidis et al., 2008). Insects can encounter these pollutants in various ways, for example, by foraging in contaminated areas, consuming contaminated food, or direct deposition on the insect's cuticle (Feldhaar & Otti, 2020; Łukowski et al., 2018; Negri et al., 2015). The airborne particulate matter might enter an insect's body via oral ingestion or the tracheal system (Feldhaar & Otti, 2020; Negri et al., 2015). Social insects might be at an increased risk, as pollutants are transferred to and stored in their nests, which could lead to a higher exposure to conspecifics and the brood (Feldhaar & Otti, 2020; Hladun et al., 2016).
Vehicle brake dust and diesel exhaust particles (DEPs) are major classes of airborne particulate matter deriving from traffic released into the environment (Hamilton & Hartnett, 2013; Harrison et al., 2012; Rönkkö & Timonen, 2019). Brake dust particles contain various metals and phenolic compounds, depending on the brake lining used (Iijima et al., 2007; Thorpe & Harrison, 2008). Exposure of different invertebrate species to such particles showed mixed effects. Particulate matter contamination in soil did not affect colony founding in the ant Lasius niger (Seidenath et al., 2021). However, soil‐feeding earthworms (Eisenia fetida) showed a strongly increased mortality when exposed to soil spiked with brake dust particles (Holzinger et al., 2022). DEPs have a different composition than brake dust. They are composed of an elemental carbon core with adsorbed organic compounds, such as polycyclic aromatic hydrocarbons (PAHs), and traces of metals and other elements (Greim, 2019; Wichmann, 2007). Exposure to high doses of diesel exhaust particles (1 and 2 g/L) in food over a period of 7 days reduced survival in Bombus terrestris workers compared to controls by nearly 50 percent (Hüftlein et al., 2023).
Many classical ecotoxicology approaches focus on the effect of a substance on mortality, growth, or reproduction. However, pollutants can also have more subtle sublethal effects on insects, which may have severe consequences in the long term (Straub et al., 2020). Direct sublethal effects include changes in physiology such as stress reactions or detoxification processes. By interacting with microorganisms inside the insect's body, oral exposure to pollutants may indirectly affect insect health.
Most eukaryotic organisms and their associated microbes form an entity, the so‐called holobiont (Theis et al., 2016; Zilber‐Rosenberg & Rosenberg, 2008). In insects, microorganisms can be found in the digestive tract, the exoskeleton, the hemocoel, or within cells (Douglas, 2015). The insect gut microbiome has a range of functions that include protection from pathogens, detoxification, digestion, and the production of essential nutrients (Engel & Moran, 2013). Social bumblebees (Bombus spp.) and honeybees (Apis mellifera) are model organisms to study gut microbiota as their gut microbiome is rather simple and highly conserved (Engel et al., 2016; Kwong & Moran, 2016; Zhang & Zheng, 2022). A few core bacterial taxa dominate the gut microbiome of bumblebees: Snodgrassella, Gilliamella, Schmidhempelia, Bifidobacteriaceae (Bifidobacterium and Bombiscardovia), and two clusters within Lactobacillaceae (Hammer et al., 2021; Koch & Schmid‐Hempel, 2011a; Martinson et al., 2011). While many functions of the bacterial symbionts in bumblebees have been proposed, only very few have been demonstrated in experiments (Hammer et al., 2021; Zhang & Zheng, 2022). The gut microbiome of bumblebees may be important for detoxification as microbiota‐free individuals had lower survival when exposed to toxic concentrations of selenate (Rothman et al., 2019). Moreover, resistance to the common trypanosomatid parasite Crithidia bombi is higher in bumblebees with an intact microbiome compared to microbiota‐free individuals (Koch & Schmid‐Hempel, 2011b). When infected with C. bombi the outcome varies with host microbiota composition rather than genotype (Koch & Schmid‐Hempel, 2012).
Examining the effects of anthropogenic pollutants, such as airborne particulate matter, on the gut microbiome is an important tool for assessing their risk for insect health (Duperron et al., 2020). Even with a conserved gut microbiome, the relative abundance of core bacteria and the presence of other microorganisms will vary with age, diet, and changing environmental parameters (Koch et al., 2012; Kwong & Moran, 2016). Different pollutants affect the microbial composition of bee guts. In honeybee workers, pesticides or antibiotics change the relative and absolute abundance of core gut microbiota species (DeGrandi‐Hoffman et al., 2017; Motta et al., 2018; Raymann et al., 2017). An array of environmental toxicants, such as cadmium, copper, selenate, and hydrogen peroxide, alter the gut microbiome of Bombus impatiens at field‐realistic concentrations (Rothman et al., 2020). These shifts in the microbial community may affect bumblebee health. Intestinal dysbiosis, compositional and functional alteration of the microbiome, is associated with various diseases and health problems in humans and vertebrates (DeGruttola et al., 2016; Levy et al., 2017; Shreiner et al., 2015). In insects, dysbiosis negatively affects reproductive fitness, immunity, and resistance to pathogens (Ami et al., 2010; Daisley et al., 2020; Raymann et al., 2017).
Transcriptome analysis is a sensitive tool to characterize sublethal effects of potentially harmful substances on a molecular and cellular level (Prat & Degli‐Esposti, 2019; Schirmer et al., 2010). Changes in gene expression help to identify biological processes, such as stress responses and detoxification processes, at an early stage. Exposure to different pollutants have been shown to induce changes in gene expression in several insect species. Mosquitos (Aedes aegypti) exposed to anthropogenic pollutants (insecticides, PAHs) increased the expression of genes related to detoxification, respiration, and cuticular proteins (David et al., 2010). Fireflies (Luciola leii) showed a similar response when exposed to benzo(a)pyrene, a widespread PAH (Zhang et al., 2019). In different bee species, the neonicotinoids imidacloprid, thiamethoxan, and clothianidin induce an upregulation of metabolic, immune, and stress response genes (Aufauvre et al., 2014; Bebane et al., 2019; Christen et al., 2018; Colgan et al., 2019; Gao et al., 2020; Shi et al., 2017). The expression of genes related to detoxification was higher in honeybees (A. mellifera) exposed to heavy metals than in controls (Al Naggar et al., 2020; Gizaw et al., 2020; Zhang et al., 2018).
In contrast to pesticides, the effects of other environmental pollutants, such as particulate matter, on gene expression in bees as well as their gut microbiome are largely unclear. To address this knowledge gap, we exposed workers of the buff‐tailed bumblebee Bombus terrestris to airborne particulate matter deriving from traffic and investigated changes in the gut microbiome and gene expression. Bumblebees were fed sugar water spiked with sublethal concentrations of brake dust or diesel exhaust particles (DEPs). Adding to this oral exposure, one group of bumblebees was exposed to DEPs via air to enable potential uptake in the tracheal system. We expect changes in the composition of the gut microbial community, as previous research showed changes due to different metals in a closely related Bombus species (Rothman et al., 2020). Moreover, we expect changes in the expression of detoxification and metabolic genes, indicating an increased stress level, as the toxic compounds in the particulate matter may interfere with bumblebee physiology.
2. METHODS
2.1. Bumblebee keeping
Four queenright colonies of B. terrestris were ordered from Biobest (Westerlo, Belgium) in March 2021. Colonies were kept in a climate chamber at 26°C and 70% humidity under a constant, inverted 12:12 h light: dark cycle. Colonies were provided with sugar water (50% Apiinvert, Südzucker AG, Mannheim, Germany) and pollen (Imkerpur, Osnabrück, Germany) ad libitum.
2.2. Dose selection
The data on airborne particulate matter in terrestrial environments is sparse as it is difficult to quantify and identify the origin. Evidence for high levels of input of airborne particulate matter are often revealed only after it has settled, for example, by analyzing soil samples. Unnaturally high amounts of specific metals could be attributed to external resources such as brake dust (Alsbou & Al‐Khashman, 2018; Peikertova & Filip, 2016). Isotopic analyses of urban soils in Arizona revealed up to 0.54% (w/w) as soot carbon black presumably produced by burning fossil fuels (Hamilton & Hartnett, 2013). While bees are contaminated by airborne particulate matter in the wild, we have no data or modeling on the uptake of these particles (Negri et al., 2015). In previous experiments, chronic oral DEP exposure over 7 days reduced survival of bumblebees when exposed to concentrations of 1 g/L and more (Hüftlein et al., 2023). Oral exposure to brake dust particles reduced survival after 7 days for a concentration of 8 g/L (F. Hüftlein, D. Seidenath, A. Mittereder, T. Hillenbrand, D. Brüggemann, O. Otti, H. Feldhaar, C. Laforsch, M. Schott, unpublished data). For our microbiome and transcriptome experiment we selected sublethal doses of 0.4 g/L that did not affect mortality or fat body weight in previous experiments (F. Hüftlein, D. Seidenath, A. Mittereder, T. Hillenbrand, D. Brüggemann, O. Otti, H. Feldhaar, C. Laforsch, M. Schott, unpublished data). For the flight treatment boxes were contaminated with 1.5 mg of DEP and subsequently single workers released into the boxes. DEP was dispersed by the flight movements of the workers and at this concentration we observed a substantial contamination of the bumblebees on their cuticle in this setup (see below).
2.3. Experimental procedure
At the beginning of the experiment, adult workers from the four colonies were randomly assigned to one of six treatments. Control: fed with sugar water only (50% Apiinvert) (n = 56); Solvent control: fed with sugar water spiked with 0.02% (v/v) of the emulsifier Tween20 (n = 56); Brake dust: fed with sugar water spiked with 0.02% (v/v) of the emulsifier Tween20 and 0.4 g/L brake dust particles (n = 56); DEP: fed with sugar water spiked with 0.02% (v/v) of the emulsifier Tween20 and 0.4 g/L diesel exhaust particles (n = 56); Flight control: fed with sugar water (50% Apiinvert) and allowed to fly once per day in a plastic box (7 × 7 × 5 cm, EMSA, Emsdetten, Germany) for 3 min (n = 24); DEP flight: fed with sugar water (50% Apiinvert) and allowed to fly once per day for 3 min in a plastic box (7 × 7 × 5 cm, EMSA, Emsdetten, Germany) that contained 1.5 (±0.1) mg of diesel exhaust particles (n = 24).
The experiment was conducted in a climate chamber at 26°C and 70% humidity under a constant 12:12 h light: dark cycle. Bumblebees were kept in Nicot cages (Nicotplast SAS, Maisod, France) connected to a 12 mL syringe (B. Braun SE, Melsungen, Germany) with the tip cut off, that contained 2 mL of the respective feeding solution (ad libitum). Every day the syringes were replaced with fresh ones to prevent molding or bacterial growth in the food. The exposure lasted for 7 days. At the end of the experiment, the animals were frozen at −20°C.
Within a week after the end of the experiment, we randomly selected twelve (three workers per colony) bumblebees per treatment for transcriptome analysis (N = 72). Additionally, for the control, solvent control, brake dust, and DEP treatment, we randomly selected 20 bumblebees (five workers per colony) for microbiome analysis (N = 80), respectively.
2.4. Generation and collection of diesel exhaust particles (DEPs)
Diesel exhaust particles were collected from a four‐cylinder diesel engine (OM 651, Daimler AG, Stuttgart, Germany) during a repeating cycle of transient and stationary operating points, resembling an inner‐city driving scenario with stop‐and‐go intervals. The engine was operated on a test bench with a water‐cooled eddy‐current brake as previously described in Zöllner (2019). DEP samples were collected by an electrostatic precipitator (OekoTube Inside, Mels‐Plons, Switzerland). A fast response differential mobility particulate spectrometer DMS500 (Combustion, Cambridge, England) was applied to measure submicron particle size distributions of raw exhaust samples. Depending on engine load and speed during the inner‐city cycle, solid particles showed a median diameter between 52.1 ± 1.8 nm and 101.9 ± 1.7 nm. DEP composition was characterized by thermogravimetric analysis (TGA, STA 449 F5 Jupiter, Netzsch‐Gerätebau GmbH, Selb, Germany). A fraction of 72.2% ± 1.1% of the DEP mass was attributed to elemental carbon, 23.2% ± 0.9% w/w to organic fractions, and 4.6% ± 0.7% w/w to inorganic matter. Quantification of PAHs revealed concentrations of 444 ppm for pyrene, 220 ppm for phenanthrene, and 107 ppm for fluoranthene.
The elemental composition of the DEP samples was analyzed by inductively coupled plasma optical emission spectrometry (ICP‐OES, Optima 7300 DV, PerkinElmer Inc., Waltham, United States of America) and interpreted according to Zöllner (2019). It showed fractions of calcium (1.63% w/w), zinc (0.53% w/w), and phosphorus (0.50% w/w) that can be traced back to diesel fuel and lubrication oil. Copper (1.03% w/w), aluminum (0.02% w/w), and iron (0.02% w/w) can be attributed to abrasion of piston rings, cylinder head, and engine block material, respectively. In addition, small amounts of boron (0.13% w/w), magnesium (0.10% w/w), molybdenum (0.03% w/w), natrium (0.02% w/w), and sulfur (0.17% w/w) were found.
2.5. Generation of brake dust particles
The brake dust particles provided by the Chair of Ceramic Materials Engineering of the University of Bayreuth are derived from LowMet brake pads (provided by TMD Friction Holdings GmbH, Leverkusen, Germany) that were milled for 3 min in a vibrating cup mill with a tungsten carbide grinding set (Pulverisette 9, Fritsch GmbH, Idar‐Oberstein, Germany). LowMet brake pads are common and representative of passenger cars in Europe and consist of nonferrous metals (25% (w/w)), steel wool (15% (w/w)), petrol coke (12% (w/w)), sulfides (10% (w/w)), aluminum oxide (5% (w/w)), resin (5% (w/w)), graphite (4% (w/w)), mica (4% (w/w)), silicon carbide (3% (w/w)), barite (2% (w/w)), fibers (2% (w/w)), and rubber (1% (w/w)) (Wiaterek, 2012). The particle size distribution of the milled, fine‐grained powder was measured with a laser diffraction particle size analyzer (PSA 1190 LD, Anton Paar GmbH, Ostfildern‐Scharnhausen, Germany). The mean particle size found was 10.19 ± 4.37 μm (D10 = 0.68 μm (10% of all particles being smaller in diameter than this size), D50 = 5.76 μm (median particle size), D90 = 25.87 μm (90% of particles being smaller in diameter than this size)).
2.6. Bumblebee gut microbiome analysis
Prior to dissection bumblebees were defrosted and rinsed in 70% ethanol, 90% ethanol, and twice in ultrapure water. We placed each bumblebee on an autoclaved square of aluminum foil (5 × 5 cm) and opened the abdomen with sterilized tweezers and scissors. After carefully separating the midgut and hindgut from the crop and transferring it to an Eppendorf tube, we snap‐froze the gut in liquid nitrogen. All samples were stored at −80°C until further processing.
2.7. PCR amplification and sequencing of 16S rDNA fragments
Metagenomic DNA of bumblebee gut samples was purified using the NucleoMag DNA Bacteria kit (Macherey‐Nagel, no. 744310, Düren, Germany) after disruption of samples with 1.4 mm (diam.) ceramic beads (no. P000912‐LYSK0A, Bertin Instruments, Montigny‐le‐Bretonneux, France) in a FastPrep‐24 bead beating device (MPbio, Irvine, USA) following the instructions of the manufacturer. The metagenomic DNA was diluted to a concentration of 5 ng/μL, and 2.5 μL DNA was used to amplify 16S rDNA fragments using primers 515F‐Y (Turner et al., 1999) and 806RB (Apprill et al., 2015) as described in the 16S Metagenomic Sequencing Library Preparation protocol (Part # 15044223 Rev. B, www.illumina.com). Sample libraries were barcoded using the Nextera XT index kit (v2 set A, www.illumina.com), combined in equimolar amounts, and sequenced on Illumina's iSeq‐100 platform using a 293‐cycle single‐end R1 mode. Demultiplexing of reads was performed by the iSeq‐100 local run manager and sample‐specific reads were saved in FastQ format.
2.8. Microbiome analysis
Statistical analyses of the microbial data were performed using QIIME2 (Bolyen et al., 2019) and R 4.2.1 (R Core Team, 2022). Forward reads of 16S rDNA fragments (R1 reads) were analyzed using the QIIME2 microbiome analysis package (ver. 2021.11; Bolyen et al., 2019). Unless indicated otherwise, all analysis tools were used as plugins of the QIIME2 package. The respective parameters used along the analysis steps are readily accessible by provenance information in the QIIME2 data files (available as Appendix S1). In brief, the following analysis steps were performed: Demultiplexed reads were trimmed for 16S primer sequences (plugin cutadapt; Martin, 2011), denoised, dereplicated, and chimera‐checked (plugin DADA2; Callahan et al., 2016) resulting in amplified sequence variants (ASVs). Rare ASVs were filtered using the median frequency (=6) of ASVs over all samples. Taxonomic classification of ASVs was performed (plugin feature‐classifier; Bokulich et al., 2018) using the prefitted sklearn‐based taxonomy classifiers based on the SILVA reference database (ver. 138.1; Quast et al., 2013; Yilmaz et al., 2014). ASVs that could not be taxonomically assigned at any taxonomic level (‘unassigned’) as well as samples with less than 3900 reads in total were removed prior to subsequent analysis steps. Alpha diversity metrics, such as Shannon diversity index, Faith's phylogenetic diversity, Pielou's evenness, and observed ASVs, were obtained using the QIIME2's ‘core‐metrics‐phylogenetic’ workflow (plugin diversity), rarefied to 3900 reads per sample. To assess the overall effects of treatment and colony origin on microbial composition we performed permutational multivariate analysis of variance ADONIS from the R package vegan (Oksanen et al., 2022) in Qiime2. To find significant differences in α‐diversity we fitted generalized linear mixed models (GLMMs) with treatment as fixed factor and colony as random factor using the function glmmTMB from the package glmmTMB (Brooks et al., 2017). We checked model assumptions using model diagnostic test plots, that is, qqplot and residual vs. predicted plot from the package DHARMa (Hartig, 2022). We then produced statistics with the function Anova() from the package car (Fox & Weisberg, 2019) to calculate p‐values for differences between treatments. For significant treatment effects, we ran pairwise comparisons using Tukey HSD post‐hoc test with Benjamini‐Hochberg correction from the package multcomp (Hothorn et al., 2008). Differential abundance of the rarefied data we analyzed using the package DESeq2 with a negative binomial distribution, a significance level cutoff of FDR < 0.01, replacement of outliers turned off, and cooksCutoff turned off (Love et al., 2014). Compositional differential abundance analysis was performed using Aldex2 (plugin aldex2; Fernandes et al., 2013). Beta diversity of the sparse, compositional microbiome data were calculated using QIIME2's plugin DEICODE, which performs a robust Aitchison PCA (Martino et al., 2019). Significance was tested in a PERMANOVA with 999 permutations followed by pairwise PERMANOVA with Benjamini‐Hochberg (BH) correction for multiple testing (Anderson, 2008). We used the packages qiime2R (Bisanz, 2018) and mia (Ernst, Shetty, et al., 2022) to import and process the microbiome data in R. Data were arranged using the package tidyr (Wickham & Girlich, 2022) and were plotted using the packages ggplot2 (Wickham, 2016), ggpubr (Kassambara, 2020), and miaViz (Ernst, Borman, & Lahti, 2022).
2.9. Transcriptome analysis of whole bumblebee abdomens
Bumblebees were defrosted and rinsed in 70% ethanol, 90% ethanol, and twice in ultrapure water prior to dissection. The abdomen was cut off with sterile scissors, placed in an Eppendorf tube, and snap‐frozen in liquid nitrogen. All samples were stored at −80°C until further processing.
2.10. RNA sequencing
Total RNA was prepared from abdomen samples using the RNeasy Lipid Tissue kit (Qiagen, no. 74804, Hilden, Germany). RNA‐Seq libraries were constructed from 100 ng RNA using the NEBNext Ultra II Directional Library Prep Kit for Illumina (New England Biolabs, no. E7760, Ipswich, USA) in combination with the NEBNext Poly(A) mRNA Magnetic Isolation Module (New England Biolabs, no. E7490, Ipswich, USA). The samples were combined at equimolar amounts and sent out for sequencing on an Illumina device in 150 bp paired‐end mode (Genewiz, Leipzig, Germany). A total of 1.470 million reads, corresponding to an average of 19.5 million reads per sample, were obtained.
2.11. Differential expression analysis
RNA‐Seq reads were further analyzed using the OmicsBox bioinformatics platform (v. 2.0.36, www.biobam.com). Unless indicated otherwise, all tools used for differential expression analyses are accessible within the OmicsBox platform. RNA‐Seq reads were preprocessed by Trimmomatic (details see Appendix S1: RNAseq_1_trimmomatic_report) (Bolger et al., 2014) to remove sequencing adapters, low‐quality sequences, and short reads from the dataset. The quality‐trimmed reads were mapped to the B. terrestris genome assembly (Bter_1.0, GCA_000214255.1, downloaded from metazoa.ensembl.org) using STAR (Dobin et al., 2013). A gene‐specific count table was created from the mapping files using HTseq (Anders et al., 2015) and differentially expressed genes were identified by edgeR (Robinson et al., 2010), respectively. Functional annotation of the B. terrestris genome was based on annotation release v. 102 (available in gff3 format from metazoa.ensembl.org). Since 4975 of the 12,008 genes did not contain any functional annotation, the functional annotation workflow of the OmicsBox platform was used to update the published annotation with additional information. In brief, the coding sequences of unannotated genes were used to extract functional annotations from refseq_protein database (www.ncbi.nlm.nih.gov) and InterProScan (www.ebi.ac.uk). These we then fed into the GO mapping and annotation tools of the pipeline and finally merged to the existing functional annotations. To assess the overall effects of treatment and colony origin on gene expression we performed permutational multivariate analysis of variance ADONIS from the R package vegan (Oksanen et al., 2022) in Qiime2. Gene Set Enrichment Analyses (GSEA; Subramanian et al., 2005) were performed using ranked list of genes (rank = sign(logFC) * −log10(p‐value); FC: fold change) and gene sets defined by Gene Ontology's functional annotations. For the functional network analysis of enriched GO terms we used ClueGo (v. 2.5.9; Bindea et al., 2009) and CluePedia (v. 1.5.9; Bindea et al., 2013) plugins in Cytoscape (v. 3.9.1; Shannon et al., 2003). We used the packages ggplot2 (Wickham, 2016), ggpubr (Kassambara, 2020), and pheatmap (Kolde, 2019) to plot transcriptome data in R 4.2.1 (R Core Team, 2022).
3. RESULTS
3.1. Effect of pollutants on the bumblebee gut microbiome
Amplicon sequencing of the bacterial 16S rDNA fragments yielded a total of 2,425,928 raw reads. After quality filtering and removal of unassigned sequences, we also removed samples with a sampling depth below 3900 reads (n = 7), all from DEP treatment, to ensure adequate sampling depth (13 DEP replicate samples remained in the analysis). In the remaining samples we obtained 1,856,025 16S rDNA gene sequences with a mean of 25,425 reads per sample (n = 73), corresponding to 468 amplicon sequence variants (ASVs). Sample‐based rarefaction curves suggest a sufficient sequencing depth for a representative coverage of the microbiome as most of the samples reach a plateau (Figure A1). ADONIS analysis revealed a significant effect of treatment on microbiome composition (R 2 = 0.423, p < .001). There was no significant effect of colony origin (R 2 = 0.001, p = .946) on microbiome composition.
3.2. Taxa abundance
On the genus level, the most common bacterial taxa (>1% in at least one treatment) were: Gilliamella, Snodgrassella, Lactobacillus, Asaia, Bombiscardovia, Methylorubrum, and Bombilactobacillus. The relative abundance of the most common genera for each sample shows a different microbial composition in the DEP treatment compared to the other treatment groups (Figure 1).
FIGURE 1.
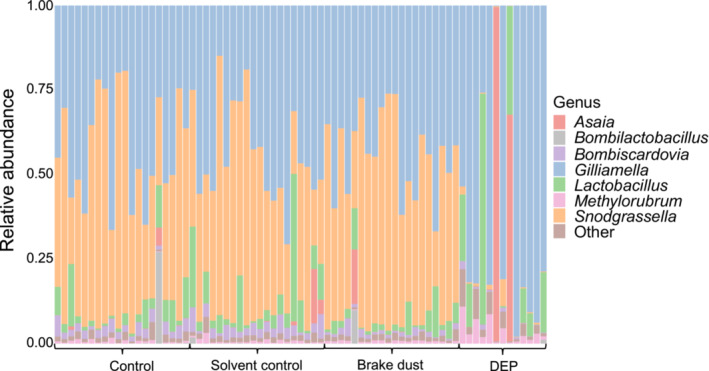
Relative abundance of the most common bacterial genera for each sample. Samples are arranged according to treatment.
While the relative abundance of ASVs did not differ between control, solvent control, and brake dust, DEP treatment had 16 differentially abundant ASVs compared to the control, according to DESeq2 (Figure 2, Table A1). Eleven ASVs had a higher abundance in the DEP treatment than control. Five ASVs had reduced abundance in comparison to the control treatment. A more conservative approach to identify differential abundance is ALDEx2, which revealed five ASVs with significantly altered abundance in the DEP treatment compared to the control: Snodgrassella 1 + 2, Neisseriacae, Lactobacillus bombicola, and Bombiscardovia (Table A2).
FIGURE 2.
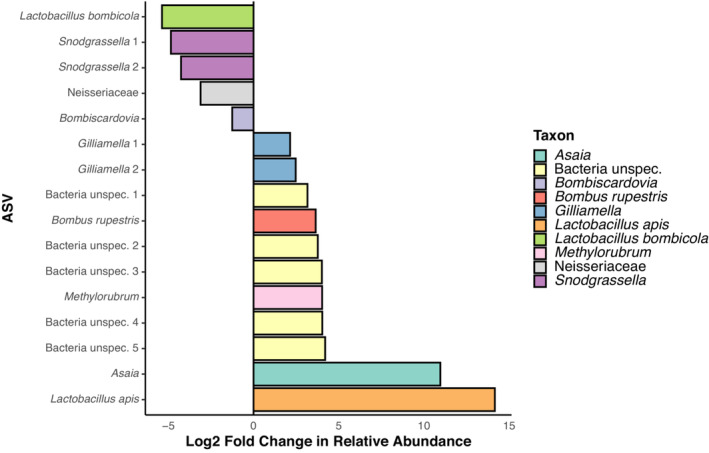
Log2 fold change in relative abundance of ASVs in the DEP treatment in comparison to the control. Cutoff for inclusion of ASVs in this plot was FDR (=p adj) < .01. Colors represent most specific taxonomic label.
3.3. α‐diversity of the gut microbiome
The number of observed ASVs did not differ between treatments (GLMM with Gaussian distribution: χ 2 = 0.918, df = 3, p = .821; Figure 3a). Pielou's evenness differed between treatments (GLMM with Gaussian distribution: χ 2 = 42.697, df = 3, p < .001; Figure 3b). The DEP treatment had a significantly lower evenness than the other treatments (Tukey comparisons with Benjamini‐Hochberg (BH) adjusted p‐values: DEP vs. control p < .001, DEP vs. solvent control p < .001, DEP vs. brake dust p < .001; Figure 3b). Shannon diversity differed between treatments (GLMM with Gaussian distribution: χ 2 = 24.035, df = 3, p < .001; Figure 3c). The DEP treatment had a significantly lower diversity than the other treatments (Tukey comparisons with BH adjusted p‐values: DEP vs. control p < .001, DEP vs. solvent control p < .001, DEP vs. brake dust p < .001; Figure 3c). Faith's PD differed between treatments (GLMM with Gaussian distribution: χ 2 = 19.062, df = 3, p < .001; Figure 3d). Faith's PD in the DEP treatment was significantly higher than in the other treatments (Tukey comparisons with BH adjusted p‐values: DEP vs. control p < .001, DEP vs. solvent control p < .001, DEP vs. brake dust p < .001; Figure 3d).
FIGURE 3.
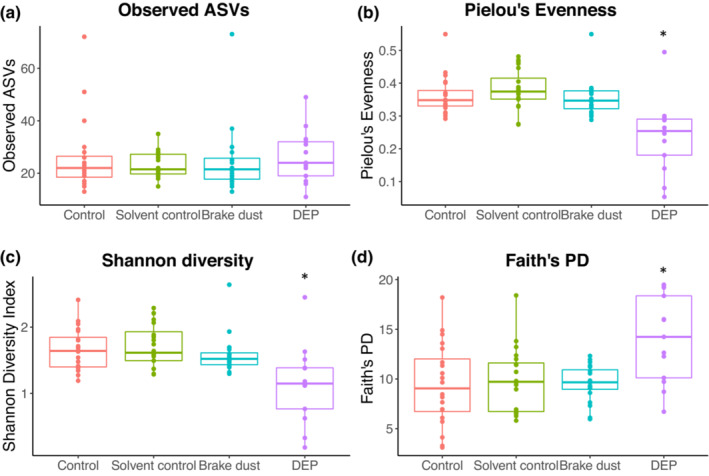
α‐diversity of the bumblebee gut microbiomes for the different treatments. (a) Observed ASVs, (b) Pielou's Evenness, (c) Shannon Diversity, (d) Faith's PD. Asterisks indicate significant differences compared to the other treatments (p < .05). Boxplots show median, first, and third quartile. Dots represent individual data points.
3.4. β‐diversity of the gut microbiome
The community composition of the bumblebee gut microbiome differed between treatments indicated by significant differences between the robust Aitchison distances (Overall PERMANOVA pseudo‐F 4, 73 = 16.844, p = .001). Microbial community composition of the DEP treatment differed from all other treatments (Pairwise PERMANOVA with BH adjusted p‐values; DEP vs. control: pseudo‐F = 32.247, p = .002; DEP vs. solvent control: pseudo‐F = 30.651, p = .002; DEP vs. brake dust: pseudo‐F = 25.699, p = .002). We found no differences between the other treatments (Pairwise PERMANOVA with BH adjusted p‐values: p > .05) (Figure 4).
FIGURE 4.
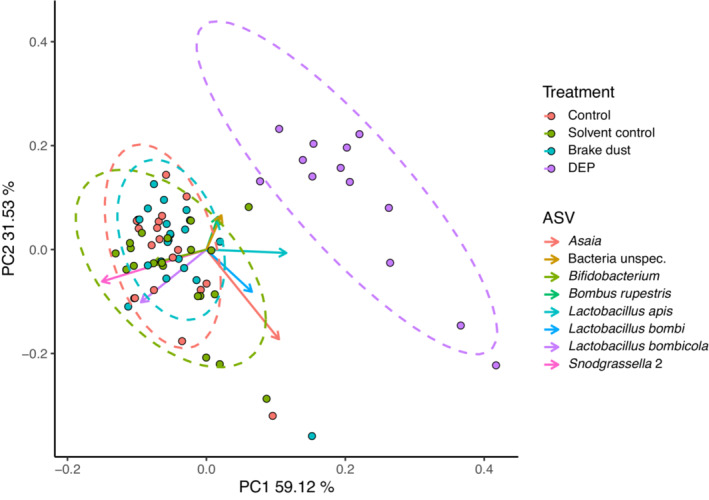
DEICODE distances based on Robust Aitchison Principal Components Analysis. Points represent single samples colored according to treatment. Arrows represent Euclidian distances from the origin and indicate ASVs with strong influence on the principal component axis. Ellipses show 95% confidence interval for multivariate t‐distribution of each treatment. The ASV of the eukaryotic organism Bombus rupestris can be explained by a remaining nonspecificity of the used primers (as analyzed by TestPrime, www.arb‐silva.de).
3.5. Effect of pollutants on bumblebee gene expression
In the transcriptome analysis, we focused only on biologically relevant comparisons of treatments to prevent unnecessary inflation of reported results. We compared control vs. solvent control, control vs. DEP, control vs. brake dust, and flight control vs. DEP flight. The analysis for differently expressed genes (DEGs) revealed differences between our treatments. In total, 324 genes were differentially expressed in the DEP treatment compared to the control (low‐count gene filter settings: CPM Filter = 1, samples reaching CPM Filter = 2). 165 genes were upregulated (LogFC > 1) and 159 genes downregulated (LogFC < −1), respectively (Table A3, Figure A2). In the brake dust treatment only one gene (lipase 3) was differentially expressed (upregulated) in comparison to the control. In the solvent control, there were no differentially expressed genes compared to the control. In the DEP flight treatment, we found no differentially expressed genes in comparison to the flight control. ADONIS analysis revealed a significant effect of treatment on gene expression (R 2 = 0.279, p = .002). There was no significant effect of colony origin (R 2 = 0.031, p = .054) on gene expression.
The variation in gene expression of bumblebee workers is clearly distinct between the control and the DEP treatment (Figure 5). The clear separation between the treatments across all samples indicates substantial differences in gene expression of bumblebees when exposed to DEP orally. The reliability of this difference in gene expression is confirmed by a cluster analysis, which shows a definite clustering by treatment rather than by colony (Figure 6). The other treatments are not clearly distinct in a nMDS plot and indicate no differences in gene expression (Figures A3, A4, A5), thus we do not conduct further analyses on these comparisons.
FIGURE 5.
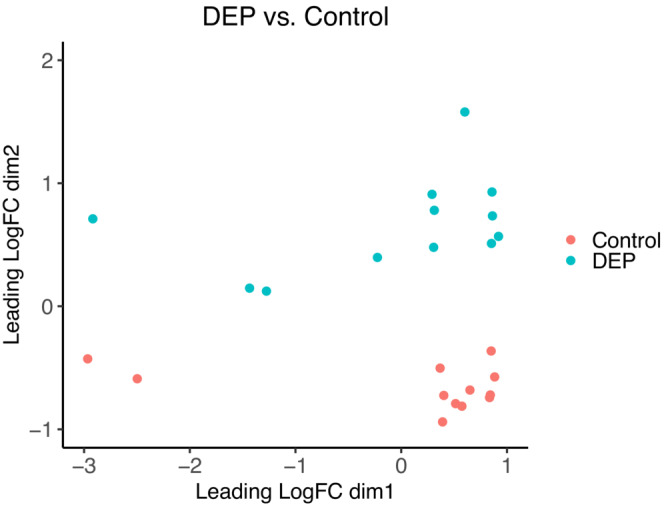
Nonmetric multidimensional scaling plot based on the log2 fold changes (FC) between control and DEP treatment. The axes of the nMDS plot represent dimensional reductions of gene expression visualizing the variability of the transcriptional changes for each treatment. Each point represents one sample, colored according to treatment.
FIGURE 6.
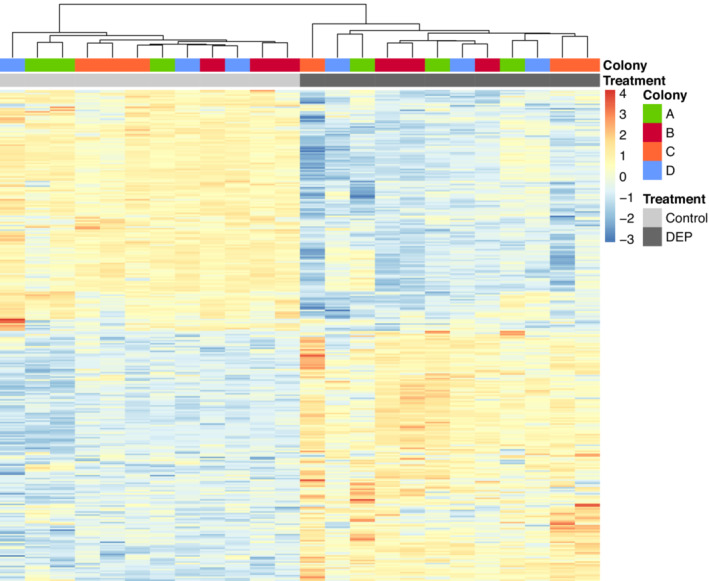
Heatmap showing hierarchical clustering of samples (x‐axis) of differentially expressed genes for the control and DEP treatment. The heatmap was obtained using Ward's clustering with the Euclidean distance. The values represent z‐scores of log2‐transformed CPM (Counts per million reads) expression values.
The 324 differentially expressed genes in the DEP treatment were annotated to gene ontology (GO) terms, which describe gene properties and group each into one of three categories: Cellular component, molecular function, and biological process. We used GO enrichment analysis to find the most over‐ and underrepresented term. The 30 most significantly upregulated GO terms in the DEP treatment include protein‐binding functions, enzyme complexes, and metabolic, especially catabolic, processes (Figure 7a). The 30 most significantly downregulated GO terms in the DEP treatment include transferase activity, mitochondrial and organelle membranes, as well as metabolic, especially biosynthetic, processes (Figure 7b).
FIGURE 7.
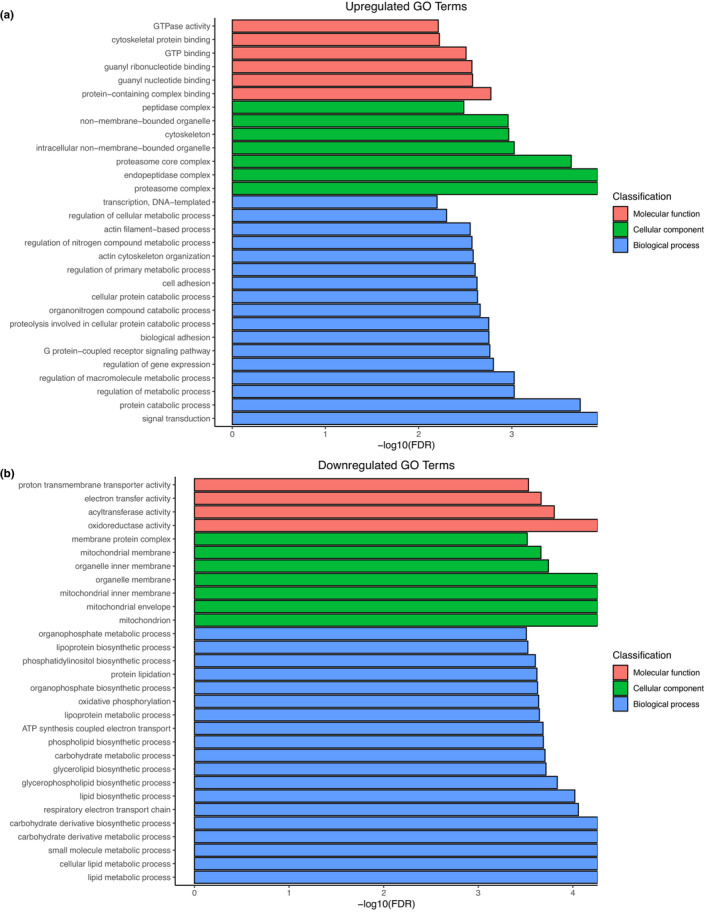
Gene ontology terms of (a) the 30 most significantly upregulated and (b) downregulated genes in the DEP treatment colored by category and sorted by −log10FDR.
The functional network analysis based on 𝜅‐Score ≥ 0.4 for differentially expressed GO terms with FDR ≤0.05 in the DEP treatment shows clustering to specific functional groups (Figure A6a). Upregulated functions are related to phosphorylation, regulation of metabolic process, guanyl nucleotide binding, and signal transduction (Figure A6b). Downregulated functions are related to mitochondria, lipid metabolic processes, the endoplasmic reticulum, and phospholipid biosynthetic processes (Figure A6c).
4. DISCUSSION
In this study, we found that oral exposure to diesel exhaust particles (DEPs) changes the gut microbiome and gene expression of bumblebee workers, while DEP exposure via air did not. Brake dust, the second pollutant we tested via oral exposure, did not induce changes in the gut microbiome or gene expression in the bumblebee workers.
While the composition of the microbial gut community in control, solvent control, and brake dust exposure treatment was similar, we detected major shifts in the DEP treatment. This raises several interesting questions: (1) How do DEPs affect the bacteria to induce changes in the gut microbiome composition? (2) Which components in diesel exhaust are responsible for the observed changes? Our hypothesis is that PAHs could be the component of DEP affecting bacteria directly. DEPs contain different PAHs, a class of organic compounds well‐known to be toxic, mutagenic, and genotoxic to various life forms (Patel et al., 2020; Sun et al., 2021). Also, shifts in the microbial gut community due to PAH exposure have been reported in different animals, such as fish, sea cucumbers, or potworms (Enchytraeidae) (DeBofsky et al., 2020, 2021; Ding et al., 2020; Quintanilla‐Mena et al., 2021; Zhao et al., 2019). Therefore, we suspect PAHs to be the leading cause of changes in the bumblebee gut microbiome in our study. However, the large amount of elemental carbon in DEPs, may itself provide another explanation. The DEPs may function like activated carbon with its large surface‐area‐to‐volume ratio and may adsorb microbes that are then discharged by excretion (Naka et al., 2001; Rivera‐Utrilla et al., 2001; Wichmann, 2007). Even though activated carbon has no direct negative impact, constant adsorption and discharge might disrupt the bacterial community resulting in the compositional and quantitative changes similar to those observed in our study.
The bacterium Snodgrassella, one of the dominant core bacteria in undisturbed gut microbiomes of bumblebees (Hammer et al., 2021), is nearly absent after the DEP exposure. Snodgrassella, together with Gilliamella, forms a biofilm coating the inner wall of the ileum (Hammer et al., 2021; Martinson et al., 2012). Both host and symbionts could profit from this biofilm formation as it prevents bacteria from washout and enables the formation of a syntrophic network (Kwong et al., 2014; Powell et al., 2016; Zhang & Zheng, 2022). Additionally, the biofilm could protect the host against gut parasites, such as C. bombi, which need to attach to the gut wall to persist (Koch et al., 2019; Näpflin & Schmid‐Hempel, 2018). However, the mutualistic relationship between the microbes seems to be disrupted by DEP exposition, as Snodgrassella abundance is extremely diminished. In contrast, Gilliamella increases in relative abundance after DEP exposure. This indicates that Gilliamella may be able to form a biofilm independently from Snodgrassella. A relatively simple explanation for the higher relative abundance of Gilliamella might be that the reduction of Snodgrassella leaves Gilliamella as the only dominant bacterium in the gut, and therefore, Gilliamella might thrive better or fill the void. Snodgrassella seems especially prone to pollutants, as Rothman et al. (2020) already reported a decrease in its relative abundance after exposure of bees to copper, selenate, or glyphosate. Additionally, we found an unknown bacterium from the family Neisseriaceae, the same family to which also Snodgrassella belongs, having a lower relative abundance after DEP exposure. If this is a consistent result, it might indicate a general susceptibility of this family to DEPs.
The higher abundance of Asaia in the DEP treatment was driven by two samples, in which Asaia dominates the bacterial community with relative abundances of 99% and 67%, respectively. Asaia is a flower‐associated acetic acid bacterium, which is commonly found in the gut of members of different insect orders, such as Hemiptera, Diptera, and Hymenoptera (Bassene et al., 2020; Crotti et al., 2009; Kautz et al., 2013). It can dominate the gut microbiome of Anopheles mosquitos, which is why it is considered a potential tool in malaria control (Capone et al., 2013; Favia et al., 2008). While there have been reports of Asaia in bumblebees, the dominance of Asaia in some of the DEP samples is rather uncommon (Bosmans et al., 2018). DEPs might disrupt the natural microbiome community opening the door for opportunistic bacteria such as Asaia (Favia et al., 2007). Even though we kept the bumblebees in this experiment indoors throughout their lives, Asaia bacteria may derive from pollen fed to the bumblebees before the start of the experiment.
We detected an interesting pattern in the genus Lactobacillus, one of the core gut bacteria of bumblebees (Hammer et al., 2021). While the species L. bombicola, a bumblebee‐associated bacterium, has a lower abundance after DEP exposure, the abundance of the honeybee‐associated L. apis increases. Again, the disruption of the original microbiome caused by DEPs might explain that foreign bacteria can establish themselves in the microbiome. As the pollen fed to the bumblebees before the experiment was collected by honeybees, it could be the source of L. apis.
The DEP‐induced changes in the gut microbiome may affect bumblebee health, as core bacteria could prevent infections by parasites. The abundance of Gilliamella, Lactobacillus, and Snodgrassella is negatively correlated with the parasites Crithidia and Nosema, while noncore bacteria are more abundant in infected bumblebees (Cariveau et al., 2014; Koch et al., 2012; Koch & Schmid‐Hempel, 2012; Mockler et al., 2018). The biofilm formation of Snodgrassella and Gilliamella may form a physical barrier to the trypanosome C. bombi, which needs to attach to the ileum wall to persist (Koch et al., 2019, Näpflin & Schmid‐Hempel, 2018). The disruption of this biofilm and the higher abundance of noncore bacteria, such as Asaia, may increase the parasite susceptibility of bumblebees exposed to DEPs.
The transcriptome analysis revealed significant changes in gene expression after oral exposure of bumblebees to a sublethal dose of DEPs. In total, 165 genes were upregulated, and 159 genes were downregulated. GO enrichment analysis and network analysis indicate that these changes could be related to a general stress response against pollutants. While upregulated GO terms involve many metabolic and catabolic processes, downregulated GO terms include metabolic and biosynthetic processes. DEP exposure might deplete stored reserves causing the observed changes as a consequence of higher energetic costs. Changes in metabolism seem to be a typical reaction to pollutants in insects, which seems reasonable as they often interfere with biochemical processes. Transcriptional changes in bumblebees and honeybees exposed to sublethal doses of neonicotinoids are mainly linked to metabolic processes (Bebane et al., 2019; Colgan et al., 2019; Gao et al., 2020; Shi et al., 2017). Exposure to heavy metals or PAHs induces similar changes in spiders, mosquitos, moths, and fireflies (Chen et al., 2021; David et al., 2010; Li et al., 2016; Zhang et al., 2019, 2021). Even though the changes differ in detail, certain processes seem commonly involved in the response to pollutants. Consistent with our findings, exposure to insecticides or PAHs affects mitochondrial functioning, an important part of the insect energy metabolism (Colgan et al., 2019; Zhang et al., 2019, 2021). This supports the idea of increased energy demand caused by pollutants (Beyers et al., 1999; Calow, 1991). We also observed an upregulation of signal transduction in our study, similar to observations in honeybees and fireflies exposed to Imidacloprid and the PAH benzo(a)pyrene, respectively (Gao et al., 2020; Zhang et al., 2019, 2021). Typically, chemical stressors, such as PAHs, insecticides, and heavy metals, affect genes associated with detoxification processes and drug metabolism (Chen et al., 2021; David et al., 2010; Gizaw et al., 2020; Zhang et al., 2019). However, in our study, we did not find any differentially expressed detoxification‐related genes. Possibly the number of PAHs attached to the DEPs was not enough to trigger a reaction that would lead to a measurable increase in detoxification. Overall, the observed changes in gene expression after oral DEP exposure of bumblebees resemble a general stress response to pollutants.
As microbiome and gene expression of bumblebees significantly changed after oral DEP the question arises if and how these systems might affect each other. Metabolic changes may be caused by the DEP‐induced changes in the gut microbiome, which can potentially alter the type and amount of metabolites provided to the host (Douglas, 2018). Moreover, insect immunity might be dependent on gut microbiome. In honeybees the native gut microbiome stimulates immune gene expression, inducing the production of antimicrobial peptides (Kwong et al., 2017). The function and the mechanistic underpinning of this interaction is not entirely clear, but the host might regulate the microbiota in this way. However, host health might also benefit from this interaction by priming the immune system against future infections. Pollutants altering the gut microbiome might thereby jeopardize insect health. This could explain the increased mortality in honeybees with altered gut microbiome due to antibiotic exposure (Raymann et al., 2017).
In contrast to oral exposure, we did not find any effect on gene expression after exposure of bumblebees to DEPs via the air. To cause changes, DEPs need to enter the tracheal system or attach to sensory organs, such as the antennae. The exposure of bumblebees for 3 min per day may not have been enough to affect them. Particles on the antennae may have been removed quickly by cleaning behavior and the spiracles seem to be an effective protective barrier against the uptake of particles into the tracheae (Harrison, 2009; Schönitzer, 1986). Thus, our results should be taken with care because probably only very few particles entered the tracheal system of the bumblebees.
Unlike DEPs, oral exposure to brake dust particles did not affect the gut microbial community or the gene expression of the bumblebees. However, some concerns remain about the experimental procedure. For one, we did not use brake dust from a real braking scenario, but rather artificially milled brake pads. Dust derived from them may have different physicochemical properties. Milled brake dust particles have a much higher mean particle size than DEPs (10 μm vs. 0.01 μm). As we defined treatment concentration per weight, these different physical properties lead to big differences in the particle counts of the treatment solutions, that is, solutions with brake dust contained far fewer particles than those with DEPs. Moreover, large brake dust particles tend to sink to the bottom of the feeding syringes, which might have reduced the particle uptake. While brake dust seems not to affect the bumblebees, further studies are needed to address the indicated limitations of the present study.
Another problem that needs to be addressed is how the doses used in this study relate to field‐realistic concentrations encountered by bumblebees. With the still often vague knowledge of origin and quantity of airborne fine particulate matter present in terrestrial habitats, we know even less about their potential uptake by insects. Contamination of bee products is documented, but there is a need for realistic modeling of encounter rate of insects with airborne particulate matter (Conti & Botrè, 2001). The doses used in this study are presumably higher than those encountered naturally. However, our experimental setup does not include other stressors bees have to face in the wild, such as parasites, limited food availability, or abiotic factors such as drought or heat stress. Bumblebees may be able to compensate for facing one stressor but will eventually be overstrained by multiple stressors.
Taken together, the results from our microbiome and transcriptome analysis indicate potential consequences for insect health, here shown in bumblebees, after oral DEP exposure. Gut dysbiosis may increase the susceptibility of bumblebees to pathogens, while a general stress response may lower available energetic resources. This highlights the potential role of airborne particulate matter such as DEPs as a driver of insect declines.
AUTHOR CONTRIBUTIONS
Dimitri Seidenath: Conceptualization (equal); data curation (equal); formal analysis (equal); investigation (equal); methodology (equal); visualization (lead); writing – original draft (lead). Alfons R. Weig: Conceptualization (supporting); data curation (equal); formal analysis (equal); methodology (equal); software (equal); visualization (supporting); writing – original draft (supporting); writing – review and editing (equal). Andreas Mittereder: Methodology (equal); resources (equal); writing – review and editing (supporting). Thomas Hillenbrand: Methodology (supporting); resources (supporting); supervision (supporting); writing – review and editing (supporting). Dieter Brüggemann: Funding acquisition (supporting); project administration (supporting); resources (supporting); supervision (supporting); writing – review and editing (supporting). Thorsten Opel: Methodology (supporting); resources (supporting); writing – review and editing (supporting). Nico Langhof: Funding acquisition (supporting); methodology (supporting); project administration (supporting); resources (supporting); supervision (supporting); writing – review and editing (supporting). Marcel Riedl: Investigation (equal). Heike Feldhaar: Conceptualization (equal); funding acquisition (equal); project administration (equal); supervision (equal); writing – original draft (supporting); writing – review and editing (lead). Oliver Otti: Conceptualization (equal); formal analysis (supporting); funding acquisition (equal); project administration (equal); supervision (equal); visualization (equal); writing – original draft (supporting); writing – review and editing (lead).
FUNDING INFORMATION
This project was funded by the Bavarian State Ministry of the Environment and Consumer Protection as part of the project network BayOekotox. The open access publication was funded by the Deutsche Forschungsgemeinschaft (DFG, German Research Foundation) ‐ 491183248. Funded by the Open Access Publishing Fund of the University of Bayreuth.
Supporting information
Appendix S1.
ACKNOWLEDGMENTS
We thank Sara Pölloth, Simon Bitz, Frederic Hüftlein, and Helena Hartmann for helping with the lab work, and Michaela Hochholzer and Andrea Kirpal (Keylab Genomics and Bioinformatics) for preparing the NGS libraries. Open Access funding enabled and organized by Projekt DEAL.
APPENDIX A.
FIGURE A1.
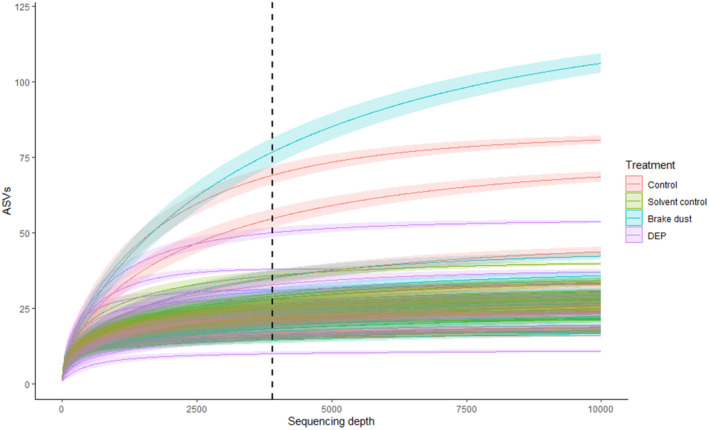
Rarefaction curve of each sample, colored according to their respective treatment. X‐Axis is cut off at 10,000 reads. Vertical dashed line indicates sequencing depth of 3900.
FIGURE A2.
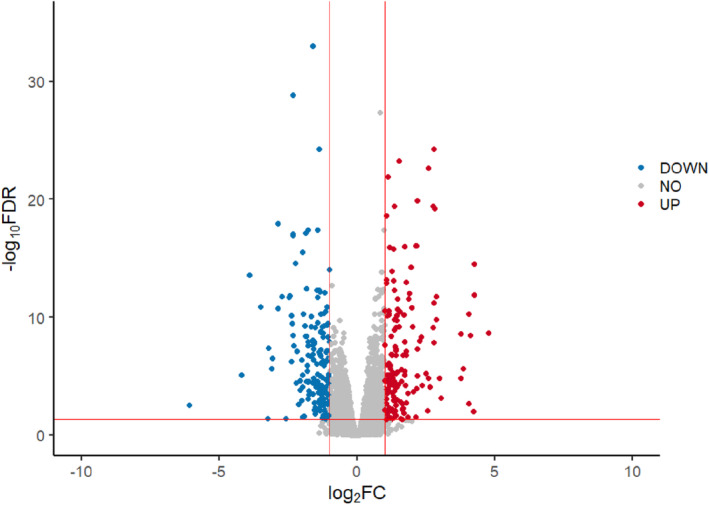
Differential expression of genes in the DEP treatment in comparison to the control. Blue dots represent significantly downregulated genes, red dots represent significantly upregulated genes. The horizontal red line marks a −log10(FDR = 0.05). The two vertical red lines mark a log2FC of −1 and 1, respectively.
FIGURE A3.
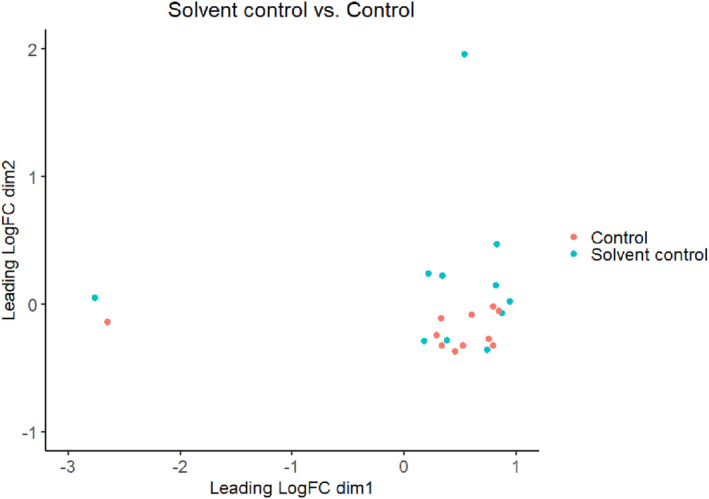
Non‐metric multidimensional scaling plot based on the log2 fold changes (FC) between control and solvent control. The axes of the nMDS plot represent dimensional reductions of genes expression visualizing the variability of the transcriptional changes for each treatment. Each point represents one sample, colored according to the respective treatment.
FIGURE A4.
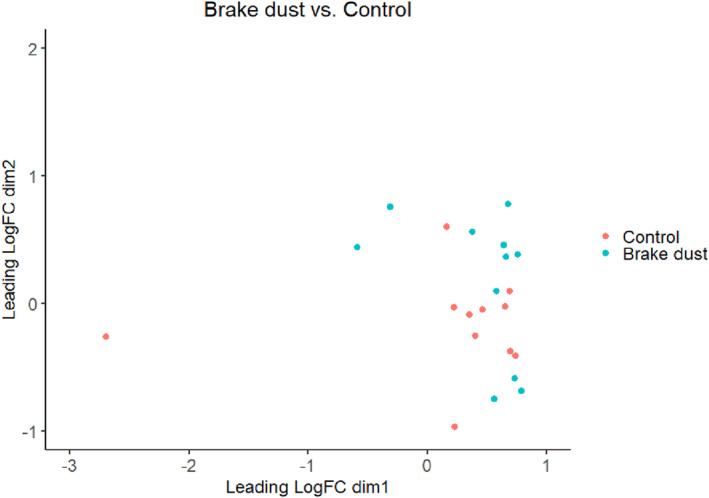
Non‐metric multidimensional scaling plot based on the log2 fold changes (FC) between control and brake dust treatment. The axes of the nMDS plot represent dimensional reductions of genes expression visualizing the variability of the transcriptional changes for each treatment. Each point represents one sample, colored according to the respective treatment.
FIGURE A5.
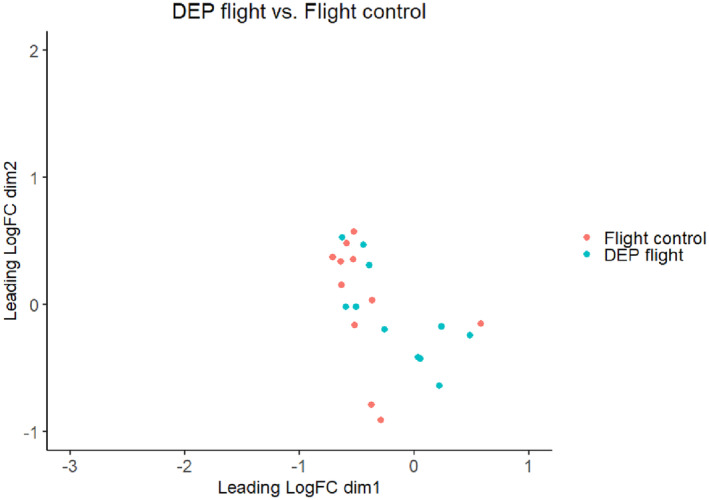
Non‐metric multidimensional scaling plot based on the log2 fold changes (FC) between flight control and DEP flight treatment. The axes of the nMDS plot represent dimensional reductions of genes expression visualizing the variability of the transcriptional changes for each treatment. Each point represents one sample, colored according to the respective treatment.
FIGURE A6.
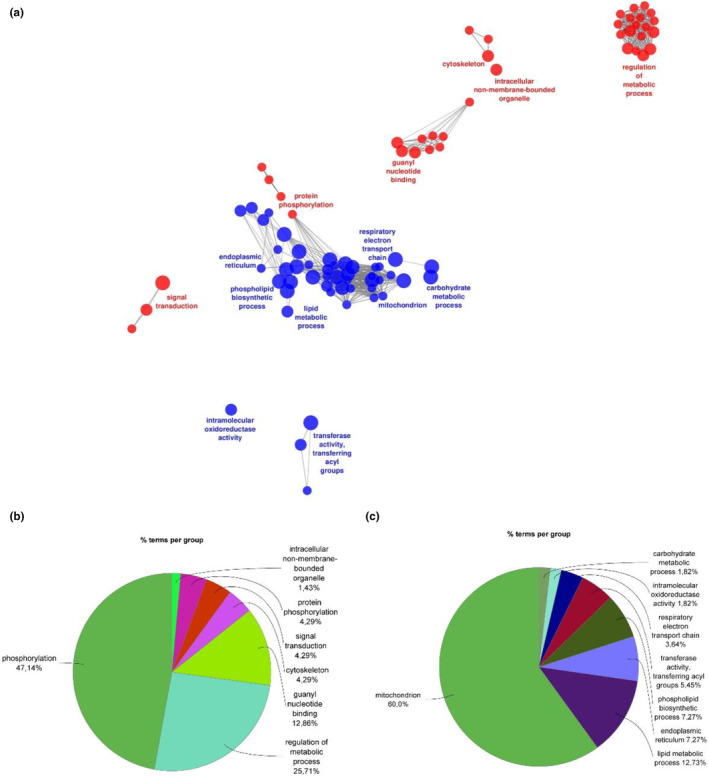
Network analysis of enriched gene terms and functional groups in the DEP treatment based on Kappa‐Score ≥ 0.4 for GOs with FDR ≤ 0.05 using the ClueGo and CluePedia plugins of Cytoscape. (a) Functionally grouped network of upregulated (red) and downregulated (blue) gene ontologies. (b) pie chart with functional groups, including specific terms upregulated in the DEP treatment. (c) pie chart with functional groups, including specific terms downregulated in the DEP treatment. The area covered by each group represents the relative number of GO terms within each group. The most significant term each group is labelled.
TABLE A1.
Differentially abundant ASVs comparing DEP to the control treatment, according to DESeq2 (cutoff: FDR < 0.01).
| ASV | Log2 fold change | p adj (=FDR) | Feature ID |
|---|---|---|---|
| Lactobacillus bombicola | −5.372 | <.001 | ac3366c90455cdc1a4ad414f21215a91 |
| Snodgrassella 1 | −4.848 | <.001 | f9dff838e1ab76a58a54df65a2457d5a |
| Snodgrassella 2 | −4.256 | <.001 | 8f7166172175c35bbfc8fa4dc5ef58b8 |
| Neisseriaceae | −3.108 | <.001 | f1ae3848b7e710b5da56f2a447ae0234 |
| Bombiscardovia | −1.251 | .010 | bf7591505d4138d52e3a9c537c958fa1 |
| Gilliamella 1 | 2.146 | <.001 | 36aed5b1dc9b5c1a2844e58f2d34b1f5 |
| Gilliamella 2 | 2.473 | <.001 | 1e232cdf347e2b62b3b1d7347e891797 |
| Bacteria unspec. 1 | 3.162 | .001 | 6445d5095ad81f1b73aa974a171ebce6 |
| Bombus rupestris | 3.645 | <.001 | 6d53feb4ee4fac60aba11969e1e5fc01 |
| Bacteria unspec. 2 | 3.768 | .004 | 101de948d3a66ac329a31fd5f92c00d5 |
| Bacteria unspec. 3 | 4.008 | <.001 | 7ebb40e08aa315a3ab9ae5fb0b47ae34 |
| Methylorubrum | 4.025 | <.001 | 92f1720367db58c68a96eceb9feb416a |
| Bacteria unspec. 4 | 4.030 | <.001 | 5c70c440562c05d292daf0c5b4694ef4 |
| Bacteria unspec. 5 | 4.201 | <.001 | a6ddcd6498df4ed3d6c3e05663f658fb |
| Asaia sp. | 10.960 | <.001 | 49d46d00a93443b060707ab2db8ba82d |
| Lactobacillus apis | 14.158 | <.001 | 96d14363f547715b65bf7d8ad1d31d17 |
Note: Positive Log2 fold changes indicate higher abundance in the DEP treatment.
TABLE A2.
Differentially abundant ASVs comparing DEP to the control treatment, according to ALDEx2.
| ASV | Effect | p adj | Feature ID |
|---|---|---|---|
| Snodgrassella 2 | −5.516 | <.001 | 8f7166172175c35bbfc8fa4dc5ef58b8 |
| Neisseriaceae | −2.659 | <.001 | f1ae3848b7e710b5da56f2a447ae0234 |
| Lactobacillus bombicola | −2.393 | <.001 | ac3366c90455cdc1a4ad414f21215a91 |
| Snodgrassella 1 | −2.356 | <.001 | f9dff838e1ab76a58a54df65a2457d5a |
| Bombiscardovia | −2.092 | <.001 | bf7591505d4138d52e3a9c537c958fa1 |
Note: Negative effect indicates higher abundance in the control. p adj = Expected Benjamini‐Hochberg corrected p value of Wilcoxon test. Effect = median effect size (diff.btw/max(diff.win)).
TABLE A3.
Differentially expressed genes in the DEP treatment compared to the control (low‐count gene filter settings: CPM Filter = 1, samples reaching CPM Filter = 2).
| Feature | Description | LogFC | LogCPM | FDR |
|---|---|---|---|---|
| LOC105666082 | Protein IWS1 homolog | 4.778 | −0.174 | <0.001 |
| LOC100651567 | Protein yellow‐like | 4.268 | 5.560 | <0.001 |
| LOC100644846 | 4.259 | 5.525 | <0.001 | |
| LOC100644158 | 4.239 | 0.464 | 0.009 | |
| LOC100643093 | 4.101 | 2.086 | <0.001 | |
| LOC105666427 | Titin homolog | 4.054 | −0.636 | <0.001 |
| LOC100646940 | 4.045 | −2.033 | 0.002 | |
| LOC110119163 | Protein fantom‐like | 3.865 | −1.153 | <0.001 |
| LOC110119507 | 3.774 | −0.774 | <0.001 | |
| LOC110120240 | 3.763 | −1.264 | <0.001 | |
| LOC100648995 | 3.034 | 2.508 | <0.001 | |
| LOC100646947 | Proline‐rich protein 4 | 2.981 | −0.210 | <0.001 |
| LOC100648170 | Salivary glue protein Sgs‐3‐like | 2.882 | 4.684 | <0.001 |
| LOC110120085 | MATH and LRR domain‐containing protein PFE0570w‐like | 2.865 | 0.639 | <0.001 |
| LOC100646909 | Leucine‐rich repeat protein SHOC‐2‐like isoform X1 | 2.815 | 2.525 | <0.001 |
| LOC100647974 | 2.789 | 9.078 | <0.001 | |
| LOC100647281 | Spore wall protein 2‐like | 2.784 | 0.248 | <0.001 |
| LOC100644232 | MATH and LRR domain‐containing protein PFE0570w‐like | 2.775 | 4.245 | <0.001 |
| LOC100647178 | 2.754 | 7.912 | <0.001 | |
| LOC100645500 | 2.752 | 5.742 | <0.001 | |
| LOC100647176 | 2.642 | −1.240 | <0.001 | |
| LOC100652307 | Mucin‐5AC‐like isoform X3 | 2.590 | 3.066 | <0.001 |
| LOC100647203 | Glycine‐rich cell wall structural protein | 2.579 | −0.377 | <0.001 |
| LOC105666061 | Fibrous sheath CABYR‐binding protein‐like | 2.551 | 1.106 | 0.008 |
| LOC100649104 | Electron transfer flavoprotein beta subunit lysine methyltransferase‐like | 2.489 | −0.274 | <0.001 |
| LOC100650993 | Hybrid signal transduction histidine kinase L‐like | 2.367 | −0.563 | <0.001 |
| LOC100642564 | Proton‐coupled amino acid transporter‐like protein pathetic | 2.340 | 1.911 | <0.001 |
| LOC100647041 | 2.281 | 4.208 | <0.001 | |
| LOC100645710 | Centrosomal protein of 290 kDa‐like | 2.198 | 4.105 | <0.001 |
| LOC100651433 | 2.187 | 8.265 | <0.001 | |
| LOC100644285 | Zinc finger protein 100‐like | 2.186 | 0.703 | <0.001 |
| LOC100647265 | 2.163 | 5.745 | <0.001 | |
| LOC105666426 | Titin homolog | 2.151 | −0.425 | <0.001 |
| LOC100644468 | Spore coat protein SP96‐like | 2.129 | −0.294 | 0.027 |
| LOC100649167 | Coiled‐coil domain‐containing protein 170 isoform X1 | 2.121 | 4.034 | <0.001 |
| LOC100645585 | Uncharacterized protein LOC100645585 isoform X1 | 2.037 | 0.733 | <0.001 |
| LOC100643561 | 2.001 | 6.567 | <0.001 | |
| LOC100645996 | 1.988 | 0.963 | <0.001 | |
| LOC100652019 | 1.967 | 6.469 | <0.001 | |
| LOC105666709 | Uncharacterized protein LOC105666709 | 1.890 | 4.064 | <0.001 |
| LOC110119744 | Uncharacterized protein LOC110119744 | 1.870 | 2.413 | <0.001 |
| LOC100647550 | Cyclin‐dependent kinase inhibitor 1C | 1.832 | −1.175 | 0.029 |
| LOC100650340 | 1.829 | −0.412 | <0.001 | |
| LOC100647929 | 1.794 | −0.292 | <0.001 | |
| LOC105665898 | Uncharacterized protein LOC105665898 | 1.790 | −1.126 | 0.002 |
| LOC105665941 | Uncharacterized protein LOC105665941 | 1.781 | 1.785 | <0.001 |
| LOC100646677 | 1.774 | 9.275 | <0.001 | |
| LOC110120139 | Uncharacterized protein LOC110120139 | 1.759 | 0.166 | <0.001 |
| LOC100645840 | 1.739 | 0.876 | <0.001 | |
| LOC100647883 | 1.738 | 9.769 | <0.001 | |
| LOC100651423 | Cystinosin homolog isoform X1 | 1.726 | 7.389 | <0.001 |
| LOC110119585 | Odorant receptor 49b‐like | 1.718 | 1.471 | <0.001 |
| LOC100646153 | 1.709 | 2.931 | <0.001 | |
| LOC105666013 | Protein Hook homolog 3‐like | 1.687 | −0.056 | 0.013 |
| LOC100645923 | Uncharacterized protein LOC100645923 isoform X1 | 1.657 | 0.413 | <0.001 |
| LOC100649809 | Microtubule‐associated protein 10‐like | 1.655 | −0.359 | 0.006 |
| LOC100651231 | 1.645 | 3.339 | 0.006 | |
| LOC100648688 | 1.631 | 4.192 | 0.046 | |
| LOC110119618 | Uncharacterized protein LOC110119618 | 1.630 | 0.823 | 0.002 |
| LOC110119338 | 1.620 | 0.068 | <0.001 | |
| LOC100646202 | 1.617 | 4.879 | <0.001 | |
| LOC105666927 | Uncharacterized protein LOC105666927 | 1.576 | −0.631 | 0.041 |
| LOC100651530 | 1.574 | 0.299 | 0.002 | |
| LOC100646747 | 1.562 | 5.823 | <0.001 | |
| LOC100648646 | 1.534 | 6.323 | <0.001 | |
| LOC100648300 | 1.531 | 7.334 | <0.001 | |
| LOC110120263 | Uncharacterized protein LOC110120263 isoform X2 | 1.496 | 4.036 | <0.001 |
| LOC100646922 | 1.473 | 8.312 | <0.001 | |
| LOC100648283 | 1.472 | 0.806 | <0.001 | |
| LOC100646009 | 1.471 | 9.026 | <0.001 | |
| LOC100646896 | 1.449 | 4.249 | <0.001 | |
| LOC100649615 | Ataxin‐7‐like protein 1 | 1.440 | 5.277 | <0.001 |
| LOC105666227 | LOW QUALITY PROTEIN: uncharacterized protein LOC105666227 | 1.439 | −0.443 | 0.001 |
| LOC100651732 | 1.439 | 2.514 | <0.001 | |
| LOC100642884 | 1.436 | 5.710 | <0.001 | |
| LOC100642438 | Probable WRKY transcription factor protein 1 | 1.420 | 3.795 | <0.001 |
| VSP | 1.409 | 9.742 | <0.001 | |
| LOC105666604 | Uncharacterized protein LOC105666604 | 1.404 | 0.197 | 0.003 |
| LOC105665882 | 1.399 | 2.459 | <0.001 | |
| LOC100645563 | 1.399 | 1.182 | <0.001 | |
| LOC100646094 | 1.399 | 6.502 | <0.001 | |
| LOC100645979 | 1.397 | −0.803 | 0.021 | |
| LOC105665708 | LOW QUALITY PROTEIN: uncharacterized protein LOC105665708 | 1.394 | 0.855 | 0.008 |
| LOC100648236 | Uncharacterized protein LOC100648236 | 1.386 | 3.095 | <0.001 |
| LOC100644599 | 1.370 | 4.767 | <0.001 | |
| LOC100646656 | Myb‐like protein X | 1.364 | 1.395 | <0.001 |
| LOC100645702 | 1.361 | 9.861 | <0.001 | |
| LOC100652183 | 1.357 | 9.345 | <0.001 | |
| LOC100652258 | 1.351 | 9.815 | <0.001 | |
| LOC100644734 | 1.344 | 6.064 | <0.001 | |
| LOC100642770 | 1.339 | 8.595 | <0.001 | |
| LOC100648102 | 1.336 | 9.620 | <0.001 | |
| LOC100643215 | 1.335 | 1.766 | 0.012 | |
| LOC100643695 | Vesicular inhibitory amino acid transporter | 1.332 | 0.157 | 0.001 |
| LOC105666799 | Two pore potassium channel protein sup‐9 | 1.331 | 0.806 | 0.033 |
| LOC100648304 | 1.327 | 6.114 | <0.001 | |
| LOC110119815 | 1.325 | 3.311 | <0.001 | |
| LOC100648321 | Uncharacterized protein LOC100648321 | 1.300 | 2.319 | <0.001 |
| LOC100646208 | Protein PIH1D3 | 1.292 | 0.892 | <0.001 |
| LOC100642715 | 1.288 | −0.427 | 0.009 | |
| LOC100647986 | 1.277 | 6.942 | <0.001 | |
| LOC100646384 | Pupal cuticle protein G1A‐like | 1.275 | 1.415 | <0.001 |
| LOC100645727 | Prohormone‐2‐like | 1.275 | 1.824 | <0.001 |
| LOC100650276 | 1.268 | 2.753 | <0.001 | |
| LOC100650566 | 1.264 | 8.947 | <0.001 | |
| LOC100649387 | 1.259 | 5.304 | <0.001 | |
| LOC100649836 | 1.257 | 3.552 | <0.001 | |
| LOC100645137 | 1.252 | 3.719 | <0.001 | |
| LOC100648970 | 1.251 | −0.611 | 0.006 | |
| LOC100649938 | 1.247 | 6.943 | <0.001 | |
| LOC100651901 | 1.242 | 8.224 | <0.001 | |
| LOC100646624 | 1.229 | 4.294 | 0.044 | |
| LOC100647259 | Uncharacterized protein LOC100647259 | 1.228 | 5.697 | <0.001 |
| LOC100647497 | 1.213 | −0.225 | 0.008 | |
| LOC100649579 | 1.209 | 9.855 | <0.001 | |
| LOC100645676 | 1.202 | 7.801 | <0.001 | |
| LOC100646376 | 1.195 | −0.595 | 0.033 | |
| LOC100649407 | 1.188 | 9.355 | <0.001 | |
| LOC100647950 | Alpha‐tocopherol transfer protein‐like | 1.184 | 1.030 | 0.046 |
| LOC100651491 | 1.177 | 2.702 | <0.001 | |
| LOC100642208 | DNA ligase 1‐like isoform X6 | 1.175 | 2.630 | <0.001 |
| LOC100649496 | Uncharacterized protein LOC100649496 | 1.174 | 0.985 | 0.006 |
| LOC100645061 | Protein odd‐skipped | 1.171 | 3.722 | <0.001 |
| LOC100642957 | 1.162 | 6.871 | <0.001 | |
| LOC105666369 | 1.162 | 1.689 | 0.004 | |
| LOC100649739 | 1.160 | 7.421 | <0.001 | |
| LOC100643243 | 1.153 | 2.973 | <0.001 | |
| LOC100648476 | 1.150 | 5.734 | <0.001 | |
| LOC100648653 | 1.146 | 2.896 | <0.001 | |
| LOC100648558 | 1.143 | 3.700 | <0.001 | |
| F2 | Uncharacterized abhydrolase domain‐containing protein DDB_G0269086‐like | 1.134 | −0.529 | 0.011 |
| LOC100648973 | Protein GDAP2 homolog | 1.129 | 9.913 | <0.001 |
| LOC105666926 | Uncharacterized protein LOC105666926 isoform X2 | 1.120 | 2.081 | 0.0369 |
| LOC100647147 | 1.115 | 3.715 | <0.001 | |
| LOC110119847 | Protein lethal(2)essential for life‐like | 1.114 | 4.426 | 0.039 |
| LOC100645059 | SIFamide‐related peptide | 1.109 | −0.695 | 0.036 |
| LOC100643782 | 1.102 | 0.097 | 0.003 | |
| LOC100644956 | 1.101 | 4.921 | <0.001 | |
| LOC100651177 | 1.095 | 2.141 | <0.001 | |
| LOC100647329 | 1.091 | 9.649 | <0.001 | |
| LOC100646320 | 1.089 | 0.916 | 0.017 | |
| LOC100642883 | 1.081 | 5.822 | <0.001 | |
| LOC100651656 | 1.075 | 7.739 | <0.001 | |
| LOC100642484 | 1.074 | −0.079 | 0.030 | |
| LOC100648879 | 1.072 | −0.588 | 0.043 | |
| LOC110119508 | Uncharacterized protein LOC110119508 | 1.072 | 0.436 | <0.001 |
| LOC100642826 | Protein FAM151B isoform X2 | 1.069 | 9.561 | <0.001 |
| LOC100651405 | Esterase B1‐like | 1.067 | 0.321 | 0.003 |
| LOC110119866 | Uncharacterized protein LOC110119866 | 1.065 | 0.879 | 0.013 |
| LOC105666040 | Uncharacterized protein LOC105666040 | 1.064 | 0.860 | 0.002 |
| LOC100644862 | 1.052 | 7.371 | <0.001 | |
| LOC105666834 | 1.045 | 0.993 | 0.010 | |
| LOC100649218 | Uncharacterized protein LOC100649218 isoform X2 | 1.044 | 1.947 | <0.001 |
| LOC100645036 | 1.040 | 2.696 | <0.001 | |
| LOC100649225 | Basic proline‐rich protein isoform X1 | 1.029 | −0.635 | 0.034 |
| LOC100648073 | 1.026 | 1.176 | 0.007 | |
| LOC100644397 | 1.023 | 1.507 | 0.015 | |
| LOC100644350 | Uncharacterized protein LOC100644350 | 1.018 | 1.295 | 0.021 |
| LOC100643873 | Prion‐like‐(Q/N‐rich) domain‐bearing protein 25 isoform X2 | 1.017 | 8.273 | <0.001 |
| LOC100645385 | 1.016 | 2.750 | <0.001 | |
| LOC100647323 | 1.015 | 6.130 | <0.001 | |
| LOC100645062 | 1.012 | −0.628 | 0.008 | |
| LOC100646777 | 1.009 | 3.179 | 0.001 | |
| LOC100645806 | Growth factor receptor‐bound protein 14 isoform X2 | 1.004 | 6.502 | <0.001 |
| LOC100644243 | Probable salivary secreted peptide | 1.002 | 12.695 | <0.001 |
| LOC100649384 | −1.008 | 5.405 | <0.001 | |
| LOC100650561 | −1.017 | 7.586 | <0.001 | |
| LOC100643490 | −1.018 | 8.027 | <0.001 | |
| LOC100649785 | −1.019 | 4.479 | <0.001 | |
| LOC100647616 | −1.020 | 5.533 | 0.021 | |
| LOC100646229 | −1.023 | 5.296 | <0.001 | |
| LOC100649475 | −1.024 | 10.228 | <0.001 | |
| LOC105666138 | −1.035 | 6.859 | <0.001 | |
| LOC100642963 | Histidine‐rich glycoprotein‐like | −1.045 | 5.154 | 0.002 |
| LOC100651034 | −1.045 | 6.727 | <0.001 | |
| LOC100642358 | −1.045 | 3.873 | <0.001 | |
| LOC100648843 | −1.049 | 8.843 | <0.001 | |
| LOC100642272 | −1.054 | 8.741 | 0.021 | |
| LOC100631070 | Melittin | −1.059 | 3.766 | 0.008 |
| LOC100642297 | Lysozyme‐like | −1.061 | 10.682 | 0.002 |
| LOC100649166 | −1.061 | 4.248 | <0.001 | |
| LOC100644014 | −1.072 | 6.401 | <0.001 | |
| LOC100651129 | Protein G12 | −1.078 | 10.283 | 0.043 |
| LOC100645024 | −1.091 | 8.467 | <0.001 | |
| LOC100644917 | −1.091 | 4.886 | <0.001 | |
| LOC100647588 | Long‐chain fatty acid transport protein 4‐like | −1.096 | 6.759 | <0.001 |
| LOC100644715 | Polypeptide N‐acetylgalactosaminyltransferase 2 | −1.100 | 4.682 | <0.001 |
| LOC100651969 | Uncharacterized protein LOC100651969 isoform X2 | −1.100 | 0.890 | 0.002 |
| LOC100646207 | −1.101 | 5.682 | 0.002 | |
| LOC105666529 | Aquaporin‐11 | −1.102 | 2.117 | <0.001 |
| LOC100644235 | Uncharacterized protein LOC100644235 | −1.107 | 1.968 | <0.001 |
| LOC100646060 | −1.114 | 7.402 | <0.001 | |
| LOC100648993 | −1.115 | 9.557 | <0.001 | |
| LOC100648212 | −1.117 | 7.707 | <0.001 | |
| LOC100646721 | −1.135 | 5.557 | <0.001 | |
| LOC100646290 | −1.146 | 1.245 | 0.041 | |
| LOC100643349 | −1.147 | 10.562 | 0.014 | |
| LOC100644362 | −1.171 | 5.665 | <0.001 | |
| LOC100643278 | Uncharacterized protein LOC100643278 | −1.185 | 4.474 | 0.007 |
| LOC100645388 | −1.195 | 5.780 | <0.001 | |
| LOC100647598 | −1.198 | 3.658 | <0.001 | |
| LOC100643624 | −1.203 | 8.331 | <0.001 | |
| LOC100643512 | −1.214 | 8.551 | <0.001 | |
| LOC100646642 | −1.217 | 2.851 | 0.003 | |
| LOC100642930 | −1.218 | 6.323 | <0.001 | |
| LOC100646691 | −1.219 | 10.406 | <0.001 | |
| LOC100649890 | Alpha‐tocopherol transfer protein‐like | −1.230 | 0.789 | 0.023 |
| LOC100650536 | −1.236 | 6.399 | 0.002 | |
| LOC100651809 | −1.236 | 5.354 | <0.001 | |
| LOC100649409 | −1.241 | 5.340 | <0.001 | |
| LOC100645662 | −1.243 | 9.781 | <0.001 | |
| LOC100649281 | −1.253 | 5.567 | <0.001 | |
| LOC100648311 | −1.261 | 5.069 | <0.001 | |
| LOC100646687 | −1.265 | 13.363 | <0.001 | |
| LOC100643086 | −1.268 | 6.574 | <0.001 | |
| LOC100646858 | Uncharacterized protein LOC100646858 | −1.271 | 1.155 | 0.035 |
| LOC100650878 | −1.281 | 0.984 | 0.002 | |
| LOC100642446 | −1.285 | 1.803 | <0.001 | |
| LOC100642488 | Ionotropic receptor 75a‐like | −1.292 | 2.460 | <0.001 |
| LOC100646246 | −1.311 | 5.411 | <0.001 | |
| LOC100649270 | −1.312 | 8.042 | <0.001 | |
| LOC100648174 | −1.312 | 1.204 | 0.003 | |
| LOC100649872 | −1.314 | 6.120 | <0.001 | |
| LOC100648029 | −1.315 | 6.794 | <0.001 | |
| LOC100647832 | −1.322 | 4.922 | <0.001 | |
| LOC100645755 | −1.332 | 3.458 | <0.001 | |
| LOC100650947 | −1.346 | 7.668 | <0.001 | |
| LOC100652063 | Trissin | −1.354 | 1.343 | <0.001 |
| LOC100645107 | −1.356 | 8.581 | <0.001 | |
| LOC100651500 | Mid1‐interacting protein 1‐B | −1.357 | 3.443 | <0.001 |
| LOC100645894 | −1.359 | 2.278 | <0.001 | |
| LOC100645429 | −1.360 | 6.319 | <0.001 | |
| LOC100650250 | −1.364 | 0.367 | 0.008 | |
| LOC100645461 | −1.374 | 5.010 | <0.001 | |
| LOC100643020 | −1.381 | 8.281 | <0.001 | |
| LOC100646701 | −1.393 | 8.105 | <0.001 | |
| LOC100647539 | −1.407 | 8.027 | 0.002 | |
| LOC100649304 | −1.416 | 6.659 | <0.001 | |
| LOC100642695 | −1.421 | −0.396 | <0.001 | |
| LOC100646080 | −1.424 | 6.440 | <0.001 | |
| LOC100647261 | −1.429 | 6.854 | <0.001 | |
| LOC100645568 | −1.435 | 4.554 | <0.001 | |
| LOC100645839 | −1.441 | 5.714 | 0.007 | |
| LOC100643609 | −1.444 | 3.461 | <0.001 | |
| LOC100644742 | −1.445 | 4.297 | <0.001 | |
| LOC100652226 | −1.456 | 6.961 | <0.001 | |
| LOC100647540 | −1.466 | 5.081 | <0.001 | |
| LOC100647578 | −1.482 | 7.434 | <0.001 | |
| LOC100651196 | −1.491 | 6.564 | <0.001 | |
| LOC100644600 | −1.500 | 6.213 | 0.006 | |
| LOC100652036 | −1.510 | 0.330 | 0.017 | |
| LOC100648169 | −1.518 | 5.991 | <0.001 | |
| LOC100650111 | Uncharacterized protein LOC100650111 | −1.531 | 6.779 | 0.004 |
| LOC100643779 | −1.542 | 5.867 | 0.008 | |
| LOC100648980 | −1.547 | 4.108 | <0.001 | |
| LOC100644177 | −1.561 | 2.197 | <0.001 | |
| LOC100644225 | −1.563 | 8.560 | 0.002 | |
| LOC100644459 | −1.572 | 3.927 | <0.001 | |
| LOC100644716 | Proton‐coupled amino acid transporter‐like protein pathetic | −1.576 | 6.177 | <0.001 |
| LOC100647785 | −1.589 | 9.673 | <0.001 | |
| LOC100651168 | Heterogeneous nuclear ribonucleoprotein A3 homolog 2‐like isoform X2 | −1.594 | 10.511 | <0.001 |
| LOC100644772 | −1.598 | 4.675 | <0.001 | |
| LOC100646078 | −1.606 | 11.649 | <0.001 | |
| LOC100652210 | −1.609 | 7.475 | <0.001 | |
| LOC100646491 | −1.615 | 4.672 | <0.001 | |
| LOC100650628 | −1.619 | 4.326 | <0.001 | |
| LOC100644921 | Proton‐coupled amino acid transporter‐like protein CG1139 | −1.621 | 6.500 | <0.001 |
| LOC105667110 | −1.668 | 4.511 | <0.001 | |
| LOC100645013 | −1.669 | 6.269 | <0.001 | |
| LOC100646373 | −1.674 | 9.611 | <0.001 | |
| LOC100649608 | −1.681 | 8.549 | <0.001 | |
| LOC100645163 | −1.751 | 9.563 | <0.001 | |
| LOC100652301 | −1.753 | 5.583 | <0.001 | |
| LOC100649568 | −1.763 | 2.324 | <0.001 | |
| LOC100652268 | Cysteine‐rich venom protein 1‐like isoform X1 | −1.773 | 0.064 | <0.001 |
| LOC100648451 | −1.778 | 2.360 | <0.001 | |
| LOC100649144 | −1.781 | 8.292 | <0.001 | |
| LOC100646186 | −1.783 | 4.856 | <0.001 | |
| LOC105666640 | −1.791 | 3.144 | <0.001 | |
| LOC100647719 | −1.794 | 6.790 | <0.001 | |
| LOC100647796 | −1.795 | 10.385 | <0.001 | |
| LOC100646617 | Uncharacterized protein LOC100646617 | −1.796 | 8.254 | <0.001 |
| LOC100644966 | Uncharacterized protein LOC100644966 | −1.832 | 9.266 | <0.001 |
| LOC100651268 | −1.833 | 6.843 | <0.001 | |
| LOC100646752 | Uncharacterized protein LOC100646752 | −1.837 | 2.764 | <0.001 |
| LOC105666139 | −1.875 | 6.449 | <0.001 | |
| LOC100646598 | −1.877 | 7.588 | <0.001 | |
| LOC100650460 | −1.900 | 6.629 | <0.001 | |
| LOC100643115 | Uncharacterized protein LOC100643115 | −1.919 | 5.810 | 0.023 |
| LOC100644713 | −1.959 | 8.841 | <0.001 | |
| LOC100644893 | Neurotrimin‐like isoform X1 | −1.968 | 5.651 | <0.001 |
| LOC100648883 | −1.968 | 8.224 | <0.001 | |
| LOC100645985 | —NA— | −1.985 | 4.826 | 0.029 |
| LOC100647222 | −1.996 | 10.755 | <0.001 | |
| LOC100649178 | −2.001 | 0.465 | <0.001 | |
| LOC100645831 | −2.021 | 0.541 | 0.001 | |
| LOC100650649 | −2.064 | 7.973 | <0.001 | |
| LOC100644337 | Uncharacterized protein LOC100644337 | −2.081 | 7.848 | <0.001 |
| LOC100648482 | −2.130 | 6.922 | 0.002 | |
| LOC100651812 | −2.184 | 7.630 | <0.001 | |
| LOC100642508 | −2.226 | 2.487 | <0.001 | |
| LOC105666790 | −2.244 | 3.217 | <0.001 | |
| LOC100648508 | Uncharacterized protein LOC100648508 | −2.298 | 9.712 | <0.001 |
| LOC100647241 | −2.314 | 3.493 | <0.001 | |
| LOC100648563 | −2.314 | 3.255 | <0.001 | |
| LOC100645349 | −2.319 | 5.686 | <0.001 | |
| LOC100644867 | −2.330 | 6.433 | <0.001 | |
| LOC100650704 | −2.350 | 4.803 | <0.001 | |
| LOC100643391 | Zwei Ig domain protein zig‐8 | −2.378 | 4.512 | <0.001 |
| LOC105667180 | Uncharacterized protein LOC105667180 | −2.392 | 3.648 | <0.001 |
| LOC100647739 | Cell wall protein RBR3‐like | −2.444 | 3.621 | <0.001 |
| LOC100643622 | −2.485 | 5.346 | <0.001 | |
| LOC100646104 | Endochitinase A1‐like | −2.577 | 2.397 | 0.041 |
| LOC100649907 | −2.734 | 6.882 | <0.001 | |
| LOC100643254 | Uncharacterized protein LOC100643254 | −2.860 | 3.945 | <0.001 |
| LOC100646690 | −2.880 | 5.792 | <0.001 | |
| LOC100648425 | −3.060 | 2.570 | <0.001 | |
| LOC100649744 | −3.112 | 11.820 | <0.001 | |
| LOC110119840 | Lymphocyte expansion molecule‐like | −3.228 | −0.248 | <0.001 |
| LOC100650436 | −3.240 | 10.056 | 0.039 | |
| LOC100644470 | −3.506 | 6.307 | <0.001 | |
| LOC100647759 | −3.915 | 10.417 | <0.001 | |
| LOC100644839 | −4.203 | 3.045 | <0.001 | |
| LOC100645869 | Elastin‐like | −6.097 | 3.083 | 0.003 |
Note: Positive log‐fold change (logFC) indicates higher expression in the DEP treatment.
Seidenath, D. , Weig, A. R. , Mittereder, A. , Hillenbrand, T. , Brüggemann, D. , Opel, T. , Langhof, N. , Riedl, M. , Feldhaar, H. , & Otti, O. (2023). Diesel exhaust particles alter gut microbiome and gene expression in the bumblebee Bombus terrestris . Ecology and Evolution, 13, e10180. 10.1002/ece3.10180
DATA AVAILABILITY STATEMENT
The raw data supporting the conclusions of this article will be made available by the authors, without undue reservation. The microbiome and RNA‐Seq sequencing data were deposited at NCBI's Sequence Read Archive (SRA) under Bioproject numbers PRJNA907197 (16S microbiome sequencing) and PRJNA907822 (transcriptome sequencing), respectively.
REFERENCES
- Al Naggar, Y. , Dabour, K. , Masry, S. , Sadek, A. , Naiem, E. , & Giesy, J. P. (2020). Sublethal effects of chronic exposure to CdO or PbO nanoparticles or their binary mixture on the honey bee (Apis mellifera L.). Environmental Science and Pollution Research, 27(16), 19004–19015. 10.1007/s11356-018-3314-2 [DOI] [PubMed] [Google Scholar]
- Alsbou, E. M. E. , & Al‐Khashman, O. A. (2018). Heavy metal concentrations in roadside soil and street dust from Petra region, Jordan. Environmental Monitoring and Assessment, 190, 1–13. 10.1007/s10661-017-6409-1 [DOI] [PubMed] [Google Scholar]
- Ami, E. B. , Yuval, B. , & Jurkevitch, E. (2010). Manipulation of the microbiota of mass‐reared Mediterranean fruit flies Ceratitis capitata (Diptera: Tephritidae) improves sterile male sexual performance. The ISME Journal, 4(1), 28–37. 10.1038/ismej.2009.82 [DOI] [PubMed] [Google Scholar]
- Anders, S. , Pyl, P. T. , & Huber, W. (2015). HTSeq—A python framework to work with high‐throughput sequencing data. Bioinformatics, 31(2), 166–169. 10.1093/bioinformatics/btu638 [DOI] [PMC free article] [PubMed] [Google Scholar]
- Anderson, M. J. (2008). A new method for non‐parametric multivariate analysis of variance. Austral Ecology, 26(1), 32–46. 10.1111/j.1442-9993.2001.01070.pp.x [DOI] [Google Scholar]
- Apprill, A. , McNally, S. , Parsons, R. , & Weber, L. (2015). Minor revision to V4 region SSU rRNA 806R gene primer greatly increases detection of SAR11 bacterioplankton. Aquatic Microbial Ecology, 75(2), 129–137. 10.3354/ame01753 [DOI] [Google Scholar]
- Aufauvre, J. , Misme‐Aucouturier, B. , Viguès, B. , Texier, C. , Delbac, F. , & Blot, N. (2014). Transcriptome analyses of the honeybee response to Nosema ceranae and insecticides. PLoS One, 9(3), e91686. 10.1371/journal.pone.0091686 [DOI] [PMC free article] [PubMed] [Google Scholar]
- Bassene, H. , Niang, E. H. A. , Fenollar, F. , Doucoure, S. , Faye, O. , Raoult, D. , Sokhna, C. , & Mediannikov, O. (2020). Role of plants in the transmission of Asaia sp., which potentially inhibit the plasmodium sporogenic cycle in anopheles mosquitoes. Scientific Reports, 10(1), 1–10. 10.1038/s41598-020-64163-5 [DOI] [PMC free article] [PubMed] [Google Scholar]
- Bebane, P. S. , Hunt, B. J. , Pegoraro, M. , Jones, A. C. , Marshall, H. , Rosato, E. , & Mallon, E. B. (2019). The effects of the neonicotinoid imidacloprid on gene expression and DNA methylation in the buff‐tailed bumblebee Bombus terrestris . Proceedings of the Royal Society of London. Series B, 286(1905), 20190718. 10.1098/rspb.2019.0718 [DOI] [PMC free article] [PubMed] [Google Scholar]
- Beyers, D. W. , Rice, J. A. , Clements, W. H. , & Henry, C. J. (1999). Estimating physiological cost of chemical exposure: Integrating energetics and stress to quantify toxic effects in fish. Canadian Journal of Fisheries and Aquatic Sciences, 56(5), 814–822. 10.1139/f99-006 [DOI] [Google Scholar]
- Bindea, G. , Galon, J. , & Mlecnik, B. (2013). CluePedia Cytoscape plugin: Pathway insights using integrated experimental and in silico data. Bioinformatics, 29(5), 661–663. 10.1093/bioinformatics/btt019 [DOI] [PMC free article] [PubMed] [Google Scholar]
- Bindea, G. , Mlecnik, B. , Hackl, H. , Charoentong, P. , Tosolini, M. , Kirilovsky, A. , Fridman, W. H. , Pagès, F. , Trajanoski, Z. , & Galon, J. (2009). ClueGO: A Cytoscape plug‐in to decipher functionally grouped gene ontology and pathway annotation networks. Bioinformatics, 25(8), 1091–1093. 10.1093/bioinformatics/btp101 [DOI] [PMC free article] [PubMed] [Google Scholar]
- Bisanz, J. E. (2018). qiime2R: Importing QIIME2 artifacts and associated data into R sessions. https://github.com/jbisanz/qiime2R
- Bokulich, N. A. , Kaehler, B. D. , Rideout, J. R. , Dillon, M. , Bolyen, E. , Knight, R. , Huttley, G. A. , & Caporaso, J. G. (2018). Optimizing taxonomic classification of marker‐gene amplicon sequences with QIIME 2's q2‐feature‐classifier plugin. Microbiome, 6(1), 1–17. 10.1186/s40168-018-0470-z [DOI] [PMC free article] [PubMed] [Google Scholar]
- Bolger, A. M. , Lohse, M. , & Usadel, B. (2014). Trimmomatic: A flexible trimmer for Illumina sequence data. Bioinformatics, 30(15), 2114–2120. 10.1093/bioinformatics/btu170 [DOI] [PMC free article] [PubMed] [Google Scholar]
- Bolyen, E. , Rideout, J. R. , Dillon, M. R. , Bokulich, N. A. , Abnet, C. C. , al‐Ghalith, G. A. , Alexander, H. , Alm, E. J. , Arumugam, M. , Asnicar, F. , Bai, Y. , Bisanz, J. E. , Bittinger, K. , Brejnrod, A. , Brislawn, C. J. , Brown, C. T. , Callahan, B. J. , Caraballo‐Rodríguez, A. M. , Chase, J. , … Caporaso, J. G. (2019). Reproducible, interactive, scalable and extensible microbiome data science using QIIME 2. Nature Biotechnology, 37, 852–857. 10.1038/s41587-019-0209-9 [DOI] [PMC free article] [PubMed] [Google Scholar]
- Bosmans, L. , Pozo, M. I. , Verreth, C. , Crauwels, S. , Wilberts, L. , Sobhy, I. S. , Wäckers, F. , Jacquemyn, H. , & Lievens, B. (2018). Habitat‐specific variation in gut microbial communities and pathogen prevalence in bumblebee queens (Bombus terrestris). PLoS One, 13(10), e0204612. 10.1371/journal.pone.0204612 [DOI] [PMC free article] [PubMed] [Google Scholar]
- Brooks, M. E. , Kristensen, K. , van Benthem, K. J. , Magnusson, A. , Berg, C. W. , Nielsen, A. , Skaug, H. J. , Maechler, M. , & Bolker, B. M. (2017). glmmTMB balances speed and flexibility among packages for zero‐inflated generalized linear mixed modeling. The R Journal, 9(2), 378–400. 10.32614/RJ-2017-066 [DOI] [Google Scholar]
- Callahan, B. J. , McMurdie, P. J. , Rosen, M. J. , Han, A. W. , Johnson, A. J. A. , & Holmes, S. P. (2016). DADA2: High‐resolution sample inference from Illumina amplicon data. Nature Methods, 13(7), 581–583. 10.1038/nmeth.3869 [DOI] [PMC free article] [PubMed] [Google Scholar]
- Calow, P. (1991). Physiological costs of combating chemical toxicants: Ecological implications. Comparative Biochemistry and Physiology. C, Comparative Pharmacology and Toxicology, 100(1–2), 3–6. 10.1016/0742-8413(91)90110-f [DOI] [PubMed] [Google Scholar]
- Cameron, S. A. , & Sadd, B. M. (2020). Global trends in bumble bee health. Annual Review of Entomology, 65, 209–232. 10.1146/annurev-ento-011118-111847 [DOI] [PubMed] [Google Scholar]
- Capone, A. , Ricci, I. , Damiani, C. , Mosca, M. , Rossi, P. , Scuppa, P. , Crotti, E. , Epis, S. , Angeletti, M. , Valzano, M. , Sacchi, L. , Bandi, C. , Daffonchio, D. , Mandrioli, M. , & Favia, G. (2013). Interactions between Asaia, plasmodium and anopheles: New insights into mosquito symbiosis and implications in malaria symbiotic control. Parasites Vectors, 6(1), 1–13. 10.1186/1756-3305-6-182 [DOI] [PMC free article] [PubMed] [Google Scholar]
- Cardoso, P. , Barton, P. S. , Birkhofer, K. , Chichorro, F. , Deacon, C. , Fartmann, T. , Fukushima, C. S. , Gaigher, R. , Habel, J. C. , Hallmann, C. A. , Hill, M. J. , Hochkirch, A. , Kwak, M. L. , Mammola, S. , Ari Noriega, J. , Orfinger, A. B. , Pedraza, F. , Pryke, J. S. , Roque, F. O. , … Samways, M. J. (2020). Scientists' warning to humanity on insect extinctions. Biological Conservation, 242, 108426. 10.1016/j.biocon.2020.108426 [DOI] [Google Scholar]
- Cariveau, D. P. , Elijah Powell, J. , Koch, H. , Winfree, R. , & Moran, N. A. (2014). Variation in gut microbial communities and its association with pathogen infection in wild bumble bees (Bombus). The ISME Journal, 8(12), 2369–2379. 10.1038/ismej.2014.68 [DOI] [PMC free article] [PubMed] [Google Scholar]
- Chen, J. , Guo, Y. , Huang, S. , Zhan, H. , Zhang, M. , Wang, J. , & Shu, Y. (2021). Integration of transcriptome and proteome reveals molecular mechanisms underlying stress responses of the cutworm, Spodoptera litura, exposed to different levels of lead (Pb). Chemosphere, 283, 131205. 10.1016/j.chemosphere.2021.131205 [DOI] [PubMed] [Google Scholar]
- Christen, V. , Schirrmann, M. , Frey, J. E. , & Fent, K. (2018). Global transcriptomic effects of environmentally relevant concentrations of the neonicotinoids clothianidin, imidacloprid, and thiamethoxam in the brain of honey bees (Apis mellifera). Environmental Science & Technology, 52(13), 7534–7544. 10.1021/acs.est.8b01801 [DOI] [PubMed] [Google Scholar]
- Colgan, T. J. , Fletcher, I. K. , Arce, A. N. , Gill, R. J. , Ramos Rodrigues, A. , Stolle, E. , Chittka, L. , & Wurm, Y. (2019). Caste‐and pesticide‐specific effects of neonicotinoid pesticide exposure on gene expression in bumblebees. Molecular Ecology, 28(8), 1964–1974. 10.1111/mec.15047 [DOI] [PMC free article] [PubMed] [Google Scholar]
- Conti, M. E. , & Botrè, F. (2001). Honeybees and their products as potential bioindicators of heavy metals contamination. Environmental Monitoring and Assessment, 69, 267–282. 10.1023/A:1010719107006 [DOI] [PubMed] [Google Scholar]
- Crotti, E. , Damiani, C. , Pajoro, M. , Gonella, E. , Rizzi, A. , Ricci, I. , Negri, I. , Scuppa, P. , Rossi, P. , Ballarini, P. , Raddadi, N. , Marzorati, M. , Sacchi, L. , Clementi, E. , Genchi, M. , Mandrioli, M. , Bandi, C. , Favia, G. , Alma, A. , & Daffonchio, D. (2009). Asaia, a versatile acetic acid bacterial symbiont, capable of cross‐colonizing insects of phylogenetically distant genera and orders. Environmental Microbiology, 11(12), 3252–3264. 10.1111/j.1462-2920.2009.02048.x [DOI] [PubMed] [Google Scholar]
- Daisley, B. A. , Chmiel, J. A. , Pitek, A. P. , Thompson, G. J. , & Reid, G. (2020). Missing microbes in bees: How systematic depletion of key symbionts erodes immunity. Trends in Microbiology, 28(12), 1010–1021. 10.1016/j.tim.2020.06.006 [DOI] [PubMed] [Google Scholar]
- David, J. P. , Coissac, E. , Melodelima, C. , Poupardin, R. , Riaz, M. A. , Chandor‐Proust, A. , & Reynaud, S. (2010). Transcriptome response to pollutants and insecticides in the dengue vector Aedes aegypti using next‐generation sequencing technology. BMC Genomics, 11(1), 1–12. 10.1186/1471-2164-11-216 [DOI] [PMC free article] [PubMed] [Google Scholar]
- DeBofsky, A. , Xie, Y. , Challis, J. K. , Jain, N. , Brinkmann, M. , Jones, P. D. , & Giesy, J. P. (2021). Responses of juvenile fathead minnow (Pimephales promelas) gut microbiome to a chronic dietary exposure of benzo [a] pyrene. Environmental Pollution, 278, 116821. 10.1016/j.envpol.2021.116821 [DOI] [PubMed] [Google Scholar]
- DeBofsky, A. , Xie, Y. , Grimard, C. , Alcaraz, A. J. , Brinkmann, M. , Hecker, M. , & Giesy, J. P. (2020). Differential responses of gut microbiota of male and female fathead minnow (Pimephales promelas) to a short‐term environmentally‐relevant, aqueous exposure to benzo [a] pyrene. Chemosphere, 252, 126461. 10.1016/j.chemosphere.2020.126461 [DOI] [PubMed] [Google Scholar]
- DeGrandi‐Hoffman, G. , Corby‐Harris, V. , DeJong, E. W. , Chambers, M. , & Hidalgo, G. (2017). Honey bee gut microbial communities are robust to the fungicide pristine® consumed in pollen. Apidologie, 48(3), 340–352. 10.1007/s13592-016-0478-y [DOI] [Google Scholar]
- DeGruttola, A. K. , Low, D. , Mizoguchi, A. , & Mizoguchi, E. (2016). Current understanding of dysbiosis in disease in human and animal models. Inflammatory Bowel Diseases, 22(5), 1137–1150. 10.1097/MIB.0000000000000750 [DOI] [PMC free article] [PubMed] [Google Scholar]
- Desneux, N. , Decourtye, A. , & Delpuech, J. M. (2007). The sublethal effects of pesticides on beneficial arthropods. Annual Review of Entomology, 52(1), 81–106. 10.1146/annurev.ento.52.110405.091440 [DOI] [PubMed] [Google Scholar]
- Díaz, S. , Fargione, J. , Chapin, F. S., III , & Tilman, D. (2006). Biodiversity loss threatens human well‐being. PLoS Biology, 4(8), e277. 10.1371/journal.pbio.0040277 [DOI] [PMC free article] [PubMed] [Google Scholar]
- Ding, J. , Zhu, D. , Wang, H. T. , Lassen, S. B. , Chen, Q. L. , Li, G. , Lv, M. , & Zhu, Y. G. (2020). Dysbiosis in the gut microbiota of soil fauna explains the toxicity of tire tread particles. Environmental Science & Technology, 54(12), 7450–7460. 10.1021/acs.est.0c00917 [DOI] [PubMed] [Google Scholar]
- Dirzo, R. , Young, H. S. , Galetti, M. , Ceballos, G. , Isaac, N. J. , & Collen, B. (2014). Defaunation in the Anthropocene. Science, 345(6195), 401–406. 10.1126/science.1251817 [DOI] [PubMed] [Google Scholar]
- Dobin, A. , Davis, C. A. , Schlesinger, F. , Drenkow, J. , Zaleski, C. , Jha, S. , Batut, P. , Chaisson, M. , & Gingeras, T. R. (2013). STAR: Ultrafast universal RNA‐seq aligner. Bioinformatics, 29(1), 15–21. 10.1093/bioinformatics/bts635 [DOI] [PMC free article] [PubMed] [Google Scholar]
- Douglas, A. E. (2015). Multiorganismal insects: Diversity and function of resident microorganisms. Annual Review of Entomology, 60, 17. 10.1146/annurev-ento-010814-020822 [DOI] [PMC free article] [PubMed] [Google Scholar]
- Douglas, A. E. (2018). Omics and the metabolic function of insect–microbial symbioses. Current Opinion in Insect Science, 29, 1–6. 10.1016/j.cois.2018.05.012 [DOI] [PubMed] [Google Scholar]
- Duperron, S. , Halary, S. , Gallet, A. , & Marie, B. (2020). Microbiome‐aware ecotoxicology of organisms: Relevance, pitfalls, and challenges. Frontiers in Public Health, 8, 407. 10.3389/fpubh.2020.00407 [DOI] [PMC free article] [PubMed] [Google Scholar]
- Engel, P. , Kwong, W. K. , McFrederick, Q. , Anderson, K. E. , Barribeau, S. M. , Chandler, J. A. , Cornman, R. S. , Dainat, J. , de Miranda, J. R. , Doublet, V. , Emery, O. , Evans, J. D. , Farinelli, L. , Flenniken, M. L. , Granberg, F. , Grasis, J. A. , Gauthier, L. , Hayer, J. , Koch, H. , … Dainat, B. (2016). The bee microbiome: Impact on bee health and model for evolution and ecology of host‐microbe interactions. mBio, 7(2), e02164‐15. 10.1128/mBio.02164-15 [DOI] [PMC free article] [PubMed] [Google Scholar]
- Engel, P. , & Moran, N. A. (2013). The gut microbiota of insects–diversity in structure and function. FEMS Microbiology Reviews, 37(5), 699–735. 10.1111/1574-6976.12025 [DOI] [PubMed] [Google Scholar]
- Ernst, F. , Borman, T. , & Lahti, L. (2022). miaViz: Microbiome analysis plotting and visualization. R package version 1.6.0.
- Ernst, F. , Shetty, S. , Borman, T. , & Lahti, L. (2022). Mia: Microbiome analysis. R package version 1.5.17. https://github.com/microbiome/mia
- Favia, G. , Ricci, I. , Damiani, C. , Raddadi, N. , Crotti, E. , Marzorati, M. , Rizzi, A. , Urso, R. , Brusetti, L. , Borin, S. , Mora, D. , Scuppa, P. , Pasqualini, L. , Clementi, E. , Genchi, M. , Corona, S. , Negri, I. , Grandi, G. , Alma, A. , … Daffonchio, D. (2007). Bacteria of the genus Asaia stably associate with Anopheles stephensi, an Asian malarial mosquito vector. Proceedings of the National Academy of Sciences of the United States of America, 104(21), 9047–9051. 10.1073/pnas.0610451104 [DOI] [PMC free article] [PubMed] [Google Scholar]
- Favia, G. , Ricci, I. , Marzorati, M. , Negri, I. , Alma, A. , Sacchi, L. , Bandi, l C. , & Daffonchio, D. (2008). Bacteria of the genus Asaia: A potential paratransgenic weapon against malaria. In Aksoy S. (Ed.), Transgenesis and the management of vector‐borne disease. Advances in experimental medicine and biology (Vol. 627). Springer. 10.1007/978-0-387-78225-6_4 [DOI] [PubMed] [Google Scholar]
- Feldhaar, H. , & Otti, O. (2020). Pollutants and their interaction with diseases of social Hymenoptera. Insects, 11(3), 153. 10.3390/insects11030153 [DOI] [PMC free article] [PubMed] [Google Scholar]
- Fernandes, A. D. , Macklaim, J. M. , Linn, T. G. , Reid, G. , & Gloor, G. B. (2013). ANOVA‐like differential expression (ALDEx) analysis for mixed population RNA‐seq. PLoS One, 8(7), e67019. 10.1371/journal.pone.0067019 [DOI] [PMC free article] [PubMed] [Google Scholar]
- Fox, J. , & Weisberg, S. (2019). An R companion to applied regression (3rd ed.). Sage. https://socialsciences.mcmaster.ca/jfox/Books/Companion/ [Google Scholar]
- Gao, J. , Jin, S. S. , He, Y. , Luo, J. H. , Xu, C. Q. , Wu, Y. Y. , Hou, C. S. , Wang, Q. , & Diao, Q. Y. (2020). Physiological analysis and transcriptome analysis of Asian honey bee (Apis cerana cerana) in response to sublethal neonicotinoid imidacloprid. Insects, 11(11), 753. 10.3390/insects11110753 [DOI] [PMC free article] [PubMed] [Google Scholar]
- Gieré, R. , & Querol, X. (2010). Solid particulate matter in the atmosphere. Elements, 6(4), 215–222. 10.2113/gselements.6.4.215 [DOI] [Google Scholar]
- Gizaw, G. , Kim, Y. , Moon, K. , Choi, J. B. , Kim, Y. H. , & Park, J. K. (2020). Effect of environmental heavy metals on the expression of detoxification‐related genes in honey bee Apis mellifera . Apidologie, 51(4), 664–674. 10.1007/s13592-020-00751-8 [DOI] [Google Scholar]
- Greim, H. (2019). Diesel engine emissions: Are they no longer tolerable? Archives of Toxicology, 93(9), 2483–2490. 10.1007/s00204-019-02531-5 [DOI] [PubMed] [Google Scholar]
- Hamilton, G. A. , & Hartnett, H. E. (2013). Soot black carbon concentration and isotopic composition in soils from an arid urban ecosystem. Organic Geochemistry, 59, 87–94. 10.1016/j.orggeochem.2013.04.003 [DOI] [Google Scholar]
- Hammer, T. J. , Le, E. , Martin, A. N. , & Moran, N. A. (2021). The gut microbiota of bumblebees. Insectes Sociaux, 68(4), 287–301. 10.1007/s00040-021-00837-1 [DOI] [PMC free article] [PubMed] [Google Scholar]
- Harrison, J. F. (2009). Tracheal system. In Resh V. H. & Cardé R. T. (Eds.), Encyclopedia of insects (pp. 1011–1015). Academic Press. [DOI] [Google Scholar]
- Harrison, R. M. , Jones, A. M. , Gietl, J. , Yin, J. , & Green, D. C. (2012). Estimation of the contributions of brake dust, tire wear, and resuspension to nonexhaust traffic particles derived from atmospheric measurements. Environmental Science & Technology, 46(12), 6523–6529. 10.1021/es300894r [DOI] [PubMed] [Google Scholar]
- Hartig, F. (2022). DHARMa: Residual diagnostics for hierarchical (multi‐level/mixed) regression models. R package version 0.4.6. https://CRAN.R‐project.org/package=DHARMa
- Hladun, K. R. , Di, N. , Liu, T. X. , & Trumble, J. T. (2016). Metal contaminant accumulation in the hive: Consequences for whole‐colony health and brood production in the honey bee (Apis mellifera L.). Environmental Toxicology and Chemistry, 35(2), 322–329. 10.1002/etc.3273 [DOI] [PubMed] [Google Scholar]
- Holzinger, A. , Mair, M. M. , Lücker, D. , Seidenath, D. , Opel, T. , Langhof, N. , Otti, O. , & Feldhaar, H. (2022). Comparison of fitness effects in the earthworm Eisenia fetida after exposure to single or multiple anthropogenic pollutants. The Science of the Total Environment, 838, 156387. 10.1016/j.scitotenv.2022.156387 [DOI] [PubMed] [Google Scholar]
- Hothorn, T. , Bretz, F. , & Westfall, P. (2008). Simultaneous inference in general parametric models. Biometrical Journal, 50(3), 346–363. 10.1002/bimj.200810425 [DOI] [PubMed] [Google Scholar]
- Hüftlein, F. , Seidenath, D. , Mittereder, A. , Hillenbrand, T. , Brüggemann, D. , Otti, O. , Feldhaar, H. , Laforsch, C. , & Schott, M. (2023). Effects of diesel exhaust particles on the health and survival of the buff‐tailed bumblebee Bombus terrestris after acute and chronic oral exposure. 10.2139/ssrn.4415186 [DOI] [PubMed]
- Iijima, A. , Sato, K. , Yano, K. , Tago, H. , Kato, M. , Kimura, H. , & Furuta, N. (2007). Particle size and composition distribution analysis of automotive brake abrasion dusts for the evaluation of antimony sources of airborne particulate matter. Atmospheric Environment, 41(23), 4908–4919. 10.1016/j.atmosenv.2007.02.005 [DOI] [Google Scholar]
- Kassambara, A. (2020). Ggpubr: 'ggplot2' based publication ready plots. R package version 0.4.0. https://CRAN.R‐project.org/package=ggpubr
- Kautz, S. , Rubin, B. E. , & Moreau, C. S. (2013). Bacterial infections across the ants: Frequency and prevalence of Wolbachia, Spiroplasma, and Asaia . Psyche, 2013, 1–11. 10.1155/2013/936341 [DOI] [Google Scholar]
- Kim, K. H. , Kabir, E. , & Kabir, S. (2015). A review on the human health impact of airborne particulate matter. Environment International, 74, 136–143. 10.1016/j.envint.2014.10.005 [DOI] [PubMed] [Google Scholar]
- Koch, H. , Cisarovsky, G. , & Schmid‐Hempel, P. (2012). Ecological effects on gut bacterial communities in wild bumblebee colonies. The Journal of Animal Ecology, 81(6), 1202–1210. 10.1111/j.1365-2656.2012.02004.x [DOI] [PubMed] [Google Scholar]
- Koch, H. , & Schmid‐Hempel, P. (2011a). Bacterial communities in central European bumblebees: Low diversity and high specificity. Microbial Ecology, 62(1), 121–133. 10.1007/s00248-011-9854-3 [DOI] [PubMed] [Google Scholar]
- Koch, H. , & Schmid‐Hempel, P. (2011b). Socially transmitted gut microbiota protect bumble bees against an intestinal parasite. Proceedings of the National Academy of Sciences of the United States of America, 108(48), 19288–19292. 10.1073/pnas.1110474108 [DOI] [PMC free article] [PubMed] [Google Scholar]
- Koch, H. , & Schmid‐Hempel, P. (2012). Gut microbiota instead of host genotype drive the specificity in the interaction of a natural host‐parasite system. Ecology Letters, 15(10), 1095–1103. 10.1111/j.1461-0248.2012.01831.x [DOI] [PubMed] [Google Scholar]
- Koch, H. , Woodward, J. , Langat, M. K. , Brown, M. J. , & Stevenson, P. C. (2019). Flagellum removal by a nectar metabolite inhibits infectivity of a bumblebee parasite. Current Biology, 29(20), 3494–3500. 10.1016/j.cub.2019.08.037 [DOI] [PubMed] [Google Scholar]
- Kolde, R. (2019). Pheatmap: Pretty heatmaps. R package version 1.0.12. https://CRAN.R‐project.org/package=pheatmap
- Kwong, W. K. , Engel, P. , Koch, H. , & Moran, N. A. (2014). Genomics and host specialization of honey bee and bumble bee gut symbionts. Proceedings of the National Academy of Sciences of the United States of America, 111(31), 11509–11514. 10.1073/pnas.1405838111 [DOI] [PMC free article] [PubMed] [Google Scholar]
- Kwong, W. K. , Mancenido, A. L. , & Moran, N. A. (2017). Immune system stimulation by the native gut microbiota of honeybees. Royal Society Open Science, 4(2), 170003. 10.1098/rsos.170003 [DOI] [PMC free article] [PubMed] [Google Scholar]
- Kwong, W. K. , & Moran, N. A. (2016). Gut microbial communities of social bees. Nature Reviews. Microbiology, 14(6), 374–384. 10.1038/nrmicro.2016.43 [DOI] [PMC free article] [PubMed] [Google Scholar]
- Levy, M. , Kolodziejczyk, A. A. , Thaiss, C. A. , & Elinav, E. (2017). Dysbiosis and the immune system. Nature Reviews. Immunology, 17(4), 219–232. 10.1038/nri.2017.7 [DOI] [PubMed] [Google Scholar]
- Li, C. C. , Wang, Y. , Li, G. Y. , Yun, Y. L. , Dai, Y. J. , Chen, J. , & Peng, Y. (2016). Transcriptome profiling analysis of wolf spider Pardosa pseudoannulata (Araneae: Lycosidae) after cadmium exposure. International Journal of Molecular Sciences, 17(12), 2033. 10.3390/ijms17122033 [DOI] [PMC free article] [PubMed] [Google Scholar]
- Love, M. I. , Huber, W. , & Anders, S. (2014). Moderated estimation of fold change and dispersion for RNA‐seq data with DESeq2. Genome Biology, 15(12), 1–21. 10.1186/s13059-014-0550-8 [DOI] [PMC free article] [PubMed] [Google Scholar]
- Łukowski, A. , Popek, R. , Jagiełło, R. , Mąderek, E. , & Karolewski, P. (2018). Particulate matter on two prunus spp. decreases survival and performance of the folivorous beetle Gonioctena quinquepunctata . Environmental Science and Pollution Research, 25(17), 16629–16639. 10.1007/s11356-018-1842-4 [DOI] [PMC free article] [PubMed] [Google Scholar]
- Martin, M. (2011). Cutadapt removes adapter sequences from high‐throughput sequencing reads. EMBnet Journal, 17(1), 10–12. 10.14806/ej.17.1.200 [DOI] [Google Scholar]
- Martino, C. , Morton, J. T. , Marotz, C. A. , Thompson, L. R. , Tripathi, A. , Knight, R. , & Zengler, K. (2019). A novel sparse compositional technique reveals microbial perturbations. mSystems, 4(1), e00016‐19. 10.1128/mSystems.00016-19 [DOI] [PMC free article] [PubMed] [Google Scholar]
- Martinson, V. G. , Danforth, B. N. , Minckley, R. L. , Rueppell, O. , Tingek, S. , & Moran, N. A. (2011). A simple and distinctive microbiota associated with honey bees and bumble bees. Molecular Ecology, 20(3), 619–628. 10.1111/j.1365-294X.2010.04959.x [DOI] [PubMed] [Google Scholar]
- Martinson, V. G. , Moy, J. , & Moran, N. A. (2012). Establishment of characteristic gut bacteria during development of the honeybee worker. Applied and Environmental Microbiology, 78(8), 2830–2840. 10.1128/AEM.07810-11 [DOI] [PMC free article] [PubMed] [Google Scholar]
- Miličić, M. , Popov, S. , Branco, V. V. , & Cardoso, P. (2021). Insect threats and conservation through the lens of global experts. Conservation Letters, 14(4), e12814. 10.1111/conl.12814 [DOI] [Google Scholar]
- Mockler, B. K. , Kwong, W. K. , Moran, N. A. , & Koch, H. (2018). Microbiome structure influences infection by the parasite Crithidia bombi in bumble bees. Applied and Environmental Microbiology, 84(7), e02335‐17. 10.1128/AEM.02335-17 [DOI] [PMC free article] [PubMed] [Google Scholar]
- Motta, E. V. , Raymann, K. , & Moran, N. A. (2018). Glyphosate perturbs the gut microbiota of honey bees. Proceedings of the National Academy of Sciences of the United States of America, 115(41), 10305–10310. 10.1073/pnas.1803880115 [DOI] [PMC free article] [PubMed] [Google Scholar]
- Naka, K. , Watarai, S. , Inoue, K. , Kodama, Y. , Oguma, K. , Yasuda, T. , & Kodama, H. (2001). Adsorption effect of activated charcoal on enterohemorrhagic Escherichia coli . The Journal of Veterinary Medical Science, 63(3), 281–285. 10.1292/jvms.63.281 [DOI] [PubMed] [Google Scholar]
- Näpflin, K. , & Schmid‐Hempel, P. (2018). High gut microbiota diversity provides lower resistance against infection by an intestinal parasite in bumblebees. The American Naturalist, 192(2), 131–141. 10.1086/698013 [DOI] [PubMed] [Google Scholar]
- Ndakidemi, B. , Mtei, K. , & Ndakidemi, P. A. (2016). Impacts of synthetic and botanical pesticides on beneficial insects. Agricultural Sciences, 7(6), 364. 10.4236/as.2016.76038 [DOI] [Google Scholar]
- Negri, I. , Mavris, C. , Di Prisco, G. , Caprio, E. , & Pellecchia, M. (2015). Honey bees (Apis mellifera, L.) as active samplers of airborne particulate matter. PLoS One, 10(7), e0132491. 10.1371/journal.pone.0132491 [DOI] [PMC free article] [PubMed] [Google Scholar]
- Noriega, J. A. , Hortal, J. , Azcárate, F. M. , Berg, M. P. , Bonada, N. , Briones, M. J. I. , del Toro, I. , Goulson, D. , Ibanez, S. , Landis, D. A. , Moretti, M. , Potts, S. G. , Slade, E. M. , Stout, J. C. , Ulyshen, M. D. , Wackers, F. L. , Woodcock, B. A. , & Santos, A. M. C. (2018). Research trends in ecosystem services provided by insects. Basic and Applied Ecology, 26, 8–23. 10.1016/j.baae.2017.09.006 [DOI] [Google Scholar]
- Oksanen, J. , Simpson, G. , Blanchet, F. , Kindt, R. , Legendre, P. , Minchin, P. R. , O'Hara, R. B. , Solymos, P. , Stevens, M. H. H. , Szoecs, E. , Wagner, H. , Barbour, M. , Bedward, M. , Bolker, B. , Borcard, D. , Carvalho, G. , Chirico, M. , De Caceres, M. , Durand, S. , … Weedon, J. (2022). vegan: Community ecology package . R package version 2.6.2. https://CRAN.R‐project.org/package=vegan
- Patel, A. B. , Shaikh, S. , Jain, K. R. , Desai, C. , & Madamwar, D. (2020). Polycyclic aromatic hydrocarbons: Sources, toxicity, and remediation approaches. Frontiers in Microbiology, 11, 562813. 10.3389/fmicb.2020.562813 [DOI] [PMC free article] [PubMed] [Google Scholar]
- Peikertova, P. , & Filip, P. (2016). Influence of the automotive brake wear debris on the environment – A review of recent research. SAE International Journal of Materials and Manufacturing, 9, 133–146. 10.4271/2015-01-2663 [DOI] [Google Scholar]
- Powell, E. , Ratnayeke, N. , & Moran, N. A. (2016). Strain diversity and host specificity in a specialized gut symbiont of honeybees and bumblebees. Molecular Ecology, 25(18), 4461–4471. 10.1111/mec.13787 [DOI] [PMC free article] [PubMed] [Google Scholar]
- Prat, O. , & Degli‐Esposti, D. (2019). New challenges: Omics technologies in ecotoxicology. In Gross E. & Garric J. (Eds.), Ecotoxicology (pp. 181–208). Elsevier. [DOI] [Google Scholar]
- Quast, C. , Pruesse, E. , Yilmaz, P. , Gerken, J. , Schweer, T. , Yarza, P. , Peplies, J. , & Glöckner, F. O. (2013). The SILVA ribosomal RNA gene database project: Improved data processing and web‐based tools. Nucleic Acids Research, 41(D1), D590–D596. 10.1093/nar/gks1219 [DOI] [PMC free article] [PubMed] [Google Scholar]
- Quintanilla‐Mena, M. , Vega‐Arreguin, J. , Río‐García, D. , Patiño‐Suárez, V. , Peraza‐Echeverria, S. , & Puch‐Hau, C. (2021). The effect of benzo [a] pyrene on the gut microbiota of Nile tilapia (Oreochromis niloticus). Applied Microbiology and Biotechnology, 105(20), 7935–7947. 10.1007/s00253-021-11592-5 [DOI] [PubMed] [Google Scholar]
- R Core Team . (2022). R: A language and environment for statistical computing. R Foundation for Statistical Computing. https://www.R‐project.org/ [Google Scholar]
- Raymann, K. , Shaffer, Z. , & Moran, N. A. (2017). Antibiotic exposure perturbs the gut microbiota and elevates mortality in honeybees. PLoS Biology, 15(3), e2001861. 10.1371/journal.pbio.2001861 [DOI] [PMC free article] [PubMed] [Google Scholar]
- Rivera‐Utrilla, J. , Bautista‐Toledo, I. , Ferro‐García, M. A. , & Moreno‐Castilla, C. (2001). Activated carbon surface modifications by adsorption of bacteria and their effect on aqueous lead adsorption. Journal of Chemical Technology and Biotechnology, 76(12), 1209–1215. 10.1002/jctb.506 [DOI] [Google Scholar]
- Robinson, M. D. , McCarthy, D. J. , & Smyth, G. K. (2010). edgeR: A Bioconductor package for differential expression analysis of digital gene expression data. Bioinformatics, 26(1), 139–140. 10.1093/bioinformatics/btp616 [DOI] [PMC free article] [PubMed] [Google Scholar]
- Rönkkö, T. , & Timonen, H. (2019). Overview of sources and characteristics of nanoparticles in urban traffic‐influenced areas. Journal of Alzheimer's Disease, 72(1), 15–28. 10.3233/jad-190170 [DOI] [PMC free article] [PubMed] [Google Scholar]
- Rothman, J. A. , Leger, L. , Graystock, P. , Russell, K. , & McFrederick, Q. S. (2019). The bumble bee microbiome increases survival of bees exposed to selenate toxicity. Environmental Microbiology, 21(9), 3417–3429. 10.1111/1462-2920.14641 [DOI] [PubMed] [Google Scholar]
- Rothman, J. A. , Russell, K. A. , Leger, L. , McFrederick, Q. S. , & Graystock, P. (2020). The direct and indirect effects of environmental toxicants on the health of bumblebees and their microbiomes. Proceedings of the Royal Society B: Biological Sciences, 287(1937), 20200980. 10.1098/rspb.2020.0980 [DOI] [PMC free article] [PubMed] [Google Scholar]
- Sánchez‐Bayo, F. , & Wyckhuys, K. A. (2019). Worldwide decline of the entomofauna: A review of its drivers. Biological Conservation, 232, 8–27. 10.1016/j.biocon.2019.01.020 [DOI] [Google Scholar]
- Schirmer, K. , Fischer, B. B. , Madureira, D. J. , & Pillai, S. (2010). Transcriptomics in ecotoxicology. Analytical and Bioanalytical Chemistry, 397(3), 917–923. 10.1007/s00216-010-3662-3 [DOI] [PMC free article] [PubMed] [Google Scholar]
- Schönitzer, K. (1986). Quantitative aspects of antenna grooming in bees (Apoidea: Hymenoptera). Ethology, 73(1), 29–42. 10.1111/j.1439-0310.1986.tb00997.x [DOI] [Google Scholar]
- Seidenath, D. , Holzinger, A. , Kemnitz, K. , Langhof, N. , Lücker, D. , Opel, T. , Otti, O. , & Feldhaar, H. (2021). Individual vs. combined short‐term effects of soil pollutants on colony founding in a common ant species. Frontiers in Insect Science, 1, 761881. 10.3389/finsc.2021.761881 [DOI] [PMC free article] [PubMed] [Google Scholar]
- Shannon, P. , Markiel, A. , Ozier, O. , Baliga, N. S. , Wang, J. T. , Ramage, D. , Amin, N. , Schwikowski, B. , & Ideker, T. (2003). Cytoscape: A software environment for integrated models of biomolecular interaction networks. Genome Research, 13(11), 2498–2504. 10.1101/gr.1239303 [DOI] [PMC free article] [PubMed] [Google Scholar]
- Shi, T. F. , Wang, Y. F. , Liu, F. , Qi, L. , & Yu, L. S. (2017). Sublethal effects of the neonicotinoid insecticide thiamethoxam on the transcriptome of the honey bees (Hymenoptera: Apidae). Journal of Economic Entomology, 110(6), 2283–2289. 10.1093/jee/tox262 [DOI] [PubMed] [Google Scholar]
- Shreiner, A. B. , Kao, J. Y. , & Young, V. B. (2015). The gut microbiome in health and in disease. Current Opinion in Gastroenterology, 31(1), 69. 10.1097/MOG.0000000000000139 [DOI] [PMC free article] [PubMed] [Google Scholar]
- Straub, L. , Strobl, V. , & Neumann, P. (2020). The need for an evolutionary approach to ecotoxicology. Nature Ecology and Evolution, 4(7), 895. 10.1038/s41559-020-1194-6 [DOI] [PubMed] [Google Scholar]
- Subramanian, A. , Tamayo, P. , Mootha, K. M. , Mukherjee, S. , Ebert, B. L. , Gillette, M. A. , Paulovich, A. , Pomeroy, S. L. , Golub, T. R. , Lander, E. S. , & Mesirov, J. P. (2005). Gene set enrichment analysis: A knowledge‐based approach for interpreting genome‐wide expression profiles. Proceedings of the National Academy of Sciences of the United States of America, 102(43), 15545–15550. 10.1073/pnas.0506580102 [DOI] [PMC free article] [PubMed] [Google Scholar]
- Sun, K. , Song, Y. , He, F. , Jing, M. , Tang, J. , & Liu, R. (2021). A review of human and animals exposure to polycyclic aromatic hydrocarbons: Health risk and adverse effects, photo‐induced toxicity and regulating effect of microplastics. The Science of the Total Environment, 773, 145403. 10.1016/j.scitotenv.2021.145403 [DOI] [PubMed] [Google Scholar]
- Theis, K. R. , Dheilly, N. M. , Klassen, J. L. , Brucker, R. M. , Baines, J. F. , Bosch, T. C. , Cryan, J. F. , Gilbert, S. F. , Goodnight, C. J. , Lloyd, E. A. , Sapp, J. , Vandenkoornhuyse, P. , Zilber‐Rosenberg, I. , Rosenberg, E. , & Bordenstein, S. R. (2016). Getting the hologenome concept right: An eco‐evolutionary framework for hosts and their microbiomes. mSystems, 1(2), e00028‐16. 10.1128/mSystems.00028-16 [DOI] [PMC free article] [PubMed] [Google Scholar]
- Thorpe, A. , & Harrison, R. M. (2008). Sources and properties of non‐exhaust particulate matter from road traffic: A review. The Science of the Total Environment, 400(1–3), 270–282. 10.1016/j.scitotenv.2008.06.007 [DOI] [PubMed] [Google Scholar]
- Turner, S. , Pryer, K. M. , Miao, V. P. , & Palmer, J. D. (1999). Investigating deep phylogenetic relationships among cyanobacteria and plastids by small subunit rRNA sequence analysis. The Journal of Eukaryotic Microbiology, 46(4), 327–338. 10.1111/j.1550-7408.1999.tb04612.x [DOI] [PubMed] [Google Scholar]
- Valavanidis, A. , Fiotakis, K. , & Vlachogianni, T. (2008). Airborne particulate matter and human health: Toxicological assessment and importance of size and composition of particles for oxidative damage and carcinogenic mechanisms. Journal of Environmental Science and Health. Part C, Toxicology and Carcinogenesis, 26(4), 339–362. 10.1080/10590500802494538 [DOI] [PubMed] [Google Scholar]
- Wiaterek, C. (2012). Reibbeläge. In Breuer B. & Bill K. H. (Eds.), Bremsenhandbuch. ATZ/MTZFachbuch. Viewig + Teuber Verlag. [Google Scholar]
- Wichmann, H. E. (2007). Diesel exhaust particles. Inhalation Toxicology, 19(sup1), 241–244. 10.1080/08958370701498075 [DOI] [PubMed] [Google Scholar]
- Wickham, H. (2016). ggplot2: Elegant graphics for data analysis. Springer. 10.1007/978-3-319-24277-4_9 [DOI] [Google Scholar]
- Wickham, H. , & Girlich, M. (2022). Tidyr: Tidy messy data. R package version 1.2.1. https://CRAN.R‐project.org/package=tidyr
- Yilmaz, P. , Parfrey, L. W. , Yarza, P. , Gerken, J. , Pruesse, E. , Quast, C. , Schweer, T. , Peplies, J. , Ludwig, W. , & Glöckner, F. O. (2014). The SILVA and “all‐species living tree project (LTP)” taxonomic frameworks. Nucleic Acids Research, 42(D1), D643–D648. 10.1093/nar/gkt1209 [DOI] [PMC free article] [PubMed] [Google Scholar]
- Zereini, F. , & Wiseman, C. L. S. (2010). Urban airborne particulate matter. Springer. 10.1007/978-3-642-12278-1 [DOI] [Google Scholar]
- Zhang, Q. L. , Guo, J. , Deng, X. Y. , Wang, F. , Chen, J. Y. , & Lin, L. B. (2019). Comparative transcriptomic analysis provides insights into the response to the benzo (a) pyrene stress in aquatic firefly (Luciola leii). The Science of the Total Environment, 661, 226–234. 10.1016/j.scitotenv.2019.01.156 [DOI] [PubMed] [Google Scholar]
- Zhang, Q. L. , Jiang, Y. H. , Dong, Z. X. , Li, H. W. , & Lin, L. B. (2021). Exposure to benzo [a] pyrene triggers distinct patterns of microRNA transcriptional profiles in aquatic firefly Aquatica wuhana (Coleoptera: Lampyridae). Journal of Hazardous Materials, 401, 123409. 10.1016/j.jhazmat.2020.123409 [DOI] [PubMed] [Google Scholar]
- Zhang, W. , Chen, W. , Li, Z. , Ma, L. , Yu, J. , Wang, H. , Liu, Z. , & Xu, B. (2018). Identification and characterization of three new cytochrome P450 genes and the use of RNA interference to evaluate their roles in antioxidant defense in Apis cerana cerana Fabricius. Frontiers in Physiology, 9, 1608. 10.3389/fphys.2018.01608 [DOI] [PMC free article] [PubMed] [Google Scholar]
- Zhang, Z. J. , & Zheng, H. (2022). Bumblebees with the socially transmitted microbiome: A novel model organism for gut microbiota research. Insect Science, 29, 958–976. 10.1111/1744-7917.13040 [DOI] [PubMed] [Google Scholar]
- Zhao, Y. , Liu, H. , Wang, Q. , Li, B. , Zhang, H. , & Pi, Y. (2019). The effects of benzo [a] pyrene on the composition of gut microbiota and the gut health of the juvenile sea cucumber Apostichopus japonicus Selenka. Fish & Shellfish Immunology, 93, 369–379. 10.1016/j.fsi.2019.07.073 [DOI] [PubMed] [Google Scholar]
- Zilber‐Rosenberg, I. , & Rosenberg, E. (2008). Role of microorganisms in the evolution of animals and plants: The hologenome theory of evolution. FEMS Microbiology Reviews, 32(5), 723–735. 10.1111/j.1574-6976.2008.00123.x [DOI] [PubMed] [Google Scholar]
- Zöllner, C. (2019). Einsatz optischer und analytischer Methoden zur Bewertung des Betriebsverhaltens von Partikelfiltersystemen für die Anwendung im Verkehr. In Brüggemann D. (Ed.), Thermodynamik: Energie – Umwelt – Technik, Band 34., ISBN: 978‐3‐8325‐5032‐5. Logos. [Google Scholar]
Associated Data
This section collects any data citations, data availability statements, or supplementary materials included in this article.
Supplementary Materials
Appendix S1.
Data Availability Statement
The raw data supporting the conclusions of this article will be made available by the authors, without undue reservation. The microbiome and RNA‐Seq sequencing data were deposited at NCBI's Sequence Read Archive (SRA) under Bioproject numbers PRJNA907197 (16S microbiome sequencing) and PRJNA907822 (transcriptome sequencing), respectively.