

Abstract
Purpose:
To identify metrics of radiation dose delivered to highly ventilated lung that are predictive of radiation-induced pneumonitis.
Methods and Materials:
A cohort of 90 patients with locally advanced non-small cell lung cancer treated with standard fractionated radiation therapy (RT) (60-66 Gy in 30-33 fractions) were evaluated. Regional lung ventilation was determined from pre-RT 4-dimensional computed tomography (4DCT) using the Jacobian determinant of a B-spline deformable image registration to estimate lung tissue expansion during respiration. Multiple voxel-wise population- and individual-based thresholds for defining high functioning lung were considered. Mean dose and volumes receiving dose ≥ 5-60Gy were analyzed for both total lung-ITV (MLD,V5-V60) and highly ventilated functional lung-ITV (fMLD,fV5-fV60). The primary endpoint was symptomatic grade 2+ (G2+) pneumonitis. Receiver operator curve (ROC) analyses were used to identify predictors of pneumonitis.
Results:
G2+ pneumonitis occurred in 22.2% of patients, with no differences between stage, smoking status, COPD, or chemo/immunotherapy use between G<2 and G2+ patients (P ≥ 0.18). Highly ventilated lung was defined as voxels exceeding the population-wide median of 18% voxel-level expansion. All total and functional metrics were significantly different between patients with and without pneumonitis (P ≤ 0.039). Optimal ROC points predicting pneumonitis from functional lung dose were fMLD ≤ 12.3 Gy, fV5 ≤ 54% and fV20 ≤ 19%. Patients with fMLD ≤ 12.3 Gy had a 14% risk of developing G2+ pneumonitis whereas risk significantly increased to 35% for those with fMLD>12.3 Gy (P = 0.035).
Conclusions:
Dose to highly ventilated lung is associated with symptomatic pneumonitis and treatment planning strategies should focus on limiting dose to functional regions. These findings provide important metrics to be used in functional lung avoidance RT planning and designing clinical trials.
Keywords: functional lung avoidance, pneumonitis, lung cancer, 4D-CT, ventilating lung
Introduction
Lung cancer remains the leading cause of cancer-related mortality in the United States.1 Non-small cell lung cancer (NSCLC) makes up approximately 85% of lung cancer cases, for which radiotherapy (RT) is a crucial part of treatment.2 Following RT treatment, many patients may experience post-RT radiation-induced lung injuries (RILI) such as acute pneumonitis or late pulmonary fibrosis.3 Historical risk and incidence of RILI have been studied and symptomatic pulmonary toxicity after chemoradiation has been reported to be as high as 35%. RTOG 0617 found a 20% rate of any grade ≥ 2 (symptomatic) pulmonary toxicity (including pneumonitis, cough, dyspnea, fibrosis) and a 7% rate of grade ≥ 3 pneumonitis in a cohort of 217 NSCLC patients receiving standard 60 Gy dose plans.4,5 The QUANTEC report found a grade ≥ 2 radiation pneumonitis rate of 25%6 and the PACFIC study found grade 3 and 4 pneumonitis rates of 3.4% and 2.6%, respectively.7 Since RILI remain an important dose-limiting factor in lung RT, efforts to mitigate post-RT toxicities have been a focus in developing RT treatment plans that limit lung dose for NSCLC patients.
Historically, the best dosimetric predictors for radiation-induced pneumonitis and pulmonary toxicities are the mean lung dose (MLD) and volume of total lung receiving at least 20 Gy (V20); meta-analysis found that V20 > 40% of total lung volume is associated with a 35% risk of symptomatic radiation pneumonitis and >3% risk of fatal pneumonitis.(8) Hence, MLD and V20 are often used in treatment plan evaluation, quantifying dose to the entire lung. Multiple studies have demonstrated that patients’ lung function is heterogeneous,9,10 leading to exploration of high functioning lung sub-volumes and imaging biomarkers to quantify local functional variation. The practice of reducing delivered radiation dose to high functioning lung regions is known as lung functional avoidance RT and is currently being investigated in multiple prospective clinical trials (NCT02528942, NCT02308709, NCT02843568) with promising interim results demonstrating feasibility and achievement of dose reduction to functional lung.11–13
Regional pulmonary function can be quantified by generating ventilation and/or perfusion biomarkers from several medical imaging modalities.14–28 Four-dimensional CT (4DCT) scans is one advantageous method of determining lung ventilation due to its routine use in treatment planning and high spatial resolution. One method of calculating CT-ventilation is to use deformable image registration to find the pointwise correspondence maps between the 4DCT breathing phase images and then calculate the Jacobian determinant of those mappings.14,15 Studies have shown that knowing the dose delivered to high functioning lung can be used to predict radiation-induced pneumonitis.29–32 For continued integration of functional lung dose into the treatment planning process, identifying appropriate functional lung definitions and dosimetric targets is crucial.
This study expands upon previous work to further understand dose to functional lung in relation to post-therapy toxicities. In a cohort of patients with locally advanced NSCLC treated with chemoradiation, we measured and quantified highly ventilated lung using a novel Jacobian-based method; this technique incorporates image data from all 4DCT breathing phases and is unique to our group.15, 33–35 Given that there is not a consensus on how to define functioning lung, several high functioning lung definitions were analyzed, including thresholds based on individual- and population-level ventilation distributions. Combining regional lung function and radiation dose distributions, specific functional lung dose metrics were identified and assessed for correlation with and prediction of radiation-pneumonitis incidence.
Methods and Materials
Patient population and selection criteria
In this institutional review board-approved study (IRB#2021-0679), 103 patients treated with chemoradiation for locally advanced NSCLC were retrospectively identified. Thirty six of these patients were enrolled in a clinical study (IRB#2016-0610, NCT02843568(13)) and had toxicity data collected prospectively. The remaining 67 patients had post treatment toxicity determined by retrospective chart review. All patients were treated with standard of care definitive intent conventional fractionation RT without functional lung avoidance techniques at the University of Wisconsin-Madison (UW-Madison) between 2014 and 2020. Upon review, a total of 13 patients (12.6%) were excluded due to prior stereotactic body RT (SBRT) treatments (7 patients), significant image artifacts (1 patient), expiring prior to potential onset of pneumonitis (2 patients), complex and extensive treatment adaptations (1 patient), or superior sulcus tumors with minimal lung irradiation dose (2 patients).
Treatment
CT-simulation was performed by acquiring a pre-RT 4DCT scan on a Siemens SOMATOM Definition Edge (Siemens Healthineers, Erlangen, Germany) with scan parameters of 120 kV, 100 mAs/rotation, 0.09 pitch, 0.5 second tube rotation time, 76.8 mm beam collimation, and 128 detector rows. Patients were positioned head-first supine with arms raised above their head. Immobilization was achieved using a full body vacuum cushion (BlueBAG BodyFix; Elekta AB, Stockholm, Sweden). Contouring of internal, clinical, and planning target volumes (ITV, CTV, PTV) and organs at risk (OAR) was completed on the average 4DCT image by an experienced radiation oncologist using MIM (MIM Software Inc, Cleveland, OH). Target and OAR contours were used in treatment planning, which was performed on the average 4DCT using RayStation (RaySearch Laboratories, Stockholm, Sweden). Plans were generated using volumetric-modulated arc therapy (VMAT) or intensity modulated RT (IMRT) with a 6 MV photon beam and 0.2 cm dose calculation grid. All RT treatment plans had a prescription (Rx) dose of 60-66 Gy in 30-33 treatment fractions delivered using either a Tomotherapy (Accuray, Madison, WI), TrueBeam (Varian Medical Systems, Palo Alto, CA) or ViewRay (Varian Medical Systems, Palo Alto, CA) linear accelerator. Additionally, chemotherapy use was determined at the discretion of the treating oncology team.
RT plan quality was ensured per the institutional treatment planning objective (TPO). Target goals were a minimum of 95% coverage of Rx dose to the PTV (D95% ≥ RxPTV), and maximum and minimum doses of 110% and 90% Rx, respectively (D2% ≤ 110%RxPTV, D98% ≥ 90%RxPTV). OAR dose constraints for the lungs were computed on the lung-ITV volume with institutional goals of achieving mean lung dose (MLD) ≤ 18 Gy and volumes receiving at least 5 and 20 Gy (V5 and V20) ≤ 60% and ≤ 30% of lung-ITV, respectively. Constraints of MLD ≤ 20 Gy, V5 ≤ 75%, and V20 ≤ 35% were used if the dosimetric goals could not be met. Other relevant OAR dose constraints included those to the esophagus (Dmean ≤ 34 Gy,V105%Rx < 0.1 cc), heart (Dmean < 30 Gy, V40 < 80%,V45 < 60%,V60 < 30%) and spinal cord (V50 < 0.1 cc). All TPO requirements were reviewed and approved by the treating radiation oncologist.
4DCT-Ventilation Map Derivation
Regional ventilation was derived from the CT-simulation 4DCT acquired pre-RT. Images were reconstructed with a medium smooth kernel (B50f or Br51f), 512 mm extended field of view and 1 mm slice thickness. The Varian Real-Time Position Management (RPM) system (Varian Medical Systems Inc., Palo Alto, CA) was used to track subjects’ breathing trace during 4DCT acquisition. The respiratory trace was used to amplitude bin image data into ten (N=10) breathing phases for image reconstruction, including five inspiratory (IN) and five expiratory (EX) phases. These phases were classified by their percentage inspiration or expiration in 20% increments (20IN, 40IN, 60IN, 80IN, 100IN, 80EX, 60EX, 40EX, 20EX and 0EX); 100IN denotes full inspiration and 0EX denotes full expiration. This phase breakdown has been previously described in detail.36
Following 4DCT acquisition and reconstruction, image post-processing was applied to generate ventilation maps representing regional variation in pre-RT lung function. All N-1 inspiratory and expiratory 4DCT breathing phase images were deformably registered to the 0EX image using a B-spline deformable image registration (DIR) with a sum of squared tissue volume differences (SSTVD) metric to account for lung density changes caused by expansion throughout the breathing cycle.37 Let denote the vector valued DIR transformation that maps phase image i into the coordinate system of the 0EX phase image for each point in the coordinate system of the 0EX image. The voxel-wise expansion/contraction of the lung at breathing phase i in the coordinate system of the 0EX image at location is given by the determinant of the Jacobian.14
| [1] |
The Jacobian calculation was repeated for the N – 1 = 9 breathing phase transformations.
The nine Jacobian determinants were then used to compute the N-phase local expansion ratio (LER-N):
| [2] |
Using image data from all breathing phases is unique to our group’s LER-N ventilation calculation and was originally introduced by Shao et al.15 Calculating the Jacobian determinant only between full inspiratory and full expiratory images underestimates ventilation in lung tissue voxels that reach minimum or maximum expansion in an intermediate breathing phase (not 0EX or 100IN). Different voxels in the lung that reach minimum/maximum expansion in a different phases than the 100IN phase are referred to as having out-of-phase ventilation and have been reported to make up 14-19% of the lung volume.15,33 The LER-N ventilation calculation approach described here addresses out-of-phase ventilation using multiple breathing phase images.
Since all 4DCTs in this work were reconstructed into N = 10 breathing phase images and all phases were used in ventilation calculation, LER-N ventilation values can equivalently be called LER-10. LER-10 Jacobian values typically have a range of 1-2, where J=1 indicates no voxel-level expansion and J>1 indicates expansion in the given voxel with higher J values representing more expansion. For example, a voxel with a Jacobian value of J=1.1 roughly corresponds to 10% voxel-level expansion.
The CT-ventilation methods described in this work are being used in an ongoing clinical trial (NCT02843568) investigating functional avoidance RT. The image-based DIR calculations can be computed on CPU systems in less than one hour. Other functional avoidance clinical trials38, 39 also make use of DIR, demonstrating practicality and ability to be implemented into current workflow in a variety of clinical settings.
Defining Highly Ventilated Lung
The growing field of CT-based functional lung imaging does not currently have a standard definition of high functioning lung; many studies compare pre- and post-RT derived ventilation maps, so ventilation changes are quantified rather than absolute values being defined as high or low functioning. Previous studies using dose to highly ventilated lung to predict pneumonitis found different definitions of high functioning lung to be most predictive; Faught et al.32 found that using the 84th percentile of ventilation values for individual subjects was most predictive, while O’Reilly et al.30 used the 40th percentile as the functioning lung definition threshold. To our knowledge, all previous studies have defined high functioning lung on an individual patient basis, i.e., labelling regions with the top X% of ventilation values in each patient’s lungs as highly ventilated.
In this work, multiple definitions of highly ventilated lung were evaluated, including both individual-based and cohort population-based definitions. With the individual-based approach, lung voxels with the top X% of ventilation values (for X = 5-95 in 5% increments) were defined as high functioning lung. With the population-based approach, any voxel with a ventilation value greater than the Xth percentile for the analyzed patient cohort was defined as high functioning lung. The population-based definition allowed patients to have varying degrees of highly ventilated lung instead of assuming all patients have the same percentage of lung labelled as high functioning. A single highly ventilated lung definition was selected by comparing predictive ability for pneumonitis using area under the receiver operating characteristic (AUROC) curve, as described in the statistics section.
Dose Metric Evaluation
Each patient’s delivered radiation dose distribution was calculated in the reference frame of the average pre-RT 4DCT; quantitative dose metrics were computed on the physician contoured total lung-ITV. Standard dose metrics used were the mean lung dose (MLD) and volumes receiving dose over thresholds of 5-60 Gy (V5-V60) in 5 Gy increments. Dose volumes, such as V5, were quantified as a percentage of the considered lung (total lung-ITV) volume.
To evaluate functional dose metrics, ventilation maps were registered to the average 4DCT reference frame (from the 4DCT 0EX image). Functional dose metrics analogous to standard dose metrics were evaluated. Functional mean lung dose (fMLD) was defined as the mean dose delivered to functional lung. Similarly, functional lung volumes receiving ≥ 5-60 Gy were referred to as fV5-fV60. fV5-fV60 were quantified as the percentage of the functional lung-ITV volume. As an additional multivariate analysis, functional dose-volume metrics (fV5-fV60) were considered in addition to total lung MLD (i.e., predictive ability of MLD+fV5, etc.). Functional lung is a part of total lung and therefore, by definition, not independent; combining functional metrics with the historically strong predictor of MLD helps establish potential benefits of using functional metrics while still considering the relevance of overall dose.
Follow-up and outcomes
Patient follow-ups for outcomes occurred every three months after treatment completion. At each follow-up, patients were graded for post-RT radiation-induced pneumonitis (grades 0-5) using Common Terminology Criteria for Adverse Events, version 4.03. The primary endpoint of this analysis was symptomatic Grade 2 or higher (G2+) radiation pneumonitis requiring steroids. In addition to toxicity grading, patient characteristics including PFTs, COPD, smoking status, and oxygen usage were collected.
Statistical Analysis
For all patients, collected clinical characteristics were compared between patients with and without G2+ pneumonitis. To test for significant differences between G<2 and G2+ groups, median values of continuous variables were compared using a two-sided Student’s t test while categorical variables were compared using the Fisher exact test; both tests are non-parametric. Mean values for all total and functional lung dosimetric parameters were compared between pneumonitis and non-pneumonitis groups using a two-sided paired Student’s t test. For all tests, statistical significance was determined at the α = 0.05 level. Area between G<2 and G2+ dose-volume histogram (DVH) curves were also quantified using trapezoidal area estimation in MATLAB R2018a (MathWorks, Natick, MA).
In addition to comparing G<2 and G2+ groups, statistical modeling was performed in R 4.1.2. (R Core Team, Vienna, Austria) to compare individual-based versus population-based highly ventilated lung definition thresholds and to compare the predictive capability of dose metrics. Logistic regression models were fit using leave-one-out cross-validation (LOO-CV), in which the model was trained on all subjects but one, and then tested on that subject. Models were then evaluated using receiver operating characteristic (ROC) analysis. AUROC was used to select a high functioning lung definition.
Optimal cutoffs for predicting pneumonitis based on functional dose metrics were identified by standard ROC analysis on each metric, not requiring the logistic regression modeling or LOO-CV procedure. An operating point on the ROC curve was selected through maximizing “informedness”40 using Youden’s J statistic, defined as:
| [3] |
Once optimal cutoffs were identified using Youden’s J with ROC analysis, risk of developing G2+ pneumonitis was quantified. Risk was compared between patients whose treatment plans did and did not satisfy the identified optimal cutoffs. For each dose metric, the Fisher exact test was used to test for significance in the comparison.
Results
Of the 90 patients in the cohort, 20 developed grade ≥ 2 (G2+) radiation pneumonitis (22.2%) including 13 with grade ≥ 3 (G3+) pneumonitis (14.4%). All clinical variables collected for the patient cohort are given in Table 1. Of all characteristics, only radiation dose/fractionation scheme demonstrated a significant difference between G<2 and G2+ patients (P = 0.03).
Tabel 1:
Patient Characteristics
| Patient Characteristic | No Symptomatic Pneumonitis (n=70) | Pneumonitis Grade ≥2 (n=20) | P-value |
|---|---|---|---|
|
| |||
| Age | 0.36 | ||
| Median (Range) | 66.3 (43.8 85.9) | 63.5 (44.4 79.9) | |
|
| |||
| Sex (%) | 0.86 | ||
| Male | 44 (62.9%) | 13 (65.0%) | |
| Female | 26 (37.1%) | 7 (35.0%) | |
|
| |||
| Clinical Stage (%) | 0.18 | ||
| Stage IIA/B | 5 (7.1%) | 2 (10.0%) | |
| Stage IIIA | 36 (51.4%) | 14 (70.0%) | |
| Stage IIIB | 20 (28.6%) | 2 (10.0%) | |
| Stage IIIC | 7 (10.0%) | 0 (0.0%) | |
| Stage IV | 2 (2.9%) | 2 (10.0%) | |
|
| |||
| T-stage (%) | 0.41 | ||
| Tx | 6 (8.6%) | 0 (0.0%) | |
| T1 | 15 (21.4%) | 5 (25.0%) | |
| T2 | 21 (30.0%) | 7 (35.0%) | |
| T3 | 15 (21.4%) | 2 (10.0%) | |
| T4 | 13 (18.6%) | 6 (30.0%) | |
|
| |||
| N-stage (%) | 0.24 | ||
| N0 | 6 (8.6%) | 3 (15.0%) | |
| N1 | 7 (10.0%) | 5 (25.0%) | |
| N2 | 39 (55.7%) | 8 (40.0%) | |
| N3 | 18 (25.7%) | 4 (20.0%) | |
|
| |||
| Smoker (%) | 0.75 | ||
| Never smoker | 6 (8.6%) | 2 (10.0%) | |
| Current smoker | 20 (38.6%) | 4 (20.0%) | |
| Former smoker | 44 (62.9%) | 14 (70.0%) | |
|
| |||
| COPD | 0.57 | ||
| Yes | 37 (52.9%) | 12 (60.0%) | |
| No | 33 (47.1%) | 8 (40.0%) | |
|
| |||
| Previous Thoracic Surgery (%) | 0.80 | ||
| Yes | 9 (12.9%) | 3 (15.0%) | |
| No | 61 (87.1%) | 17 (85.0%) | |
|
| |||
| Pre-Treatment O2 (%) | 0.17 | ||
| Yes | 12 (17.1%) | 1 (5.0%) | |
| No | 58 (82.9%) | 19 (95.0%) | |
|
| |||
| PFTs Available (%) | 0.18 | ||
| Yes | 49 (70.0%) | 17 (85.0%) | |
| No | 21 (30.0%) | 3 (15.0%) | |
|
| |||
| FEV1, L | 0.44 | ||
| Mean (Range) | 2.1 (0.9 4.8) | 2.3 (0.9 3.8) | |
|
| |||
| FEV1 % predicted | 0.44 | ||
| Mean (Range) | 73.0 (28.0 137.0) | 75.8 (22.0 99.0) | |
|
| |||
| DLCO, ml/min/mmH | 0.70 | ||
| Mean (range) | 15.4 (1.7 31.3) | 15.9 (10.2 32.5) | |
|
| |||
| DLCO % Predicted | 0.92 | ||
| Mean (Range) | 60.5 (9.0 93.0) | 64.1 (35.0 109.0) | |
|
| |||
| PTV size (cc) | 0.11 | ||
| Mean | 443.6 | 477.9 | |
| Median | 360.3 | 426.3 | |
| Range | (70.6 1937.3) | (179.7 1001.9) | |
|
| |||
| Dose and Fractionation (%) | 0.03 | ||
| 60 Gy in 30 Fractions | 65 (92.9%) | 15 (75.0%) | |
| 66 Gy in 33 Fractions | 5 (7.1%) | 5 (25.0%) | |
|
| |||
| Concurrent Chemotherapy (%) | 0.53 | ||
| Yes | 58 (82.9%) | 17 (85.0%) | |
| No | 12 (17.1%) | 3 (15.0%) | |
|
| |||
| Adjuvant Chemotherapy (%) | 0.52 | ||
| Yes | 11 (15.7%) | 2 (10.0%) | |
| No | 59 (84.3%) | 18 (90.0%) | |
|
| |||
| Adjuvant Immunotherapy (%) | 0.40 | ||
| Yes | 34 (48.6%) | 13 (65.0%) | |
| No | 36 (51.4%) | 7 (35.0%) | |
Analysis of high functioning lung definitions is covered in depth in the supplementary material, with primary results covered in this section. For the analyzed patient population, the median LER-10 Jacobian ventilation value was J = 1.18 ( ≈ 18% voxel-level expansion) with 5th and 95th percentiles of J = 1.05 and J = 1.51, respectively. Supplemental Figure S1 shows the population distribution of Jacobian values for the cohort analyzed in this work and Supplemental Figure S2 shows example individual distributions. Comparative AUROC values for median population- and individual-based functional lung definitions are provided in Supplemental Figure S3. Population-based functional lung definitions had higher AUROC values than individual-based definitions for all functional dose metrics (fMLD, fV5-fV60). Therefore, the population median of J = 1.18 was used to define high functioning lung. Supplemental Figure S4 shows how the volume of lung defined as high functioning differed for the two definitions. With the median population-based definition, 46.5 ± 23.3% of patients’ lungs was labelled high functioning (range 2-94%) on a per patient average. Pneumonitis and non-pneumonitis patients did not have significantly different amounts of high functioning lung (P = 0.47). This result is highlighted in Supplemental Figure S5 and Supplemental Table S1.
All total lung and functional lung dose metrics were statistically significantly different between those with and without G2+ pneumonitis (P ≤ 0.039). Summary of mean, standard deviation, and P-values for all dose metrics (total and functional) are given in Supplemental Tables S2–S3. The resultant dose-volume histograms (DVHs) are shown in Figure 1A. Displayed DVH curves were calculated from a summation of all subjects in each group; volume percentages represent the fraction of the overall volume for all subjects combined for each category. Separation between G<2 and G2+ curves was slightly larger for functional lung metrics with area of 404 [units = Gy × % Lung Volume], compared to an area of 315 for total lung. Figure 1B shows boxplots demonstrating overall higher total and functional MLD, V5Gy and V20Gy to the lungs between those with and without pneumonitis. For patients without G2+ pneumonitis, dose to functional lung was lower compared to dose to total lung (P < 0.015 for all metrics). For those with G2+ pneumonitis, there was no statistically significant difference in functional and total MLD, V5 and V20 (P > 0.11).
Figure 1:

(A) Cumulative dose-volume histograms (DVHs) are shown for total (black) and functional (red) lung for all patients combined, separated into G2+ (solid) and G<2 (dashed) cohorts, including 20 G2+ and 70 G<2 patients. ‘Considered Lung’ refers to total lung-ITV and functional lung-ITV for total and functional lung curves, respectively. (B) Boxplots compare G<2 and G2+ patients for select dose metrics: MLD, V5, V20 and their corresponding functional counterparts; all show significant differences.
In those who had G2+ pneumonitis, the mean total lung V20Gy was statistically higher than those without (29.4% vs. 24.5%, P = 0.006), shown in the third panel of Figure 1B. Mean fV20Gy for those who developed pneumonitis was also higher at 23.9% compared to 17.8% in those who did not develop pneumonitis (P = 0.035). These functional values are well below the total lung V20Gy mean values. Of note, the patients in this study had V20 values well below the RTOG 0617 recommendation of V20 ≤ 37% (demonstrated visually in Fig. 1A–B), yet still had a 22% rate of G2+ radiation pneumonitis.
Predictive ability of dose metrics along the DVHs in Figure 1 was quantified through AUROC analysis. Results are shown for metrics of V5-V60, fV5-fV60 and fV5+MLD-fV60+MLD in Figure 2. For higher doses, total lung metrics consistently have higher AUROC values than functional lung metrics. Combining functional lung metrics with MLD increases metric stability across dose levels. In this instance, metric stability refers to consistency in AUROC values across different dose levels from 5-60 Gy. For the analyzed cohort, the combined metric of fV5+MLD had the highest AUROC value.
Figure 2:
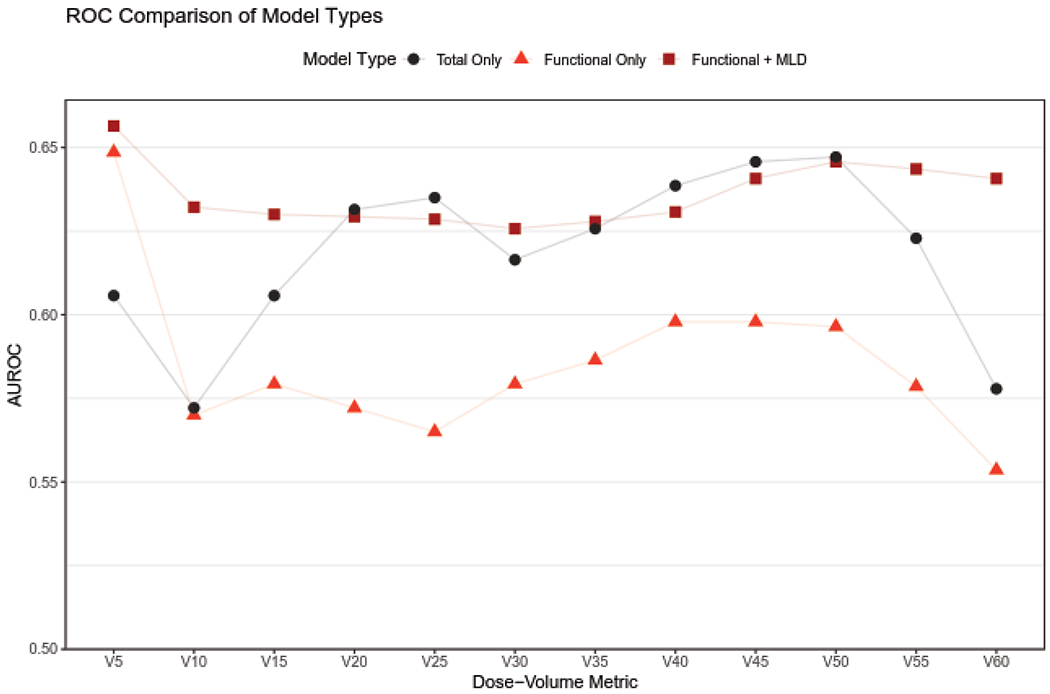
Area under the ROC curve (AUROC) values for total and functional lung dose volume metrics.
Optimal dosimetric targets for functional lung metrics, determined using Youden’s J statistic, are given in Figure 3, along with summarized sensitivity and specificity values in the adjacent table. Optimal dosimetric cutoffs and corresponding sensitivity and specificity are given for all functional lung metrics in the Supplemental Table S4. For the analyzed subject cohort, both total and functional lung had similar optimal cutoffs across all dose-volume metrics. Example ROC curves used to identify optimal cutoffs are given in Figure 4 for four dose metrics with optimal operating points shown. The optimal operating point as specified by Youden’s J statistic can easily be identified as the point on the ROC curve furthest from the dashed line. Corresponding ROC curves for total lung dose metrics were intertwined with functional curves, crossing at multiple dose values.
Figure 3:

Optimal dosimetric targets for functional lung to reduce pneumonitis.
Figure 4:

Receiver operating characteristic (ROC) curves for functional dose metrics. Bolded points indicate optimal operating points selected using Youden’s J statistic.
For this dataset, both MLD and fMLD are strong predictors of G2+ radiation pneumonitis relative to dose-volume metrics with AUROC values of 0.69 and 0.67, respectively. Unlike dose-volume metrics, cutoffs found for MLD and fMLD differ. Using Youden’s J statistic, the optimal cutoff for MLD is 16.7 Gy (sensitivity = 0.60, specificity = 0.73) and is 12.3 Gy (sensitivity = 0.65, specificity = 0.69) for fMLD.
Risk of G2+ pneumonitis was also compared between patients that did and did not satisfy the optimal functional lung metrics. For fMLD, 56 patients satisfied the criteria of fMLD ≤ 12.3 Gy, 8 of which had G2+ pneumonitis. Twelve of the 34 patients that did not satisfy fMLD criteria had G2+ pneumonitis, demonstrating an increase in risk of developing pneumonitis from 14% to 35% (P = 0.035). Similarly, pneumonitis risk increased from 12% to 34% for fV5 > 54% (P = 0.021) and 14% to 36% for functional V20 > 19% (P = 0.018).
Figure 5 provides a case example of a subject who presented with grade 2 pneumonitis but may have benefited from functional lung avoidance planning; the patient’s pre-RT ventilation, RT dose distribution, DVHs, and post-RT CTs demonstrating radiographic change due to pneumonitis are shown. For this patient, all TPO total lung MLD, V5, and V20 constraints were satisfied. As shown in the DVHs in Figure 5, functional and total dose metrics differed. Relative to total dose, the patient had substantially higher functional dose across a large range (roughly 5-50 Gy). When considering dose to highly ventilated lung, this patient’s treatment plan did not satisfy any of the fMLD, fV5, and fV20 functional dosimetric cutoffs found in this work. Dose to functional lung were well above optimal constraints with fMLD of 24.4 Gy, fV5 of 62%, and a fV20 of 45%. Specifically, the region directly posterior to the tumor was labelled as highly ventilated lung, received high dose, and shows radiographic pneumonitis in post-RT imaging. If the posterior highly ventilated lung was identified prospectively, the dose distribution may have been adjusted to avoid high dose to the region.
Figure 5:

A patient presenting with grade 2 pneumonitis after irradiation of highly ventilated lung. The patient’s treatment plan satisfied MLD, V5 and V20 total lung TPO constraints but did not meet any functional targets determined in this work. (Top Left) Pre-RT ventilation maps show regions defined as highly ventilated. (Top Right) Delivered distribution show that high functioning lung (posterior to irradiated tumor) received high dose. This patient had a prescription dose of 60 Gy. (Bottom Left) Functional DVH values are above total lung values and optimal functional dose constraints. (Bottom Right) A post-RT follow-up scan shows radiographic change from pneumonitis in the same spatial region where highly ventilated lung was irradiated.
Discussion
Functional lung avoidance is an emerging technique that has potential to decrease pulmonary toxicity in patients treated with radiotherapy.11–13 Our method uses data extracted from standard of care 4DCTs at time of simulation to calculate regions of low and high ventilation.33 Once identified, high function regions of interest can be used to avoid dose to highly ventilated lung. Functional avoidance techniques ultimately individualize treatment plans by taking into consideration the heterogeneity of lung function both across different patients and within a patient’s lung. To adopt functional lung avoidance planning into the clinic, reliable dose constraints to the functioning lung are needed; physicians rely on quantitative metrics when evaluating and approving plan quality. This work provides important functioning lung metrics that can be used clinically and in clinical trial design.
For the 90-patient cohort in this work, our G2+ pneumonitis rate was 22% even when meeting the RTOG 0617 recommended historic constraints of V20Gy Ȧ 37% and MLD ≤ 20 Gy. This result indicates that the risk of pneumonitis may not only be dependent on total lung dose, but also dependent on where that dose is distributed within the lung. Using the population median as a threshold to identify functional lung sub-volumes, dose to functional lung was significantly different for all metrics between those with and without pneumonitis. We found that the fMLD, fV5, and fV20 were lower than all corresponding total lung metrics. Since functional lung is a sub-volume of total lung, minimizing dose to the smaller volumes of high functioning may be a way to efficiently focus treatment planning efforts; if dosimetric goals for total lung cannot be met, optimizing based on functional constraints may still be feasible and beneficial.
In this study, MLD was the most predictive single metric of pneumonitis, with an AUROC value of 0.69, indicating the importance of overall lung dose. However, combining functional metrics with MLD stabilized and improved the AUROC values across dose values. While stability is secondary to AUROC height, stability reduces the chance of choosing the wrong metric to optimize that could happen with an unstable model. Since total and functional ROC curves were intertwined, there is limited interpretability of differences in AUROC values between the two groups. The functional cutoffs given in this study provide important targets for dosimetrists and physicians to aim for and evaluate functional lung avoidance plans with. These functional lung metrics including MLD of 12.3 Gy and V20 of 19% are much lower than historic total lung mean dose and V20 constraints, indicating that highly ventilated lung may be more sensitive to radiation than poorly ventilated lung. This was also exemplified in our case example where the patient’s plan met total lung constraints but had higher functioning lung values. While overall lung dose may not have been able to be reduced for this patient, dose could have possibly been redistributed to reduce dose to functional lung. Demonstrating that recognition of the location of functional lung may be important.
Previous groups have also found value in using functional dose metrics to predict radiation pneumonitis.29–32 O’Reilly et al.30 found fV20 to be the strongest predictor of G2+ pneumonitis with improved AUC of 0.89 compared to 0.76 for V20. Vinogradskiy et al.31 also found fV20 to be the best predictor with AUC of 0.62, and that all functional metrics outperformed traditional total lung dose metrics. Similarly, Faught et al.32 found the 20 Gy cutoff to be important with an improvement in AUC from 0.55 to 0.71 when comparing total and functional lung predictions of G2+ pneumonitis. MLD and fV5 were the best predictors for our work, compared to the strong emphasis on V20/fV20 in previous findings. Our study differs in that it has a larger sample size and the fact we defined functional lung differently. Previous work29–32 has solely defined high functioning lung on a per-patient basis, i.e., without consideration for how the patient’s lung function compares to the population as a whole. Individual-based high functioning lung definitions suffer from assuming each patient has the same percentage of high functioning lung; population-based definitions allow each patient to have a different amount of defined functional lung. To our knowledge, this is the first work to use a population-based definition of functional lung.
Similar to our work, previous studies agree that AUC values and thus predictions improved when multiple predictive metrics were combined. Our finding of larger differences between G<2 and G2+ groups for highly ventilated lung compared to total lung agrees with previous findings as well.30 Using normal tissue complication probability (NTCP) modeling, fV20, fV30, and fMLD showed reductions in G2+ pneumonitis NTCP.29 One study also used G3+ NTCP modeling to find relevant functional dose metric targets. Cutoffs of 9.3% and 26.8% for fV20 corresponded to a 10% and 20% predicted rate of G3+ pneumonitis, respectively. They also found respective MLD cutoffs of 10.2 Gy and 20.7 Gy.32 These are comparative in magnitude to the values found in this study (fV20 ≤ 19%, fMLD ≤ 12.3 Gy, MLD ≤ 16.7 Gy). The cutoffs identified in this work (with Youden’s J) equally balanced the importance of sensitivity and specificity.
In addition to the Jacobian-based method used in this work, Hounsfield Unit (HU) based calculations of regional ventilation can also be used. The premise of HU methods is that during ventilation, air is added to the lung, causing a decrease in voxel-wise HU values21, 41. HU-based methods have demonstrated global agreement with PFTs42 and correlation with nuclear medical imaging41, 43. Sensitivity of Jacobian-based methods to DIR have been noted, where changes in the DIR displacement field affect the resulting Jacobian-based ventilation value44. However, compared to HU-based calculations, Jacobian biomarkers, specifically the LER-N calculation used in this work have demonstrated increased accuracy through validation with other imaging modalities and robustness to variation in image noise34. Our Jacobian LER-N method was selected over other CT-based ventilation models in the 2019 American Association of Physicists in Medicine (AAPM) grand challenge: CT Ventilation Imaging Evaluation. The results of this challenge detailing validation performance are expected to be published soon. In addition to accuracy, the LER-N methodology has demonstrated robustness to CT image noise (defined as the standard deviation of HU); biomarkers derived from sequential high noise and low noise 4DCTs showed 93% agreement on average, which is on par with achieved repeatability34.
There are several limitations to this study. First, the retrospective nature of the study over six years introduces variability in treatment planning and delivery practices that were not accounted for. Toxicity was also collected retrospectively from the charts of 60% of the patients. Prospective functional avoidance studies are better equipped to comment on how pneumonitis rates are reduced by minimizing dose to functional lung. This study was also limited by small sample size, with only 20 patients developing G2+ pneumonitis and only 13 patients developing G3+ pneumonitis. Larger data sets will be needed to validate our findings. Our study does not take into consideration other pulmonary toxicities such as cough, dyspnea or fibrosis. Additionally, the majority of patients in this study had 4DCTs acquired without audio guidance, generally leading to more image artifacts, which affect CT-ventilation calculation. However, only one subject was excluded due to extreme interpolation artifacts. More subtle artifacts throughout the cohort may have a limited effect on calculated Jacobian values. Future efforts to detect and correct 4DCT artifacts will be important steps in improving accuracy of CT-ventilation biomarkers.
One of the biggest limitations of this study is that it only accounts for lung ventilation and dose directly to highly ventilated regions. This study did not account for pulmonary perfusion, which is an important component of lung function. Previous studies have also shown the importance of including dose to airways and vasculature in prediction of post-RT toxicities.35, 45, 46, 47 Indirect damage to parenchymal tissue through irradiation of feeding airways/vessels is another area of active research for understanding post-RT toxicities.
Conclusion
In this work, we demonstrate that dose to functional lung is predictive of radiation pneumonitis, although not more predictive than total lung. However, the stability of predicting for pneumonitis is increased when combining functional lung metrics with total lung metrics. The results presented here demonstrate that reducing radiation-induced toxicities is a challenging problem to solve. Avoiding highly ventilated functional lung may be one technique to limit pulmonary toxicity. The optimal functional dose metrics found in this work will be helpful goals to evaluate both in ongoing and future clinical trials using functional avoidance RT. Dose to highly ventilated lung adds value to predicting post-RT pneumonitis, but more sophisticated models are needed.
Supplementary Material
Highlights.
Current lung cancer radiotherapy planning does not account for regional variation in pulmonary function.
Regional lung function can be quantified through derivation of ventilation obtained from 4DCT imaging.
In this study dose to highly ventilated lung was found to be associated with symptomatic pneumonitis
These findings provide important metrics to be used in functional lung avoidance radiotherapy planning and in designing clinical trials
Funding Statement:
This research was funded in part by the National Institutes of Health grant CA 166703 and the University of Wisconsin Carbone Cancer Center Support Grant (P30 CA014520).
Conflict of Interest Statement for All Authors:
PY received research funding from ViewRay, Inc. outside the current work. GEC receives licensing fees from VIDA Diagnostics, Inc. and is a consultant and owns stock in PowerPollen, Inc., Ames IA. JMR is a shareholder in VIDA Diagnostics, Inc. JEB has ownership interest in MR Guidance, LLC (MRG), which has performed business with radiation oncology vendors.
Footnotes
Publisher's Disclaimer: This is a PDF file of an unedited manuscript that has been accepted for publication. As a service to our customers we are providing this early version of the manuscript. The manuscript will undergo copyediting, typesetting, and review of the resulting proof before it is published in its final form. Please note that during the production process errors may be discovered which could affect the content, and all legal disclaimers that apply to the journal pertain.
Data Availability Statement for this Work:
Research data are not available at this time.
References
- 1.Siegel RL, Miller KD, Fuchs HE, et al. Cancer statistics, 2022. CA. Cancer J. Clin 2022;72:7–33. [DOI] [PubMed] [Google Scholar]
- 2.Yegya-Raman N, Zou W, Nie K, et al. Advanced radiation techniques for locally advanced non-small cell lung cancer: intensity-modulated radiation therapy and proton therapy. J. Thorac. Dis 2018;10:S2474–S2491. [DOI] [PMC free article] [PubMed] [Google Scholar]
- 3.McDonald S, Rubin P, Phillips TL, et al. Injury to the lung from cancer therapy: Clinical syndromes, measurable endpoints, and potential scoring systems. Int. J. Radiat. Oncol. 1995;31:1187–1203. [DOI] [PubMed] [Google Scholar]
- 4.Bradley JD, Paulus R, Komaki R, et al. Standard-dose versus high-dose conformal radiotherapy with concurrent and consolidation carboplatin plus paclitaxel with or without cetuximab for patients with stage IIIA or IIIB non-small-cell lung cancer (RTOG 0617): a randomised, two-by-two factorial phase 3 study. Lancet Oncol. 2015;16:187–199. [DOI] [PMC free article] [PubMed] [Google Scholar]
- 5.Bradley JD, Hu C, Komaki RR, et al. Long-Term Results of NRG Oncology RTOG 0617: Standard- Versus High-Dose Chemoradiotherapy With or Without Cetuximab for Unresectable Stage III Non–Small-Cell Lung Cancer. J. Clin. Oncol 2020;38:706–714. [DOI] [PMC free article] [PubMed] [Google Scholar]
- 6.Marks LB, Yorke ED, Jackson A, et al. Use of Normal Tissue Complication Probability Models in the Clinic. Int. J. Radiat. Oncol 2010;76:S10–S19. [DOI] [PMC free article] [PubMed] [Google Scholar]
- 7.Antonia SJ, Villegas A, Daniel D, et al. Durvalumab after Chemoradiotherapy in Stage III Non–Small-Cell Lung Cancer. N. Engl. J. Med 2017;377:1919–1929. [DOI] [PubMed] [Google Scholar]
- 8.Palma DA, Senan S, Tsujino K, et al. Predicting Radiation Pneumonitis After Chemoradiation Therapy for Lung Cancer: An International Individual Patient Data Meta-analysis. Int. J. Radiat. Oncol 2013;85:444–450. [DOI] [PMC free article] [PubMed] [Google Scholar]
- 9.Christian JA, Partridge M, Nioutsikou E, et al. The incorporation of SPECT functional lung imaging into inverse radiotherapy planning for non-small cell lung cancer. Radiother. Oncol 2005;77:271–277. [DOI] [PubMed] [Google Scholar]
- 10.Marks LB, Spencer DP, Bentel GC, et al. The utility of SPECT lung perfusion scans in minimizing and assessing the physiologic consequences of thoracic irradiation. Int. J. Radiat. Oncol 1993;26:659–668. [DOI] [PubMed] [Google Scholar]
- 11.Yamamoto T, Kabus S, Bal M, et al. The first patient treatment of computed tomography ventilation functional image-guided radiotherapy for lung cancer. Radiother. Oncol 2016;118:227–231. [DOI] [PubMed] [Google Scholar]
- 12.Vinogradskiy Y, Waxweiler T, Diot Q, et al. SU-C-BRA-06: Developing Clinical and Quantitative Guidelines for a 4DCT-Ventilation Functional Avoidance Clinical Trial. Med. Phys 2015;42:3196–3197. [Google Scholar]
- 13.Bayouth J TU-H-202-03: Spatial Distributions of Radiation Induced Pulmonary Changes Can Be Modeled and Utilized for Image-Guided Planning and Therapy to Improve Pulmonary Function Preservation and Hence the Therapeutic Ratio for Lung Cancer. Med. Phys 2016;43:3771–3771. [Google Scholar]
- 14.Reinhardt JM, Ding K, Cao K, et al. Registration-based estimates of local lung tissue expansion compared to xenon CT measures of specific ventilation. Med. Image Anal 2008;12:752–763. [DOI] [PMC free article] [PubMed] [Google Scholar]
- 15.Shao W, Patton TJ, Gerard SE, et al. N-Phase Local Expansion Ratio for Characterizing Out-of-Phase Lung Ventilation. IEEE Trans. Med. Imaging 2020;39:2025–2034. [DOI] [PMC free article] [PubMed] [Google Scholar]
- 16.Vidal Melo MF, Layfield D, Harris RS, et al. Quantification of regional ventilation-perfusion ratios with PET. J. Nucl. Med. Off. Publ. Soc. Nucl. Med 2003;44:1982–1991. [PubMed] [Google Scholar]
- 17.Bailey DL, Eslick EM, Schembri GP, et al. 68Ga PET Ventilation and Perfusion Lung Imaging—Current Status and Future Challenges. Semin. Nucl. Med 2016;46:428–435. [DOI] [PubMed] [Google Scholar]
- 18.King GG, Harris B, Mahadev S. V/Q SPECT: Utility for Investigation of Pulmonary Physiology. Semin. Nucl. Med 2010;40:467–473. [DOI] [PubMed] [Google Scholar]
- 19.Kumar S, Liney G, Rai R, et al. Magnetic resonance imaging in lung: a review of its potential for radiotherapy. Br. J. Radiol 2016;89:20150431. [DOI] [PMC free article] [PubMed] [Google Scholar]
- 20.Ireland RH, Din OS, Swinscoe JA, et al. Detection of radiation-induced lung injury in non-small cell lung cancer patients using hyperpolarized helium-3 magnetic resonance imaging. Radiother. Oncol 2010;97:244–248. [DOI] [PubMed] [Google Scholar]
- 21.Kipritidis J, Hofman MS, Siva S, et al. Estimating lung ventilation directly from 4D CT Hounsfield unit values: Estimating lung ventilation from 4DCT HU values. Med. Phys 2015;43:33–43. [DOI] [PubMed] [Google Scholar]
- 22.Mathew L, Gaede S, Wheatley A, et al. Detection of longitudinal lung structural and functional changes after diagnosis of radiation-induced lung injury using hyperpolarized He3 magnetic resonance imaging: Hyperpolarized He3 magnetic resonance imaging: Radiation-induced lung injury. Med. Phys 2009;37:22–31. [DOI] [PubMed] [Google Scholar]
- 23.Simon BA. Non-invasive imaging of regional lung function using X-ray computed tomography. J. Clin. Monit. Comput 2000;16:433–442. [DOI] [PubMed] [Google Scholar]
- 24.Guerrero T, Sanders K, Noyola-Martinez J, et al. Quantification of regional ventilation from treatment planning CT. Int. J. Radiat. Oncol 2005;62:630–634. [DOI] [PubMed] [Google Scholar]
- 25.Castillo E, Castillo R, Vinogradskiy Y, et al. Robust CT ventilation from the integral formulation of the Jacobian. Med. Phys 2019;46:2115–2125. [DOI] [PMC free article] [PubMed] [Google Scholar]
- 26.Cazoulat G, Balter JM, Matuszak MM, et al. Mapping lung ventilation through stress maps derived from biomechanical models of the lung. Med. Phys 2021;48:715–723. [DOI] [PMC free article] [PubMed] [Google Scholar]
- 27.Kipritidis J, Siva S, Hofman MS, et al. Validating and improving CT ventilation imaging by correlating with ventilation 4D-PET/CT using 68 Ga-labeled nanoparticles: Validating CT ventilation imaging using PET-Galligas. Med. Phys 2013;41:011910. [DOI] [PubMed] [Google Scholar]
- 28.Eslick EM, Kipritidis J, Gradinscak D, et al. CT ventilation imaging derived from breath hold CT exhibits good regional accuracy with Galligas PET. Radiother. Oncol 2018;127:267–273. [DOI] [PubMed] [Google Scholar]
- 29.Faught AM, Miyasaka Y, Kadoya N, et al. Evaluating the Toxicity Reduction With Computed Tomographic Ventilation Functional Avoidance Radiation Therapy. Int. J. Radiat. Oncol 2017;99:325–333. [DOI] [PMC free article] [PubMed] [Google Scholar]
- 30.O’Reilly S, Jain V, Huang Q, et al. Dose to Highly Functional Ventilation Zones Improves Prediction of Radiation Pneumonitis for Proton and Photon Lung Cancer Radiation Therapy. Int. J. Radiat. Oncol 2020;107:79–87. [DOI] [PubMed] [Google Scholar]
- 31.Vinogradskiy Y, Castillo R, Castillo E, et al. Use of 4-Dimensional Computed Tomography-Based Ventilation Imaging to Correlate Lung Dose and Function With Clinical Outcomes. Int. J. Radiat. Oncol 2013;86:366–371. [DOI] [PMC free article] [PubMed] [Google Scholar]
- 32.Faught AM, Yamamoto T, Castillo R, et al. Evaluating Which Dose-Function Metrics Are Most Critical for Functional-Guided Radiation Therapy. Int. J. Radiat. Oncol 2017;99:202–209. [DOI] [PMC free article] [PubMed] [Google Scholar]
- 33.Wallat EM, Flakus MJ, Wuschner AE, et al. Modeling the impact of out-of-phase ventilation on normal lung tissue response to radiation dose. Med. Phys 2020;47:3233–3242. [DOI] [PMC free article] [PubMed] [Google Scholar]
- 34.Flakus MJ, Wuschner AE, Wallat EM, et al. Quantifying Robustness of CT-Ventilation Biomarkers to Image Noise. Front. Physiol 2023; Feb 14;14:1040028. [DOI] [PMC free article] [PubMed] [Google Scholar]
- 35.Wallat EM, Wuschner AE, Flakus MJ, et al. Radiation-induced airway changes and downstream ventilation decline in a swine model. Biomed. Phys. Eng. Express 2021;7:065039. [DOI] [PMC free article] [PubMed] [Google Scholar]
- 36.Han D, Bayouth J, Bhatia S, et al. Characterization and identification of spatial artifacts during 4D-CT imaging: Characterization and identification of 4D-CT spatial artifacts. Med. Phys 2011;38:2074–2087. [DOI] [PMC free article] [PubMed] [Google Scholar]
- 37.Cao K, Ding K, Reinhardt JM, et al. Improving Intensity-Based Lung CT Registration Accuracy Utilizing Vascular Information. Int. J. Biomed. Imaging 2012;2012:1–17. [DOI] [PMC free article] [PubMed] [Google Scholar]
- 38.Vinogradskiy Y, Castillo R, Castillo E, et al. Results of a Multi-Institutional Phase 2 Clinical Trial for 4DCT-Ventilation Functional Avoidance Thoracic Radiation Therapy. Int. J. Radiat. Oncol. Biol. Phys 2022;112:986–995. [DOI] [PMC free article] [PubMed] [Google Scholar]
- 39.Yamamoto T, Kabus S, Bal M, et al. Four-Dimensional Computed Tomography Ventilation Image Guided Lung Functional Avoidance Radiation Therapy: A Single-Arm Prospective Pilot Clinical Trial. Int J. Radiat. Oncol 2022:S0360301622035507. [DOI] [PubMed] [Google Scholar]
- 40.Powers DMW. Evaluation: from precision, recall and F-measure to ROC, informedness, markedness and correlation. 2020.
- 41.Castillo R, Castillo E, Martinez J, et al. Ventilation from four-dimensional computed tomography: density versus Jacobian methods. Phys. Med. Biol 2010;55:4661–4685. [DOI] [PubMed] [Google Scholar]
- 42.Brennan D, Schubert L, Diot Q, et al. Clinical Validation of 4-Dimensional Computed Tomography Ventilation With Pulmonary Function Test Data. Int. J. Radiat. Oncol 2015;92:423–429. [DOI] [PMC free article] [PubMed] [Google Scholar]
- 43.Hegi-Johnson F, Keall P, Barber J, et al. Evaluating the accuracy of 4D-CT ventilation imaging: First comparison with Technegas SPECT ventilation. Med. Phys 2017;44:4045–4055. [DOI] [PubMed] [Google Scholar]
- 44.Yamamoto T, Kabus S, Klinder T, et al. Four-dimensional computed tomography pulmonary ventilation images vary with deformable image registration algorithms and metrics: Variability of 4D-CT ventilation images. Med. Phys 2011;38:1348–1358. [DOI] [PubMed] [Google Scholar]
- 45.Vicente E, Modiri A, Kipritidis J, et al. Functionally weighted airway sparing (FWAS): a functional avoidance method for preserving post-treatment ventilation in lung radiotherapy. Phys. Med. Biol 2020;65:165010. [DOI] [PubMed] [Google Scholar]
- 46.Kazemzadeh N, Modiri A, Samanta S, et al. Virtual Bronchoscopy-Guided Treatment Planning to Map and Mitigate Radiation-Induced Airway Injury in Lung SAbR. Int. J. Radiat. Oncol 2018;102:210–218. [DOI] [PMC free article] [PubMed] [Google Scholar]
- 47.Wuschner AE, Flakus MJ, Wallat EM, et al. Measuring Indirect Radiation-Induced Perfusion Change in Fed Vasculature Using Dynamic Contrast CT. J. Pers. Med 2022;12:1254. [DOI] [PMC free article] [PubMed] [Google Scholar]
Associated Data
This section collects any data citations, data availability statements, or supplementary materials included in this article.
Supplementary Materials
Data Availability Statement
Research data are not available at this time.