

Abstract
Exposure to Intimate Partner Violence (IPV) has lasting adverse effects on the physical, behavioral, cognitive, and emotional health of survivors. To this end, it is critical to understand the effectiveness of IPV treatment strategies in reducing IPV and its debilitating effects. Meta-analyses designed to comprehensively describe the effectiveness of treatments offer unique advantages. However, the heterogeneity within and between studies poses challenges in interpreting findings. Meta-analyses are therefore unlikely to identify the factors that underlie disparities in treatment efficacy. To characterize the effect of demographic and social factors on treatment effectiveness, we develop a comprehensive computational and statistical framework that uses Meta-regression to characterize the effect of demographic and social variables on treatment outcomes. The innovations in our methodology include (i) standardization of outcome variables to enable meaningful comparisons among studies, and (ii) two parallel meta-regression pipelines to reliably handle missing data.
Introduction
The Centers for Disease Control and Prevention (CDC) defines Intimate Partner Violence (IPV) as any “physical violence, sexual violence, stalking and psychological aggression (including coercive acts) by a current or former intimate partner [1]”. National data from the US indicates approximately one-quarter of women (24%) experience severe violence by an intimate partner in their lifetime; the rates are lower but still substantial for men, with approximately 1 in 7 (14%) reporting IPV [2]. It is a complex and intersectional problem, particularly for women and disadvantaged or marginalized groups. Risks for IPV and how individuals are influenced by it are often functions of the individuals overlapping identities including socioeconomic status (SES), race, and migration status [3]. In that, IPV is related to race and ethnicity, particularly in the context of how these factors relate to inequalities in SES, distribution of wealth, and access to resources [2, 4, 5].
Although IPV is a problem for the entire spectrum of SES, individuals with lower SES have been shown to be exposed to more violence, in terms of both prevalence and severity [6, 7]. The link between inequalities and IPV is bidirectional, in that exposure to violence limits the victim’s ability to access resources. As a striking manifestation of this relationship, IPV is found to have a strong negative effect on sustaining employment. It is discovered that each year women in the US miss about 8 million days of work, and lose about $727 million in wages [8]. Furthermore, low-income women who experience violent incidents have a harder time keeping their full-time employment for 6 or more months [6]. Frequently observed mental health issues among the survivors of IPV, such as PTSD, depression, and substance abuse problems also have a negative effect on the ability to sustain employment, school attainment, and daily functioning [8, 6, 9].
Violent individuals compose a heterogeneous group that can be distinguished through various descriptive dimensions. Regardless of the types of IPV, all perpetrators receive standard treatment. Standard treatment for IPV involves gender-specific group treatments (anger management groups for offenders and support groups for victims/survivors), which overlook the complexities of violence [10]. The nature of violence and rates of recidivism often fluctuate along with demographic factors, but treatment models do not account for this disparity as well. This paper aims to help individuals overcome treatment inequalities that arise from age, race, education, income, and other socioeconomic and demographic factors. Current IPV treatments do not take violence characteristics and demographic variations into account, so not all groups are given equal opportunities for recovery.
Our objective in this study is to assess the association between demographic variables that may underlie disparities in the treatment effectiveness for intimate partner violence (IPV). This involves identifying individuals who respond similarly to treatment which can be accomplished through subgroup analysis [11]. To achieve this we utilized data that was pooled from literature via meta-analysis. While meta-analysis is a powerful tool in integrating results from multiple studies, it presents challenges in studying the association between the outcome variables and other factors, including those that may underlie disparities. This is because studies report these variables using descriptive statistics across the study population (as opposed to individual-level data). Nonetheless, this information is still highly valuable as it can potentially shed light on the importance of study design, heterogeneity of the study population, and the effect of population characteristics on the conclusions of a study.
Methods
We use meta-regression to characterize the association between treatment outcome and the variables that potentially underlie the disparities in the treatment of IPV. In addition to the environmental nature of these associations, there are additional challenges in meta-regression: 1) Not all studies measure all variables, thus there can be many missing data points. 2) The distributions and ranges of variables can vary drastically between studies, making it difficult to make meaningful comparisons. In the following subsections, we first describe our meta-analysis dataset and then present how we address these two challenges.
Description of Data The set of studies we consider is shown in Table 1, which is an improved version of the set of studies in our meta-analysis on the treatment of perpetrators of IPV [12]. This meta-analysis included 17 studies published between 1997 and 2018, which were selected based on whether a treatment is used, whether the mean outcome values were reported, and whether the measurements were done using the Conflict Tactics Scale (CTS) [13]. Detailed study criteria are provided in Karakurt et al [12]. Using the same criteria, we identified and evaluated 598 studies published from 2018 to 2022, from PubMed [14], PsychINFO [15] and Cochrane [16]. We found that no study published since 2018 met our inclusion criteria. The resulting set of studies consists of 17 studies, which applied 19 different treatments and measured 12 demographic variables. These variables reported by each study are listed in Table 1.
Table 1.
Characteristics of the studies used in our analyses. The study size, percentages, and the mean values of demographic variables for the perpetrators in each study are shown.
| Study | Post-test Sample Size (N) | White (%) | Black (%) | Asian (%) | Native American (%) | Hawaiian (%) | Hispanic (All Races) (%) | Age | Edu. Years | Having Children (%) | Income ($) | Employment (%) |
|---|---|---|---|---|---|---|---|---|---|---|---|---|
| Morell-2003-0 [17] | 41 | 32.00 | 30.00 | 3.00 | 2.00 | 0.00 | 2.00 | 34.70 | 12.10 | 21600 | 100.00 | |
| Stuart-2013-1 [18] | 73 | 72.10 | 10.10 | 0.00 | 0.00 | 0.00 | 15.10 | 31.60 | 11.70 | 25332 | ||
| Stover-2011-2 [19] | 30 | 49.00 | 1.20 | 0.00 | 0.00 | 0.00 | 9.10 | 38.00 | 10.92 | 68.00 | 70.00 | |
| Stuart-2013-3 [18] | 69 | 71.50 | 8.10 | 0.00 | 0.00 | 0.00 | 20.30 | 31.50 | 11.40 | 21452 | ||
| Schumacher-2011-4 [20] | 11 | 69.56 | 30.43 | 0.00 | 0.00 | 0.00 | 0.00 | 32.30 | 5.21 | 53.85 | ||
| Lila-2018-5 [21] | 80 | 95.00 | 2.50 | 0.00 | 0.00 | 0.00 | 12.50 | 46.36 | 7.10 | 10443 | 47.50 | |
| Dutton-1997-6 [22] | 62 | 100.00 | 0.00 | 30.12 | 0.00 | 0.00 | 30.12 | 35.20 | 12.00 | |||
| Murphy-2017-7 [23] | 21 | 57.10 | 38.10 | 0.00 | 0.00 | 0.00 | 0.00 | 31.90 | 13.19 | 31071 | ||
| Chan-2004-8 [24] | 13 | 0.00 | 0.00 | 100.00 | 0.00 | 0.00 | 0.00 | 43.50 | 9.18 | 100.00 | 70.59 | |
| Morell-2003-9 [17] | 33 | 60.00 | 30.00 | 3.00 | 2.00 | 0.00 | 2.00 | 34.70 | 13.10 | 21600 | 100.00 | |
| Lawson-2009-10 [25] | 49 | 36.70 | 42.90 | 0.00 | 0.00 | 2.00 | 18.40 | 31.73 | 11.10 | |||
| Easton-2007-11 [26] | 29 | 49.00 | 33.00 | 0.00 | 0.00 | 0.00 | 10.00 | 38.10 | 9.36 | 70.60 | ||
| Lila-2018-12 [21] | 80 | 95.00 | 2.50 | 0.00 | 0.00 | 0.00 | 12.50 | 46.36 | 8.04 | 10443 | 47.50 | |
| Taft-2015-14 [27] | 49 | 84.60 | 0.00 | 0.00 | 0.00 | 0.00 | 15.40 | 37.50 | 41.50 | |||
| Murphy-2017-15 [23] | 21 | 33.30 | 47.60 | 4.80 | 0.00 | 0.00 | 9.50 | 36.86 | 12.76 | 28571 | ||
| Mbilinyi-2011-16 [28] | 42 | 65.00 | 17.00 | 1.10 | 4.00 | 3.00 | 6.10 | 39.40 | 12.92 | 74.00 | 40001 | 80.00 |
Handling Missing Data Our objective is to assess, at the study level, the relationship between treatment effectiveness and the 12 demographic variables that may underlie discrepancies in the treatment of IPV. We use meta-regression for this purpose. However, as seen in Table 1, studies differ drastically in the variables they report. For this purpose, we develop a two-armed approach that aims to utilize all available data, while also controlling for the effects of data imputation. This approach is illustrated in Figure 1. As seen in the figure, we start by exporting the data from all studies on the treatment of perpetrators of IPV. First, we remove the studies with missing outcome variables (here, pre-treatment and post-treatment mean and variance of violence as measured by CTS). Subsequently, using these studies, we compute the “effect size” of each demographic variable using two meta-regression models: 1) In the full model, the missing values for demographic variables are imputed using k-Nearest Neighborhood imputation [29] using k = 5, and the resulting data is used in meta-regression to fit a full model for the outcome variable where all demographic variables are considered as independent variables. 2) In the individual model, the studies for which the independent variable is not available are removed for each independent variable. Then, for each demographic variable, using data from remaining studies, a separate meta-regression is fit for the outcome variable where the only independent variable is the demographic variable of interest. The resulting effect sizes are the regression coefficients of the demographic variable in the respective models (one for the full model, one for the individual model). In addition to the effect sizes, we also calculate the associated statistics (p-value, confidence interval, etc.) using a standard meta-regression framework.
Figure 1.

Proposed approach to handling missing data in meta-regression to characterize discrepancies. Left: Filtering of studies missing outcome variables. Center: Full model meta-regression (i.e., including all demographic variables) using imputation for missing data. Right: Individual meta-regression model for each demographic variable by filtering out studies that do not report the variable.
The idea behind our two-armed approach is as follows: As compared to individual models, full models can be more informative as they assess the effect of each the independent variable in the presence of others. However, to be able to use all studies in the full model, missing data needs to be imputed, which may introduce noise and bias [30]. In contrast, missing data imputation can be avoided for individual models, as the individual model can be fit using only the studies that report the variable of interest. Thus, by performing both analyses simultaneously, we can provide a comprehensive perspective on the association between each demographic variable and the outcome variable.
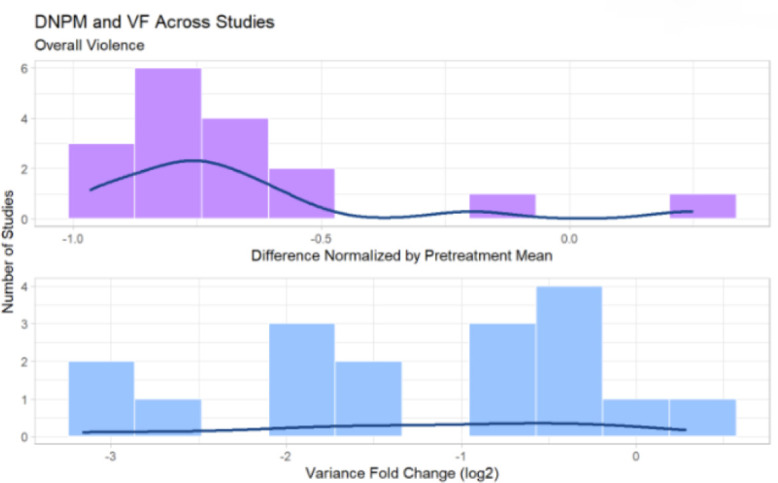
Normalization and Transformation of Outcome Variables for Meaningful Comparisons The pre-treatment and post-treatment mean and standard deviation of violence reported by each study is shown in Figure 2. As seen in the figure, these values are highly variable across studies, making it difficult to draw meaningful comparisons between studies. For this reason, we use two outcome variables that are designed to capture the relative improvement on average, as well as the reduction in the heterogeneity of violence in the study sample. For study k, we compute the Difference Normalized by Pre-Treatment Mean DNPMk as:
Figure 2.

Normalization of outcome variables to facilitate meaningful comparisons. Bottom Panel: The outcome variables as reported by each study. Upper Panel: Normalized outcome variables we compute to assess the mean improvement in treatment relative to mean violence in the study (left) and the reduction in the heterogeneity of violence in the study (right).
| (1) |
Here, Pretreatment Meank and Posttreatment Meank denote respectively the mean pre-treatment and post-treatment violence across all participants in study k. Consequently, DNPMk provides a measure of the relative average reduction in violence observed in study k, regardless of the overall degree of violence among the participants in the study. Since this measure does not consider study heterogeneity (i.e., the variance of violence among study participants), we consider an additional measure that aims to characterize the change in variance between pre- and post-treatment. For study k, we compute Variance Fold Change V Fk as:
| (2) |
where PosttreatmentSDk and PretreatmentSDk respectively denote the standard deviation of violence among the participants of study k pre- and post-treatment. The normalized outcome variables DNPM and VF for each study are shown in Figure 2. As seen in the figure, this transformation maps the outcome variables to an interpretable range and renders different studies comparable in terms of their outcomes. For example, a DNPM of -0.5 (2, upper left panel) indicates a 50% reduction in violence on average across all participants in the study, while a VF of -2 (2, upper right panel) indicates 22 = 4-fold reduction in the variance of violence among study participants.
Assessment of The Effect of Demographic and Social Factors We use meta-regression to assess the effect of demographic and social factors on outcome variables (namely average reduction in violence and reduction of the variance in violence among study participants). Based on the variations in predictor variables (demographic and social factors) and the observed effects (outcome variables), meta-regression builds a regression line that can be used to predict the effect size of studies that the model has never encountered before. The demographic and social variables are entered into meta-regression models as continuous predictors and each variable represent the fraction of a group among the study participants. The meta-regression line is fitted with Weighted Least Squares (WLS), which ensures that studies with a smaller standard error are given a higher weight. The true effect sizes deviate less from an optimal regression line, which indicates that the predictor variable can account for some of the heterogeneity variances in the meta-analysis. For every unit increase in the independent variable, the regression weight estimate tells us that the effect size of a study is expected to rise or fall proportional to that regression weight. Thus, we can see how disparities affect the effect sizes of outcomes, as well as the significance of those effects.
While fitting the meta-regression models, we use the information reported by each study on the distribution of demographic and social variables among study participants. Since these variables are usually reported in the form of averages, this analysis does not provide information at the level of individuals - e.g., we are not looking to identify associations such as “this type of treatment is more effective for participants in this age group”. Rather, meta-regression provides environmental information on the association between demographic/social variables and treatment outcomes - e.g., we can identify associations such as “studies that enroll younger participants report less reduction in violence on average”. This information is highly valuable from the perspective of characterizing discrepancies in treatment, as discrepancies that may go unnoticed by the individual can be more visible at the group level.
Since studies differ broadly in terms of the variables they report, a large fraction of data on demographic and social variables is missing. For this reason, we use a two-armed approach to handling missing data, as illustrated in Figure 1:
1. For each demographic/social variable x(i), we compute an individual meta-regression model by focusing on the studies that include x(i), in which x(i) is the only independent variable:
| (3) |
Here, yk denotes the value of the outcome variable (DFNM or VF) in study k, denotes the value of the predictor in study k (the fraction of a specific group in the study), denotes the regression coefficient for predictor x(i), ϵk and ζk denote error terms, and α denotes the intercept value. While fitting this meta-regression model, all studies for which is available are entered into the model.
2. We fill the missing data using k-Nearest Neighborhood imputation [29] and then compute a single full meta-regression model by including all studies, and entering all variables as independent variables:
| (4) |
While fitting this meta-regression model, all studies in Table 1 are entered into the model.
In all meta-regression models, the outcome variables are the two normalized outcome variables, namely Difference Normalized by Pretreatment Mean (DFNM) and Variance Fold Change (VF). Therefore, for each demographic/social variable — outcome variable pair, we obtain two effect sizes: (i) the coefficient of the variable in its own individual model (), and (ii) the coefficient of the variable in the full model ().
We expect that true effects will be highly heterogeneous between studies. The studies we use differ in many different ways, including differences in target populations, differences in treatment length and intensity of violence, etc. Therefore, we use a random-effects model to account for the fact that individual studies do not only vary because of sampling error alone but there is another source of variance due to the fact that the studies come from different populations. In this case, the effect sizes we output are the distribution of true effect sizes, and the modeling will estimate the mean of that distribution. The variance of the distribution of true effect sizes is (τ 2). Sidik-Jonkman estimator [31] is used for estimating (τ 2) since we believe there is a large degree of heterogeneity in our sample, and avoiding false positives is highly important.
Results
The effect sizes and p-values of each of our outcome variables, Difference Normalized by Pre-Treatment Mean (DNPM) and Variance Fold Change (VF) are plotted for independent variables of demographic information. The results obtained from full model and individual models are displayed side to side, to display the effect imputation had on our results. The color represents the significance of the effect size found. For DNPM, the blue color denotes a positive effect size, meaning that the violence increased, hence the variable is indirectly associated with the decrease in violence. The red color denotes a negative effect size, meaning that the violence decreased, which is a plausible result. For VF, the blue color denotes the study has become more heterogeneous by the effect of the independent variable, whereas the red color denotes the study has become more homogeneous.
Using bubble plots, we were able to identify the slope and effect size of the meta-regression. According to the size of the bubbles, a study with a greater weight has a greater size. In order to facilitate interpretation of the results, we use values without standardization for the demographic variables. Because our summary measurement is the standardized mean difference, the y axis of the bubble plots represents a variable’s effect on either DNPM or VF on overall violence across studies.
Race/Ethnicity Variables Figure 5 shows the effect sizes of socio-economic variables. We can see from the DNPM outcome in Figure 4(a) that IPV treatments failed to reduce overall violence in studies with Hispanic (all races) and White perpetrator groups. Native American and Hawaiian Pacific Islander perpetrators, where the results for Native American perpetrators are the most significant, benefited the most from the treatment. The difference between the effect sizes for Individual and Full models also shows that imputation increases the effect sizes a lot for positive effect sizes. The IPV treatments resulted in a more homogeneous group of study participants for Asian, Native American, and Hawaiian Pacific Islander perpetrators, as shown in Figure 4(b). When employed among Hispanics (all races), Whites, and Blacks, the treatments resulted in a more heterogeneous study group.
Figure 5.

Effect size of socio-economic variables on IPV treatment outcomes. For each variable, each row shows the regression coefficient of the value (average across all participants in the study) on the outcome variable for the individual model (left) and the full model (right). Tones of red show negative effect, tones of blue show positive effect, intensity shows significance.
Figure 4.

Effect size of race and ethnicity variables on IPV treatment outcomes. For each ethnicity and race, each row shows the regression coefficient of the fraction of the ethnicity/race among study parents on the respective study outcome for the individual model (left) and the full model (right). Tones of red show negative effect, tones of blue show positive effect, intensity shows significance.
In Figure 4, we can see that a positive slope corresponds to a positive effect size. We can also see how the distribution of variables affects the effect size we observe in our model, as well as how outlier studies affect it. Supplementary Figure 1 [32], presents the regression slopes of racial variables we have observed using our studies as weighted data points, for the Individual Models.
Socio-Economic Variables The Individual Model results show that the education year is directly related to the effectiveness of IPV treatment in terms of overall violence. The average age of the study group is indirectly related to the effectiveness of the IPV treatment. From Figure 5(b), study groups high percentages of having children, employment, and education years result in a more homogeneous study group posttreatment. The regression slopes of socio-economic variables are also shown in more detail in Supplementary Figure 2 [32].
Discussion
Intimate partner violence (IPV) is a worldwide prevalent public health issue that results in substantial global mental and physical health burdens. IPV treatment strategies are limited and have not been thoroughly researched. In this study, we aimed to identify the treatment effects of IPV studies and the relationship between overall violence and demographic variables. To achieve this aim, we used meta-analyses to characterize how different treatment models work for individuals who vary across these demographic and socioeconomic dimensions. We presented an extensive analysis of pooled data of batterer treatment programs to characterize the impact of demographic factors on treatment effectiveness.
Based on our findings for Racial/Ethnicity variables, IPV treatments did not reduce overall violence in studies with Hispanic (all races) and White perpetrator groups. Furthermore, in terms of violence severity, the treatments resulted in more heterogeneous groups among Hispanics (all races), Whites, and Blacks. For Asian, Native American, and Hawaiian Pacific Islander perpetrators, IPV treatments led to more homogeneous groups of study participants, as shown in Figure 4(b). Meaning, a reduction in the variance of violence among study participants. This may be due to small sample sizes in study groups.
Statistics for IPV among Latinas have nuances. Overall, statistics have been shown to be similar to the global average that during their lifetime about 30 percent of Latina women experience IPV. However, studies also noted a paradigm called “the immigration paradox” in that IPV rates are lower among Mexican immigrants as compared to Mexicans born and raised in the US [33]. It is possible that the intersection of migration stress, socioeconomic context, and lack of supportive systems might be associated with the increased risk for IPV, and the lower benefit from the treatment [3]. On the other hand, IPV Against American Indian and Alaskan Native Women are highly prevalent, statistics indicate that over 84% of Native women experience violence during their lifetimes [34]. Statistics also indicate that about half of Native women experience physical intimate partner violence and 66% experience psychological abuse from their intimate partner [34]. Interestingly, our results indicated that among the native American men who attended the treatment for perpetrators the success rate is relatively high.
Based on the results of our meta-regression for socio-economic variables, we found that the education year directly affects the effectiveness of IPV treatment in terms of overall violence (Figure 6). Lack of resources, access to resources and the limited number of available treatments are important risk factors for higher rates of IPV [35, 34, 36]. Particularly for marginalized individuals due to race, ethnicity and SES [36, 37, 38]. Based on the results of our meta-regression, the age of the study group is indirectly related to the effectiveness of IPV therapy. In groups that reported information about having a high percentage of families with children, higher employment rates, and longer education years, the group post treatment was more homogeneous (Figure 6(b)). This effect might be due to various types of violence that are more common among different age groups [3]. For example, situational couple violence was found to be more common among young adults [36, 37, 38].
Limitations. Since subgroup analyses are observational, it is important to keep in mind that effect differences may also be caused by confounding variables. Since the analyses are performed at the study-level, our conclusions remain at the environmental level, but they provide pointers for the design of studies to investigate disparities using individual-level data. Despite these limitations, our results highlight the importance of understanding the context of the individuals and their families, and the resources available to support the needs of the communities and can help clinicians select the effective IPV treatment for each specific relationship.
Conclusion. Overall, it is essential to understand the disparities between the perpetrators so that effective treatment and support can be provided. Living in impoverished areas and lacking the means to seek extensive assistance and support, the absence of differentiated research into treatments has a serious negative effect. Using IPV study results, we identified subgroups based on disparities between perpetrators. Using these results, consolidative treatment strategies can be formed. These findings will be analyzed and used to determine which subgroups may respond to treatment in similar ways.
Figures & Table
Figure 3.
Distribution of Outcome Variables across Studies
References
- 1.Breiding M, Basile KC, Smith SG, Black MC, Mahendra RR. Intimate partner violence surveillance: Uniform definitions and recommended data elements. Version 2.0. 2015 [Google Scholar]
- 2.Basile KC, Black MC, Breiding MJ, Chen J, Merrick MT, Smith SG, et al. National intimate partner and sexual violence survey: 2010 summary report. 2011 [Google Scholar]
- 3.Oram S, Fisher HL, Minnis H, Seedat S, Walby S, Hegarty K, et al. The Lancet Psychiatry Commission on intimate partner violence and mental health: advancing mental health services, research, and policy. The Lancet Psychiatry. 2022;9(6):487–524. doi: 10.1016/S2215-0366(22)00008-6. [DOI] [PubMed] [Google Scholar]
- 4.Cunradi CB, Caetano R, Clark C, Schafer J. Neighborhood poverty as a predictor of intimate partner violence among White, Black, and Hispanic couples in the United States: A multilevel analysis. Annals of epidemiology. 2000;10(5):297–308. doi: 10.1016/s1047-2797(00)00052-1. [DOI] [PubMed] [Google Scholar]
- 5.Tjaden P, Thoennes N. Prevalence and consequences of male-to-female and female-to-male intimate partner violence as measured by the National Violence Against Women Survey. Violence against women. 2000;6(2):142–61. [Google Scholar]
- 6.Browne A, Salomon A, Bassuk SS. The impact of recent partner violence on poor women’s capacity to maintain work. Violence against women. 1999;5(4):393–426. [Google Scholar]
- 7.Jewkes R. Intimate partner violence: causes and prevention. The lancet. 2002;359(9315):1423–9. doi: 10.1016/S0140-6736(02)08357-5. [DOI] [PubMed] [Google Scholar]
- 8.Unit ORC. National Center for Injury Prevention and Control. 2003.
- 9.Perez CM, Widom CS. Childhood victimization and long-term intellectual and academic outcomes. Child abuse & neglect. 1994;18(8):617–33. doi: 10.1016/0145-2134(94)90012-4. [DOI] [PubMed] [Google Scholar]
- 10.Rueve ME, Welton RS. Violence and mental illness. Psychiatry (Edgmont) 2008;5(5):34. [PMC free article] [PubMed] [Google Scholar]
- 11.Hacıaliefendioğlu AM, Yılmaz S, Smith D, Whiting J, Koyut#x00F6;rk M, Karakurt G. Data-driven identification of subtypes of intimate partner violence. Scientific reports. 2021;11(1):1–13. doi: 10.1038/s41598-021-85947-3. [DOI] [PMC free article] [PubMed] [Google Scholar]
- 12.Karakurt G, Koç E, Çetinsaya EE, Ayluçtarhan Z, Bolen S. Meta-analysis and systematic review for the treatment of perpetrators of intimate partner violence. Neuroscience & Biobehavioral Reviews. 2019;105:220–30. doi: 10.1016/j.neubiorev.2019.08.006. [DOI] [PMC free article] [PubMed] [Google Scholar]
- 13.Straus MA, Hamby SL, Boney-McCoy S, Sugarman DB. The revised conflict tactics scales (CTS2) development and preliminary psychometric data. Journal of family issues. 1996;17(3):283–316. [Google Scholar]
- 14.PubMed. U.S. National Library of Medicine. Available from: https://pubmed.ncbi.nlm.nih.gov/ [DOI] [PubMed]
- 15.PsycINFO. Available from: https://library.harvard.edu/services-tools/psycinfo.
- 16.Cochrane Library. Available from: https://www.cochranelibrary.com/
- 17.Morrel TM, Elliott JD, Murphy CM, Taft CT. Cognitive behavioral and supportive group treatments for partner-violent men. Behavior Therapy. 2003;34(1):77–95. [Google Scholar]
- 18.Stuart GL, Shorey RC, Moore TM, Ramsey SE, Kahler CW, O’Farrell TJ, et al. Randomized clinical trial examining the incremental efficacy of a 90-minute motivational alcohol intervention as an adjunct to standard batterer intervention for men. Addiction. 2013;108(8):1376–84. doi: 10.1111/add.12142. [DOI] [PMC free article] [PubMed] [Google Scholar]
- 19.Smith Stover C, McMahon TJ, Easton C. The impact of fatherhood on treatment response for men with co-occurring alcohol dependence and intimate partner violence. The American Journal of Drug and Alcohol Abuse. 2011;37(1):74–8. doi: 10.3109/00952990.2010.535585. [DOI] [PMC free article] [PubMed] [Google Scholar]
- 20.Schumacher JA, Coffey SF, Stasiewicz PR, Murphy CM, Leonard KE, Fals-Stewart W. Development of a brief motivational enhancement intervention for intimate partner violence in alcohol treatment settings. Journal of Aggression, Maltreatment & Trauma. 2011;20(2):103–27. doi: 10.1080/10926771.2011.546749. [DOI] [PMC free article] [PubMed] [Google Scholar]
- 21.Lila M, Gracia E, Catalá-Miñana A. Individualized motivational plans in batterer intervention programs: A randomized clinical trial. Journal of consulting and clinical psychology. 2018;86(4):309. doi: 10.1037/ccp0000291. [DOI] [PubMed] [Google Scholar]
- 22.Dutton DG, Bodnarchuk M, Kropp R, Hart SD, Ogloff JP. Client personality disorders affecting wife assault post-treatment recidivism. Violence and victims. 1997;12(1):37–50. [PubMed] [Google Scholar]
- 23.Murphy CM, Eckhardt CI, Clifford JM, LaMotte AD, Meis LA. Individual versus group cognitive-behavioral therapy for partner-violent men: A preliminary randomized trial. Journal of interpersonal violence. 2020;35(15-16):2846–68. doi: 10.1177/0886260517705666. [DOI] [PubMed] [Google Scholar]
- 24.Chan KL. Group therapy for male batterers: a Chinese experience. Social Work with Groups. 2004;26(4):79–90. [Google Scholar]
- 25.Lawson DM, Brossart DF. Attachment, interpersonal problems, and treatment outcome in group therapy for intimate partner violence. Psychology of Men & Masculinity. 2009;10(4):288. [Google Scholar]
- 26.Easton CJ, Mandel DL, Hunkele KA, Nich C, Rounsaville BJ, Carroll KM. A cognitive behavioral therapy for alcohol-dependent domestic violence offenders: An integrated substance abuse–domestic violence treatment approach (SADV) American Journal on Addictions. 2007;16(1):24–31. doi: 10.1080/10550490601077809. [DOI] [PubMed] [Google Scholar]
- 27.Taft CT, Macdonald A, Creech SK, Monson CM, Murphy CM. A randomized controlled clinical trial of the strength at home Men’s program for partner violence in military veterans. The Journal of clinical psychiatry. 2016;77(9):20066. doi: 10.4088/JCP.15m10020. [DOI] [PubMed] [Google Scholar]
- 28.Mbilinyi LF, Neighbors C, Walker DD, Roffman RA, Zegree J, Edleson J, et al. A telephone intervention for substance-using adult male perpetrators of intimate partner violence. Research on social work practice. 2011;21(1):43–56. doi: 10.1177/1049731509359008. [DOI] [PMC free article] [PubMed] [Google Scholar]
- 29.Mucherino A, Papajorgji PJ, Pardalos PM. k-Nearest Neighbor Classification. New York, NY: Springer New York; 2009. pp. 83–106. Available from: [DOI] [Google Scholar]
- 30.Kang H. The prevention and handling of the missing data. Korean journal of anesthesiology. 2013;64(5):402. doi: 10.4097/kjae.2013.64.5.402. [DOI] [PMC free article] [PubMed] [Google Scholar]
- 31.Sidik K, Jonkman JN. A simple confidence interval for meta-analysis. Statistics in medicine. 2002;21(21):3153–9. doi: 10.1002/sim.1262. [DOI] [PubMed] [Google Scholar]
- 32.Oguztuzun C. PSB2023-supplementary-data https://github.com/ceragoguztuzun/PSB2023-Supplementary-Data. Available from: https://github.com/ceragoguztuzun/PSB2023-Supplementary-Data.
- 33.Curry TR, Morales MC, Zavala E, Hernandez JL. Why is family violence lower among Mexican immigrants? The protective features of Mexican culture. Journal of family violence. 2018;33(3):171–84. [Google Scholar]
- 34.Rosay AB. Violence against American Indian and Alaska Native women and men. 2016.
- 35.Howell KH, Barnes SE, Miller LE, Graham-Bermann SA. Developmental variations in the impact of intimate partner violence exposure during childhood. Journal of injury and violence research. 2016 doi: 10.5249/jivr.v8i1.663. [DOI] [PMC free article] [PubMed] [Google Scholar]
- 36.Fulu E, Jewkes R, Roselli T, Garcia-Moreno C, et al. Prevalence of and factors associated with male perpetration of intimate partner violence: findings from the UN Multi-country Cross-sectional Study on Men and Violence in Asia and the Pacific. The lancet global health. 2013;1(4):e187–207. doi: 10.1016/S2214-109X(13)70074-3. [DOI] [PubMed] [Google Scholar]
- 37.Okumu M, Orwenyo E, Nyoni T, Mengo C, Steiner JJ, Tonui BC. Socioeconomic factors and patterns of intimate partner violence among ever-married women in Uganda: pathways and actions for multicomponent violence prevention strategies. Journal of interpersonal violence. 2021:08862605211021976. doi: 10.1177/08862605211021976. [DOI] [PubMed] [Google Scholar]
- 38.Fahmy E, Williamson E, Pantazis C. Evidence and policy review: Domestic violence and poverty. Joseph Rowntree Foundation. 2016 Retrived from https://research-information bristol ac uk/files/80376377/JRF DV POVERTY REPORT FINAL COPY pdf. [Google Scholar]