Abstract
We characterized the fluorescence resonance energy transfer (FRET) from pyrene (donor) to perylene (acceptor) for nucleic acid assays under homogeneous solution conditions. We used the hybridization between a target 32mer and its complementary two sequential 16mer deoxyribonucleotides whose neighboring terminals were each respectively labeled with a pyrene and a perylene residue. A transfer efficiency of ~100% was attained upon the hybridization when observing perylene fluorescence at 459 nm with 347-nm excitation of a pyrene absorption peak. The Förster distance between two dye residues was 22.3 Å (the orientation factor of 2/3). We could change the distance between the residues by inserting various numbers of nucleotides into the center of the target, thus creating a gap between the dye residues on a hybrid. Assuming that the number of inserted nucleotides is proportional to the distance between the dye residues, the energy transfer efficiency versus number of inserted nucleotides strictly obeyed the Förster theory. The mean inter-nucleotide distance of the single-stranded portion was estimated to be 2.1 Å. Comparison between the fluorescent properties of a pyrene–perylene pair with those of a widely used fluorescein–rhodamine pair showed that the pyrene–perylene FRET is suitable for hybridization assays.
INTRODUCTION
Fluorescence resonance energy transfer (FRET) is a dipole–dipole coupling process by which the excited-state energy of a fluorescent donor molecule is non-radiatively transferred to an unexcited acceptor molecule over distances much longer than the collisional diameters (e.g. 50–100 Å) (1,2). The rate constant for FRET by resonance mechanism is dependent, among other factors, on the separation distance between the donor–acceptor pair; the constant is inversely proportional to the six power of the distance. Consequently, FRET has been extensively used as a ‘spectroscopic ruler’ for determining the distance (generally 10–80 Å) between a donor and an acceptor molecule (3). Although other methods such as NMR and X-ray diffraction methods can be used for distance determination, the FRET method is the only one which provides information about the changes in the distance in the process of conformational changes of biomolecules both in solution and in living organisms in vivo (4). Furthermore, the proximity of the donor and acceptor molecules quantitatively reflects the quenching of donor fluorescence and the enhancement of acceptor fluorescence in dilute solution (generally <10–3 M). Therefore, analytes, such as hormones and proteins, can be quantitatively assayed under homogeneous conditions if these molecules are labeled properly with the donor or acceptor molecules (5–7).
In nucleic acid analysis, FRET has recently attracted interest as various methods became available for labeling nucleic acids site-specifically with fluorophores both during and after automated DNA syntheses (8). However, the majority of the donor–acceptor pairs currently used for labeling are constrained in having one dye each from the fluorescein and rhodamine family of dyes. In contrast, we are interested in exploiting the potential of aromatic hydrocarbons as labels for nucleic acid chemistry for the following reasons: (i) an aromatic hydrocarbon can change its fluorescent properties by interactions with nucleic acids [e.g. (9,10)]; (ii) a compound (e.g. pyrene) can exhibit various fluorescent characteristics (e.g. excimer formation and FRET) by interactions with another fluorophore; (iii) the introduction of lipophilic moieties into oligonucleotides may lead to increased transport of the nucleotides across cell membranes, as pointed out by Mann et al. (11). Papers show that an excimer fluorescence from pyrene can be induced in a dilute solution upon hybridization between a target nucleotide and its two probe nucleotides (12–14). The probe nucleotides that run sequentially and that are complementary to the target have a pyrene residue at each of their neighboring terminals (i.e. one pyrene in the 3′-terminal position of one probe and the other in the 5′-terminal position of the other probe). That is, the hybridization to a common complementary strand causes the two terminals come into close proximity. The excimer fluorescence, easily discriminated from the monomer band for its difference in the emission wavelength, should allow homogeneous hybridization assays even in the presence of excess probe nucleotides. We call such hybridization method accompanied with excimer formation the excimer-forming two-probe nucleic acid hybridization (ETPH) method.
In this study, we demonstrated that the FRET from pyrene to perylene also enables homogeneous hybridization assays that use the similar molecular configuration previously adopted for the ETPH method. We also compared the fluorescent properties of a pyrene–perylene pair with those of a fluorescein–rhodamine pair widely used for assays of biomolecules.
MATERIALS AND METHODS
Hybridization format
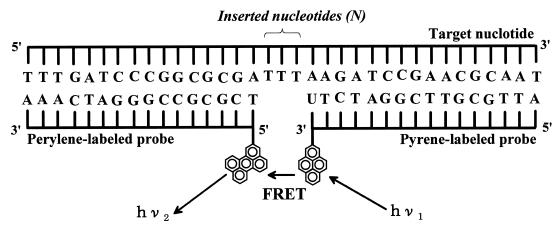
We used the hybridization format (Fig. 1) adopted for the ETPH method reported in a previous paper (12). When changing the distance between pyrene and perylene residues, we used the targets that had 1–10 thymine deoxyribonucleotides in their central portion where no hybridization occurred (Fig. 1).
Figure 1.
Schematic of the molecular configuration of our hybridization system including the sequences of hybridization targets and probes used for FRET experiments.
Target and probe oligonucleotides
The hybridization target was a 32mer deoxyribonucleotide (designated Tgt) with the sequence shown in Figure 1. This sequence is a specific region in the genomic DNA of Escherichia coli for pyrroloquinoline quinone-containing glucose dehydrogenase [EC 1.1.99.17], corresponding to 1135–1166th bases that encode 379–389th amino acid residues (15).
The probes for the detection of Tgt were two different 16mer deoxyribonucleotides that run sequentially and that are complementary to Tgt; one sequence was labeled with a perylene residue at its 5′-terminal and the other with a pyrene residue at its 3′-terminal (designated P5 and P3, respectively; Fig. 1). All the oligonucleotides were purchased from Rikaken Co. Ltd, Japan.
Perylene-labeled P5
The first step in preparing perylene-labeled P5 was to synthesize N-3-(perylenylmethyl) iodoacetamide (PeMIA). Using the method of Buu-Hoi and Long (16), we prepared 3-formylperylene from the reaction of perylene, N-methylformanilide and phosphorus oxychloride in tetrachloromethane under reflux for 3 h. This compound was purified by using silica gel chromatography. After 3-formylperylene was mixed with ammonia in a mixture of dichloromethane–methanol, the resulting perylenylimine was reduced under a H2 stream by using Pd-C catalyst. The 3-perylenylmethylamine thus obtained was purified on a silica gel column. The perylenylmethylamine and iodoacetic acid were reacted in the presence of 1-ethyl-3-(3-(N-N-dimethylamino)propyl)carbodiimide. Finally, the synthesized PeMIA was purified on a silica gel column. The product was a brownish yellow solid (25% yield) that had the following characteristics: Rf = 0.3 (TLC, chloroform/methanol 19:1); 1H NMR 400 MHz (CDCl3) δ 4.80 (d, 2H, -CH2-Pe), 5.05 (s, 2H, I-CH2-), 6.4 (br, 1H, NH), 7.1–7.8 (m, 11H, Pe-H) (Pe = perylenyl residue); 13C NMR 400 MHz (CDCl3) δ 162.1, 137.5, 136.1, 130.8, 129.4, 128.8, 128.6, 128.5, 128.3, 128.1, 128.0, 127.6, 127.0, 48.1, 29.7; MALDI-TOF MS calculated for C23H17INO (MH+) 450.03, found 450.41.
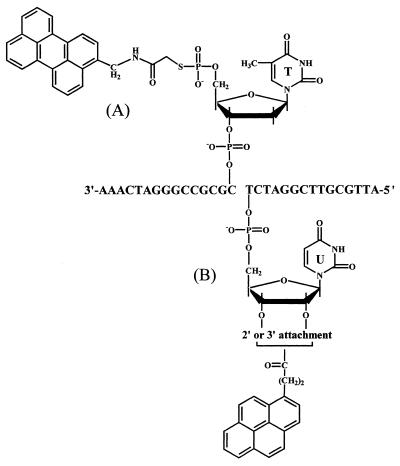
The second step was to label the 5′-terminal of P5 with a perylene residue by using PeMIA as a precursor. As previously described (12), we did this labeling by the method of Czworkowski et al. (17). The synthesized probe (Fig. 2A, hereafter called Pe-P5) was purified by reverse phase HPLC as previously described (12), and then dissolved and stored in 0.1 M phosphate buffer (pH 7.0) at –80°C until use.
Figure 2.
Terminal structures of (A) the perylene-labeled probe (Pe-P5) and (B) the pyrene-labeled probe (Py-P3). The 3′-terminal of Py-P3 is uridine ribonucleotide as only an exception. Py-P3 constitutes 2′-OH- and 3′-OH-labeled isomers.
Pyrene-labeled P3
The 3′-terminal of P3 was labeled with a pyrene residue using 1-pyrenebutanoic acid (Molecular Probes, OR) as a precursor by the carbonyldiimidazol method (18), as previously described (13). The synthesized probe (Fig. 2B, hereafter designated Py-P3) was purified and stored according to the same method for Pe-P5.
N′,N′,N′,N′-tetramethyl-6-carboxyrhodamine (TAMRA)-labeled P5 and fluorescein isocyothianate (FITC)-labeled P3
TAMRA-labeled P5 (TAMRA-P5) was prepared from the synthesized P5 and N′,N′,N′,N′-tetramethyl-6-carboxyrhodamine-N-succunimide ester (Molecular Probes). FITC-labeled P3 (FITC-P3) was synthesized on a Fluorescein CPG 500 column (Glen Research, VA) by an ordinary solid-phase phosphoramidite method. The dye-labeled probes were purified by HPLC on an octadecylsilane column and purchased from Bex Co. Ltd, Japan.
Determination of the concentrations of targets, probes and dye-labeled probes
The concentrations of targets (32–42mers), probes, Pe-P5, Py-P3, TAMRA-P5 and FITC-P3 were determined from the respective absorbance at 260 nm (A260) in 0.1 M phosphate buffer (pH 7.0), based on the calculated extinction coefficients of oligonucleotides (19): e.g. Tgt, 307.4; P5, 154.0; and P3, 147.2 mM–1 cm–1. For the dye-labeled probes, the contribution of a dye moiety to the total A260 was estimated by using an equation reported previously (13).
Hybridization
Hybridization experiments were conducted at 25°C in a standard solution [10 mM phosphate buffer (pH 7.0), 20% (v/v) dimethylformamide (DMF) and 0.2 M NaCl] (designated DMF buffer) containing 100 nM each of Tgt, Pe-P5 and Py-P3 unless otherwise stated. DMF is effective both for controlling hybridization stringency as well as formamide and for enhancing the fluorescence of pyrene labels (13). More than 10 min after mixing all the components, spectroscopic measurements were done.
Absorption and fluorescence measurements
Absorption spectra of hybrids were recorded using an UV-2500 (PC) S spectrophotometer (Shimadzu, Japan) with a cuvette whose light path length was 1.0 cm. The melting curves of hybrids were obtained by measuring the changes in A270 of the solution (13).
Excitation and emission spectra of hybrids were measured by using an 850 spectrofluorometer (Hitachi, Japan) or a Fluorolog3-12 spectrofluorometer (Instruments S.A., NJ) with a 1-cm-square cuvette. The spectrofluorometers were calibrated by using a rhodamine-B quantum counter and a scatterer. The background emission from the buffer alone was subtracted for all data reported. Fluorescence quantum efficiencies were determined by comparing the integrated fluorescence spectra of a sample with that of a standard solution [quinine sulfate dissolved in 0.5 M sulfuric acid (quantum efficiency φstd = 0.546)] (13). Polarization spectra of the hybrid consisting of 1.0 µM each of Py-P3, P5 and a target 36mer, which included four extra thymine nucleotides in the center of Tgt 32mer, were measured at 25°C with an L-format of the 850 spectrofluorometer at 345-nm excitation wavelength. Similarly, the spectra of the hybrid consisting of 100 nM each of Pe-P5, P3 and the target 36mer were measured at 486-nm emission wavelength. The polarization values (P) are given by
P = (I// – I⊥)/(I// + I⊥) 1
where I// and I⊥ are the parallel and perpendicular polarized components of the emission, respectively, to the direction of the excitation that is a vertically polarized light.
Reagents and experimental conditions
The DMF was refluxed with CaH2 after pre-dehydration with molecular sieves. The prepared reagents were either autoclaved or filtered with a filtration unit (SterifilR-D, Millipore, MA). All the experimental procedures were done in a clean booth (Class 100) except when capped vessels and cuvettes were used.
RESULTS
Absorption, excitation and emission spectra of PeMIA and Pe-P5
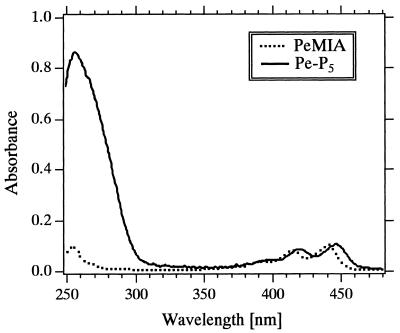
Absorption spectra of PeMIA and Pe-P5 in DMF buffer (Fig. 3) show that the absorption maximum for Pe-P5 (447.5 nm) was red-shifted by 6 nm relative to that for PeMIA (441.5 nm). Comparison of the spectra of Pe-P5 dissolved in between the DMF buffer and 0.1 M phosphate buffer (pH 7.0) shows that the maximum for the phosphate buffer (450.5 nm) was red-shifted by 3 nm relative to that for the DMF buffer (447.5 nm) (data not shown). Based on the extinction coefficient of the 16mer oligonucleotide portion (Materials and Methods), calculated millimolar extinction coefficients at these peaks were 21.2 (in 0.1 M phosphate buffer) and 22.7 mM–1 cm–1 (in the DMF buffer).
Figure 3.
Absorption spectra of PeMIA and Pe-P5 in 10 mM phosphate buffer (pH 7.0) containing 0.2 M NaCl and 20% (v/v) DMF (DMF buffer) at 25°C.
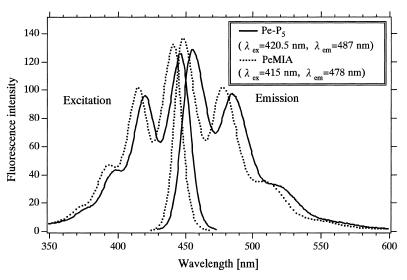
Excitation spectra of PeMIA and Pe-P5 in the DMF buffer (Fig. 4) show that the excitation maximum for Pe-P5 (420.5 nm) was red-shifted by 5 nm relative to that for PeMIA (415.5 nm). Emission spectra (Fig. 4) show that the emission maximum for Pe-P5 (456.5 nm) was red-shifted by 8.5 nm relative to that for PeMIA (448 nm) dissolved in the same solvent. Comparison of the intensity of the emission maximum for Pe-P5 (456.5 nm) with that for PeMIA (448 nm) based on the same absorptivity at the excitation wavelengths (415 and 420.5 nm, respectively) shows that the introduction of perylene residue to the 5′-OH of the 5′-terminal deoxyribose of oligonucleotide did not lead to remarkable fluorescence quenching; ~6% quenching. In contrast, the introduction of a pyrene residue to the terminals of both 5′-OH of the 5′-terminal deoxyribose and 3′-OH of the 3′-terminal ribose significantly enhances the fluorescence quenching; >80% quenching (13).
Figure 4.
Excitation and emission spectra of PeMIA and Pe-P5 in DMF buffer at 25°C. Spectra were normalized to the same absorbance value at 415 nm (PeMIA) and 420.5 nm (Pe-P5).
Excitation and emission spectra of the hybrid between Pe-P5/Py-P3 and Tgt
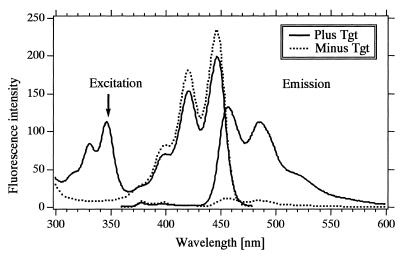
Excitation and emission spectra of the hybrid formed between Pe-P5/Py-P3 and Tgt and those of the control probe mixture before hybridization (i.e. without Tgt) (Fig. 5) show that both the hybrid and the control exhibited two portions of structured emission bands. The first portion, ranging from 370 to 430 nm (peaks at 379 and 398 nm), was attributable to the monomer fluorescence of pyrene, whereas the second portion, ranging from 430 to 600 nm (peaks at 458 and 487 nm), was attributable to the monomer fluorescence of perylene (shown also in Fig. 4). The addition of Tgt to the probe mixture significantly enhanced perylene monomer bands (quantum efficiency, φA= 0.31) while quenching pyrene monomer bands when the spectra were observed with the excitation light at 347 nm, an absorption maximum of pyrene. This characteristic was clearly revealed from the excitation spectra observed with the emission light at 487 nm, an emission band of perylene (Fig. 5). In the absence of Tgt, only the excitation spectrum of perylene (peaks at ~400, 421 and 447 nm) was observed. On the other hand, in the presence of Tgt, the bands of pyrene (peaks at 331 and 347 nm) were observed in addition to the perylene bands. This observation of pyrene bands through the emission of perylene monomer is evidence that the non-radiative FRET occurred upon the hybridization between the probes and the Tgt.
Figure 5.
Excitation (λem = 488 nm) and emission spectra (λex = 347 nm) of the hybrid between Pe-P5/Py-P3 and Tgt in DMF buffer at 25°C. Dotted curves show the spectra of control (λex = 347 nm, λem = 486 nm).
The efficiency of energy transfer is readily obtainable from the excitation spectrum of the energy acceptor (20,21): at a given wavelength, the magnitude of the excitation spectrum of the energy acceptor (I) can be determined by the expression I = ɛA + EɛD, where E is the transfer efficiency and ɛD and ɛA are the extinction coefficients of the energy donor and energy acceptor, respectively. When E = 0% (i.e., no FRET), the excitation spectrum is identical to the absorption spectrum of the energy acceptor. For 100% efficient transfer, the excitation spectrum corresponds to the sum of the absorption spectra of the two chromophores. Accordingly, if E = 100% for the hybrid formation between Pe-P5/Py-P3 and Tgt,
I+Tgt/I–Tgt = (ɛA + ɛD)/ɛA 2
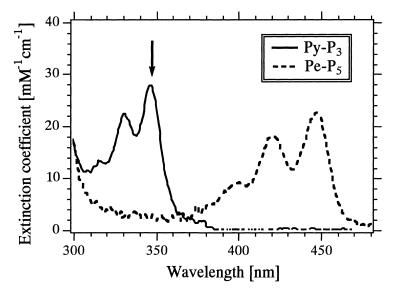
The ratio of I+Tgt/I–Tgt at 347 nm (111.7/8.5 = 13.1; arrow in Fig. 5) was similar to the ratio of (ɛA + ɛD)/ɛA at 347 nm [(2.4 + 27.7)/2.4 = 12.5; arrow in Fig. 6]. This similarity implies that ~100% efficient FRET from pyrene to perylene was attained for the hybrid between Pe-P5/Py-P3 and Tgt and that under our hybridization conditions in a dilute solution there was no energy transfer by the trivial process of reabsorption of fluorescence emitted by the energy donor.
Figure 6.
Extinction coefficients of Py-P3 and Pe-P5 dissolved in DMF buffer at 25°C. The values were determined on the basis of the extinction coefficient of each 16mer oligonucleotide portion of dye-labeled probes.
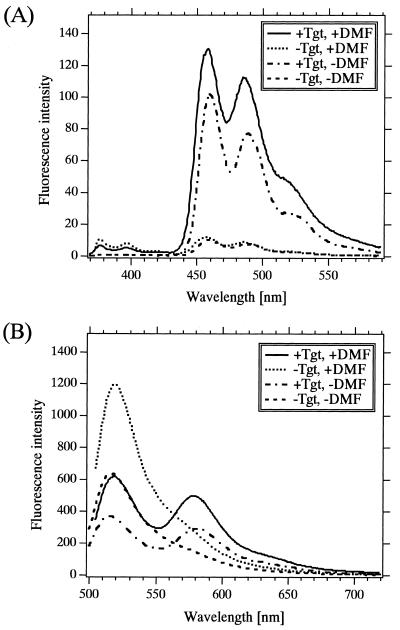
To evaluate the advantages and disadvantages of pyrene–perylene FRET system, we compared this FRET system with a widely used FRET system that uses a dye of the fluorescein family (FITC) as a donor and a dye of the rhodamine family (TAMRA) as an acceptor. We demonstrated the emission spectra of the hybrid between FITC-P3/TAMRA-P5 and a target 36mer under the same conditions described for the hybrid between Pe-P5/Py-P3 and Tgt (Fig. 7).
Figure 7.
Comparison of FRET systems between pyrene–perylene and FITC–TAMRA. (A) Emission spectra of the hybrid between Pe-P5/Py-P3 and Tgt 32mer with 347-nm excitation, and (B) emission spectra of the hybrid between FITC-P3/TAMRA-P5 and a target 36mer with 499-nm (for +DMF) and 494-nm excitations (for –DMF) in 10 nM phosphate buffer, pH 7.0 containing 0.2 M NaCl in the presence and absence of 20% (v/v) DMF at 25°C. The concentration of each dye-labeled probe and target was 100 nM. In (B), the 36mer which had four excess thymine oligonucleotides in the center of Tgt 32mer was used since this 36mer afforded the highest energy transfer efficiency.
Determination of the Förster distance for the FRET from pyrene to perylene residues on the hybrid between Pe-P5/Py-P3 and Tgt
We determined the Förster distance (R0) at which 50% of the energy is transferred, for the FRET from pyrene and perylene residues on the hybrid between Pe-P5/Py-P3 and Tgt in DMF buffer. According to the Förster theory (1):
R0 = (8.79 × 10⁻⁵ J φD n–4 κ2)–1/6 (in Å) 3
J = ∫ ɛA (λ) fD(λ) λ4 dλ / ∫ fD(λ) dλ (in cm6 mmol–1) 4
Where J is the normalized spectral overlap of the donor emission spectrum and the acceptor absorption spectrum, φD is the quantum yield for donor emission in the absence of the acceptor, n is the refractive index of the solution, κ2 is an orientation factor depending on the relative orientation of the emission dipole of the donor and the excitation dipole of the acceptor, ɛA(λ) is the extinction coefficient of the acceptor (M–1 cm–1) and fD(λ) is the corrected emission spectrum of the donor in quanta per unit wavelength interval. Assuming that κ2 of the pyrene–perylene dipoles was 2/3 (i.e. random orientation), we estimated the R0 of the pyrene–perylene FRET in our hybridization system to be 22.3 Å for n = 1.36, φD = 0.03 and J = 2.40 × 10⁻¹⁴ cm6 mmol–1. To evaluate this assumption for κ2, we measured the polarization spectra of pyrene and perylene on hybrids consisting of Py-P3, P5 and target 36mer, and of Pe-P5, P3 and target 36mer, respectively, across the spectral range at which the donor fluorescence overlapped the acceptor absorption (360–480 nm). Both spectra (not shown) gave curves of almost constant polarization values (P = 0.02 for pyrene and 0.24 for perylene).
Effect of the distance between pyrene and perylene residues in the hybrid on the transfer efficiency
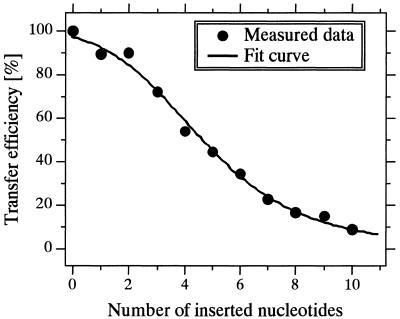
In our hybridization system, we could control the distance between pyrene and perylene residues by using oligonucleotides of various lengths as targets: these targets had an excess sequence (thymine deoxyribonucleotide) in the center of Tgt where the dye residues met each other (Fig. 1). Furthermore, from the above consideration based on the results from Figures 5 and 6, we could postulate that E = 100% for the hybrid between Pe-P5/Py-P3 and Tgt and 0% in the absence of Tgt. We determined the E versus number of inserted nucleotides (N) from excitation spectra (Fig. 8). If N is proportional to the distance (R) between pyrene and perylene residues, then
Figure 8.
Effect of the distance between the pyrene and perylene groups on the FRET efficiency. The distance was changed using various lengths of the targets which were constructed as shown in Figure 1. Other measurements conditions were the same as in Figure 4.
R = a N + b (in Å) 5
where a and b are constants (in Å). Moreover, if the E–R relationship follows the Förster theory:
E = 1 / {1 + (a N + b)6 / R06} 6
Equation 6 fits well (χ2 = 0.0095) the data shown in Figure 8, and the values of a and b were 2.1 and 12.8 Å, respectively.
Temperature-dependent melting profiles of hybrids
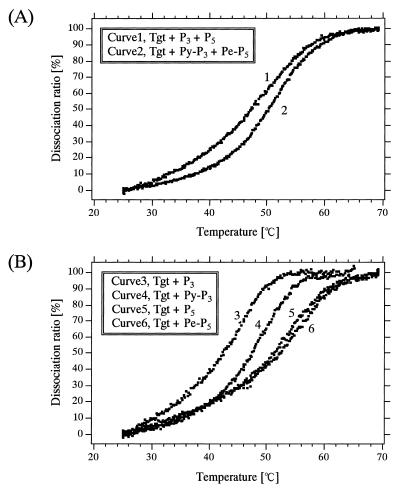
Generally, intercalation and stacking of aromatic hydrocarbons, such as pyrene, into a duplex can stabilize the duplex, leading to an increase in melting temperature (Tm) (22). Therefore, we evaluated the intercalation and stacking of fluorophores in duplexes by monitoring the melting profiles of hybrid. Figure 9 shows the hyperchromicity-based melting profiles of hybrids in our hybridization system. The Tm for the complete hybridization system that involved labeled probes (i.e. the hybrid between Pe-P5/Py-P3 and Tgt) was 52°C, which is higher than that of the complete system that involved unlabeled probes (47°C) (Fig. 9A), suggesting that at least one fluorophore intercalates or stacks. To clarify which fluorophore caused this Tm increase, we obtained melting profiles of hybrids of the individual probes (Fig. 9B). There was no appreciable difference in Tm between the hybrid consisting of Pe-P5 and Tgt (52°C) and the hybrid consisting of P5 and Tgt (51°C). On the other hand, the Tm value of the hybrid consisting of Py-P3 and Tgt (47°C) was higher than that of the hybrid consisting of P3 and Tgt (42°C), indicating that the intercalation or stacking of the pyrene residue to the duplex caused the increase in Tm in the complete hybridization system.
Figure 9.
Melting curves of various hybrids in DMF buffer by measuring absorbance at 270 nm as a function of temperature. The concentrations of Tgt and labeled (or non-labeled) probes were 400 nM.
DISCUSSION
The FRET from pyrene to perylene has been known since 1967 (23). To our knowledge, however, its application to macromolecule analyses was restricted to two studies, each involving Langmuir–Blodgett films: (i) a simulation model for the antenna and sensitizer molecules in photosynthetic reaction (24) and (ii) probes for membrane dynamics (25).
In the present study, we demonstrated that the FRET from pyrene to perylene labels occurred at ~100% efficiency (equation 2) when these labels came into the closest proximity in our hybridization format (i.e. N = 0 in Fig. 1). One major problem in determining a R0 value is that R0 depends on the spatial orientation of transition dipole moments of the fluorophores (i.e. κ2 in equation 3), thereby affecting the distance determination based on equations 5 and 6. Generally, κ2 cannot be correctly determined even in the donor–acceptor pairs with single emission and absorption dipoles, respectively. The reason is that there are various orientations between these two dipoles in a solution (the orientation between these dipoles is perturbed in a solution to some extent), and thus κ2 has a probability distribution. However, theoretical and experimental results reported thus far indicate that the uncertainty in the value of κ2 is not an obstacle in determining the distance between a donor and an acceptor and that its value may be assumed to be 2/3 (i.e. random orientation) (3,26,27). In many donor–acceptor pairs, the ratio of apparent distance, r’, to actual distance, r, (i.e. r’/r) does not exceed ±20% when the value of κ2 is assumed to be 2/3 (3), and this ratio can be narrowed by measuring polarization (or anisotropy) spectra of the donor and acceptor (26,27). Based on table III of Haas et al. (26) and the polarization values for pyrene (0.02) and perylene (0.24) residues on hybrids, we can see that the value of r’/r at half-height of apparent distance probability function, p(r’/r), is 0.95–1.04 for the pyrene–perylene pair in our hybridization format; namely, the value of R in equation 5 has an probable error of ±5%.
The plot of E versus N fits well the curve predicted by the Förster theory (Fig. 8) if N is proportional to R of pyrene–perylene pair (equation 5). The portion where nucleotide(s) were inserted is single stranded, and the resulting constant values of a (2.1 Å) and b (12.8 Å) (equation 6) correspond to the mean values of the inter-nucleotide (IN) distance of the inserted nucleotides and of the distance between pyrene and perylene when no nucleotide was inserted (N = 0), respectively, under states of nucleotide chains flexible in a solution. There are only a few reports on the dynamic structure of a single-stranded oligonucleotide in a solution. Parkhurst and Parkhurst (28) examined this structure [in 0.01 M Tris buffer (pH 8) containing 0.18 M NaCl and 25% formamide] by means of lifetime measurement-based FRET, suggesting that the distribution of a single-stranded 16mer that is labeled at the 5′-end with X-rhodamine and 3′-end with fluorescein through linker arms was best represented by a shifted Gaussian, with the mean donor–acceptor distance of 51.5 Å. Although they did not estimate the mean IN distance of the 16mer, they found that the mean donor–acceptor distance of its duplex (B-type DNA) is larger than that of the single-stranded 16mer, implying that the mean IN distance of a single-stranded nucleotide is less than that of its double-stranded nucleotide. Recently, Rivetti et al. (29) theoretically and experimentally analyzed double-stranded DNA molecules with a single-stranded region (1–10 thymine deoxyribonucleotides) in its center by using the worm-like chain model. Based on the average contour length and the total number of base pairs measured from scanning force microscope images, they indicated that the mean IN distance of the double-stranded DNA is 2.90 Å and that the persistence length of the single-stranded region is 1.3 nm. The mean IN distance of a single-stranded nucleotide has not yet been reported, and thus we have no comparison value for our measured value of a (2.1 Å). However, our measured value contradicts neither the results reported by Parkhurst and Parkhurst nor by Rivetti et al. Similarly, we have no comparison value for our measured value of b. However, we previously predicted a value of 5 Å for the interplaner distance of pyrene rings for the most stable hybrid constructed by a computer-assisted molecular modeling by using the consistent valence force field (30). This hybrid has the same linker arms between pyrene group and the terminal sugar moieties as those used in the present study in the same hybridization format. Because of an intercalation of a pyrene ring in the present hybrid as indicated in Figure 9, the value of b (12.8 Å) may be obtained. From the good fit of data to the predicted curve and no contradition of the values of a and b, we concluded that the FRET from pyrene (donor) to perylene (acceptor) labels in our hybridization format strictly obeys the Förster theory.
Various homogeneous hybridization formats featuring FRET have been proposed (7,31,32). Among these formats, the one using two probes, each labeled at the neighboring terminals with a fluorophore (Fig. 1), can only enable non-competitive assays. Using this format, which was originally proposed by Heller et al. in 1983 in an European Patent Application (32), we evaluated the availability and practicality of the FRET from pyrene to perylene by comparing this FRET with the FRET from FITC to TAMRA (Fig. 7) because most FRET studies have employed such a fluorescein–rhodamine pair (8).
An excitation beam for the FITC–TAMRA is located in the visible region (usually around 490 nm), contrasting to an UV-excitation (around 345 nm) for the pyrene–perylene. In this respect, the FITC–TAMRA pair is superior to the pyrene–perylene pair, because the UV light may excite other contaminants especially when the sample is contaminated with other living matter including various UV-excited fluorescent substances.
The FITC–TAMRA pair is also superior in terms of emission intensity. The intensity of the emission peak for perylene is about nine times lower than that for FITC emission (at 519 nm in the absence of Tgt) and about four times lower than that for TAMRA emission (at 579 nm in the presence of Tgt) under our instrumentation conditions (Fig. 7, in the presence of DMF).
The pyrene–perylene pair is superior, however, in terms of signal/background (S/B) ratio, which can be determined by calculating the ratio of an emission intensity in the presence of a target to that in the absence of a target for acceptor emission or the ratio of vice versa for donor emission. The S/B ratio for pyrene–perylene (11 at 460 nm, 13 at 486 nm) is higher than that for FITC–TAMRA (2.0 at 519 nm for FITC peak; 1.8 at 579 nm for TAMRA peak) (Fig. 7). The higher S/B ratio can afford the higher dynamic range of target concentration determination and may lower the detection limit of target concentration. Two major reasons why the FITC–TAMRA has low S/B ratios in the wavelength region of acceptor emission is that the longer wavelength region in the donor emission spectrum overlaps the acceptor emission spectrum and that the quantum efficiency of fluorescein fluorescence is quite high [0.4–0.8 in an aqueous buffer solution (33,34)]. This spectral overlap may also render the obtained values of target concentration inaccurate (6), and thus Clegg et al. (35) recommended a method to extract the rhodamine fluorescence spectrum from the combined spectrum. In contrast, the pyrene–perylene does not suffer from such spectral overlap because the labeled donor emits negligible fluorescence in the wavelength region of perylene emission due to its low fluorescence quantum efficiency (0.03) and to the large Stokes shift of the acceptor emission. The low fluorescence quantum efficiency of pyrene-labeled probes is due to the introduction of pyrene residues to nucleotides and its degree is dependent on the nucleotide sequence and the presence of pyrimidine nucleotides (36). On the other hand, this low efficiency is independent of the transfer efficiency of absorbed energy to an acceptor; the pyrene–perylene FRET is an example of being virtually non-fluorescent and yet exhibiting highly efficient transfer (~100%) of absorbed energy to an acceptor.
A fluorescein–rhodamine pair has a large Förster distance (~50 Å) (37). In general, FRET-based experiments can determine distances that are within ±50% of the Förster distance (3); 25–75 Å in a fluorescein–rhodamine pair. Furthermore, the maximal transfer efficiency [~60% (37)] is obtained with a target having five or four intervening nucleotides in the hybridization format shown in Figure 1 (32,37); as the separation distance increases beyond five or four intervening nucleotides, energy transfer decreases whereas energy transfer also decreases as the separation distance decreases. In contrast, pyrene–perylene FRET strictly obeys the Förster theory, and can be used to determine distances ranging from 11 to 32 Å (R0 = 22.3 Å). In nucleic acid chemistry, such distance capability makes the pyrene–perylene FRET particularly suitable for determining distances less than that of fluorescein–rhodamine.
CONCLUSION
The FRET from pyrene (donor) to perylene (acceptor) labels strictly adhere to the Förster theory with its Förster distance of 22.3 Å (distance determination range of 11–32 Å) when characterized using the hybridization between two labeled probes and the complementary target in a solution. The following advantages make this label pair suitable for homogenous hybridization assays: (i) high sensitivity because of the high quantum efficiency of the pair (0.3); (ii) ease of data acquisition because of the large Stokes shift between pyrene and perylene fluorescence; (iii) wide dynamic range for concentration determination because of the large difference in acceptor fluorescence intensities in the presence and absence of targets.
Acknowledgments
ACKNOWLEDGEMENT
This work was one topic in the National Project for Development of Biosensors in the Food Industry, supported in part by a grant from the Japanese Ministry of Agriculture, Forestry and Fisheries to Hamamatsu Photonics through the project implementation body, the Society for Techno-Innovation of Agriculture, Forestry and Fisheries.
REFERENCES
- 1.Förster R.J. (1959) Discuss. Faraday Soc., 27, 7–17. [Google Scholar]
- 2.Van der Meer B.W., Raymer,M.A., Wagoner,S.L., Hackney,R.L., Beechem,J.M. and Gratton,E. (1993) Biophys. J., 64, 1243–1263. [DOI] [PMC free article] [PubMed] [Google Scholar]
- 3.Stryer L. (1978) Annu. Rev. Biochem., 47, 819–846. [DOI] [PubMed] [Google Scholar]
- 4.Lankievicz L., Malicka,J. and Wiczk,W. (1997) Acta Biochim. Pol., 44, 477–489. [PubMed] [Google Scholar]
- 5.Van der Meer B.W., Coker,G.,III and Chen,S.-Y.S. (1994) Resonance Energy Transfer. Theory and Data. VCH Publishers, New York.
- 6.Selvin P.R. (1995) Methods Enzymol., 246, 300–334. [DOI] [PubMed] [Google Scholar]
- 7.Cantor C.R. (1996) Nature Biotechnol., 14, 264. [DOI] [PubMed] [Google Scholar]
- 8.Yang M. and Millar,D.P. (1997) Methods Enzymol., 278, 417–444. [DOI] [PubMed] [Google Scholar]
- 9.Yamana K., Gokota,T., Ozaki,H., Nakano,H., Sangen,O. and Shimidzu,T. (1992) Nucl. Nucl., 11, 383–390.
- 10.Balakin K.V., Korshun,V.A., Mikhalev,I.I., Maleev,G.V., Malakhov,A.D., Prokhorenko,I.A. and Berlin,Y.A. (1998) Biosens. Bioelectron., 13, 771–778. [DOI] [PubMed] [Google Scholar]
- 11.Mann J.S., Shibata,Y. and Meehan,T. (1992) Bioconjug. Chem., 3, 554–558. [DOI] [PubMed] [Google Scholar]
- 12.Ebata K., Masuko,M., Ohtani,H. and Kashiwasake-Jibu,M. (1995) Photochem. Photobiol., 62, 836–839. [DOI] [PubMed] [Google Scholar]
- 13.Masuko M., Ohtani,H., Ebata,K. and Shimadzu,A. (1998) Nucleic Acids Res., 26, 5409–5416. [DOI] [PMC free article] [PubMed] [Google Scholar]
- 14.Paris P.L., Langenhan,J.M. and Kool,E.T. (1998) Nucleic Acids Res., 26, 3289–3293. [Google Scholar]
- 15.Clenton-Jansen,A.-M., Goosen,N., Fayet,O. and Van de Putte,P. (1990) J. Bacteriol., 172, 6308–6315. [DOI] [PMC free article] [PubMed] [Google Scholar]
- 16.Buu-Hoi N.P. and Long,C.T. (1956) Recl. Trav. Chim. Pays-Bas, 75, 1221–1226. [Google Scholar]
- 17.Czworkowski J., Odom,O.W. and Hardesty,B. (1991) Biochemistry, 30, 4821–4830. [DOI] [PubMed] [Google Scholar]
- 18.Gottikh B.P., Krayevsky,A.A., Tarussova,N.B., Purygin,P.P. and Tsilevich,T.L. (1970) Tetrahedron, 26, 4419–4433. [DOI] [PubMed] [Google Scholar]
- 19.Borer P.N. (1975) In Fasman,G.D. (ed.), Handbook of Biochemistry and Molecular Biology, Vol. 1, 3rd Edn. CRC Press, Cleveland, OH, pp. 589–603.
- 20.Weber G. and Teale,F.W.J. (1958) Trans Faraday Soc., 54, 640–648. [Google Scholar]
- 21.Stryer L. and Haugland,R.P. (1967) Proc. Natl Acad. Sci. USA, 58, 719–726. [DOI] [PMC free article] [PubMed] [Google Scholar]
- 22.Berman H.M. and Young,P.R. (1981) Annu. Rev. Biophys. Bioeng., 10, 87–114. [DOI] [PubMed] [Google Scholar]
- 23.Tomura M., Ishiguro,E. and Mataga,N. (1967) J. Phys. Soc. Jpn, 22, 1117. [Google Scholar]
- 24.Fujihira M., Sakomura,M. and Kamei,T. (1989) Thin Solid Films, 180, 43–50. [Google Scholar]
- 25.Dutta A.K., Pal,A.J. and Misra,T.N. (1994) Solid State Commun., 92, 857–863. [Google Scholar]
- 26.Haas E., Katchlalski-Katzir,E. and Steinberg,I.Z. (1978) Biochemistry, 17, 5064–5070. [DOI] [PubMed] [Google Scholar]
- 27.Dale R.E., Eisinger,J. and Bumberg,W.E. (1979) Biophys. J., 26, 161–193. [DOI] [PMC free article] [PubMed] [Google Scholar]
- 28.Parkhurst K.M. and Parkhurst,L.J. (1995) Biochemistry, 34, 293–298. [DOI] [PubMed] [Google Scholar]
- 29.Rivetti C., Walker,C. and Bustamante,C. (1998) J. Mol. Biol., 280, 41–59. [DOI] [PubMed] [Google Scholar]
- 30.Masuko M., Toyoda,S., Suwa,M., Mitaku,S., Shimazu,A. and Ohtani,H. (1998) Nucleic Acids Symp. Ser., 37, 83–84. [PubMed] [Google Scholar]
- 31.Matthews J.A. and Kricka,L.J. (1988) Anal. Biochem., 169, 1–25. [DOI] [PubMed] [Google Scholar]
- 32.Morrison L.E. (1992) In Kricka,L.J. (ed.), Nonisotopic DNA Probe Techniques. Academic Press, San Diego, CA, pp. 311–352.
- 33.Morrison L.E., Halder,T.C. and Stols,L.M. (1989) Anal. Biochem., 183, 231–244. [DOI] [PubMed] [Google Scholar]
- 34.Eis P.S. and Millar,D.P. (1993) Biochemistry, 32, 13852–13860. [DOI] [PubMed] [Google Scholar]
- 35.Clegg R.M., Murchie,A.I.H., Zechel,A., Carlberg,C., Diekmann,S. and Lilley,D.M.J. (1992) Biochemistry, 31, 4846–4856. [DOI] [PubMed] [Google Scholar]
- 36.Mohammadi S., Slama-Schwok,A., Leger,G., Manouni,D.E., Shchyolkina,A., Leroux,Y. and Taillandier,E. (1997) Biochemistry, 36, 14836–14844. [DOI] [PubMed] [Google Scholar]
- 37.Cardullo R.A., Agrawal,S., Flores,C., Zamecnik,P.C. and Wolf,D.E. (1988) Proc. Natl Acad. Sci. USA, 85, 8790–8794. [DOI] [PMC free article] [PubMed] [Google Scholar]


