

Summary
Microglia are specialized brain-resident macrophages that play crucial roles in brain development, homeostasis and disease. However, until now, the ability to model interactions between the human brain environment and microglia has been severely limited. To overcome these limitations, we developed an in vivo xenotransplantation approach that allows us to study functionally mature human microglia (hMG) that operate within a physiologically relevant, vascularized immunocompetent human brain organoid (iHBO) model. Our data show that organoid-resident hMG gain human-specific transcriptomic signatures that closely resemble their in vivo counterparts. In vivo two-photon imaging reveals that hMG actively engage in surveilling the human brain environment, react to local injuries and respond to systemic inflammatory cues. Finally, we demonstrate that the transplanted iHBOs developed here offer the unprecedented opportunity to study functional human microglia phenotypes in health and disease and provide experimental evidence for a brain-environment-induced immune response in a patient-specific model of autism with macrocephaly.
Summary Sentence
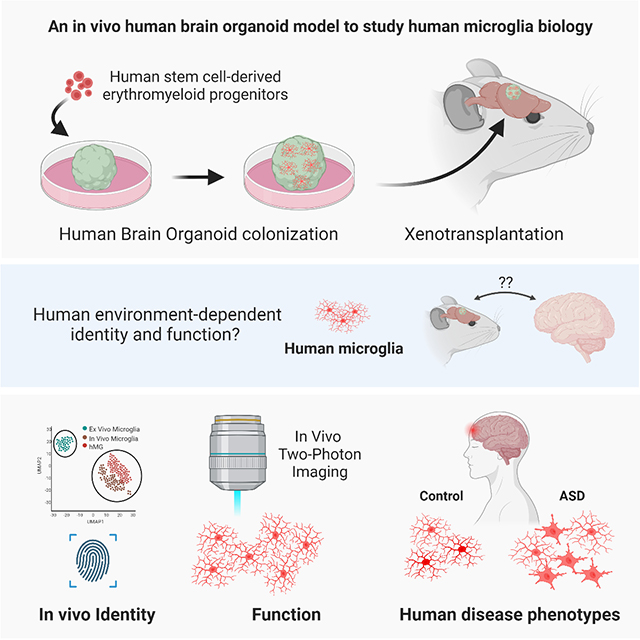
An organoid-based xenotransplantation platform to study human brain environment-dependent and disease-associated microglia phenotypes under in vivo conditions.
Graphical Abstract
Introduction
A specialized population of tissue-resident macrophages known as microglia play a central role in brain development, homeostasis and tissue repair. Microglia develop from yolk sac-derived erythromyeloid progenitors (EMPs) and are presumed to enter the brain between 4.5 and 5.5 gestational weeks in humans; they use tangential and radial migration routes through the ventricle or the mantle zone 1–3. Mounting evidence from human and animal studies suggests that microglia may be implicated in various brain disorders, including neurodevelopmental conditions such as autism spectrum disorder (ASD) 4–10. However, until now, the ability to model interactions between human brain cells and microglia has been severely limited. To understand and study human microglial function in health and disease, novel platforms are needed that feature functionally mature cells operating within a physiologically relevant human brain environment, a critical step for modeling the cellular and environmental complexity that emerges from a cooperative interaction between the different cell types in the developing human brain.
The brain environment is instrumental in sustaining and orchestrating microglial identity 11–13. Two-dimensional (2D) cultured microglia lack a brain environment and assume a non-physiological, partially activated state, which is reflected in a dramatic shift in their gene expression profile and epigenetic landscape 12,14. Brain organoids, on the other hand, recapitulate some features of the brain’s 3D structure, allow more organized tissue formation, contain multiple cell types, and are considered to be more mature than a 2D culture system 15,16. However, current models generated through guided approaches still lack cell types that are of non-ectodermal origin such as microglia 17. Recent advances have allowed the generation of induced microglia-like cells from human pluripotent stem cells (hPSCs) in isolation, including human embryonic stem cells (hESCs) and induced pluripotent stem cells (iPSCs) 18–23. Short-term co-culture experiments have demonstrated that the incorporation of hPSC-derived microglia-like cells into organoids is feasible 18,21,24,25, but the extent to which these in vitro structures support maturation and long-term survival and whether the integrated cells ultimately acquire a state that fully resembles the identity of their in vivo counterparts remain unknown. Recent attempts to reinstate microglial identity were achieved through xenotransplantation of hPSC-derived microglia into transgenic immunocompromised mouse models 26–29. However, these approaches lack the ability to assess the interaction of human microglia with their human neuronal environment, which is crucial for studying the cooperative contribution of the two components in the context of human diseases.
To model microglia identity and to assess the interaction and response of human microglia to the human brain environment, we harnessed our recently developed xenotransplantation approach 30 to develop a transplanted immunocompetent human brain organoid (iHBO) model that allows the investigation of hPSC-derived human microglia within vascularized human brain organoids under physiological conditions in vivo. The human microglial cells (hMG) populate the human organoid graft, express microglia-specific markers and show morphological features indicative of a resting and surveillance state. Using longitudinal transcriptomic profiling, we show that the hMG in our system follow a stepwise developmental program towards acquisition of an immune-sensing microglial state, similar to what has been reported in studies on human brain tissue 31,32,12,14. We demonstrate that the hMG assume transcriptomic identities that closely resemble their counterparts in vivo. By contrasting transcriptomic profiles gained under human and mouse brain environmental conditions, our system also reveals that some of the previously reported human microglia-specific patterns of gene expression are in part instructed by the human brain environment. Finally, our approach allows the functional assessment of hMG phenotypes within a human brain-like environment under physiological and pathological conditions in vivo. Using two-photon microscopy within the vascularized human organoid graft, we demonstrate that hMG actively engage in surveilling the human brain-like environment and are capable of reacting to environment-induced injury. We demonstrate that our in vivo approach is suitable for dissecting human microglia phenotypes during development and disease, and we provide evidence for a brain-environment-induced immune response in a patient-specific model of autism with macrocephaly. Thus, the system developed here provides an opportunity to study functional human-specific microglia phenotypes in health and disease.
Results
EMPs efficiently populate developing cortical organoids
We sought to establish a novel brain organoid model to recapitulate the colonization of the developing human brain through EMPs. In humans, yolk sac-derived EMPs accumulate in the superficial marginal zone of the telencephalic wall and are presumed to enter the telencephalon from the pial surface between gestational weeks 4.5 and 5.5 1–3. To model these early events of microglial entry into the human telencephalon, we used a recently developed protocol 18 to obtain viable and pure populations of CD43+ EMPs. Generating hPSC lines constitutively expressing tdTomato (tdT) or GFP under the control of a chicken-beta-actin promoter (CAG::tdT, CAG::GFP) enabled us to assess the colonization of cortical organoids through EMPs (Figure S1A–F). Live imaging of tdT+ EMPs co-cultured with forebrain-specific cortical organoids revealed a highly efficient invasion of EMPs within 12 hrs (Video S1). Subsequent tissue clearing confirmed the presence of tdT+ EMPs that invaded the cortical organoid tissue (Video S2), in line with previous studies that showed the feasibility of incorporating induced microglia-like cells into organoids 18,33.
As microglia are thought to enter the telencephalon before the peak of neurogenesis 1,2, we first evaluated whether the developmental stage of the organoid could affect EMP colonization. A significantly enhanced colonization of EMPs was observed between days 35 and 42 of forebrain organoid development, with less efficient integration of EMPs before the onset of neurogenesis as well as at more advanced developmental stages (Figure S1G), suggesting an optimal window for radial entry of microglia progenitors. Following 4 days of co-culture, invading EMPs expressed CD43, a marker for hematopoietic specification (Figure S1F), and they showed the most consistent colonization of cortical organoids, as assessed 8 days post integration (dpi) when using at least 100,000 cells per organoid (Figure S1H and I). During these early stages of brain development, microglia are absent from the germinal layers and the intermediate zone 34. Strikingly, the radially invading tdT+ EMPs specifically populated marginal cortical plate (CP)-like regions of forebrain organoids, avoiding direct invasion of ventricular zone (VZ)-like regions (Figure S1J and K). More than 96% of the integrated tdT+ cells expressed the myeloid-specific lineage-determining transcription factor PU.1 (96.92% ± 0.96; Figure S1L).
EMPs assume primitive ramified-like morphologies after 6 weeks in vitro
We hypothesized that forebrain organoids as a model for the developing human cortex might be sufficient to provide an environment that allowed for progressive microglial differentiation. However, in the absence of human CSF, TGFb and IL-34, integrated EMPs failed to survive within these structures (Figure S1M). Supplementation of these 3 factors allowed further in vitro differentiation, with the progenies of integrated EMPs assuming rudimentary ramified-like morphologies (Figure S2A). When compared to hPSC-derived microglia-like cells grown in monolayer conditions (2D), organoid-colonizing EMP-derived cells were more frequently found in a rudimentary ramified-like state (Figure S2B). While a large proportion of these cells expressed the myeloid marker IBA1 at 6 weeks post integration (wpi) (Figure S2C), markers characteristic of homeostatic microglia such as TMEM119 or P2RY12 were not detected at 6 wpi in vitro (Figure S2D and E). To further assess the transcriptomic profiles of these cells, we performed single cell RNA-sequencing (scRNAseq) on tdT+ cells isolated using Fluorescence-activated cell sorting (FACS) at 6 wpi and analyzed 4,422 cells from 3 independent batches of organoids (Figure S2F). After embedding the datasets into a nearest neighbor space using Uniform Manifold Approximation and Projection (UMAP), we detected 10 molecularly distinct types of cells using Louvain clustering (Figure S2G). Cell type prediction based on a human fetal dataset 35 revealed higher similarities to human fetal microglia as compared to neuronal and other brain cell types (Figure S2H). In contrast to the level of heterogeneity seen during microglia development, the tdT+ cells isolated from organoids in vitro appeared to cluster more uniformly. A majority of these cells expressed the myeloid marker AIF1 (encoding IBA1) (Figure S2I), with Cluster 5 corresponding to a highly proliferative population of microglia-like cells, as indicated by the expression of cell cycle-specific gene sets (Figure S2J). However, as seen in the level of protein, expression of P2RY12 mRNA was almost completely absent from most cells, and TMEM119 and SALL1 transcripts were not detectable (Figure S2K). The specific lack of these mature microglia-specific genes points to either an insufficient acquisition of the environment-specific signature or an incomplete transition to a mature homeostatic state.
We next extended the time of in vitro differentiation to evaluate whether the organoid environment would permit a mature homeostatic microglial state to emerge over time. Longitudinal assessment of in vitro co-culture conditions revealed a progressive loss of tdT+ cells, reducing the initially expanding population of tdT+ cells at 2 wpi down to less than 5% at 13 wpi (93 days) (Figure S3A). We, and others, have recently shown that progressive necrosis in the core of cerebral organoids can hamper their maturation and survival 30. In line with this finding, fragmented tdT+ particles were progressively present in the center of the organoids whereas only a few tdT+ cells were found towards the organoid’s mantle region (Figure S3B and C). The majority of those few surviving cells showed round, activated morphologies and did not express TMEM119 or P2RY12 (Figure S3D), indicating an ongoing cellular activation and an unfavorable environment that hampered long-term co-culture in vitro.
Transplantation permits the development of homeostatic human microglia in vivo
To overcome these limitations and to model the brain environment under more physiological conditions, we capitalized on our recently developed transplantation paradigm 30. We grafted EMP-containing cortical organoids into the retro-splenial cortex of immunocompromised NOD/SCID mice 10 days after in vitro EMP integration (Figure 1A), resulting in efficient vascularization of the graft (Figure S4A and B). Strikingly, transplanting the EMP-containing organoid models allowed the tdT+ cells to survive and exclusively populate the human organoid tissue with no detectable migration to the host brain (Figure 2B and S4C). It is important to note that the host mice in our system were not humanized for CSF-1, suggesting that the vascularized human graft was sufficient to support sustained survival of human microglia within its boundaries. Almost all tdT+ cells showed high expression of IBA1 at 8 weeks post transplantation (wpt) (Figure 1B and C). In addition, tdT+ cells co-expressed the myeloid transcription factor PU.1 as well as human-specific TMEM119 within the human graft (Figure 1D). Importantly, tdT+ cells showed characteristic mature microglia morphologies, with more than 99% of tdT+ cells assuming a ramified state (Figure 1E and F). In-depth morphometric analysis revealed highly complex branching patterns, with large numbers of higher order processes (Figure 1G and H), reminiscent of what has been reported for human and mouse microglia in brain sections 36–39. As shown with hESCs, transplanted immunocompetent human brain organoid (iHBO) models derived from 3 independent iPSC lines harbored hMG that consistently showed characteristic morphologies and high expression of IBA1 (Figure 1I and Figure S4D–F). Importantly, comparing iHBO-resident hMG with IBA1+ microglia from human brain tissue revealed a similar morphological appearance, as measured by the distribution of soma size and process numbers (Figure 1J and K and Figure S4G). Taken together, our chimeric platform provides a permissive environment for hMG to survive and to mature into brain-resident immune cells that show a high level of morphological similarity to human microglia in situ.
Figure 1. Transplantation permits maturation and long-term survival of human microglia in human brain organoids in vivo.
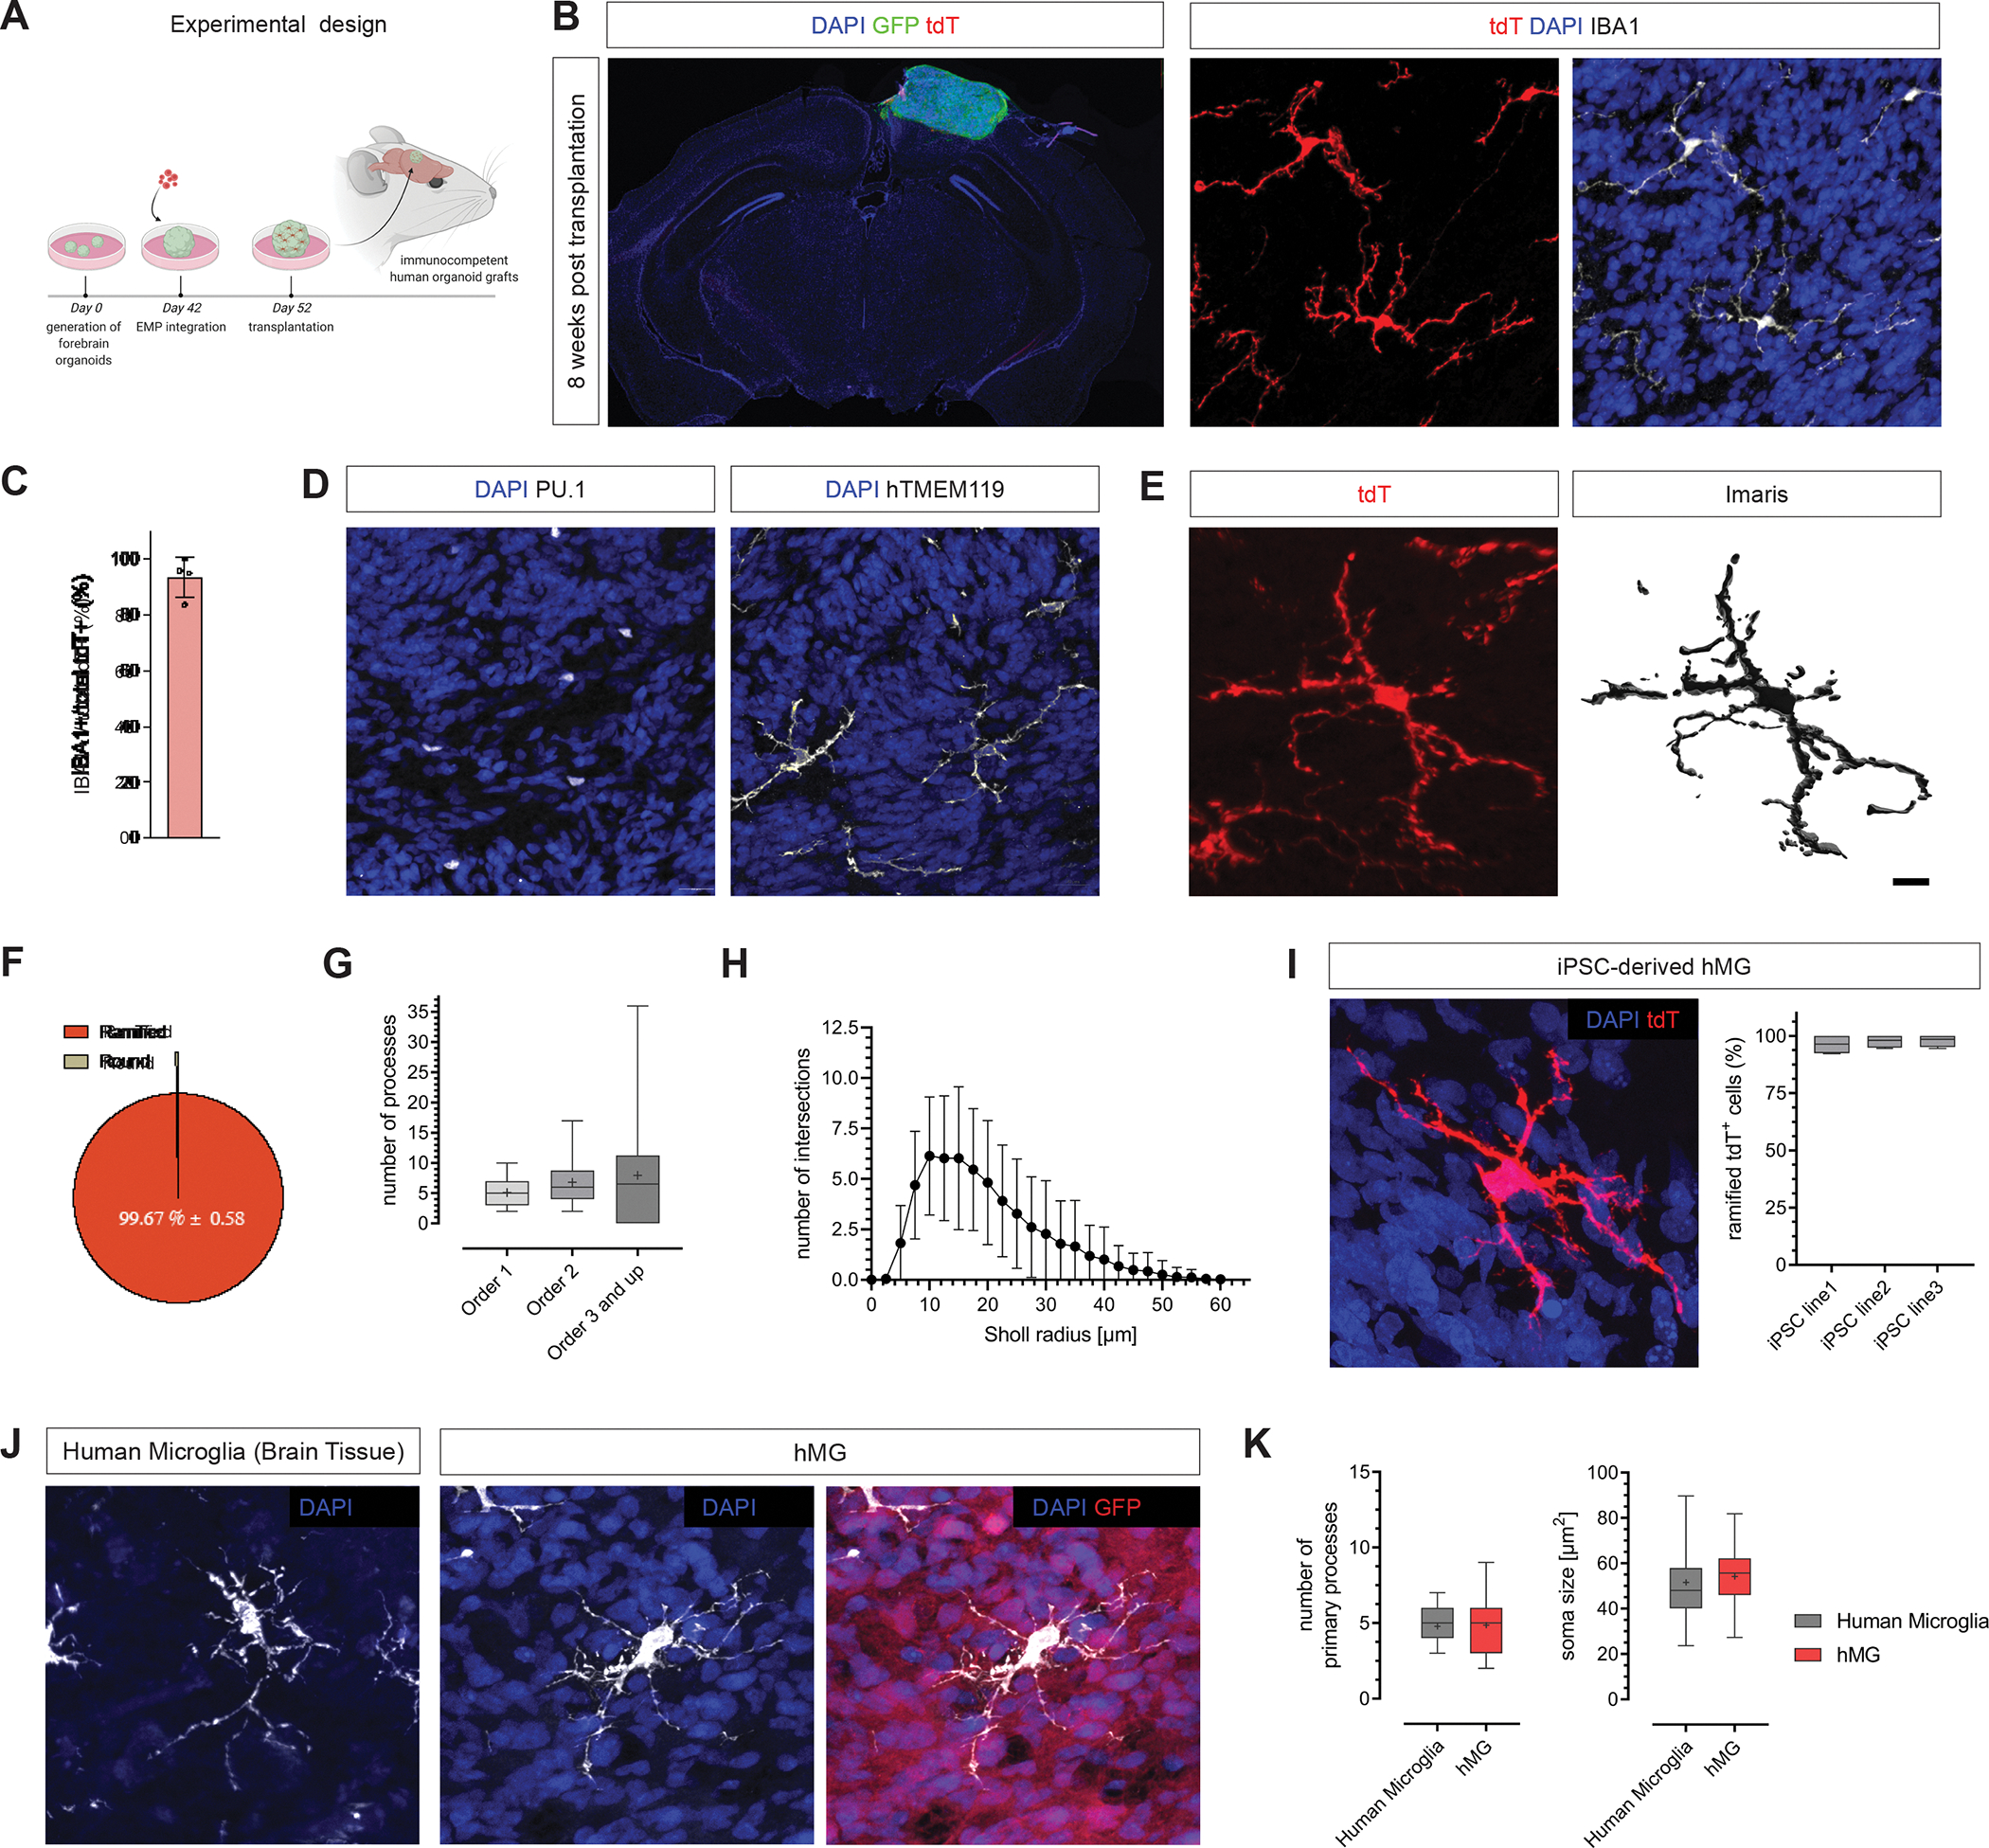
(A) EMP-containing forebrain organoids were transplanted into the retro-splenial cortex of NOD/SCID mice and harvested 8 weeks post transplantation (wpt) for histological characterization. (B) Left, representative slide scan image showing a coronal brain section grafted with a human organoid (GFP) containing tdT+ cells. Right, representative confocal images showing tdT+ cells that co-express IBA1 at 8 wpt. Scale bar 20 μm. (C) Bar graph showing percentages of tdT+ cells expressing the myeloid marker IBA1; Mean ± SD; n=4 independent transplantation experiments. (D) Representative images showing presence of cells expressing the myeloid-specific transcription factor PU.1 and the homeostatic human-specific microglia marker TMEM119 at 8 wpt in vivo. Scale bars 20 μm. (E) Representative confocal image showing the ramified morphology of a human microglia and 3D reconstruction using Imaris. Scale bar 10 μm. (F) Pie chart showing relative abundance of microglia morphologies observed at 8 wpt in vivo. (G) Box plots showing quantifications of process numbers observed in hMGs at 8 wpt in vivo. Box plots show median (center line), mean (‘+’) and interquartile range (IQR), with whiskers representing the minimum and the maximum; n=42 cells analyzed. (H) Sholl plot showing the distribution of process intersections as a measure of cellular complexity. Mean ± SD. (I) Left, representative confocal image showing the characteristic ramified morphology of a human microglia derived from an independent iPSC line at 11 wpt in vivo. Scale bar 20 μm. Right, Bar graph showing percentages of tdT+ cells featuring ramified morphologies as quantified for 3 independent iPSC lines at 11 wpt. (J) Representative confocal images of human IBA+ microglia (brain tissue) and tdT+ hMG at 11 wpt in human brain organoids in vivo. Scale bar 50 μm. (K) Box plots showing the distributions of primary process numbers and soma size of microglia in human brain tissue and hMG in human brain organoids in vivo. Quantifications were conducted on tissue from 5 independent human subjects and hMG derived from 3 independent iPSC lines. See also Figure S4.
Figure 2. Transcriptomic characterization of human microglia identity in vivo.
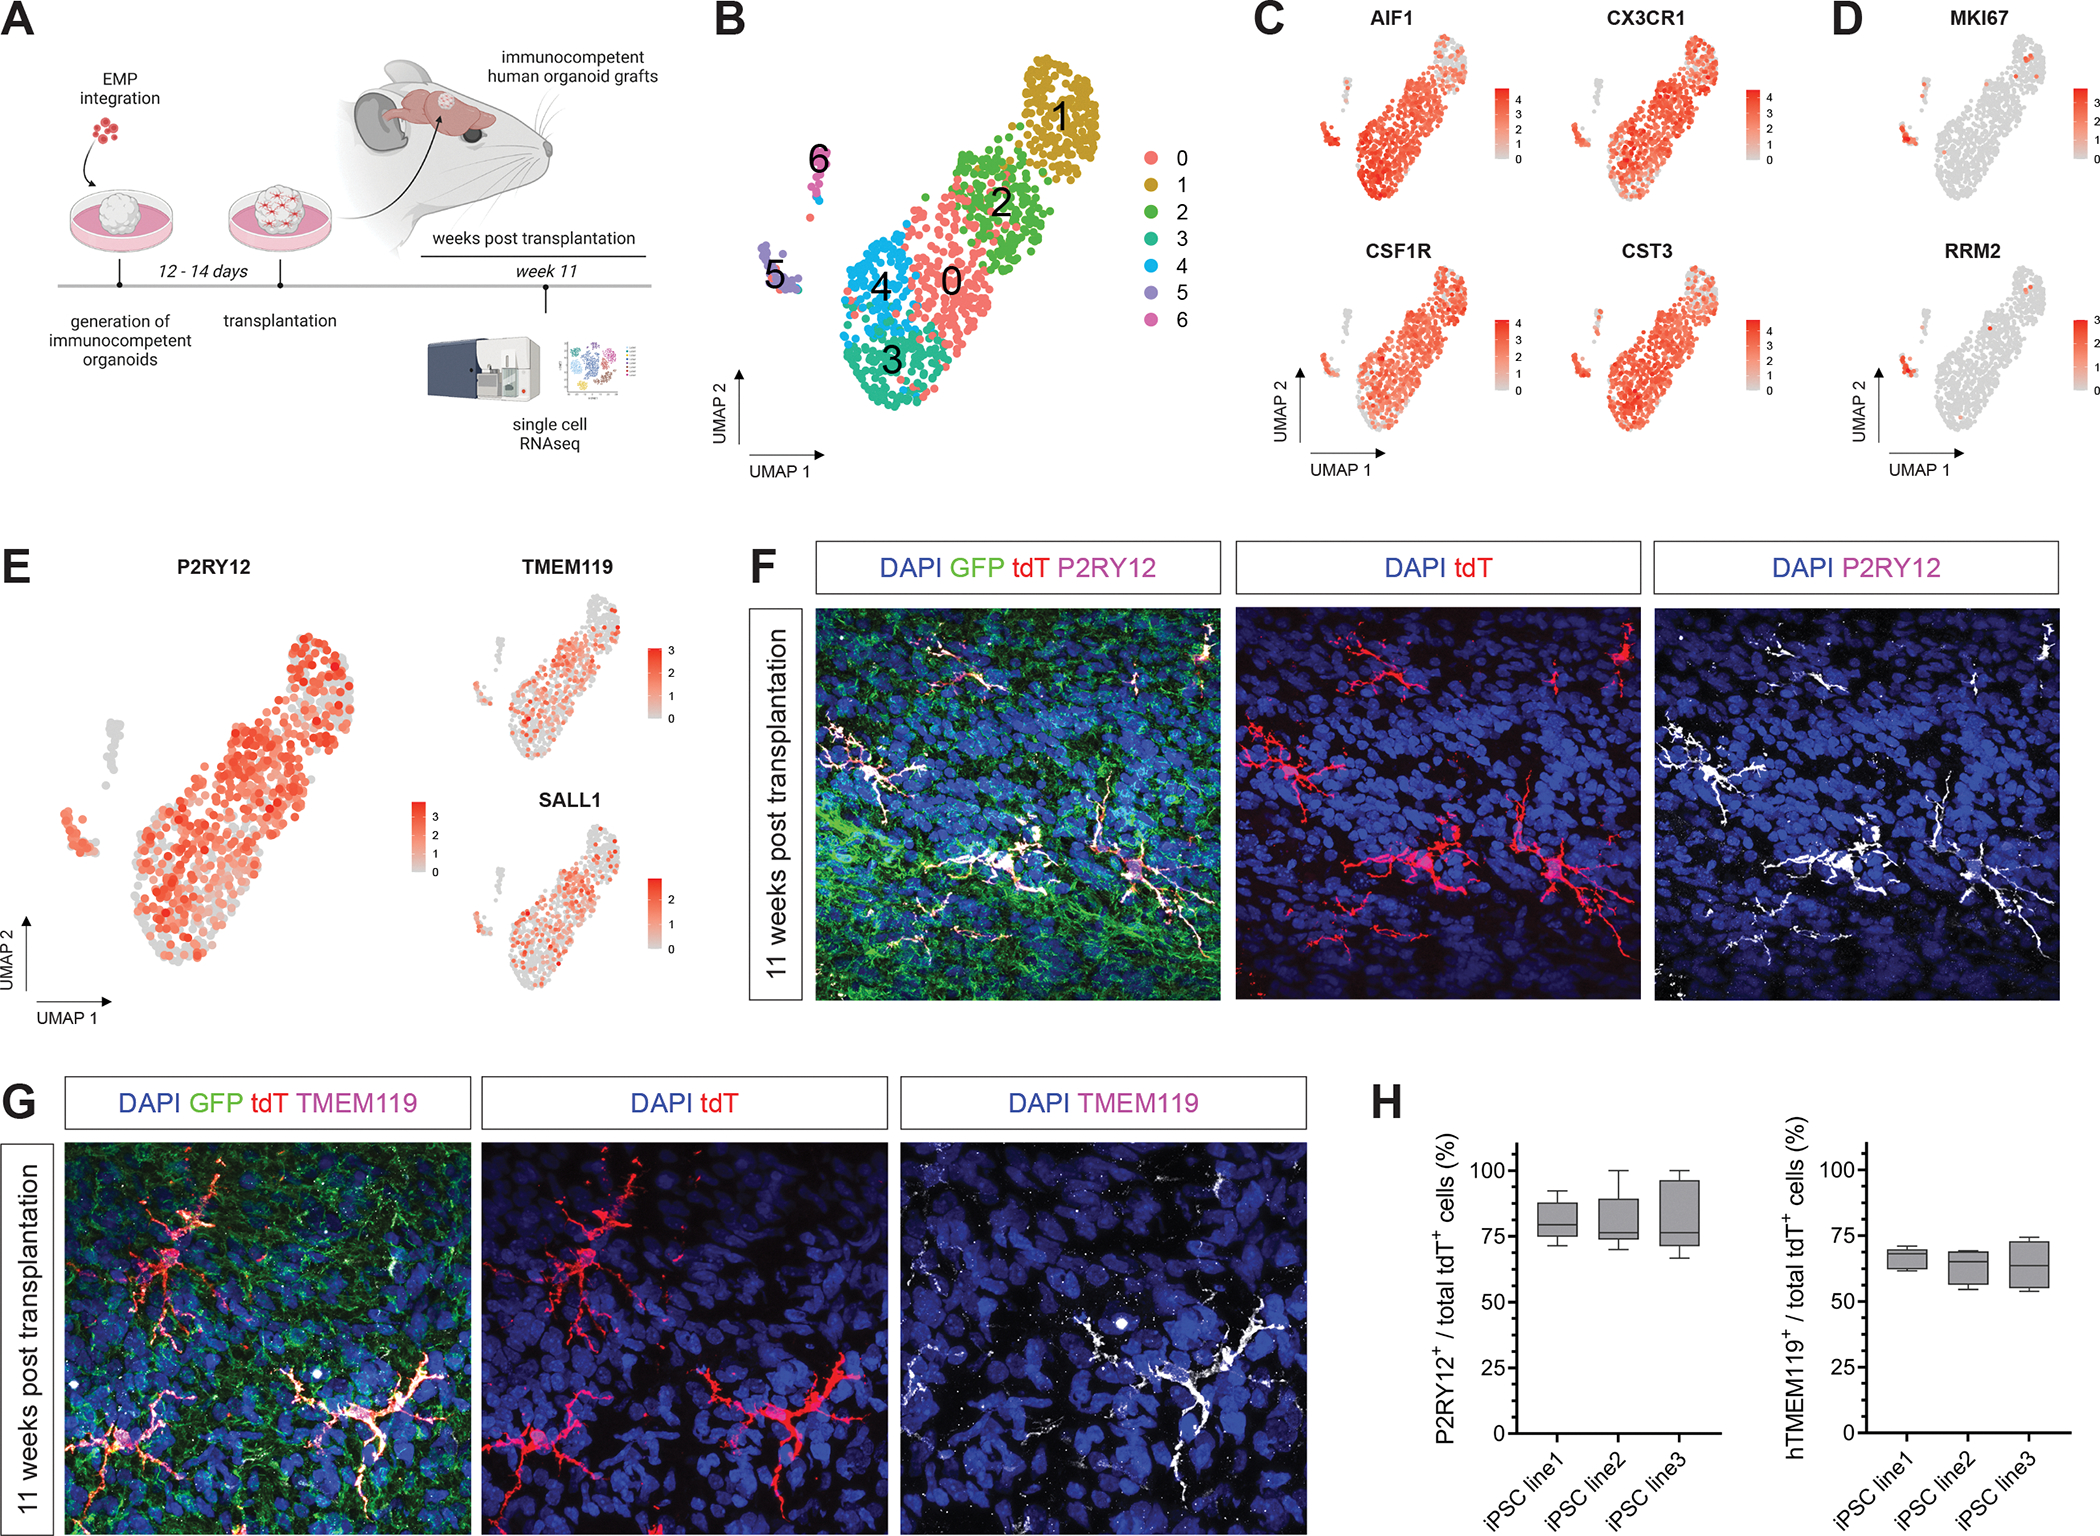
(A) Schematic showing the experimental design. EMP-containing forebrain organoids were grafted into the retro-splenial cortex of NOD/SCID mice and harvested at 11 wpt for profiling tdT+-expressing hMG using scRNAseq. (B) UMAP plot of 1,027 tdT+ cells derived from 3 independent iPSC lines profiled that passed quality selection criteria (see Figure S5). (C) Feature plots showing expression of key microglia genes AIF1, CX3CR1, CSF1R and CST3 in vivo. (D) Feature plots showing expression of proliferative marker genes MKI67 and RRM2 in vivo. (E) Feature plots showing expression of homeostatic microglia genes P2RY12, TMEM119 and SALL1 in hMG in vivo. (F) Representative confocal images of hMG expressing the homeostatic microglia marker P2RY12. Scale bar 20 μm. (G) Representative confocal images showing expression of TMEM119 by tdT+ hMG. Scale bar 20 μm. (H) Box plots showing quantifications of tdT+ cells co-expressing P2RY12 or TMEM119 at 11 wpt for 3 independent iPSC lines. See also Figure S5.
To next characterize their molecular identity in vivo, we isolated tdT+/hCD45+ hMG from 3 independent iPSC-derived iHBO models using FACS and performed scRNAseq (Figure 2A and Figure S5A). A total of 1,027 tdT+ cells derived from 3 independent iPSC lines were analyzed at 11 wpt and embedded in nearest neighbor space using UMAP. We detected 6 molecularly distinct microglia states using Louvain clustering (Figure 2B). Nearly all isolated hMG in all clusters expressed the canonical microglia markers AIF1, CX3CR1, CSF1R and CST3 (Figure 2C). Cells in cluster 5 expressed high levels of genes involved in cell cycle progression, including MKI67 and RRM2 (Figure 2D); this finding indicated the presence of a proliferative microglia subpopulation, consistent with a proliferative population observed in human fetal brain 31. In addition, a large proportion of cells in clusters 0, 1, 2, 3, 4 and 5 showed high expression of the mature homeostatic microglia markers P2RY12, TMEM119 and SALL1 (Figure 2E), consistent among all lines profiled (Figure S5B and C). To verify our scRNAseq data on the protein level, we performed immunohistochemistry analysis of hMG at the same time point. In line with the transcriptomic data, immunohistochemistry revealed that, at 11 wpt, a large fraction of hMG expressed P2RY12 and hTMEM119 (Figure 2F–H), confirming the emergence of mature homeostatic human microglia in vivo.
Transplantation prevents a non-physiological activation of hMG
Given the important role of the CSF-1 receptor (CSF-1R) for microglia development, we next explored whether transplantation indeed facilitated endogenous expression of its ligands IL34 and CSF-1 in vivo. Bulk RNA-sequencing performed on GFP+ brain organoids generated in the absence of hMG allowed us to chart the transcriptome-wide changes that occurred in brain organoids following transplantation (Figure 3A). We observed a progressive maturational shift between 4 and 24 wpt, which corresponded well with the transition from early fetal to late prenatal/early postnatal stages of human brain development. This was determined by measuring the transcriptome-wide similarity to the Brain Span40 dataset (Figure 3B). In line with this finding, upper layer markers such as SATB2 as well as markers that indicate the presence of mature astrocytes progressively increased over time in vivo (Figure 3C). As expected, high levels of both IL34 and CSF1 gene expression were detected in organoids following transplantation, whereas IL34 could not be detected in age-matched brain organoids in vitro (Figure 3C and S6A). These observations confirm that transplanted brain organoids provide a permissive in vivo environment to support human microglia development. To further explore the molecular changes that hamper the transition to a mature homeostatic state in vitro, we assessed the integrated human microglial cells at a time point before the massive cell loss was observed under the in vitro condition (see Figure S3). We isolated tdT+ hMG at 6 wpt from vascularized cortical organoids in vivo and compared them to their cellular correlates in brain organoids in vitro (Figure S6B). We analyzed a total of 1,866 tdT+ cells from 2 different batches of organoids from each condition (in vivo vs in vitro) and integrated the combined datasets into nearest neighbor space (Figure S6C). We detected 12 molecularly distinct cell states using Louvain clustering (Figure S6D). Almost all profiled cells showed high expression of the canonical myeloid marker AIF1, independent of the experimental condition (Figure S6E). Among the 12 clusters detected, cluster 0 appeared almost exclusively confined to the in vitro condition, whereas the presence of cluster 10 seemed to be driven by the in vivo environment (Figure S6F). Differential expression analysis revealed a significant upregulation of genes such as MIF, CD52, PLIN2 and BCL2A1 in cluster 0 (Figure S6G and H). Genes upregulated in this cluster showed significant enrichment in processes that control immune cell activation, apoptosis and cellular stress responses (Figure S6I). Interestingly, cellular activation and stress signatures present under the in vitro condition were absent from the in vivo condition (Figure S6J), confirming our previous observation that microglia grown in organoids under current in vitro conditions were reacting to an unfavorable stress-inducing environment. Cluster 10, which was exclusively confined to the in vivo environment, showed marked upregulation of specific homeostatic microglia genes such as P2RY12, CSF3R, CSF1R, ITGAV and SELPLG (Figure S6K). To confirm our findings, we used immunohistochemistry to directly compare iHBO-resident hMG in vivo to their in vitro correlates. While iHBO-resident hMG showed a marked gain of process complexity at 11 wpt in vivo, microglia-like cells in organoids in vitro failed to undergo this distinct morphological transition at corresponding time points (Figure 3D and E). In addition, P2RY12 and TMEM119, which were expressed by more than 75% and 70% of hMG at 11 wpt in vivo, respectively, were not detected in tdT+ cells at corresponding time points in vitro (Figure 3F and G). Together with the upregulation of CSF-1R ligands following transplantation, these findings confirm that the human brain-like in vivo environment is sufficient to support human microglia development.
Figure 3. Transplanted organoids support the development of a homeostatic microglia state in vivo.

(A) Schematic showing the experimental design. GFP+ forebrain organoids were transplanted at day 38 and profiled using bulk RNA-seq before (day 38) and after transplantation (4 and 24 wpt). (B) Heatmap showing Spearman correlations of the entire transcriptome of transplanted and non-transplanted organoid samples to the human Brain Span dataset. (C) Heatmaps showing expression of neuronal marker genes (SATB2, TBR1), astrocyte marker genes (S100B, EAAT1) and microglia-supporting factors IL34 and CSF1; TPM – Transcripts per million. (D) Morphometric comparisons between hMG in vivo at 11 wpt and their cellular correlates that developed in brain organoids in vitro. Scale bars 50 μm. Comparisons were performed using 3 independent iPSC lines for each condition. (E) Box plots showing percentages of tdT+ cells featuring ramified morphologies at 11 wpt in vivo as compared to in vitro. Comparisons were performed using 3 independent iPSC lines for each condition. Mann-Whitney U test (***P = 0.007). (F) Representative confocal images of tdT+ cells co-expressing P2RY12 at 11 wpt in vivo and in vitro. Scale bar 50 μm. (G) Box plots showing percentages of tdT+ co-expressing P2RY12 or TMEM119 at 11 wpt in vivo and in vitro. Comparisons were performed using 3 independent iPSC lines for each condition. Mann-Whitney U test (P2RY12: ****P < 0.0001; TMEM119: **P = 0.0043). See also Figure S6.
hMG follow defined developmental trajectories and acquire human brain environment-specific signatures
To further dissect the step-wise acquisition of human microglia identity in our in vivo system, we profiled tdT+ hMGs at multiple time points post transplantation using scRNAseq (Figure 4A). A total of 4,322 cells from 7 animals and 3 time points (6, 11 and 24 wpt) were analyzed and embedded in nearest neighbor space using UMAP (Figure 4B). The ex vivo isolation procedure 12 yielded IBA1-expressing microglia that showed almost no expression of the acute proinflammatory cytokine TNF or IL6 and the anti-inflammatory cytokine IL10, which are associated with longer-lasting inflammatory responses at any of the time points assessed (Figure S7A). We detected 11 molecularly distinct types of cells using Louvain clustering (Figure S7B). Trajectory interference analysis revealed distinct developmental trajectories and the pseudo-temporal ordering of the cells aligned well with the developmental age of the isolated hMG represented in the UMAP plot (Figure 4C). Mapping the changes represented in the pseudo-temporal signature to various mouse microglia states 41 showed a strong correspondence of Trajectory 3 to pre and early states of microglia, whereas Trajectories 1 and 2 clearly shifted towards adult microglial states (Figure 4D). In line with these observations, genes that are significantly changing during human fetal microglia development 31,35,42 showed significant overlap with our pseudo-temporal signature genes (Figure 4E), among them CSF1R, C1QB and C3 (Figure S7C, D and E). Interestingly, the signature of cluster 7 as an endpoint for Trajectory 3 corresponded to a highly proliferative microglia subpopulation (Figure S7F) recently reported in human fetal brain tissue 31. From 6 to 24 wpt, a clear decrease in the proportion of cells contributing to this proliferative cluster became apparent (Figure S7G). To further assess how closely hMG recapitulated human microglia development, we aligned our scRNAseq data to a recently published reference dataset that profiled human microglia development from 9 to 18 gestational weeks 31. Using a unified integration strategy for reference assembly 43 allowed us to identify the cell pairwise correspondences between single cells across the 2 datasets. The characteristic developmental transition towards an adult-like homeostatic and immune-sensing microglial state observed in the human dataset was highly preserved in our hMG (Figure 4F and G). In line with this, differential gene expression analysis between the 3 developmental time points profiled (6, 11 and 24wpt) revealed a highly significant and continuous upregulation of homeostatic and microglia-specific sensome genes 44 such as CX3CR1, P2RY12, SLCOB2C1, TMEM119 as well as TLR4 (Figure 4H–J and Figure S7H). The specific upregulation of P2Y12, TMEM119 and SALL1 was also observed on the protein level (Figure S7I–L). Strikingly and in line with the specific upregulation of the microglia sensome, hMG gained human brain environment-dependent gene expression programs 12 between 11 and 24 wpt (Figure 4K). Additional reference mapping of hMG at 24 wpt to a well-characterized dataset 45 demonstrated a high level of transcriptomic similarity to adult human microglia isolated ex vivo (Figure S8A–E).
Figure 4. Human microglia follow defined developmental trajectories and acquire human brain environment-dependent signatures in vivo.
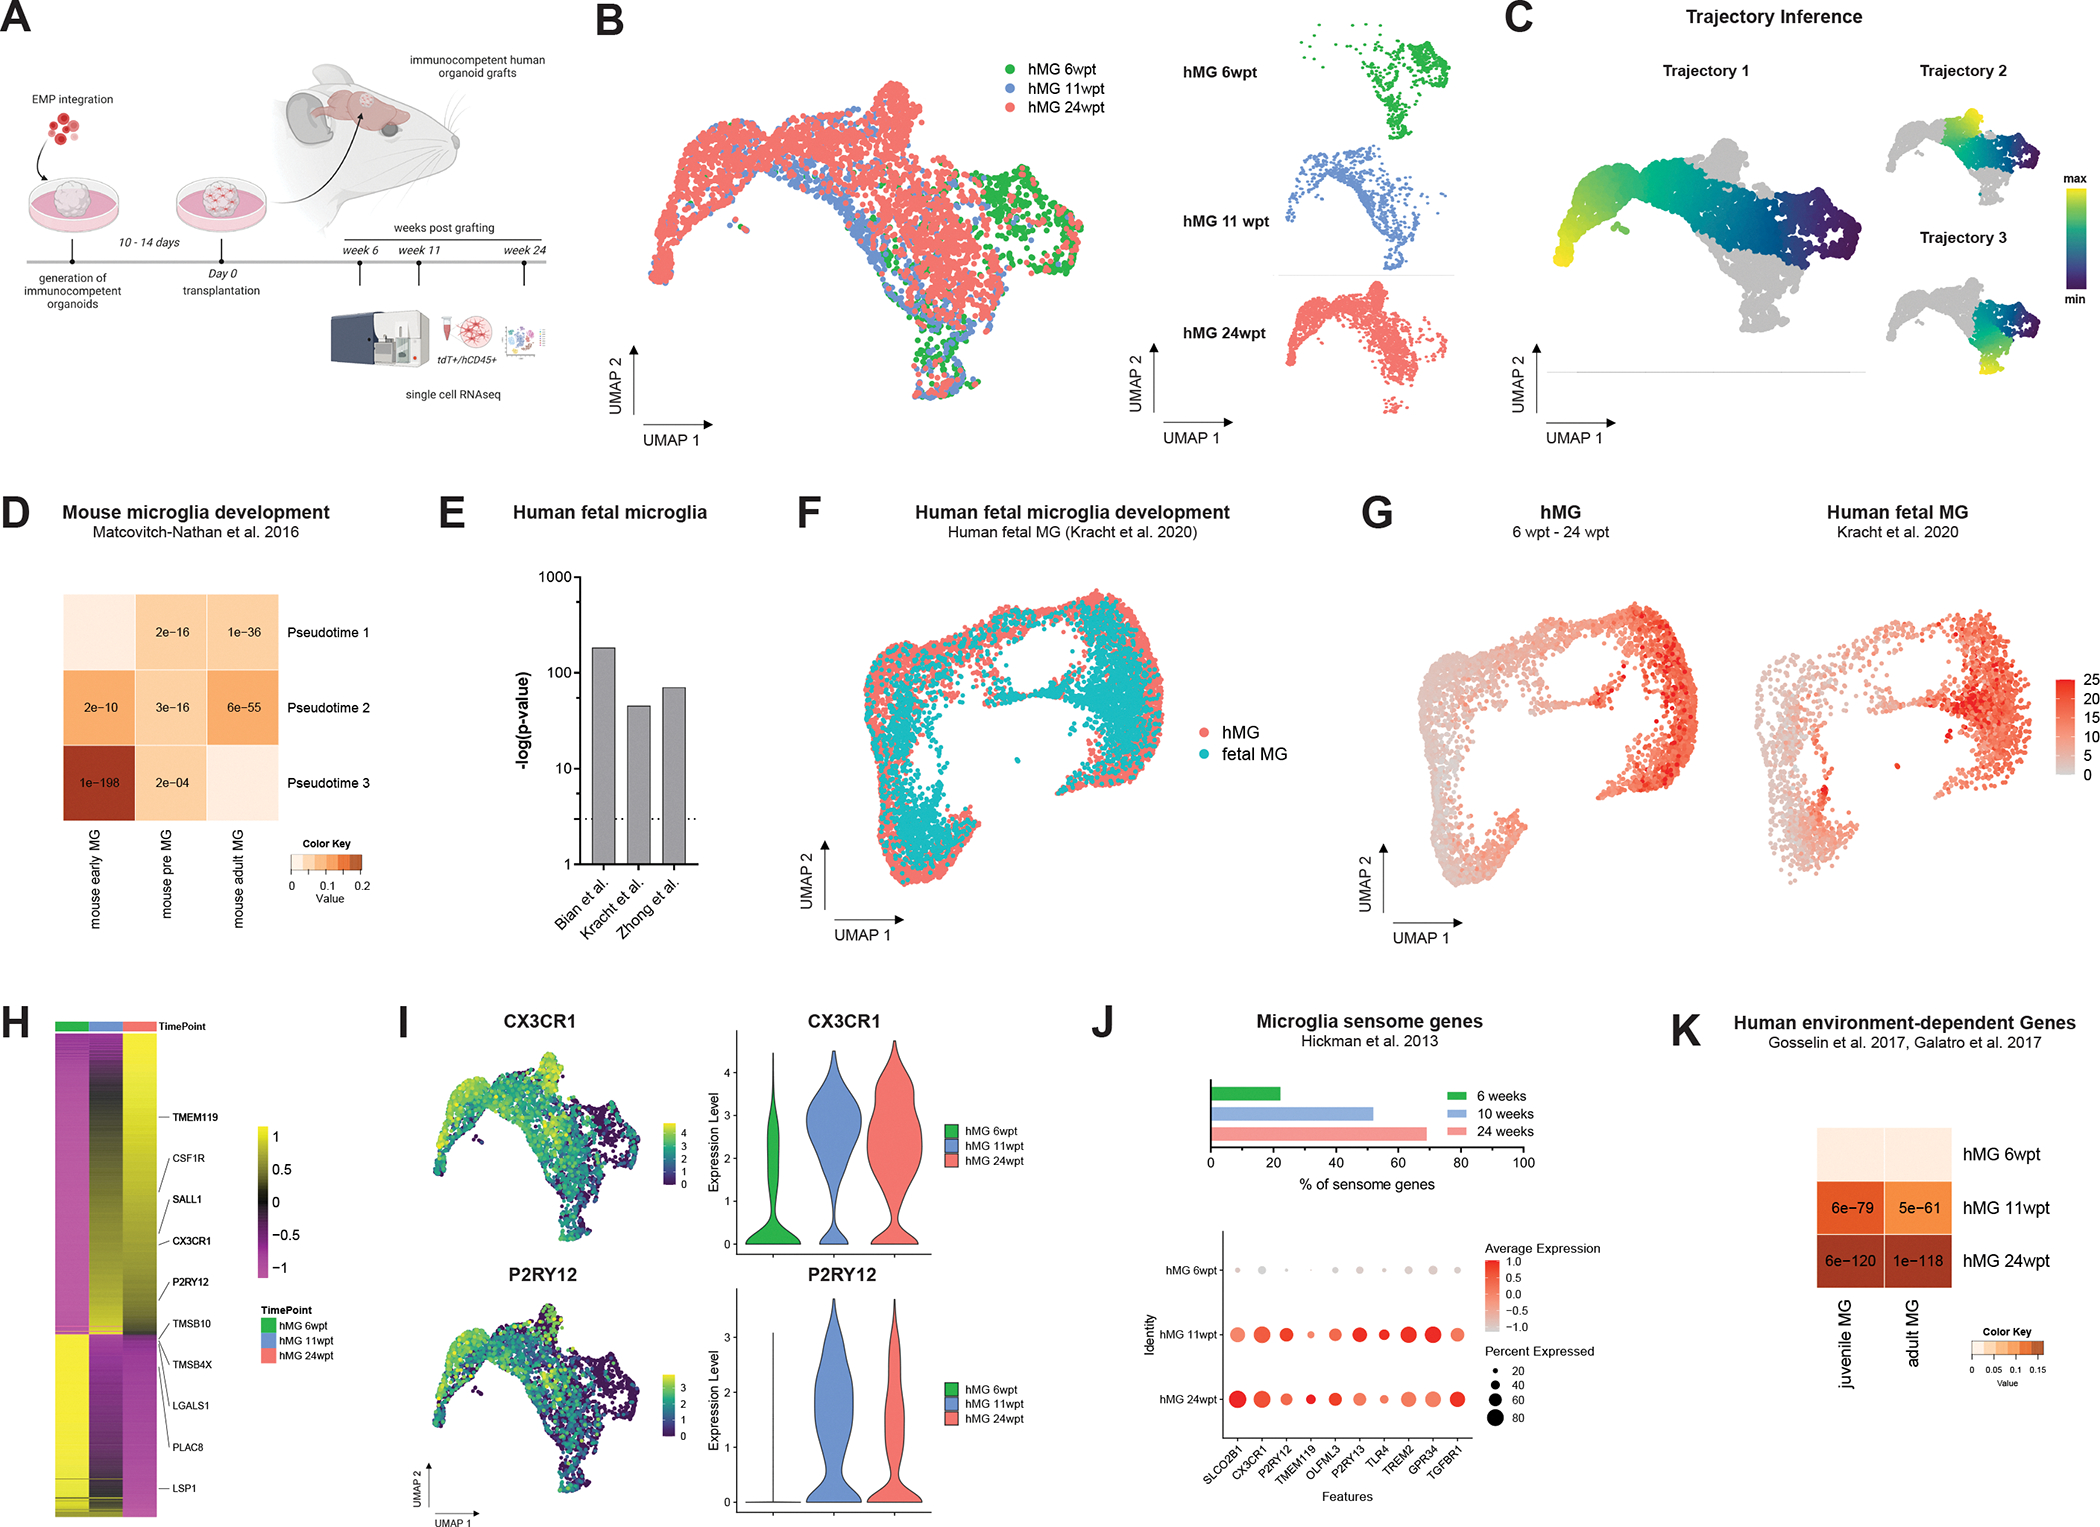
(A) Schematic showing the experimental design. Following EMP colonization, neuro-immune organoids were transplanted into immunocompromised mice, harvested at 6, 11 and 24 weeks post transplantation (wpt) using FACS and subsequently processed for scRNAseq. (B) UMAP plot of 4,322 tdT+ cells from a total of 7 animals at 3 time points profiled that passed quality selection criteria; n6wpt=2, n11wpt=3 and n24wpt=2. (C) Trajectory interference identifies 3 cellular trajectories that reflect a transition from early to late time points during hMG development. (D) Heatmap showing significant overlap of pseudo-temporal genes with microglial genes that change during mouse microglia development 41 (E) Pseudo-temporal genes show significant overlap with genes that define human fetal microglia development 31,35,42. (F) UMAP plot showing integrative analysis of fetal human microglia from 9 to 18 gestational weeks 31 with hMG from 6 to 24 wpt. (G) Feature plots showing the expression of a human microglia-specific gene set that defines the developmental transition to an immune-sensing microglia state. (H) Heatmap showing differentially expressed genes between 6, 11 and 24 wpt. (I) Feature and violin plots showing expression of key microglia genes CX3CR1 and P2RY12 that are upregulated during hMG development in vivo. (J) Bar plot and dot plot showing expression and relative abundance of microglia-specific sensome genes (Hickman et al.). (K) Heatmap showing acquisition of human brain environment dependent and mature human microglia signatures 12,66 between 11 to 24 wpt. See also Figure S7, S8 and S9.
To further assess to what degree the human brain environment contributes to instructing human-specific microglia identity, we compared the transcriptomic signatures gained in hPSC-derived microglia under human and mouse brain environmental conditions. Here, single cell transcriptomic profiles obtained from hPSC-derived microglia following xenotransplantation into the mouse brain (xMG) were contrasted with the transcriptomic profiles obtained from our hMG in vascularized human brain organoid grafts at 24 wpt (Figure S9A and B). We performed weighted gene co-expression network analysis (WGCNA) on the 2 datasets and identified 5 major modules of co-expressed genes (Figure S9C and D). Interestingly, the hMG-associated module MEturquiose showed a highly significant and exclusive enrichment for human-specific microglia genes 46, whereas the xMG-associated module MEblue showed a significant but weak enrichment for genes associated with both human- and mouse-specific microglia identity (Figure S9E). MEturquoise contained several hub genes previously reported to be specific to microglia from human and large mammals such as the solute carrier SLC8A1, the v-set and immunoglobin domain containing protein encoded by VSIG4 and the interleukin-1 receptor-associated kinase 3 encoded by IRAK3. In line with our analysis, these genes were highly expressed by a large fraction of hMG, but only by a few xMG at 24 wpt (Figure S9F and G). On the other hand, mouse-specific microglia genes present in the xMG-associated module MEblue such as LY6E and TPI1 were highly expressed by xMG, but almost absent from hMG (Figure S9H). These observations suggest that the human-specific microglia signature gained in our system is likely the result of the interaction between hMG and the human brain-like in vivo environment.
hMG show dynamic surveillance properties and react to local and systemic perturbations
One of the main functional properties of resting state microglia is their ability to survey their microenvironment with highly dynamic processes 47,48. To examine whether hMG recapitulated normal microglial behavior in vivo, we utilized 2-photon microscopy to visualize the tdT+ hMG in human brain organoids in vivo (Figure 5A). Time-lapse imaging of hMG at 12 wpt revealed highly ramified human cells with processes that were remarkably motile (1.76 μm/min ± 0.43) and engaged in surveying the surrounding human organoid environment by continuous extension and retraction of ramified processes (Figure 5B and Video S3). This observation is consistent with microglia function to sense their microenvironment in a resting state. Interestingly and consistent with our transcriptomic data, longitudinal assessment of hMG motility showed a slight but significant decrease in baseline motility from 6 wpt (2.22 μm/min ± 0.59) to 24 wpt (1.702 μm/min ± 0.39; Figure 5C and D). No significant difference in baseline motility was observed between the 12 wpt and 24 wpt time points (Figure 5D). Furthermore, we observed a significant increase in overall microglia density from 6 wpt to 24 wpt, with an absence of migratory cells at 24 wpt (Figure 5E). To examine if hMG are able to respond to environment-induced perturbations, we next set out to characterize microglial behavior immediately after 2-photon-induced focal laser lesions (Figure 5F). Laser-induced injury in human organoid cells elicited an immediate response in adjacent tdT+ hMG at 12 wpt, as indicated by a rapid and directional extension of processes towards the injured site (Figure 5G and Video S4), which is consistent with the previously described behavior of murine microglia 47. In line with the increase in microglia density, the average distance microglia processes traveled to reach the injury site was significantly higher at 12 wpt along with accelerated process extension rates as compared with 24 wpt (Figure 5H and Figure S10A and B). Thus, depending on when during brain development insults occur, the impact on individual microglia will be quite different. Nevertheless, despite the lower microglia density at 12 wpt, hMG were equally responsive to environmental perturbations at 12 wpt and 24 wpt (Figure S10C).
Figure 5. Human microglia show characteristic immune-sensing properties and react to local and systemic perturbations in vivo.
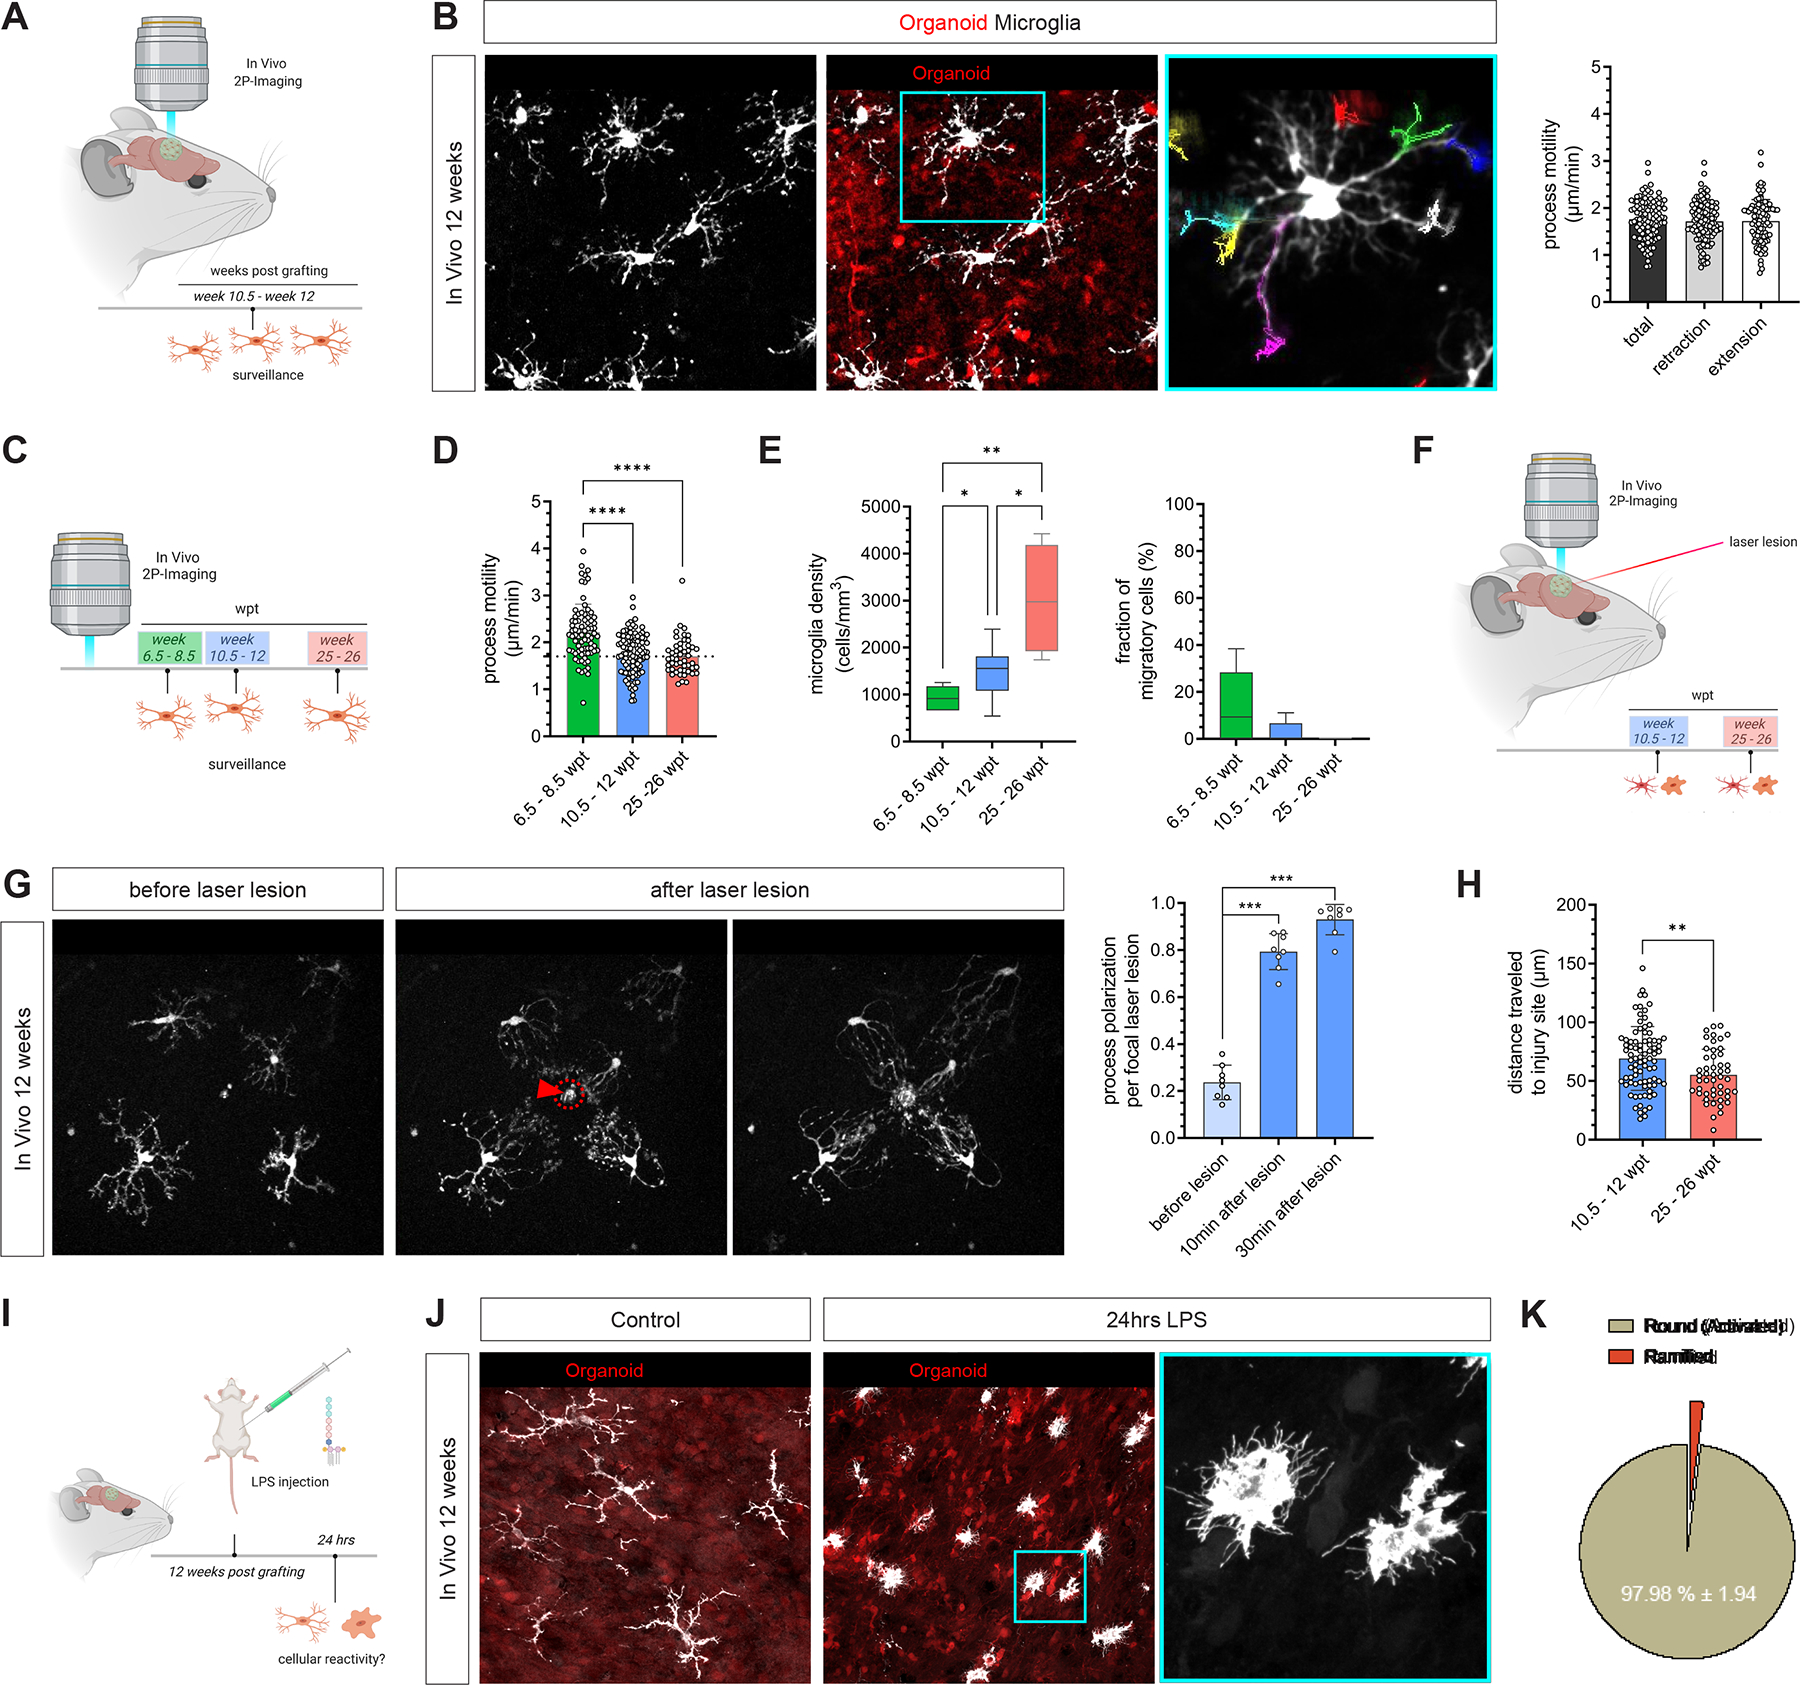
(A) Intravital imaging of tdT+ hMG was performed between 10.5 and 12 wpt to assess motility and immune-sensing properties of human microglia in vivo. (B) Representative images showing in vivo 2P-imaging of tdT+ hMG performed between 10.5 and 12 wpt in vivo. Note process motility tracking summed over a 90-min imaging interval. Bar graph shows individual process motilities quantified for n=102 processes from 3 independent animals. Scale bars 50 μm. See Video S3. (C) Schematic showing experimental design. (D) Bar graph shows individual process motilities quantified at 3 different time points. Number of processes quantified from 3 independent animals each: n6.5–8.5wpt=77, for n10.5–12wpt=102 and n25–26wpt=102. 2-way ANOVA with Tukey’s multiple comparisons test (green vs blue: ****Padj < 0.0001; green vs red: ****Padj < 0.0001 (E) Box plot showing hMG densities (left) and fraction of migratory cells (right) at the time points assessed in D. Kruskal-Wallis test (green vs blue: *q-value = 0.0289; blue vs red: *q-value = 0.0289, green vs red: **q-value = 0.0013). (F) Intravital imaging was performed following acute laser lesions within the human organoid grafts at 12 and 26 wpt. (G) Representative images of in vivo 2P-imaging before (left) and 10 min and 30 min following acute laser lesions (right) that were performed within the human organoid graft (arrowhead and red circle). Quantifications show process polarity indices before as well as 10 min and 30 min following acute laser lesions. Scale bar 50 μm; Mann-Whitney U test (10 min: ***P = 0.0002, 30 min: ***P = 0.0002). See Video S4. (H) Box plot showing measurements of distances travelled per process to the injury site at 12 and 26 wpt; Mann-Whitney U test (**P = 0.0056). (I) Schematic showing the experimental design. Intraperitoneal injection of the Gram-negative bacterial endotoxin lipopolysaccharide (LPS) at a concentration of 5 mg/kg was used to elicit a rapid innate immune response. Animals were harvested 24 hrs after injection to assess hMG reactivity. (J) Representative confocal images of control and LPS-challenged hMGs shows a strong cellular response to LPS. Scale bars 50 μm (left) and 25 μm (turquoise box, right). (K) Percentages of different morphological phenotypes observed within the population of hMG 24 hrs after systemic LPS administration. See also Figure S10.
We next sought to assess the ability of hMG to functionally respond to systemic inflammatory cues in vivo. Ligation of the pattern-recognition receptor TLR4 by the bacterial cell-wall endotoxin lipopolysaccharide (LPS) has been shown to activate many downstream cascades that cause a rapid immune response in microglia 49. Given the expression of microglia-specific sensome genes such as TLR4 in hMG (Figure 4J), we hypothesized that these cells were able to respond to systemically administered LPS in a dose-dependent manner. To test this hypothesis, we used intraperitoneal injection of LPS (1 or 5 mg/kg) to elicit a rapid innate immune response at 12 wpt in vivo (Figure 5I). We observed a shift in hMG morphology 24 hrs after high-dose LPS injection as evidenced by rounded morphologies, an absence of characteristic primary processes and a large number of filopodia extending from their soma (Figure 5J and K). As expected, lower doses of LPS elicited a less profound morphological change (Figure S10D). In line with our transcriptomic analysis, these experiments confirmed the presence of human homeostatic and immune-sensing microglia that fulfilled characteristic surveillance functions and reacted to environment-induced perturbations and systemic inflammatory cues. Our model allowed us to obtain functional hMG that operated within a human brain-like environment, thereby enabling us to investigate human-specific microglia functions under both physiological and pathological conditions in vivo.
A patient-specific model reveals a brain environment-induced immune response in ASD
One advantage that this transplanted iHBO model offers is the ability to study human-specific diseases using isogenic patient lines by following the outcome of microglia-brain cross-talk during development. Given that hMG acquire immune-sensing properties (Figure 4 and 5), we sought to determine if this model could be used to investigate human brain-microglia interactions in the context of a neurodevelopmental disorder. Using a clinically well-stratified cohort of subjects with ASD and macrocephaly, we recently showed that alterations in cortical brain development emerged at prenatal-equivalent periods 50. To establish a patient-specific iHBO model, we first generated isogenic GFP− and tdT-expressing iPSCs from 3 ASD subjects and 3 neurotypical controls in order to label subject-derived cortical organoids (GFP) and hMG (tdT), respectively. We then generated GFP+ cortical organoids and tdT+ EMPs from these iPSC lines and, following integration, transplanted the iHBO models into the retrosplenial cortex of NOD/SCID mice. Following 12 weeks in vivo, transplanted iHBOs generated from 3 independent, ASD subject-derived iPSC lines showed a marked gain of hMG with an overabundance of filopodia emerging from the cell soma, which occurred at the expense of characteristic resting states compared to neurotypical controls (Figure 6A and B). Morphological assessment revealed that ASD subject-derived hMG featured a significantly increased soma size, a marked increase in primary process thickness and a significantly increased number of filopodia emerging from the processes (Figure 6C and S10E). These morphological changes have been associated with a primed and reactive microglia phenotype 5,7,37. A reactive microglia phenotype was absent in iHBO models derived from the 3 independent control iPSC lines (Figure 6A–C). To assess if the hMG phenotype observed in ASD-subject-derived iHBOs was indeed induced by the altered neuronal environment – and not by an intrinsic microglia genetic predisposition – we generated ASD and control subject-specific iHBO models from all subjects that harbored neurotypical hMGs derived from an unaffected control iPSC line (Figure 6D). Using this approach revealed that the neurotypical hMGs responded to the ASD-associated brain environment but not to any of the control brain environments (Figure 6E and F), suggesting that the morphological changes observed in ASD microglia were indeed driven by changes in the developing human brain environment. Taken together, our iHBO model allowed us to investigate human disease-associated microglia phenotypes and provided the first experimental evidence for a brain environment-induced immune response in autism with macrocephaly.
Figure 6: Generation of human patient-specific models reveals a brain environment-induced immune response in ASD with macrocephaly.
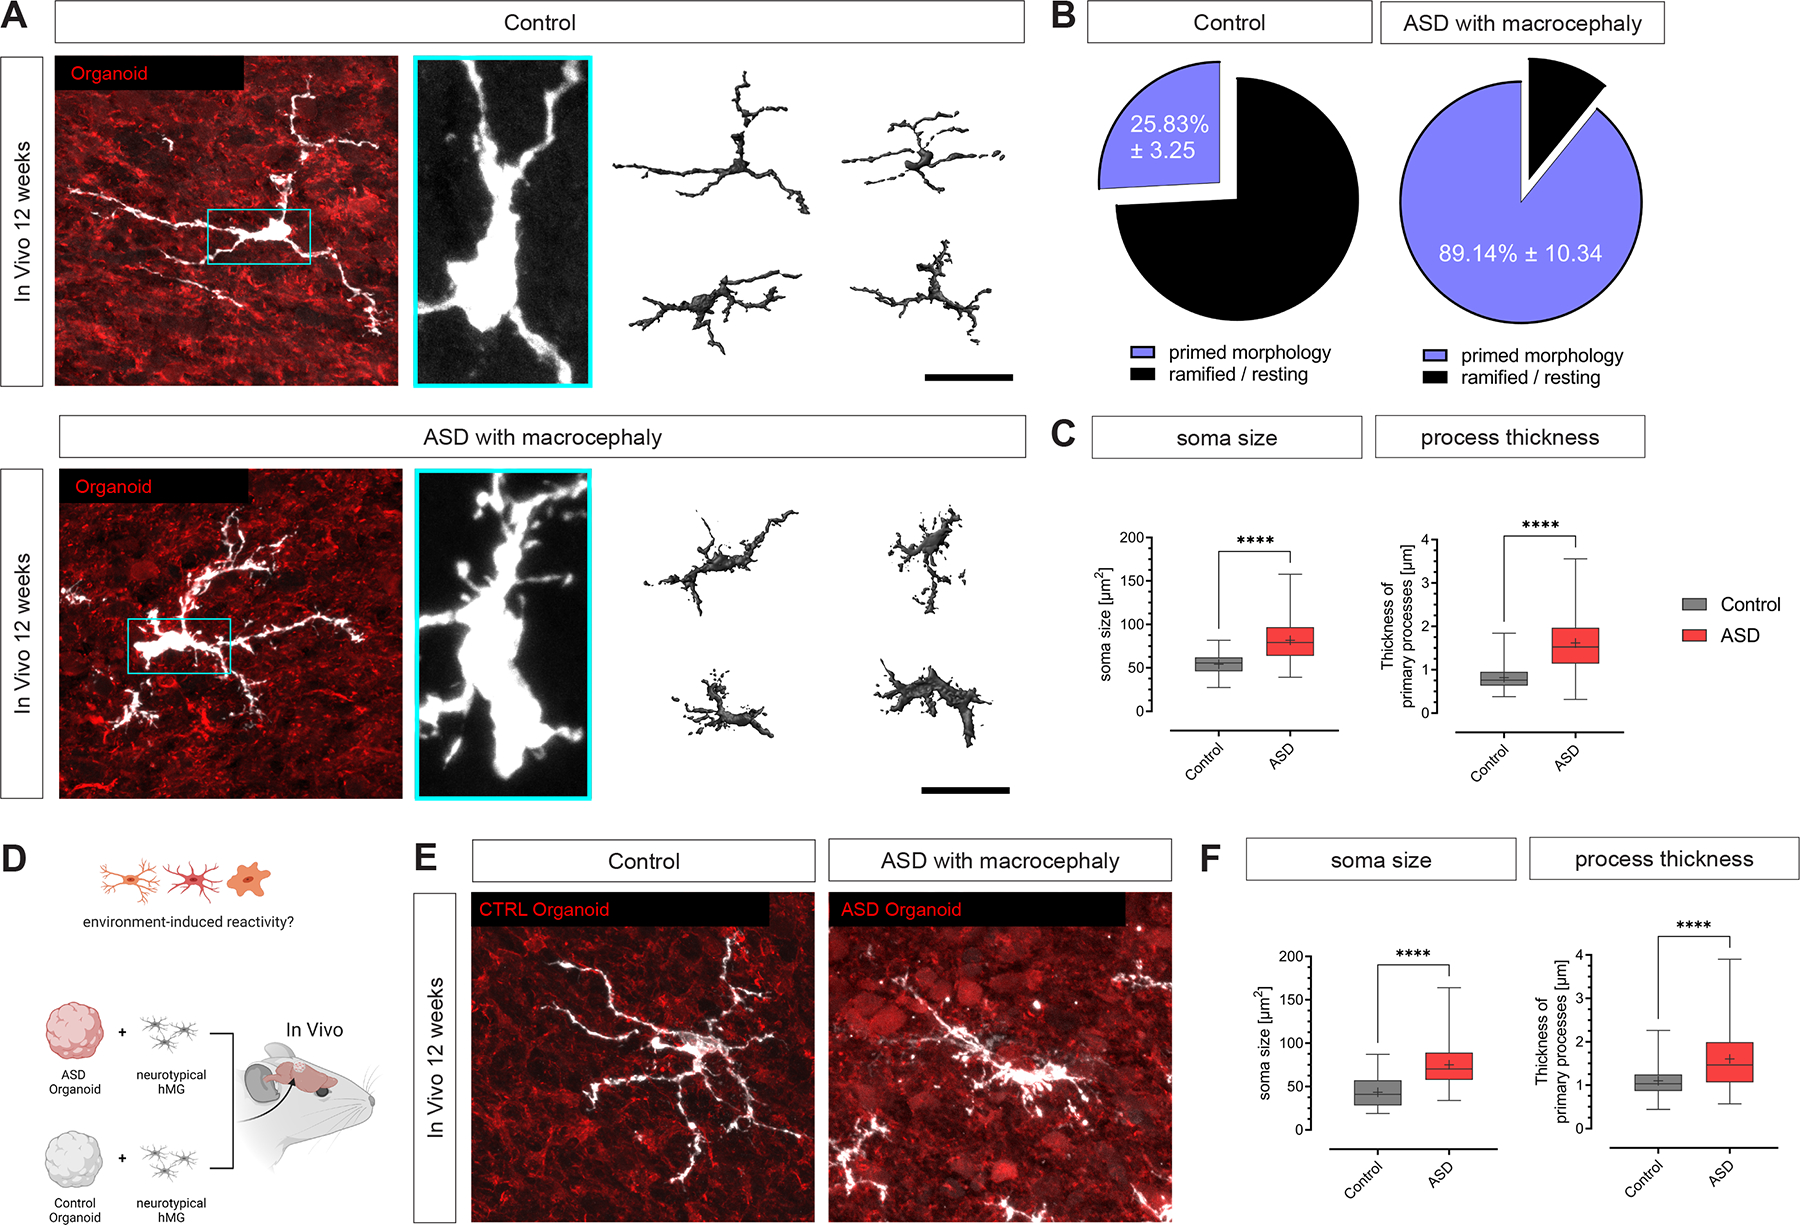
(A) Representative confocal images showing hMGs from ASD and control subjects at 12 wpt. Scale bars 50 μm (left) and 10 μm (right). The 3D reconstructions depicting different microglia morphologies observed in ASD and control samples were generated using Imaris. Scale bar 50 μm. (B) Pie charts showing relative abundance of microglia with and without somal filopodia. Values indicate mean ± SD; nControl=3 independent neurotypical control lines; nASD=3 independent patient lines. (C) Box plots showing quantifications of soma size, primary process thickness and filopodia density of control and ASD hMGs at 12 wpt. Box plots show median (center line), mean (‘+’) and interquartile range (IQR), with whiskers representing the minimum and the maximum; nControl=3 independent neurotypical control lines with a total of 71 cells; nASD=3 independent patient lines with a total of 74 cells. Mann-Whitney U test (soma size: ****P < 0.0001, process thickness: ****P < 0.0001). (D) Schematic illustrating the experimental design for generating heterogenic neuroimmune models harboring ‘sensor’ hMG. (E) Representative confocal images of ‘sensor’ hMG in ASD and control organoids in vivo at 12 wpt. Scale bar 25 μm. (F) Box plots showing quantifications of soma size and primary process thickness of ‘sensor’ hMG in ASD and control organoids in vivo at 12 wpt; nControl=3 independent neurotypical control lines. Box plots show median (center line), mean (‘+’) and interquartile range (IQR), with whiskers representing the minimum and the maximum; Mann-Whitney U test (soma size: ****P < 0.0001, process thickness: ****P < 0.0001). See also Figure S10.
Discussion
We developed a novel approach that capitalizes on an organoid xenotransplantation paradigm that allowed us to study functional human microglia inside a human brain-like environment. Our xenotransplantation paradigm takes advantage of an intracerebral transplantation technique originally developed for transplanting fetal or adult tissue into the rodent brain 51–53, allowing sufficient infiltration of transplanted brain organoids with a vasculature system from the host 30. Recent studies that performed similar organoid transplantation experiments in mice 54 and rats 55 demonstrated that the cellular and molecular state of maturity was enhanced as compared to in vitro organoids. The transplanted iHBO models developed here harbored human microglia that survived over long periods of time and expressed homeostatic, microglia-specific markers, including P2RY12, TMEM119 and SALL1. Temporal transcriptomic profiling revealed that hMG followed defined developmental trajectories, acquired immune-sensing properties and gained uniquely human-specific transcriptomic signatures that closely resembled their in vivo counterparts. Functional analysis showed that the incorporated hMG fulfilled characteristic surveillance functions, were capable of reacting to injuries induced in the human brain-like environment and responded to systemic inflammatory cues. Thus, we established a model system that allowed us to obtain functional human microglia that operated within a human brain-like in vivo environment.
The brain environment is instrumental in sustaining and orchestrating microglia identity 13. Previous experiments in mouse and human have shown that microglia grown in isolation assume a non-physiological, partially activated state, which is reflected by a dramatic shift in their gene expression profile and epigenetic landscape 11,12. Brain organoids recapitulate some features of the brain’s 3D structure and contain multiple cell types derived from the neuroectodermal lineage 17,56,57. Due to the contribution of different developmental lineages, generating microglia-containing organoids using guided approaches is a very challenging task. Protocols for the in vitro differentiation of microglia-like cells from hPSCs have only recently become available 18–23, and they afford the possibility of developing novel strategies to integrate PSC-derived microglial cells into brain organoids and 3D culture systems. Short-term co-culture experiments demonstrated that the incorporation of differentiated iPSC-derived microglia-like cells into organoids appears feasible 24,18,25,21,23. In addition, cerebral organoids generated through unguided approaches can spontaneously and intrinsically develop microglia-like cells that likely emerge from mesodermal contributions within these structures 58. However, the extent to which these in vitro structures support maturation and long-term survival and whether the integrated cells ultimately acquire a state that fully resembles the identity of their in vivo counterparts remain unknown. Recent attempts to reinstate microglial identity were achieved through xenotransplantation of human hPSC-derived microglia into transgenic immunocompromised mouse models 26–28. Although advancements have been made to allow the study of human microglia in isolation, protocols that allow us to faithfully model their interaction with a human brain environment are still lacking.
Yolk sac-derived EMPs are presumed to enter the brain between gestational weeks 4.5 and 5.5 in humans 1,2. Adapting a protocol to generate hPSC-derived EMPs allowed us to model microglial cell entry into human forebrain organoids (Figure 1). Interestingly, we found that one level of variability in generating such immunocompetent organoid models is the timing of co-culture, as age and structural composition may impact the ability of EMPs to enter the developing organoid structures (Figure S1). Over short periods of time, EMPs efficiently colonize human forebrain-specific organoid models and differentiate into primitive microglia-like cells, showing primitive ramified-like morphologies and expressing myeloid-specific markers such as IBA1. However, long-term differentiation appeared severely hampered in vitro, as indicated by a progressive loss of incorporated cells, cellular activation and expression of activation and stress-induced genes. In line with the absence of environment-specific factors such as TMEM119 and P2RY12, these findings highlight that, to allow faithful modelling of human microglia-brain interactions, a supporting brain environment that more closely resembles the situation found in vivo may be required.
Previous work has shown that human brain environmental factors are instrumental for inducing the program of microglia-specific gene expression 12,14. While xenotransplantation of human microglia into a mouse brain can reinstate some aspects specific to their in vivo identity 26–29, a complete gain of human-specific features and the recapitulation of human brain environment-dependent phenotypes, especially in the context of human diseases, has yet to be demonstrated. In fact, sustained survival of human microglia within the mouse brain requires transgenic expression of human CSF-1 or IL34, because previous studies have shown that the incorporated human cells are not adequately supported by mouse CSF-1 26–29. In line with this finding, patterns of gene expression differ significantly between microglia from larger mammals, including humans, and those from mice 12,46. While core microglia programs are preserved across different species, some of the species-specific differences appear to pertain to factors that are implicated in human-specific disorders 46.
It is important to note that the vascularized human organoid graft was sufficient to support sustained survival of hMG over long periods of time and in the absence of exogenously supplied human CSF-1, as the host mice in our system were not humanized for CSF-1. In addition, the CSF-1R ligands IL34 and CSF-1 were markedly upregulated following transplantation. These findings confirm that, within its boundaries, the human organoid graft provides enough CSF-1/IL34 to ensure sustained survival and differentiation of human microglia. More importantly, the iHBO-resident microglia showed a highly specific induction of gene expression programs uniquely associated with human microglia identity, whereas human microglia transplanted into the mouse brain (xMG) also induced patterns of gene expression that were associated with mouse microglia identity. These observations suggest that some of the differences in gene expression patterns are due to differences in the mouse/human brain environment. It is likely that, in the future, the system developed here will allow us to disentangle the brain environmental aspects that orchestrate human microglia identity.
Mounting evidence suggests that microglia are implicated in various disorders that affect the development or function of the human brain. Several studies have shown that children with ASD, for example, suffer from an ongoing neuroinflammatory process in different regions of the brain. This finding includes evidence from post-mortem brain 4–7 and positron emission tomography 59 that identified activated microglia and a dysregulated microglia-related gene expression signature 60,8,61,10. In addition, irregular, proinflammatory cytokine profiles and altered complement factor profiles were reported in the brain and cerebrospinal fluid of children with ASD 4,62–64. Apart from phenomenological observations in post-mortem tissue, the role and function of microglia during human brain development remains an almost entirely uncharted territory due to the lack of suitable model systems that allow the study of subject-specific, neuron-microglia interactions. One advantage that our transplanted iHBO model offers is the ability to study how systemic and local perturbations in the human brain-like environment affect human microglia cross-talk over several months of in vivo development.
Here, we report the generation of a patient-specific neuro-immune model to investigate the human brain environment - microglia crosstalk in ASD. We provide the first experimental evidence for an environment-induced cell non-autonomous shift in microglial phenotype that may indicate chronic and early emerging responses to aberrant neurodevelopmental processes. The morphological changes observed have been associated with a primed and more reactive microglial state and have previously been reported in postmortem tissue of patients with ASD 5,7,37. Importantly, our experiments revealed that these changes in microglia reactivity were induced by the environment and not by the microglia themselves. Given the sex-specific differences reported for ASD65, further studies are needed to elucidate how gender differences in the human and/or host brain environment contribute to this phenotype. The novel platform developed here will provide the unique opportunity to model the functional interaction of human microglia with their human neuronal environment, thus rendering it a highly suitable technology for unmasking the role of context-dependent human microglia phenotypes during development and disease.
Limitations of the Study
This platform has several advantages in comparison to previous studies that have transplanted organoids into the rodent brain 30,54,55 as it features an organoid-resident population of functional human microglia – a cell type that is lacking from current organoid systems. Transplantation strategies can provide an alternative tool for investigating human-specific neuro-immune interactions under in vivo-like conditions. While our new technology allowed us to reveal new insights on the control of microglia phenotypes in ASD disease development, the group size analyzed is still limited and further studies are needed. Furthermore, concerns about the contribution of host cells to the human graft should be considered when generating these models, as they could potentially alter the system or cell type under investigation. Thus, further studies are needed to examine whether the components that make up the vasculature system in the graft are completely sourced from the host or if there is a possible contribution from human cells. Forward engineering of ever more sophisticated human organoid models will provide a path towards investigating the interaction between human non-neuronal and neural cells under in vivo-like conditions.
STAR Methods
EXPERIMENTAL MODEL AND SUBJECT DETAILS
Maintenance of hESC and iPSC lines and generation of fluorescent reporter lines
The protocol for the use of human embryonic stem cell lines (H1 ESC, WiCell) as well as human induced pluripotent stem cell (iPSC) lines for this study was approved by Salk Institute’s IRB Committee (FWA 00005316) and the Embryonic Stem Cell Research and Oversight Committee. The Salk Institute is committed to protecting the rights and welfare of human research participants and ensures compliance with all applicable ethical and legal requirements. The iPSC lines used in this study have previously been described 50 and were reprogrammed in the same facility (Salk Institute for Biological Studies, Laboratory of Genetics) and under the same conditions. Briefly, fibroblasts were transduced with retroviruses containing SOX2, OCT4, KLF4 and MYC to induce overexpression of these genes and were transferred to a co-culture system with murine embryonic fibroblasts. IPSC colonies were identified after around 2 weeks in this culture system, plated onto Matrigel-coated plates (BD Biosciences) and maintained in iPS-Brew media (Milteny). All cell lines were regularly tested for mycoplasma contamination. The following lines were used: H1-hESC (WA01; RRID: CVCL_9771), neurotypical control iPSC lines (iPSC line1 (Cove 3–1), iPSC line2 (Clue 4–7), iPSC line3 (Cent 3–6)) and ASD subject-derived lines (Able 3–12, Acai 1–1, Aqua 3–9) as previously described 50. To generate fluorescent reporter lines, we infected ESCs/iPSCs with LV-CAG::GFP and LV-CAG::tdT, respectively (see lentivirus production). Five days after infection, cells were isolated using FACS and re-plated on Matrigel-coated plates in iPS-Brew media (Milteny) supplemented with CloneR (Stem Cell Technologies). Upon recovery, cell lines were stocked and used for subsequent experiments.
Generation of forebrain organoids
GFP-expressing hESC or subject-derived iPSC lines were used to generate forebrain organoids as described previously with minor modifications 50,67. Human iPSC colonies were detached before reaching confluency with collagenase Type IV (Gibco) and transferred to an Ultra-Low attachment 10-cm plate (Corning Costar) containing 10 ml hPSC medium consisting of DMEM:F12 (Invitrogen), 20% Knockout Serum Replacer (Gibco), 1× Non-essential Amino Acids (Invitrogen), 1× 2-mercaptoethanol (Gibco), 1× GlutaMAX (Invitrogen), 10 ng ml−1 FGF-2 (Peprotech) and ROCK inhibitor Y27632 (10 μM). Twenty-four hours later, the medium was replaced with induction medium containing hPSC media without FGF-2, 2 μM dorsomorphin (Cayman Chemical) and 2 μM A-083 (Stemgent). At day 5 the media were replaced with neural induction medium consisting of DMEM:F12 (Invitrogen), 1× N2 Supplement (Invitrogen), 1× Non-essential Amino Acids (Invitrogen), 1× GlutaMAX (Invitrogen), 10 μg ml−1 Heparin (Tocris), 1× Penicillin/Streptomycin (Gibco), 10 μM CHIR99021 (Tocris) and 1 μM SB-431542 (Tocris). Seven days after induction, organoids were embedded in 20-μl Matrigel (Cultrex™, Bio-Techne) droplets and continued to grow for an additional week in 6 cm Ultra-Low attachment plates (Corning Costar). From day 14 onwards, organoids were cultured in differentiation medium comprising DMEM:F12 (Invitrogen), 1× N2 and B27 Supplements (Invitrogen), 1× Non-essential Amino Acids (Invitrogen), 1× GlutaMAX (Invitrogen), 1× 2-Mercaptoethanol (Gibco), 1× Penicillin/Streptomycin (Gibco) and 2.5 μg ml−1 Insulin (Sigma), and transferred to an orbital shaker (65–75 rpm). At day 20, residual Matrigel was removed and media changes were performed every 2–3 days using the aforementioned differentiation medium.
Colonization of cortical forebrain organoids through erythromyeloid progenitors (EMPs)
EMPs were generated as previously described with minor modifications 18. Briefly, hESCs/iPSCs were dissociated using TrypLE (Invitrogen) and plated in a 6-cm tissue culture-treated plate (CytoOne USA Scientific) at a density of 400,000 cells per well with 10 μM ROCK inhibitor (Stem Cell Technologies). The next day, cells were changed to basal hematopoietic differentiation media supplemented with FGF2 (50 ng ml−1, Joint Protein Central), BMP4 (50 ng ml−1, Proteintech) Activin A (12.5 ng ml−1, R&D) ROCK inhibitor (1 μM, Stem Cell Technologies) and LiCl (2mM, Sigma) and grown under hypoxic conditions (5% CO2, 5% O2). Hematopoietic differentiation media consisted of IMDM (50%, Thermo Fisher Scientific), DMEM/F12 (50%), ITSG-X, (2% v/v, Thermo Fisher Scientific), L-ascorbic acid 2-Phosphate magnesium (64 mg ml−1; Sigma), monothioglycerol (400 mM), PVA (10 mg ml−1; Sigma), Glutamax (1X, Thermo Fisher Scientific), chemically defined lipid concentrate (1X, Thermo Fisher Scientific), non-essential amino acids (NEAA, Thermo Fisher Scientific 1X), Penicillin/Streptomycin (P/S Thermo Fisher Scientific, 1% V/V). On day 2, media was changed and supplemented with FGF2 (50 ng ml−1, Joint Protein Central) and VEGF (50 ng ml−1, R&D) and returned to hypoxic conditions. Following day 4, cells were placed into norm-oxic conditions (5% CO2, 21% O2) and kept in basal hematopoietic differentiation media supplemented with FGF2 (50 ng ml−1, Joint Protein Central), VEGF (50 ng ml−1, R&D) TPO (50 ng ml−1, Proteintech), SCF (10 ng ml−1, Proteintech), IL-6 (50 ng ml−1, R&D) and IL-3 (10 ng ml−1, R&D) until colonies released hematopoietic stem cells (usually between day 14 and 16). EMPs were then isolated using Fluorescence-activated cell sorting (FACS) by gating on tdT− and CD43-FITC (Biolegend, 315204)-positive cells. Co-culture of isolated EMPs with cortical organoids was performed using the indicated numbers (see manuscript and figure legends) in the above-indicated organoid differentiation media supplemented with 25 ng ml−1 M-CSF (R&D), 100 ng ml−1 IL34 (R&D) and 50 ng ml−1 TGFβ1 (R&D).
Animals
All animal experiments described in this study were approved by the Institutional Animal Care and Use Committee (IACUC) at the Salk Institute for Biological Studies (12-00022), and the University of California San Diego (S12201), and were conducted in accordance with the National Institutes of Health’s Guide for the Care and Use of Laboratory Animals. Male and female mice were group-housed when possible with up to 5 mice per cage, under standard conditions, and kept on a 12-h light/dark cycle with ad libitum access to food and water. Immune-deficient NOD.Cg-Prkdcscid/J mice, aged 6–8 weeks, were purchased from Jackson Laboratories (JAX Stock: 001303) or were generated in our lab by breeding. In the majority of the experiments, female mice 6–10 weeks of age were used.
Transplantation of immunocompetent forebrain organoids
Only those immunocompetent organoids that passed the quality control criteria (visible VZ-like regions and expansion of the CP) and showed sufficient EMP colonization were used for subsequent experiments. Briefly, mice were anesthetized with 5% (induction) and 1–2% (maintenance) isoflurane in oxygen. Dexamethasone (2.5 mg/kg) was injected subcutaneously. Each animal was fixed in a stereotactic frame. Their body temperature was maintained at 37°C using a water-circulation heating pad (Gaymar Industries). The skin above the skull was cut with a small incision and a ~3-mm diameter craniotomy was performed by drilling into the skull. After removal of the underlying dura mater, a cavity was made by aspiration with a blunt-tip needle attached to a vacuum line. The aspirative lesion was made unilaterally in the region of the retrosplenial cortex by removing the tissue overlying the anterior colliculus. The vascular bed of the choroidal fissure was exposed and the transplant was placed on the pial vessels just caudal to the hippocampus. Sterile saline was used to irrigate the lesion and keep it free of blood throughout the surgery. Gelfoam (Pfizer) was used to slow the bleeding and absorb the excess blood. The transplanted immunocompetent organoid was placed in the lesion side and covered with a 5-mm cover slip to create a cranial window, which was sealed using adhesive glue as described previously 30,68. For in vivo imaging experiments, a custom titanium head plate was attached to the skull with dental cement. Following completion of the surgery, carprofen (5 mg/kg, i.p., 100 μl of 1 mg/ml) and buprenorphine (0.1 mg/kg, subcutaneous 100 μl 0.01 mg/ml) were administrated for analgesic relief and to prevent inflammation. The mice were then allowed to recover in a temperature-controlled cage and were returned to their home cages. Only brains with clearly identifiable GFP+ iHBO grafts (indicating graft survival) were subsequently analyzed.
METHOD DETAILS
Immunostaining
EMP-colonized in vitro organoids were harvested at the indicated time points and subjected to 3 washes with PBS using transwell inserts. Organoids were then fixed in 4% PFA in 0.1 M Phosphate buffer (PB pH 7.2–7.5) for 45 – 60 minutes at 4°C and washed 3 times in PBS, cryoprotected in 30% sucrose and embedded in TFM (tissue freezing medium; GeneralData) for subsequent cryosectioning. Twenty-μm sections were cut on a microtome, mounted on Superfrost plus slides (Thermo Fisher Scientific, Menzel-Glaser), dried at 37°C and subjected to immunofluorescence staining. For immunofluorescence, sections were rehydrated, rinsed in PBS for 5 min, permeabilized in 0.25% Triton X-100 in PBS, and blocked in Blocking solution (3% normal donkey serum in PBST) in a humidified chamber for 1 hr at room temperature (RT). Slides were then incubated with the appropriate primary antibodies diluted in blocking solution at 4°C overnight. The next day, sections were washed 3 times (5 min each) in PBST, incubated with appropriate fluorophore-conjugated secondary antibodies diluted in blocking solution at RT for 2 hrs, washed once in PBS, counter-stained with DAPI (1:5000, Thermo Fisher Scientific) for 10 min, rinsed twice in PBS and mounted with Shandon Immu-Mount (Thermo Fisher Scientific, 9990412). The antibodies used are listed in the Key Resources Table section.
KEY RESOURCES TABLE.
| REAGENT or RESOURCE | SOURCE | IDENTIFIER |
|---|---|---|
| Antibodies | ||
| Goat anti-tdTomato | MyBioSource Cat# MBS448092 | RRID:AB_2827808 |
| Rabbit anti-RFP | Rockland Cat# 600-401-379 | RRID:AB_2209751 |
| Chicken anti-GFP | Aves Labs Cat# GFP-1020 | RRID:AB_10000240 |
| Rabbit anti-GFP | Molecular Probes Cat# A-6455 | RRID:AB_221570 |
| Rabbit anti-Iba1 | FUJIFILM Wako Shibayagi Cat# 019-19741 | RRID:AB_839504 |
| Goat anti-Iba1 | Abcam Cat# ab5076 | RRID:AB_2224402 |
| Rabbit anti-TMEM119 | Abcam Cat# ab185333 | RRID:AB_2687894 |
| Rabbit anti-P2RY12 | Sigma-Aldrich Cat# HPA014518 | RRID:AB_2669027 |
| Rabbit anti-SALL1 | Abcam Cat# ab31526 | RRID:AB_2183227 |
| Rabbit anti-PU.1 | Cell Signaling Technology Cat# 2266 | RRID:AB_10692379 |
| Donkey anti-Chicken Alexa Fluor 488 | Jackson Immunoresearch Cat# 703-545-155 | RRID:AB_2340375 |
| Donkey anti-rabbit Alexa Fluor 488 | Jackson Immunoresearch Cat# 711-545-152 | RRID:AB_2313584 |
| Donkey anti-rabbit Alexa Fluor 647 | Jackson Immunoresearch Cat# 711-605-152 | RRID:AB_2492288 |
| Donkey anti-rabbit Cy3 | Jackson Immunoresearch Cat# 711-165-152 | RRID:AB_2307443 |
| Donkey anti-goat Cy3 | Jackson Immunoresearch Cat# 705-165-147 | RRID:AB_2307351 |
| Normal Donkey Serum | Jackson Immunoresearch Cat# 017-000-001 | RRID:AB_2337254 |
| FITC anti-human CD43 | BioLegend Cat# 315204 | RRID:AB_389247 |
| APC/Cyanine7 anti-human CD45 | BioLegend Cat# 304014 | RRID:AB_314402 |
| Bacterial and Virus Strains | ||
| pBOB-CAG-GFP | Addgene | Cat# 16664 |
| pBOB-CAG-tdTomato | This manuscript | N/A |
| Chemicals, Peptides, and Recombinant Proteins | ||
| StemMACSTM iPS-Brew XF, human | Miltenyi Biotec | Cat# 130-104-368 |
| Gentle Cell Dissociation Reagent | Stem Cell Tech | Cat# 100-0485 |
| N2 Supplement | Thermo Fischer | Cat# 17502048 |
| B27 Supplement | Thermo Fischer | Cat# 17504044 |
| DMEM/F12, GlutaMAX | Thermo Fischer | Cat# 10565018 |
| DMEM/F12, HEPES | Thermo Fischer | Cat# 11330032 |
| IMDM | Thermo Fischer | Cat# 12440053 |
| DMEM,high glucose,Glutamax supplement | Thermo Fischer | Cat# 10569010 |
| MEM Non-Essential Amino Acids 100x | Thermo Fischer | Cat# 11140050 |
| CloneR | Stem Cell Tech | Cat# 5889 |
| Penicillin-Streptomycin 100x (100mL) | Thermo Fischer | Cat# 15140122 |
| Glutamax supplement 100x (100ml) | Thermo Fischer | Cat# 35050061 |
| KnockOut Serum Replacement | Thermo Fischer | Cat# 10828028 |
| 2-Mercaptoethanol | Thermo Fischer | Cat# 21985023 |
| Chemically Defined Lipid Concentrate | Thermo Fischer | Cat# 11905031 |
| Insulin-Transferrin-Selenium-Ethanolamine (ITS -X) (100X) | Thermo Fischer | Cat# 51500056 |
| Insulin-Transferrin-Selenium (ITS -G) (100X) | Thermo Fischer | Cat# 41400045 |
| L-ascorbic acid 2-Phosphate magnesium | Sigma | Cat# A8960 |
| Activin-A | R&D | Cat# 338-AC |
| A-083 | Stemgent | Cat# 04-0014-10 |
| BMP-4 | Proteintech | Cat# HZ-1045 |
| CHIR-99021 | Tocris | Cat# 4423 |
| Collagenase IV | Gibco | Cat# 17104-019 |
| Dorsomorphin | Tocris | Cat# 3093 |
| DPBS + Glucose | Gibco | Cat# 14287-080 |
| Human FGF2 | Joint Protein Central | |
| Heparin | Tocris | Cat# 2812 |
| Insulin | Millipore | Cat# I9278 |
| IL-3 | R&D | Cat# 203-IL |
| IL-34 | R&D | Cat# 5265-IL |
| IL-6 | R&D | Cat# 206-IL |
| LiCl | Sigma Aldrich | Cat# L7026 |
| 1-Thioglycerol (Monothioglycerol) | Sigma Aldrich | Cat# A8960 |
| PVA | Sigma Aldrich | Cat# P8136 |
| M-CSF | R&D | Cat# 216-MC |
| Cultrex Reduced Growth Factor Basement Membrane Extract | R&D | Cat# 3433-005-01 |
| Y-27632 | Tocris | Cat# 1254 |
| SB431542 | Tocris | Cat# 1614 |
| SCF | R&D | Cat# 255-SC |
| TGF beta 1 | R&D | Cat# 240-B/CF |
| TPO | Proteintech | Cat# HZ-1248 |
| VEGF | R&D | Cat# 293-VE |
| Zombie Violet | Biolegend | Cat# 423114 |
| Human TruStain FcX | Biolegend | Cat# 422302 |
| HBSS | LifeSciencesTechnologies | Cat# 14175-095 |
| BSA | Sigma Aldrich | Cat# A3059 |
| Lipopolysaccharide | eBioscience | Cat# 00-4976-03 |
| EDTA | Invitrogen | Cat# AM9261 |
| DAPI | Thermo Fisher Scientific | Cat# 62248 |
| 1XDPBS, no Ca2+ no Mg2+ | Thermo Fisher Scientific | Cat# 14190250 |
| Triton X-100 | Sigma-Aldrich | Cat# X100-500ML |
| Paraformaldehyde, Granual | EMS | Cat# 19210 |
| Tween 20 | Fisher | Cat# BP337-500 |
| Sodium Azide | Sigma-Aldrich | Cat# S2002 |
| Deposited Data | ||
| Single cell RNA seq | This manuscript | EMBL-EBI BioStudies: E-MTAB-11522 |
| Experimental Models: Cell Lines | ||
| H1 ESC | WiCell; WA01 | RRID:CVCL_9771 |
| iPSC line1 | Schafer et al. 2019 50 | Cove 3–1 |
| iPSC line2 | Schafer et al. 2019 50 | Clue 4–7 |
| iPSC line3 | Schafer et al. 2019 50 | Cent 3–6 |
| ASD iPSC line1 | Schafer et al. 2019 50 | Able 3–12 |
| ASD iPSC line2 | Schafer et al. 2019 50 | Acai 1–1 |
| ASD iPSC line3 | Schafer et al. 2019 50 | Aqua 3–9 |
| HEK293T | ATCC | CRL-3216 |
| Experimental Models: Organisms/Strains | ||
| NOD.Cg-Prkdcscid/J | JAX Mice and Services | RRID:IMSR_JAX:001303 |
| Software and Algorithms | ||
| Graphpad Prism v.9.4.1 | Graphpad | RRID:SCR_002798 |
| Biorender | Biorender | RRID:SCR_018361 |
| Flowjo | Flowjo | RRID:SCR_008520 |
| ImageJ v1.53f51 | Wayne Rasband | RRID:SCR_003070 |
| Neurolucida | MBF Bioscience | RRID:SCR_001775 |
| R | The R Foundation | RRID:SCR_001905 |
| Cell Ranger | 10xGenomics | RRID:SCR_017344 |
| Seurat v4.2.2 | Software as R package | RRID:SCR_016341 |
| Weighted Gene Co-expression Network Analysis | Software as R package | RRID:SCR_003302 |
| GeneOverlap | Software as R package | RRID:SCR_018419 |
| Slingshot | Software as R package | RRID:SCR_017012 |
| Other | ||
| Chromium Next GEM Single Cell 3' Kit v3.1, 16 rxns | 10XGenomics | Cat# PN-1000268 |
| Chromium Next GEM Chip G Single Cell Kit, 48 rxns | 10XGenomics | Cat# PN-1000120 |
| Dual Index Kit TT Set A, 96 rxns | 10XGenomics | Cat# PN-1000215 |
| SPRIselect | Beckman Coulter | Cat# B23317 |
| QubitTM 1X dsDNA HS Assay Kit | Thermo Fisher Scientific | Cat# Q33231 |
| High Sensitivity D5000 Ladder | Agilent | Cat# 5067-5594 |
| High Sensitivity D5000 Reagents | Agilent | Cat# 5067-5593 |
| High Sensitivity D5000 ScreenTape | Agilent | Cat# 5067-5592 |
| RNaseOUTTM | Thermo Fisher Scientific | Cat# 10777019 |
| Shandon Immu-Mount | Thermo Fisher Scientific | Cat# 9990412 |
| Microscope slides | VWR | Cat# 631-9483 |
| Coverslips | VWR | Cat# 631-1365 |
| Dexaject (dexamethasone) | Med-Vet International | Cat# RXDEX2-100 |
| Carprieve Injection (carprofen) | Med-Vet International | Cat# RXCARPRIEVE-INJ |
| Bupreorphine SR | Zoopharm | Cat# BERLAB1 |
| Ibuprofen | Aurobindo | Cat# NDC 59651-032-47 |
| Betadine | Avrio | Cat# NDC 67618-155-16 |
| Sterile Saline (0.9% Sodium Chloride) | Hospira | Cat# NDC 0409-4888-02 |
| Inoculating loops | FisherBrand | Cat# 22-363-595 |
| Gelfoam sponge | DSI | Cat# 0434 |
| 5mm coverslips | EMS | Cat# 72296-05 |
| Optibond | KERR | Cat# 36519 |
| Ortho-Jet liquid | Butler Schein Animal Health | Cat# NC9818757 |
| Ortho-Jet powder | Patterson Dental Supply Inc | Cat# 459-8371 |
| Vetbond | 3M | Cat# 1469SB |
| Lidocaine | Covetrus | Cat# 2468 |
| Artificial tears | Akorn | Cat# NDC 59399-162-35 |
| Isoflurane | Med-Vet International | Cat# RXISO-250 |
Human tissue staining
To visualize microglial morphology in human tissue, we performed immunostaining against Iba1 on paraffin-embedded brain tissue from five healthy pediatric patients, which we previously obtained (HMG004, HMG005, HMG011, HMG013 and HMG014)12. The paraffin-embedded tissue samples were initially processed for neuropathological diagnosis (healthy tissue, no tumor) and then used for immunostaining. Briefly, tissue was fixed in formalin and then dehydrated in graded ethanol, and paraffin embedded and sectioned at a depth of 6μm sections. Heat-induced antigen retrieval was performed in sodium citrate using standard protocols. Sections were deparaffinized with xylene and rehydrated through a graded series of ethanol, washed in PBS and non-specific binding sites were blocked with 3% normal horse serum and incubated with rabbit anti-Iba1 (1:500; FUJIFILM Wako Shibayagi Cat# 019-19741) in blocking buffer at 4 °C. After washing, sections were incubated with goat anti-rabbit Cy3 or Alexa 488 (1:250, Molecular Probes). Sections were washed with PBS before nuclear counterstaining (DAPI 1:1000, Thermo Fisher Scientific).
Morphometric analyses and cell counting
Tiled image stacks were processed using ZEN Imaging software (Carl Zeiss Microscopy) and exported as TIFF files. Neurolucida version 11 (MBF Bioscience) was used for cell counting as well as to reconstruct individual tdT+ microglia within in vitro organoids. Reconstructions were based on the extent of tdT signal expression. Subsequent data analysis was performed using Neurolucida Explorer (MBF Bioscience) and Microsoft Excel.
Lentivirus production
For lentiviral production, the third generation vector plasmids (pBOB-CAG::GFP and pBOB-CAG::tdT) were co-transfected with packaging plasmids pCMV-VSV-G, pRevRSV and pMDLg/pRRE. After 3 days, viral particles were enriched by centrifugation and stored at high concentration at −80°C before usage.
Confocal imaging
Immunofluorescence image data were captured and processed using a confocal microscope system (Zeiss LSM880). In vitro live imaging was performed using a Zeiss CSU Spinning Disk Confocal Microscope, equipped with a Yokogawa spinning disc scan head with an EM-CCD camera and a CO2-imaging chamber (Petcon).
Collection of transplanted mouse brain tissue
Mice were anesthetized with a lethal dose of ketamine and xylazine (130 mg/kg, 15 mg/kg; i.p.) and perfused transcardially with 0.1 M PBS followed by fresh 4% paraformaldehyde (PFA) in 0.1 M phosphate buffer (pH 7.2–7.5). Brains were dissected under a fluorescence stereomicroscope (Zeiss SteREO Discovery.V8) and postfixed in 4% PFA overnight, cryoprotected for 72 h in 30% sucrose with 0.05% NaN3 at 4 °C, sectioned coronally on a cryostat at 20 μm thickness, and processed for immunostaining as described above.
LPS injections
The mice were divided into the following groups: i) intraperitoneal (i.p.) saline group (control) and ii) i.p. LPS group (5 mg/kg or 1 mg/kg). The i.p. LPS injections were administered at 12 wpt at doses of 5 mg/kg or 1 mg/kg in saline. The control groups received the same amount of saline. Twenty-four hours after injection, mice were harvested and processed for immunostaining as described above.
Isolation of human microglia
Animals were anesthetized using 5% isoflurane in oxygen and perfused transcardially with 0.1 M ice-cold PBS. The human grafts were resected under a fluorescence stereoscope (Zeiss SteREO Discovery.V8) and immersed in homogenization buffer: 1x HBSS (Life Technologies, 14175-095) containing 1% BSA, 1 mM EDTA. For mechanical dissociation, we used a 2-ml polytetrafluoroethylene pestle (Wheaton, 358026), as performed in Gosselin et al. 12,69. The homogenate was then pelleted, re-suspended in homogenization buffer and filtered through a 70-μm strainer. The filtered cells were first incubated 1:20 with a Fc receptor blocking antibody (Human TruStain FcX, BioLegend 422302) for 20 min, and then with the following cell surface marker antibody for 30 min (1:50 dilution): Anti-human CD45-APC/Cy7 (304014, clone HI30, BioLegend). Cells were washed twice, filtered again with a 70-μm strainer, and sorted on a BD Influx (100-μm nozzle, 22 PSI, 2-drop purity mode, sample chilling) as live/tdT+/hCD45+ cells. Zombie Violet (BioLegend; 1:500) was used for viability discrimination.
Single cell RNA-sequencing
TdT+/hCD45+ sorted cells were centrifuged and resuspended in PBS supplemented with 0.04% BSA to an adjusted concentration of 1,000 cells/μl. Single cells were then coupled to bar-coded beads in a droplet emulsion for the reverse transcription reaction using the 10X Genomics Chromium controller. Libraries were prepared following the standard protocol of 10X Single Cell 3’ using v3.0 chemistry. Libraries were sequenced to a median depth of approximately 50,000 reads per cell using Illumina HiSeq4000 or NovaSeq6000.
In vivo imaging
Live animal recordings were performed as previously described. Briefly, mice were anesthetized with isoflurane (4–5% for induction; 1–1.5% for maintenance) and kept at 36–37°C on a custom surgical bed (Thorlabs). Eyes were protected with vet ophthalmic ointment (Puralube). The head was stabilized by clamping the skull-attached titanium plate with a custom holder. Imaging commenced immediately after head stabilization. Depth of anesthesia was monitored throughout the experiment and adjusted as needed to maintain a breath rate of approximately 55–65 breaths per minute. Saline was supplemented subcutaneously as necessary to compensate for fluid loss.
A Sutter Movable Objective Microscope equipped with a pulsed femtosecond Ti:Sapphire laser (Chameleon Ultra II, Coherent) and two fluorescence detection channels was used for imaging (dichroic beamsplitter, T565lpxr (Chroma); green emission filter, ET525/70m (Chroma); red emission filter, ET605/70m (Chroma); photomultiplier tubes, H7422-40 GaAsP (Hamamatsu)). The laser excitation wavelength was set to 1,040–1,050 nm. Average laser power was <10–15 mW at the tissue surface and adjusted with depth to compensate for signal loss due to scattering and absorption. An Olympus 20× 1.0-NA water immersion objective was used for light delivery and collection. Time-lapse recordings typically included 45–71 images per stack, acquired at 1.6–2.0 μm axial step size, used a two-frame average, 60–130 stack repeats (corresponding to ~70–205 min recording duration), 512 × 512-pixel resolution, and 2.0 – 5x zoom (350 – 142 μm fields of view).
Focal laser lesions were performed following a baseline recording period of 35–70 min, during which z-stacks were acquired as described above. To induce focal lesions, the Ti:Sapphire laser was transiently tuned to 920 nm and a confined tissue region (~9 μm diameter, ~1 μm axial extent) at ~40–170 μm depth from the tissue surface was exposed to ~250 mW for 7–10 s. Following focal lesion, image stack acquisition was resumed using the same laser and recording parameters as during the baseline recording period.
QUANTIFICATION AND STATISTICAL ANALYSIS
Single cell RNA-sequencing analysis
Data were mapped using Cell Ranger (10X Genomics) on hg38 and analyzed using the Seurat R toolkit for single cell genomics 70. A minimum of 200 unique genes and a 25% mitochondrial cutoff were used to remove low quality cells from all data sets. The SCTransfrom 71 workflow was used and PCA computed as input into Harmony 72 for batch correction. To combine all time points, the parameters in Harmony were set to use the top 10 principal components with theta set to 1. MAST 73 was used for all differential expression tests. Pseudo-temporal ordering and trajectory interference analysis were performed using the slingshot algorithm 74 and a generalized additive model (GAM) was used to calculate differentially expressed genes across pseudo-time (dynamic gene expression profiles). For comparing hMG to human microglia, we downloaded the following datasets and used a unified integration strategy for reference assembly 43 to identify the cell pairwise correspondences between single cells across datasets. Fetal human microglia development: GSE 141862: https://www.ncbi.nlm.nih.gov/geo/query/acc.cgi?acc=GSE141862). Adult human microglia: GSE 135437: https://www.ncbi.nlm.nih.gov/geo/query/acc.cgi?acc=GSE135437); only control samples were used. For integrating the xMG and hMG dataset, we downloaded the single cell datasets from GEO (GSE133433: https://www.ncbi.nlm.nih.gov/geo/query/acc.cgi?acc=GSE133433) and performed random down-sampling to match the size of the different datasets. We then used the Seurat v3 anchoring procedure to facilitate the assembly of the datasets into an integrated reference 43. To obtain cluster- and condition-specific markers, we obtained a ranking for each gene in each cluster according to whether it was unique to a cluster and also highly expressed in this cluster using the function sortGenes in the genesorteR R package 75. For subsequent enrichment analysis, we used the top 50 genes. WGCNA was performed using a signed consensus approach 76 following a metacell construction strategy 77 to input the single cell data and by calculating component-wise values for topological overlap for each dataset. Following construction of the topological overlap matrix, modules were defined using the following parameters: minModuleSize=30, a deepSplit score of 4 and a threshold of correlation of 0.2. We then used the first principal component of the module, called module eigengene (ME), to relate modules to trait parameters such as cluster and condition. Hub genes were defined based on intra-modular connectivity (kME) parameters calculated in the WGCNA R package. Human- and mouse-specific gene expression signatures were extracted from differentially expressed ortholog gene sets (mouse vs human) as described in Geirsdottir et al.46 and used to perform module enrichment analysis. Gene set overlap and enrichment analysis were calculated using the exact fisher test provided in the GeneOverlap package.
In vivo image data analysis
To quantify microglial cells’ structural dynamics, process velocity was measured as previously described 47. Briefly, we manually traced process tips over time using the Manual Tracking plug-in in Fiji on maximum intensity projected time-lapse videos, typically over 90-min time spans that covered a 350 μm x 350 μm x 70 μm field of view (FOV). At least 3 to 7 processes were quantified per microglia to obtain an average process velocity. Microglial polarization was quantified as follows: processes oriented toward the laser lesion site were classified as those on the lesion side of a line drawn through the microglial cell body perpendicular to a line drawn to the lesion side. The polarization index for one microglia cell is the ratio of all ‘toward’ primary processes divided by all processes. The summarized indices are averaged as ‘per lesion’ experiment.
Supplementary Material
Video S1. Colonization of forebrain organoids through erythromyeloid progenitors (EMPs). Live imaging of tdT+ EMPs colonizing a GFP+ forebrain organoid over a time course of 12 hrs. Related to STAR Methods section ‘Colonization of cortical forebrain organoids through erythromyeloid progenitors (EMPs)’.
Video S2. Cleared organoid section showing tdT+ EMPs inside a GFP+ forebrain organoid. Organoid tissue section stained with DAPI depicting tdT+ EMPs invading a ventricular zone (VZ)-like and cortical plate (CP)-like region at 4 dpi. Related to STAR Methods section ‘Colonization of cortical forebrain organoids through erythromyeloid progenitors (EMPs)’.
Video S3. Human microglia actively surveilling the in vivo human brain-like environment. In vivo 2P-imaging of hMG (white) surveilling the human brain-like environment (red) at 12 wpt. The shown scale is 50 μm (the field of view was 282 um). Related to Figure 5.
Video S4. Human microglia react to laser injury induced within the in vivo human brain-like environment. In vivo 2P-imaging of hMG (white) reacting to laser-induced injury performed in the human organoid graft (red) at 12 wpt. The shown scale is 50 μm (the field of view was 350 um). Related to Figure 5.
Highlights.
Xenotransplanted brain organoids as in vivo platform for studying human microglia (hMG)
hMG gain human-specific transcriptomic signatures and assume in vivo-like identities
hMG engage in surveilling the human brain environment and react to perturbations
A patient-derived model reveals a brain environment-induced immune response in autism
Acknowledgments
We thank L. Moore, K. Diffenderfer, and N. Han for technical assistance; M.L. Gage for editorial comments; B. Coyne for administrative assistance; and members of the Gage lab for helpful discussions. This work was supported in part by grants from the National Institutes of Health under award numbers R01 AG056306, UCSD - R01 AG057706 (F.H.G.), UCSD - R01 AG056511 (F.H.G. and C.K.G.), R01 AG061060 (C.K.G.), R01 NS108034 (A.N.), and U19 NS123719 (A.N.); the American Heart Association and the Paul G. Allen Frontiers Group Grant #19PABHI34610000/TEAM LEADER: Fred H. Gage/2019; the National Alliance for Research on Schizophrenia & Depression (NARSAD) 2018 & 2021 Young Investigator Grant from the Brain & Behavior Research Foundation under award numbers 27685 and 30421 (S.T.S.); the German Research Foundation (DFG) under Priority Program SPP2395 award number 500300695 (S.T.S.); the Milky Way Research Foundation and the Annette C. Merle-Smith and the Robert and Mary Jane Engman Foundation (F.H.G.); an EMBO Postdoctoral Long-term Fellowship ALTF 1214-2014; an HFSP Long-Term Fellowship LT001074/2015 (A.A.M.); and an ERC starting grant (A.A.M.). We also acknowledge the support by the NGS Core Facility of the Salk Institute with funding from NIH-NCI CCSG (P30 014195), the JBP Foundation (F.H.G. and C.K.G.), the Helmsley Charitable Trust, and the support by the Flow Cytometry Core Facility of the Salk Institute with funding from NIH-NCI CCSG (P30 014195). We apologize to those whose work was not cited owing to space constraints.
Footnotes
Competing interests
The authors declare that they have no competing interests.
Data and code availability
Imaging data are available in the main text and the supplementary materials. The scRNA-seq profiling datasets have been deposited to the EMBL-EBI BioStudies repository and are publicly available as of the day of publication. Accession numbers are listed in the key resources table. The bulk sequencing data can be requested upon request from the lead author.
There is no original code generated in this study.
Publisher's Disclaimer: This is a PDF file of an unedited manuscript that has been accepted for publication. As a service to our customers we are providing this early version of the manuscript. The manuscript will undergo copyediting, typesetting, and review of the resulting proof before it is published in its final form. Please note that during the production process errors may be discovered which could affect the content, and all legal disclaimers that apply to the journal pertain.
References
- 1.Monier A, Evrard P, Gressens P, and Verney C (2006). Distribution and differentiation of microglia in the human encephalon during the first two trimesters of gestation. Journal of Comparative Neurology 499, 565–582. 10.1002/cne.21123. [DOI] [PubMed] [Google Scholar]
- 2.Monier A, Adle-Biassette H, Delezoide A-L, Evrard P, Gressens P, and Verney C (2007). Entry and Distribution of Microglial Cells in Human Embryonic and Fetal Cerebral Cortex. J Neuropathol Exp Neurol 66, 372–382. 10.1097/nen.0b013e3180517b46. [DOI] [PubMed] [Google Scholar]
- 3.Verney C, Monier A, Fallet-Bianco C, and Gressens P (2010). Early microglial colonization of the human forebrain and possible involvement in periventricular white-matter injury of preterm infants. J Anat 217, 436–448. 10.1111/j.1469-7580.2010.01245.x. [DOI] [PMC free article] [PubMed] [Google Scholar]
- 4.Vargas DL, Nascimbene C, Krishnan C, Zimmerman AW, and Pardo CA (2005). Neuroglial activation and neuroinflammation in the brain of patients with autism. Annals of Neurology 57, 67–81. 10.1002/ana.20315. [DOI] [PubMed] [Google Scholar]
- 5.Morgan JT, Chana G, Pardo CA, Achim C, Semendeferi K, Buckwalter J, Courchesne E, and Everall IP (2010). Microglial Activation and Increased Microglial Density Observed in the Dorsolateral Prefrontal Cortex in Autism. Biological Psychiatry 68, 368–376. 10.1016/j.biopsych.2010.05.024. [DOI] [PubMed] [Google Scholar]
- 6.Tetreault NA, Hakeem AY, Jiang S, Williams BA, Allman E, Wold BJ, and Allman JM (2012). Microglia in the Cerebral Cortex in Autism. J Autism Dev Disord 42, 2569–2584. 10.1007/s10803-012-1513-0. [DOI] [PubMed] [Google Scholar]
- 7.Lee AS, Azmitia EC, and Whitaker-Azmitia PM (2017). Developmental microglial priming in postmortem autism spectrum disorder temporal cortex. Brain, Behavior, and Immunity 62, 193–202. 10.1016/j.bbi.2017.01.019. [DOI] [PubMed] [Google Scholar]
- 8.Voineagu I, Wang X, Johnston P, Lowe JK, Tian Y, Horvath S, Mill J, Cantor RM, Blencowe BJ, and Geschwind DH (2011). Transcriptomic analysis of autistic brain reveals convergent molecular pathology. Nature 474, 380–384. 10.1038/nature10110. [DOI] [PMC free article] [PubMed] [Google Scholar]
- 9.Gupta S, Ellis SE, Ashar FN, Moes A, Bader JS, Zhan J, West AB, and Arking DE (2014). Transcriptome analysis reveals dysregulation of innate immune response genes and neuronal activity-dependent genes in autism. Nature Communications 5, 5748. 10.1038/ncomms6748. [DOI] [PMC free article] [PubMed] [Google Scholar]
- 10.Gandal MJ, Zhang P, Hadjimichael E, Walker RL, Chen C, Liu S, Won H, Bakel H. van, Varghese, M, Wang Y, et al. (2018). Transcriptome-wide isoform-level dysregulation in ASD, schizophrenia, and bipolar disorder. Science 362, eaat8127. 10.1126/science.aat8127. [DOI] [PMC free article] [PubMed] [Google Scholar]
- 11.Bennett FC, Bennett ML, Yaqoob F, Mulinyawe SB, Grant GA, Gephart MH, Plowey ED, and Barres BA (2018). A combination of ontogeny and CNS environment establishes microglial identity. Neuron 98, 1170–1183.e8. 10.1016/j.neuron.2018.05.014. [DOI] [PMC free article] [PubMed] [Google Scholar]
- 12.Gosselin D, Skola D, Coufal NG, Holtman IR, Schlachetzki JCM, Sajti E, Jaeger BN, O’Connor C, Fitzpatrick C, Pasillas MP, et al. (2017). An environment-dependent transcriptional network specifies human microglia identity. Science 356. 10.1126/science.aal3222. [DOI] [PMC free article] [PubMed] [Google Scholar]
- 13.Lavin Y, Winter D, Blecher-Gonen R, David E, Keren-Shaul H, Merad M, Jung S, and Amit I (2014). Tissue-Resident Macrophage Enhancer Landscapes Are Shaped by the Local Microenvironment. Cell 159, 1312–1326. 10.1016/j.cell.2014.11.018. [DOI] [PMC free article] [PubMed] [Google Scholar]
- 14.Bohlen CJ, Bennett FC, Tucker AF, Collins HY, Mulinyawe SB, and Barres BA (2017). Diverse Requirements for Microglial Survival, Specification, and Function Revealed by Defined-Medium Cultures. Neuron 94, 759–773.e8. 10.1016/j.neuron.2017.04.043. [DOI] [PMC free article] [PubMed] [Google Scholar]
- 15.Gordon A, Yoon S-J, Tran SS, Makinson CD, Park JY, Andersen J, Valencia AM, Horvath S, Xiao X, Huguenard JR, et al. (2021). Long-term maturation of human cortical organoids matches key early postnatal transitions. Nat Neurosci 24, 331–342. 10.1038/s41593-021-00802-y. [DOI] [PMC free article] [PubMed] [Google Scholar]
- 16.Qian X (2016). Brain-Region-Specific Organoids Using Mini-bioreactors for Modeling ZIKV Exposure. Cell 165, 1238–1254. [DOI] [PMC free article] [PubMed] [Google Scholar]
- 17.Mansour AA, Schafer ST, and Gage FH (2020). Cellular complexity in brain organoids: Current progress and unsolved issues. Seminars in Cell & Developmental Biology. 10.1016/j.semcdb.2020.05.013. [DOI] [PubMed] [Google Scholar]
- 18.Abud EM, Ramirez RN, Martinez ES, Healy LM, Nguyen CHH, Newman SA, Yeromin AV, Scarfone VM, Marsh SE, Fimbres C, et al. (2017). iPSC-Derived Human Microglia-like Cells to Study Neurological Diseases. Neuron 94, 278–293.e9. 10.1016/j.neuron.2017.03.042. [DOI] [PMC free article] [PubMed] [Google Scholar]
- 19.Douvaras P, Sun B, Wang M, Kruglikov I, Lallos G, Zimmer M, Terrenoire C, Zhang B, Gandy S, Schadt E, et al. (2017). Directed Differentiation of Human Pluripotent Stem Cells to Microglia. Stem Cell Reports 8, 1516–1524. 10.1016/j.stemcr.2017.04.023. [DOI] [PMC free article] [PubMed] [Google Scholar]
- 20.Haenseler W, Sansom SN, Buchrieser J, Newey SE, Moore CS, Nicholls FJ, Chintawar S, Schnell C, Antel JP, Allen ND, et al. (2017). A Highly Efficient Human Pluripotent Stem Cell Microglia Model Displays a Neuronal-Co-culture-Specific Expression Profile and Inflammatory Response. Stem Cell Reports 8, 1727–1742. 10.1016/j.stemcr.2017.05.017. [DOI] [PMC free article] [PubMed] [Google Scholar]
- 21.Muffat J, Li Y, Yuan B, Mitalipova M, Omer A, Corcoran S, Bakiasi G, Tsai L-H, Aubourg P, Ransohoff RM, et al. (2016). Efficient derivation of microglia-like cells from human pluripotent stem cells. Nat Med advance online publication. 10.1038/nm.4189. [DOI] [PMC free article] [PubMed] [Google Scholar]
- 22.Pandya H, Shen MJ, Ichikawa DM, Sedlock AB, Choi Y, Johnson KR, Kim G, Brown MA, Elkahloun AG, Maric D, et al. (2017). Differentiation of human and murine induced pluripotent stem cells to microglia-like cells. Nat Neurosci advance online publication. 10.1038/nn.4534. [DOI] [PMC free article] [PubMed] [Google Scholar]
- 23.Banerjee P, Paza E, Perkins EM, James OG, Kenkhuis B, Lloyd AF, Burr K, Story D, Yusuf D, He X, et al. (2020). Generation of pure monocultures of human microglia-like cells from induced pluripotent stem cells. Stem Cell Research 49, 102046. 10.1016/j.scr.2020.102046. [DOI] [PubMed] [Google Scholar]
- 24.Abreu CM, Gama L, Krasemann S, Chesnut M, Odwin-Dacosta S, Hogberg HT, Hartung T, and Pamies D (2018). Microglia Increase Inflammatory Responses in iPSC-Derived Human BrainSpheres. Front Microbiol 9. 10.3389/fmicb.2018.02766. [DOI] [PMC free article] [PubMed] [Google Scholar]
- 25.Lin Y-T, Seo J, Gao F, Feldman HM, Wen H-L, Penney J, Cam HP, Gjoneska E, Raja WK, Cheng J, et al. (2018). APOE4 Causes Widespread Molecular and Cellular Alterations Associated with Alzheimer’s Disease Phenotypes in Human iPSC-Derived Brain Cell Types. Neuron 98, 1141–1154.e7. 10.1016/j.neuron.2018.05.008. [DOI] [PMC free article] [PubMed] [Google Scholar]
- 26.Hasselmann J, Coburn MA, England W, Figueroa Velez DX, Kiani Shabestari S, Tu CH, McQuade A, Kolahdouzan M, Echeverria K, Claes C, et al. (2019). Development of a Chimeric Model to Study and Manipulate Human Microglia In Vivo. Neuron 103, 1016–1033.e10. 10.1016/j.neuron.2019.07.002. [DOI] [PMC free article] [PubMed] [Google Scholar]
- 27.Mancuso R, Daele JVD, Fattorelli N, Wolfs L, Balusu S, Burton O, Liston A, Sierksma A, Fourne Y, Poovathingal S, et al. (2019). Stem-cell-derived human microglia transplanted in mouse brain to study human disease. Nat Neurosci 22, 2111–2116. 10.1038/s41593-019-0525-x. [DOI] [PMC free article] [PubMed] [Google Scholar]
- 28.Xu R, Li X, Boreland AJ, Posyton A, Kwan K, Hart RP, and Jiang P (2020). Human iPSC-derived mature microglia retain their identity and functionally integrate in the chimeric mouse brain. Nature Communications 11, 1–16. 10.1038/s41467-020-15411-9. [DOI] [PMC free article] [PubMed] [Google Scholar]
- 29.Fattorelli N, Martinez-Muriana A, Wolfs L, Geric I, De Strooper B, and Mancuso R (2021). Stem-cell-derived human microglia transplanted into mouse brain to study human disease. Nat Protoc 16, 1013–1033. 10.1038/s41596-020-00447-4. [DOI] [PubMed] [Google Scholar]
- 30.Mansour AA, Gonçalves JT, Bloyd CW, Li H, Fernandes S, Quang D, Johnston S, Parylak SL, Jin X, and Gage FH (2018). An in vivo model of functional and vascularized human brain organoids. Nature Biotechnology 36, 432–441. 10.1038/nbt.4127. [DOI] [PMC free article] [PubMed] [Google Scholar]
- 31.Kracht L, Borggrewe M, Eskandar S, Brouwer N, Lopes SMC de S, Laman JD, Scherjon SA, Prins JR, Kooistra SM, and Eggen BJL (2020). Human fetal microglia acquire homeostatic immune-sensing properties early in development. Science 369, 530–537. 10.1126/science.aba5906. [DOI] [PubMed] [Google Scholar]
- 32.Masuda T, Sankowski R, Staszewski O, Böttcher C, Amann L, Sagar, Scheiwe C, Nessler S, Kunz P, Loo G. van, et al. (2019). Spatial and temporal heterogeneity of mouse and human microglia at single-cell resolution. Nature 566, 388–392. 10.1038/s41586-019-0924-x. [DOI] [PubMed] [Google Scholar]
- 33.Popova G, Soliman SS, Kim CN, Keefe MG, Hennick KM, Jain S, Li T, Tejera D, Shin D, Chhun BB, et al. (2021). Human microglia states are conserved across experimental models and regulate neural stem cell responses in chimeric organoids. Cell Stem Cell. 10.1016/j.stem.2021.08.015. [DOI] [PMC free article] [PubMed] [Google Scholar]
- 34.Rezaie P, Dean A, Male D, and Ulfig N (2005). Microglia in the Cerebral Wall of the Human Telencephalon at Second Trimester. Cerebral Cortex 15, 938–949. 10.1093/cercor/bhh194. [DOI] [PubMed] [Google Scholar]
- 35.Zhong S, Zhang S, Fan X, Wu Q, Yan L, Dong J, Zhang H, Li L, Sun L, Pan N, et al. (2018). A single-cell RNA-seq survey of the developmental landscape of the human prefrontal cortex. Nature 555, 524–528. 10.1038/nature25980. [DOI] [PubMed] [Google Scholar]
- 36.Lawson LJ, Perry VH, Dri P, and Gordon S (1990). Heterogeneity in the distribution and morphology of microglia in the normal adult mouse brain. Neuroscience 39, 151–170. 10.1016/0306-4522(90)90229-w. [DOI] [PubMed] [Google Scholar]
- 37.Torres-Platas SG, Comeau S, Rachalski A, Bo GD, Cruceanu C, Turecki G, Giros B, and Mechawar N (2014). Morphometric characterization of microglial phenotypes in human cerebral cortex. J Neuroinflammation 11, 12. 10.1186/1742-2094-11-12. [DOI] [PMC free article] [PubMed] [Google Scholar]
- 38.Kongsui R, Beynon SB, Johnson SJ, and Walker FR (2014). Quantitative assessment of microglial morphology and density reveals remarkable consistency in the distribution and morphology of cells within the healthy prefrontal cortex of the rat. J Neuroinflammation 11. 10.1186/s12974-014-0182-7. [DOI] [PMC free article] [PubMed] [Google Scholar]
- 39.Verdonk F, Roux P, Flamant P, Fiette L, Bozza FA, Simard S, Lemaire M, Plaud B, Shorte SL, Sharshar T, et al. (2016). Phenotypic clustering: a novel method for microglial morphology analysis. J Neuroinflammation 13, 153. 10.1186/s12974-016-0614-7. [DOI] [PMC free article] [PubMed] [Google Scholar]
- 40.Home :: BrainSpan: Atlas of the Developing Human Brain http://www.brainspan.org/.
- 41.Matcovitch-Natan O, Winter DR, Giladi A, Aguilar SV, Spinrad A, Sarrazin S, Ben-Yehuda H, David E, González FZ, Perrin P, et al. (2016). Microglia development follows a stepwise program to regulate brain homeostasis. Science, aad8670. 10.1126/science.aad8670. [DOI] [PubMed] [Google Scholar]
- 42.Bian Z, Gong Y, Huang T, Lee CZW, Bian L, Bai Z, Shi H, Zeng Y, Liu C, He J, et al. (2020). Deciphering human macrophage development at single-cell resolution. Nature 582, 571–576. 10.1038/s41586-020-2316-7. [DOI] [PubMed] [Google Scholar]
- 43.Stuart T, Butler A, Hoffman P, Hafemeister C, Papalexi E, Mauck WM, Hao Y, Stoeckius M, Smibert P, and Satija R (2019). Comprehensive Integration of Single-Cell Data. Cell 177, 1888–1902.e21. 10.1016/j.cell.2019.05.031. [DOI] [PMC free article] [PubMed] [Google Scholar]
- 44.Hickman SE, Kingery ND, Ohsumi TK, Borowsky ML, Wang L, Means TK, and El Khoury J (2013). The microglial sensome revealed by direct RNA sequencing. Nature Neuroscience 16, 1896–1905. 10.1038/nn.3554. [DOI] [PMC free article] [PubMed] [Google Scholar]
- 45.Sankowski R, Böttcher C, Masuda T, Geirsdottir L, Sagar, Sindram E, Seredenina T, Muhs A, Scheiwe C, Shah MJ, et al. (2019). Mapping microglia states in the human brain through the integration of high-dimensional techniques. Nat Neurosci 22, 2098–2110. 10.1038/s41593-019-0532-y. [DOI] [PubMed] [Google Scholar]
- 46.Geirsdottir L, David E, Keren-Shaul H, Weiner A, Bohlen SC, Neuber J, Balic A, Giladi A, Sheban F, Dutertre C-A, et al. (2019). Cross-Species Single-Cell Analysis Reveals Divergence of the Primate Microglia Program. Cell 179, 1609–1622.e16. 10.1016/j.cell.2019.11.010. [DOI] [PubMed] [Google Scholar]
- 47.Nimmerjahn A, Kirchhoff F, and Helmchen F (2005). Resting microglial cells are highly dynamic surveillants of brain parenchyma in vivo. Science 308, 1314–1318. 10.1126/science.1110647. [DOI] [PubMed] [Google Scholar]
- 48.Davalos D, Grutzendler J, Yang G, Kim JV, Zuo Y, Jung S, Littman DR, Dustin ML, and Gan W-B (2005). ATP mediates rapid microglial response to local brain injury in vivo. Nat Neurosci 8, 752–758. 10.1038/nn1472. [DOI] [PubMed] [Google Scholar]
- 49.Glass CK, and Natoli G (2015). Molecular control of activation and priming in macrophages. Nat Immunol 17, 26–33. 10.1038/ni.3306. [DOI] [PMC free article] [PubMed] [Google Scholar]
- 50.Schafer ST, Paquola ACM, Stern S, Gosselin D, Ku M, Pena M, Kuret TJM, Liyanage M, Mansour AA, Jaeger BN, et al. (2019). Pathological priming causes developmental gene network heterochronicity in autistic subject-derived neurons. Nature Neuroscience 22, 243. 10.1038/s41593-018-0295-x. [DOI] [PMC free article] [PubMed] [Google Scholar]
- 51.Gage FH, and Fisher LJ (1991). Intracerebral grafting: A tool for the neurobiologist. Neuron 6, 1–12. 10.1016/0896-6273(91)90116-H. [DOI] [PubMed] [Google Scholar]
- 52.Gage FH, Bjöklund A, and Stenevi U (1984). Denervation releases a neuronal survival factor in adult rat hippocampus. Nature 308, 637–639. 10.1038/308637a0. [DOI] [PubMed] [Google Scholar]
- 53.Stenevi U, Björklund A, and Svendgaard N-A (1976). Transplantation of central and peripheral monoamine neurons to the adult rat brain: Techniques and conditions for survival. Brain Research 114, 1–20. 10.1016/0006-8993(76)91003-9. [DOI] [PubMed] [Google Scholar]
- 54.Daviaud N, Friedel RH, and Zou H (2018). Vascularization and Engraftment of Transplanted Human Cerebral Organoids in Mouse Cortex. eNeuro 5, ENEURO.0219–18.2018. 10.1523/ENEURO.0219-18.2018. [DOI] [PMC free article] [PubMed] [Google Scholar]
- 55.Revah O, Gore F, Kelley KW, Andersen J, Sakai N, Chen X, Li M-Y, Birey F, Yang X, Saw NL, et al. (2022). Maturation and circuit integration of transplanted human cortical organoids. Nature 610, 319–326. 10.1038/s41586-022-05277-w. [DOI] [PMC free article] [PubMed] [Google Scholar]
- 56.Kelava I, and Lancaster MA (2016). Stem Cell Models of Human Brain Development. Cell Stem Cell 18, 736–748. 10.1016/j.stem.2016.05.022. [DOI] [PubMed] [Google Scholar]
- 57.Qian X, Song H, and Ming G (2019). Brain organoids: advances, applications and challenges. Development 146, dev166074. 10.1242/dev.166074. [DOI] [PMC free article] [PubMed] [Google Scholar]
- 58.Ormel PR, Sá RV, Bodegraven EJ, Karst H, Harschnitz O, Sneeboer MAM, Johansen LE, Dijk RE, Scheefhals N, Berlekom AB, et al. (2018). Microglia innately develop within cerebral organoids. Nat Commun 9, 1–14. 10.1038/s41467-018-06684-2. [DOI] [PMC free article] [PubMed] [Google Scholar]
- 59.Suzuki K, Sugihara G, Ouchi Y, Nakamura K, Futatsubashi M, Takebayashi K, Yoshihara Y, Omata K, Matsumoto K, Tsuchiya KJ, et al. (2013). Microglial activation in young adults with autism spectrum disorder. JAMA Psychiatry 70, 49–58. 10.1001/jamapsychiatry.2013.272. [DOI] [PubMed] [Google Scholar]
- 60.Garbett K, Ebert PJ, Mitchell A, Lintas C, Manzi B, Mirnics K, and Persico AM (2008). Immune transcriptome alterations in the temporal cortex of subjects with autism. Neurobiol Dis 30, 303–311. 10.1016/j.nbd.2008.01.012. [DOI] [PMC free article] [PubMed] [Google Scholar]
- 61.Gupta S, Ellis SE, Ashar FN, Moes A, Bader JS, Zhan J, West AB, and Arking DE (2014). Transcriptome analysis reveals dysregulation of innate immune response genes and neuronal activity-dependent genes in autism. Nat Commun 5, 5748. 10.1038/ncomms6748. [DOI] [PMC free article] [PubMed] [Google Scholar]
- 62.Corbett BA, Kantor AB, Schulman H, Walker WL, Lit L, Ashwood P, Rocke DM, and Sharp FR (2007). A proteomic study of serum from children with autism showing differential expression of apolipoproteins and complement proteins. Molecular Psychiatry 12, 292–306. 10.1038/sj.mp.4001943. [DOI] [PubMed] [Google Scholar]
- 63.Chez MG, Dowling T, Patel PB, Khanna P, and Kominsky M (2007). Elevation of tumor necrosis factor-alpha in cerebrospinal fluid of autistic children. Pediatr Neurol 36, 361–365. 10.1016/j.pediatrneurol.2007.01.012. [DOI] [PubMed] [Google Scholar]
- 64.Zimmerman AW, Jyonouchi H, Comi AM, Connors SL, Milstien S, Varsou A, and Heyes MP (2005). Cerebrospinal fluid and serum markers of inflammation in autism. Pediatr Neurol 33, 195–201. 10.1016/j.pediatrneurol.2005.03.014. [DOI] [PubMed] [Google Scholar]
- 65.Werling DM, and Geschwind DH (2013). Sex differences in autism spectrum disorders. Current opinion in neurology 26, 146. 10.1097/WCO.0b013e32835ee548. [DOI] [PMC free article] [PubMed] [Google Scholar]
- 66.Galatro TF, Holtman IR, Lerario AM, Vainchtein ID, Brouwer N, Sola PR, Veras MM, Pereira TF, Leite REP, Möller T, et al. (2017). Transcriptomic analysis of purified human cortical microglia reveals age-associated changes. Nat Neurosci 20, 1162–1171. 10.1038/nn.4597. [DOI] [PubMed] [Google Scholar]
- 67.Qian X, Nguyen HN, Song MM, Hadiono C, Ogden SC, Hammack C, Yao B, Hamersky GR, Jacob F, Zhong C, et al. (2016). Brain-Region-Specific Organoids Using Mini-bioreactors for Modeling ZIKV Exposure. Cell 165, 1238–1254. 10.1016/j.cell.2016.04.032. [DOI] [PMC free article] [PubMed] [Google Scholar]
- 68.Gonçalves JT, Bloyd CW, Shtrahman M, Johnston ST, Schafer ST, Parylak SL, Tran T, Chang T, and Gage FH (2016). In vivo imaging of dendritic pruning in dentate granule cells. Nat. Neurosci. 19, 788–791. 10.1038/nn.4301. [DOI] [PMC free article] [PubMed] [Google Scholar]
- 69.Gosselin D, Link VM, Romanoski CE, Fonseca GJ, Eichenfield DZ, Spann NJ, Stender JD, Chun HB, Garner H, Geissmann F, et al. (2014). Environment Drives Selection and Function of Enhancers Controlling Tissue-Specific Macrophage Identities. Cell 159, 1327–1340. 10.1016/j.cell.2014.11.023. [DOI] [PMC free article] [PubMed] [Google Scholar]
- 70.Satija R, Farrell JA, Gennert D, Schier AF, and Regev A (2015). Spatial reconstruction of single-cell gene expression. Nat Biotechnol 33, 495–502. 10.1038/nbt.3192. [DOI] [PMC free article] [PubMed] [Google Scholar]
- 71.Hafemeister C, and Satija R (2019). Normalization and variance stabilization of single-cell RNA-seq data using regularized negative binomial regression. Genome Biology 20, 296. 10.1186/s13059-019-1874-1. [DOI] [PMC free article] [PubMed] [Google Scholar]
- 72.Korsunsky I, Millard N, Fan J, Slowikowski K, Zhang F, Wei K, Baglaenko Y, Brenner M, Loh P, and Raychaudhuri S (2019). Fast, sensitive and accurate integration of single-cell data with Harmony. Nature Methods 16, 1289–1296. 10.1038/s41592-019-0619-0. [DOI] [PMC free article] [PubMed] [Google Scholar]
- 73.Finak G, McDavid A, Yajima M, Deng J, Gersuk V, Shalek AK, Slichter CK, Miller HW, McElrath MJ, Prlic M, et al. (2015). MAST: a flexible statistical framework for assessing transcriptional changes and characterizing heterogeneity in single-cell RNA sequencing data. Genome Biology 16, 278. 10.1186/s13059-015-0844-5. [DOI] [PMC free article] [PubMed] [Google Scholar]
- 74.Street K, Risso D, Fletcher RB, Das D, Ngai J, Yosef N, Purdom E, and Dudoit S (2018). Slingshot: cell lineage and pseudotime inference for single-cell transcriptomics. BMC Genomics 19, 477. 10.1186/s12864-018-4772-0. [DOI] [PMC free article] [PubMed] [Google Scholar]
- 75.Ibrahim MM, and Kramann R (2019). genesorteR: Feature Ranking in Clustered Single Cell Data. 676379. 10.1101/676379. [DOI] [Google Scholar]
- 76.Langfelder P, and Horvath S (2008). WGCNA: an R package for weighted correlation network analysis. BMC Bioinformatics 9, 559. 10.1186/1471-2105-9-559. [DOI] [PMC free article] [PubMed] [Google Scholar]
- 77.Morabito S, Miyoshi E, Michael N, Shahin S, Martini AC, Head E, Silva J, Leavy K, Perez-Rosendahl M, and Swarup V (2021). Single-nucleus chromatin accessibility and transcriptomic characterization of Alzheimer’s disease. Nat Genet 53, 1143–1155. 10.1038/s41588-021-00894-z. [DOI] [PMC free article] [PubMed] [Google Scholar]
Associated Data
This section collects any data citations, data availability statements, or supplementary materials included in this article.
Supplementary Materials
Video S1. Colonization of forebrain organoids through erythromyeloid progenitors (EMPs). Live imaging of tdT+ EMPs colonizing a GFP+ forebrain organoid over a time course of 12 hrs. Related to STAR Methods section ‘Colonization of cortical forebrain organoids through erythromyeloid progenitors (EMPs)’.
Video S2. Cleared organoid section showing tdT+ EMPs inside a GFP+ forebrain organoid. Organoid tissue section stained with DAPI depicting tdT+ EMPs invading a ventricular zone (VZ)-like and cortical plate (CP)-like region at 4 dpi. Related to STAR Methods section ‘Colonization of cortical forebrain organoids through erythromyeloid progenitors (EMPs)’.
Video S3. Human microglia actively surveilling the in vivo human brain-like environment. In vivo 2P-imaging of hMG (white) surveilling the human brain-like environment (red) at 12 wpt. The shown scale is 50 μm (the field of view was 282 um). Related to Figure 5.
Video S4. Human microglia react to laser injury induced within the in vivo human brain-like environment. In vivo 2P-imaging of hMG (white) reacting to laser-induced injury performed in the human organoid graft (red) at 12 wpt. The shown scale is 50 μm (the field of view was 350 um). Related to Figure 5.