

Abstract
This study is a workflow development for the analysis, identification, and categorization of per- and polyfluoroalkyl substances (PFAS) using gas chromatography-high resolution mass spectrometry (GC-HRMS) with non-targeted analysis (NTA) and suspect screening techniques. The behavior of various PFAS in a GC-HRMS was studied with regards to retention indices, ionization susceptibility, fragmentation patterns, etc. A custom PFAS database was constructed from 141 diverse PFAS. The database contains mass spectra from electron ionization (EI) mode, as well as MS and MS/MS spectra from positive and negative chemical ionization (PCI and NCI, respectively) modes. Common fragments of PFAS were identified across a diverse set of 141 PFAS analyzed. A workflow for suspect screening of PFAS and partially fluorinated products of incomplete combustion/destruction (PICs/PIDs) was developed which utilized both the custom PFAS database and external databases. PFAS and other fluorinated compounds were identified in both a challenge sample (designed to test the identification workflow) and incineration samples suspected to contain PFAS and fluorinated PICs/PIDs. The challenge sample resulted in a 100% true positive rate (TPR) for PFAS which were present in the custom PFAS database. Several fluorinated species were tentatively identified in the incineration samples using the developed workflow.
Keywords: PFAS, non-targeted analysis, high resolution mass spectrometry, products of incomplete combustion, gas chromatography
1. Introduction
Per- and polyfluoroalkyl substances (PFAS) make up a large and diverse class of compounds consisting of aliphatic molecules containing at least one perfluoroalkyl group (CnF2n) [1, 2]. PFAS have been used in a range of consumer and industrial products since the mid-20th century. Some consumer products known to contain PFAS include nonstick cookware, firefighting foam, waterproof fabrics, and fast-food packaging [3–9]. According to the Centers for Disease Control and Prevention (CDC), there is potential toxicity associated with specific PFAS [10]. Exposure from specific PFAS has been linked to increased risk of kidney disease, testicular cancer, elevated cholesterol levels, and high blood pressure in pregnant women [11–14]. As a result of these toxicological concerns, different programs have been implemented to phase out use of specific PFAS. In 2006, the U.S. Environmental Protection Agency (EPA), along with several manufacturers of PFAS, began to phase out perfluorooctanoic acid (PFOA) and perfluorooctanesulfonic acid (PFOS) under the “PFOA Stewardship Program”[15].
The phasing out of commonly used PFAS created two challenges: 1) the phased-out compounds would need to be replaced with functional as well as benign substitutes, and 2) inventory of phased-out PFAS in products such as aqueous film forming foam (AFFF) would need to be properly disposed of. Novel substitutes of legacy PFAS are still in development while others are being investigated and characterized by scientists [16]. Research is currently being performed into the proper methods of disposal for PFAS containing material. Until recently, PFAS containing materials, such as AFFF and AFFF exposed soil, have been incinerated[17, 18]. Little research has been performed on the transformation of PFAS during incineration and the resulting products of incomplete combustion/destruction (PICs/PIDs) [19]. Non-targeted analysis (NTA) has proven to be a useful tool in detecting PFAS in landfill leachate, waterways, and soils [15, 20–22]. NTA utilizes high resolution mass spectrometry (HRMS) combined with chromatography and informatics tools to identify novel compounds, including PFAS. The majority of research in the NTA field involving PFAS has been performed using liquid chromatography-HRMS (LC-HRMS). As such, focus has been placed on analyzing and discovering PFAS amenable to LC-HRMS analysis.
Gas chromatography-HRMS (GC-HRMS) remains an underutilized technology for NTA despite the rich datasets generated and the large spectral databases available (e.g., NIST20 and Wiley 11). Methods for NTA using GC-HRMS are less developed than their LC-HRMS counterparts and only a small percentage of GC-HRMS spectral databases are comprised of PFAS. This has led to a sizable research gap in identifying and understanding pathways of environmental pollution conducive to GC-HRMS analysis (e.g., emission extracts from incinerated samples). These environmental pollution pathways involve similar sources which have been investigated using LC-HRMS including emissions from manufacturing facilities, landfills, incineration sites, and other sources. For example, Galloway et al. presented strong evidence of air dispersion from a PFAS manufacturing facility by measuring water concentrations in adjacent watersheds which were unlikely to receive waste from the facility, rather than sampling air [23].
The goals of this study were to: 1) construct a GC-HRMS spectral database of PFAS compounds; 2) develop a workflow for NTA using GC-HRMS; and 3) evaluate the NTA workflow and apply it to field samples. We constructed a custom PFAS database using a structurally diverse set of 141 PFAS chemicals including spectra from electron ionization (EI) and chemical ionization (CI) modes. In creating this database, many observations were made involving ionization behavior of PFAS, characteristic fragmentations of PFAS, chromatographic behavior, etc. These observations were important in recognizing potential PFAS in samples. A workflow was created to select likely candidate compounds matched to GC-HRMS data. The workflow was evaluated using a challenge sample and a recently developed system for assigning confidence levels to tentative compounds [24] that is unique to GC-HRMS . Finally, the workflow was applied to incineration samples to identify PFAS and other fluorinated PICs/PIDs. The work presented here addresses issues regarding emissions from PFAS incineration into the environment and advances the methodology development of NTA using GC-HRMS.
2. Materials and Methods
2.1. Reagents
For information about the origin of chemicals used in this study, see Text Supplemental Information (SI) 1 and Table SI 1.
2.2. Preparation of Evotec PFAS
Per- and polyfluororoalkyl substances (PFAS) with concentrations of 5, 10, or 20 mM solubilized in ethanol were received from the Evotec Company through contract # 68HE0D18D0001. These chemicals are part of the EPA’s ToxCast Compound Library (Prioritization of Environmentally Relevant Chemicals) and have corresponding DSSTox substance identifiers (DTXSIDs). These PFAS stocks were diluted 1:50 using 200 μL of concentrated PFAS and then diluted with ethanol to 10 mL (See Table SI 1 for final concentrations). From these dilutions, 150 μL were aliquoted into deactivated Qsert amber screw cap vials. To these solutions, an additional 50 μL of pure ethanol was added to attain a sufficient volume for GC-HRMS analysis. These vials were capped with LectraBond PTFE/silicone septa. A solvent blank of ethanol was run as part of the analysis.
2.3. Preparation of the Challenge Sample
A challenge sample of mixed PFAS was made to evaluate the accuracy of the NTA workflow. The challenge sample was prepared by combining 2.5 μL aliquots of 10 different PFAS and brought to a total volume of 15 mL using DCM. The following PFAS were used for the challenge sample: 1H,1H,2H-perfluoro-1-hexene; 1H,1H,2H,2H-perfluorohexane-1-ol; heptafluoropropyl-1,2,2,2-tetrafluoroethyl ether; perfluorohexanoic acid; undecafluorou-2-methyl-3-oxahexanoic acid; 1H,1H,2H-perfluoro-1-octene; 1H,1H,2H,2H-perfluoro-1-octanol; 1H-perfluoroheptane; 1H,1H,2H-perfluoro-1-decene; and 1H,1H,2H-perfluoro-1-dodecene. The identity and number of chemicals added to the challenge sample was unknown to the analyst charged with identifying the PFAS until after reporting the identifications back to the sample preparer. The sole metric for measuring success for the challenge sample analysis was the true positive rate (TPR). TPR was defined as the number of true positives (number of spiked compounds that were correctly reported at any level of confidence) divided by the sum of true positives and false negatives (spiked compounds that exhibited a chromatographic peak but which were not correctly reported). After being informed, the analyst was allowed to reinspect the data to determine reasons for any missed identifications. For additional details of PFAS added to the challenge sample, see Text SI 2.
2.4. Preparation of Incineration Samples
Samples were taken from an incineration stack of a commercial thermal treatment facility in North Pole, Alaska; after the incineration of soil, some of which had been exposed to AFFF which commonly contains PFAS. Each of these soils were fed separately to a kiln and treated with a flame afterburner. EPA’s SW-846 Method 0010 Modified Method 5 (MM5) train was used to collect samples at the outlet of the thermal treatment scrubber. After collection, three solid fractions of the train (filter, front XAD-2 trap, and back XAD-2 trap) were extracted with DCM via SW-846 Method 3542. Post-extraction and isolation, internal fluorinated standards were spiked in the extracts. The two internal standards included in the extracts were 2-fluorophenol and 2-fluorobiphenyl. The incinerated samples were processed by National Response Corporation’s (NRC’s) Moose Creek Facility (MCF) located in North Pole, Alaska on October 2019. For specific details involving the workup, collection of the soil samples, and experimental details see report ER19-1408 [19].
2.5. Instrumental Analysis
Samples were analyzed using a Thermo Scientific (Waltham, MA) Trace 1310 gas chromatograph coupled to a Q Exactive GC Orbitrap mass spectrometer. A TraceGOLD TG-5SILMS GC column was used (30 m × 0.25 mm × 0.25 μm). For more information on run order and sample storage, see Text SI 3.
2.6. Settings for the TRACE 1300 Series GC Oven
The initial temperature setting was held at 35°C for 2 minutes, then ramped at 5 °C/min until 150 °C temperature was reached. After reaching 150 °C, the oven temperature was ramped at 25 °C/min until a final temperature of 320 °C was attained. This 320 °C temperature was held for 5 minutes for a total runtime of 36 minutes. The typical run for a sample from start to finish, including cool off and warm up between runs, was 45 minutes. For each sample injection, a split/splitless (S/SL) inlet was used in splitless mode, with a splitless time of 1 min. The inlet temperature was set at 200 °C, with an injection rate of 50 mL/min. Helium carrier gas was set to a continuous flow of 1.5 mL/min. The MS transfer line was set at 300 °C. For more information on the settings of the autosampler, see Text SI 4.
2.7. Settings for the Q Exactive GC-Orbitrap MS in EI mode
EI analyses were conducted in Full MS mode over a scan range of 50-750 m/z. In addition, the compounds perfluorohexadecanoic acid and perfluorostearic acid were run over a scan range of 700-1400 m/z. A solvent delay of 3 min was used to prolong the longevity of the filament for the GC-HRMS. The ion source temperature was set at 300°C. Mass spectral resolution was 60k with automatic gain control (AGC) target 106.
2.8. Settings for the Q Exactive GC-Orbitrap MS in PCI and NCI mode
The instrument methods for PCI and NCI were Full MS (50-750 m/z) and dd-MS2(TOPN). The compounds perfluorohexadecanoic acid and perfluorostearic acid were also run in Full MS (700-1400 m/z) and ddMS2(TOPN). GC parameters, source temperature, and runtimes were consistent with those of the EI method detailed above. The CI (chemical ionization) reagent gas utilized was methane, with a flow of 1.25 mL/min. The resolution was 60k, AGC target was 105, with an intensity threshold of 1.6 × 10⁵. The “exclude isotope” setting was turned on, and the dynamic exclusion was set for 10 s. The ion time (IT) was set at 50 ms, the loop count was set at 5, and the TopN was set at 5. The isolation window was set for 4.0 m/z.
2.9. Workflow Development
The custom PFAS database was constructed using the procedure described in Text SI 5. A workflow was developed to select tentative PFAS and other fluorinated compounds and assign confidence levels based on a scale developed by Koelmel et al. [24]. The selection of features and candidates for the challenge sample and incineration samples was performed using the workflow outlined in Figure 1.
Figure 1.
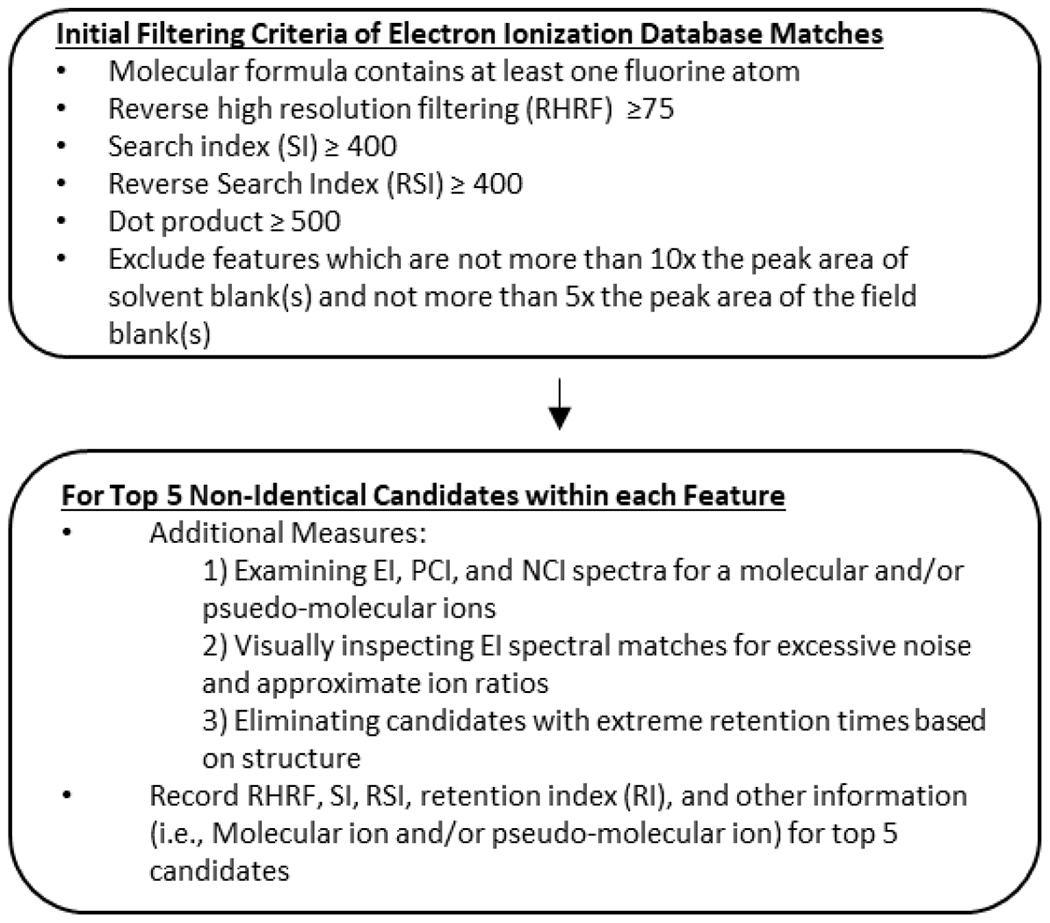
Compound filtering and selection workflow using electron ionization (EI) and chemical ionization.
EI data was deconvoluted and matched to the custom PFAS and then separately to the NIST20 and Wiley 11 databases using Compound Discoverer 3.3 (CD 3.3). For specific details on CD 3.3. settings, see Text SI 7 and Figure SI 3. The resulting output consisted of a list of features where a feature is a set of mz@RT, which is a grouping of associated MS1 components (e.g., fragments, isotopologues, adducts, etc.) from a single compound, and is represented as a tensor of observed retention time, m/z peaks, and intensity [25]. Each feature may have several candidates matching (often times more than 10) from the databases but are not required to have any matches. Features were subsequently filtered using the following parameters: a molecular formula assignment which contained at least one “F” atom (“F” atom(s) conjugated to atom(s) other than “C” were manually excluded), Reverse High-Resolution Filtering (RHRF) score ≥ 75, Search Index (SI) ≥ 400, and Reverse Search Index (RSI) ≥ 400.
The filtering criteria was slightly different than the criteria used to assign confidence levels. Candidate compounds were filtered using lower SI/RSI scores to allow for a larger pool of potential compounds to be observed using the database matches, but the criteria described by Koelmel et al. and outlined later in this paper was used for confidence level assignment.
Features that did not exceed 10x the peak area of a solvent blank and 5x the peak area of a field blank were excluded. After initial filtering criteria were applied to all features, candidates for each feature were sorted by RHRF score, and the top five candidates were inspected individually. Additional measures were taken to evaluate candidate compounds; these measures included: 1) examining EI, PCI, and NCI spectra for a molecular or psuedo-molecular ions; 2) visually inspecting EI spectral matches for excessive noise and approximate ion ratios; and 3) eliminating candidates with extreme retention times based on structure. The molecular ion was included for compounds in EI, PCI, and NCI modes as this provides further evidence of a candidate’s identification. Observation of the molecular ion can be used as an additional metric for identification on the scale by Koelmel et al. The Koelmel et al. scaling system used in this study does include PCI and NCI fragments which can be considered for confidence level assignment. When the PCI and NCI spectra contain more information than the EI spectra, a match of at least five fragments from a library database can be used. However, we believe that the presence of a molecular or pseudo-molecular ion for a candidate that originated from an EI database match, regardless of the ionization mode in which the ion was observed in (EI, PCI, or NCI), can be considered as evidence of a correct identification. For confidence level assignments, however, the criteria from Koelmel et al. was followed and the presence or absence of a molecular ion did not change the confidence level assignment.
It should be noted that visual inspection and retention time discriminations required some expert judgement and were applied only in extreme cases. Visual inspection was performed for additional verification (quality assurance) where observation of at least 2 EI spectral reference peaks matched to in-house samples at ratios within 20%. This was to ensure the quality of the filtering using the established metrics. In only a few cases, candidates were eliminated based on visual inspection. This was most commonly due to the candidate spectrum being overly noisy (an abundance of unrelated peaks in the spectra) where the software may have confused noise for real signals. For future applications, a visual inspection may not be needed, as it may be impractical and unnecessary. Elimination of candidates based on retention time typically involved a late eluting feature (>20 min) being identified as a low molecular weight molecule without a polar head group (i.e., a compound which would clearly be expected to elute very early). These additional measures are considered good practice for NTA by the authors and were implemented in an effort to better inspect and evaluate our data as NTA workflows increasingly rely on automated software processing.
After applying the filtering criteria, the top five candidates of each feature based on highest RHRF scores were recorded. If two or more candidates had the same RHRF scores, those candidates were ranked by SI score. Any remaining candidates, even if they fulfilled the selection workflow criteria, were omitted. Pertinent information about candidates that were recorded included experimental or predicted retention index (RI, see Text SI 6 for more information about the RIs used and Table SI 4 for RIs of 141 PFAS chemicals) from the matching EI database, RHRF score, SI score, RSI score, and the presence of the molecular and/or pseudo molecular ions. After the EI information about the prospective compounds were recorded, the PCI and NCI spectra were manually investigated for presence of the molecular and/or pseudo molecular ions for each candidate compound using Thermo Fisher Xcalibur 4.4 Qualbrowser software. These ions were then recorded alongside the EI information. The m/z of the molecular and/or pseudo molecular ion was required to be within ±3 ppm of the theoretical mass. The m/z is based on the Orbitrap resolution of the specific mass spectrometer used for this work.
Following feature annotation, confidence levels were assigned for the candidate compounds using the confidence scale by Koelmel et al. [24]. The Koelmel et al. scoring system is a novel system used for communicating confidence in identifications of unknown compounds in NTA studies that use GC-MS. It results in a confidence level assignment between level 1 (highest confidence) to level 5 (lowest confidence) for each candidate compound.
A level 1 identification is a confirmed identification, matched against an internal custom database of commercial standards. This is based on RI (<1% difference), two EI spectral reference peaks (ratios within 20%), and/or an SI match score >600.
A level 2 identification is a probable structure and uses an external database. The criteria for a level 2 identification are RI match (<1.5%), an SI of >500, an RSI match of > 600, and an RHRF score >75. Experimental as well as predicted RIs from the NIST or Wiley database entries were considered for level 2 identifications.
A level 3 identification is a tentative candidate and uses an external database. The criteria are EI accurate mass spectral match with SI >500 and RSI > 600. The PCI/NCI spectra may also contain five fragments which match the database, but are not required. The reverse high-resolution mass filter score is >75.
Level 4 identifications contain three subgroups. Level 4A denotes an unequivocal chemical formula identification and level 4B denotes a chemical series (e.g., a homologous series). This study did not attempt to assign identities at the formula level or identify chemical series, so no candidates were assigned level 4A or level 4B confidence. A level 4C was used to categorize compounds which indicated a class of compounds. A level 4C confidence: “Has one or more fragments (with exact mass match) indicative of class.” A level 4C has no SI, RSI, RHRF metric cutoff for the scoring system. According to the literature [26, 27], PFAS can be categorized into many different families and/or classes. For this study, PFAS fragments (e.g., CF3, C2F4, C2F5, etc.) were used to identify unknown features as potential PFAS. Features containing any of these fragments were assigned a level 4C.
Level 5 indicates an unknown feature. Thousands of unknown features were identified by CD 3.3. that could not be assigned a higher confidence than level 5 and thus were not of interest in this study.
In the reported literature, confidence levels have been used for compound identification using both GC-MS and LC-MS. For GC-MS confidence levels, different groups [28, 29] have discussed use of confidence level metrics such as retention time, mass spectra matching, and use of internal standards for the identification of compounds. For LC-MS confidence level assignment, use of the Schymanski scale have been used[30], however, the Koelmel et al. levels of confidence were used for this study because this scale is specific to GC-MS analyses. The scoring system has distinct SI, RSI, and RHRF scoring criteria cutoffs for confidence level assignments. The Koelmel et al. scoring system was found to have clearly defined parameters and explicit conditions for confidence level assignment.
3. Results and Discussion
3.1. Analysis of 141 PFAS Chemicals
Analysis of the 141 PFAS chemicals for construction of the custom PFAS database found that some PFAS were not detected, while others were detected in one, two, and/or three ionization modes. Out of the 141 PFAS analyzed, 73 PFAS were detected in at least one mode; 66 were detected in EI, 61 were detected in PCI, 72 were detected in NCI, and 68 were not detected in any ionization mode. The 141 PFAS chemicals had an observation rate higher in NCI mode vs the other ionization modes. Out of the 73 PFAS detected, 58 of the molecular ions and/or pseudo molecular ions were observed in at least one ionization mode. See Tables SI 2 and SI 3 for details involving the ionization modes, detection of molecular and/or pseudo-molecular ions, and resulting fragments of these PFAS.
3.2. Observations of Functional Group Behavior
Figure 2 summarizes the % PFAS observed out of the total number of compounds (n) with specific functional group(s) analyzed. 141 PFAS chemicals analyzed for this study containing acrylates, alcohols, aldehydes, amides, meta-acrylates, methoxy, sulfonamides, and thiols were detected frequently (> 80% in any mode) across EI, PCI, and NCI modes. Compounds containing the sole functional groups of alkanes, alkenes, cyclic, OCF, phosphate, silane, ethers, esters, sulfonyl fluoride, and sulfonates were not observed using any of the ionization modes. Some of these compounds had no polar head groups and/or may have been too volatile for the method used. PFAS containing functional groups observed at <65% of the total number of compounds (n) with specific functional group(s) in any mode were amines, carboxylic acids, halogenated PFAS (Cl, Br, I), ketone, and sulfonates. PFAS containing functional groups having a greater degree of hydrogen bonding (e.g., fluorotelomer alcohols) were identified more frequently (in all ionization modes) compared to compounds which did not (e.g., alkanes)[31].
Figure 2.

Heat map of functional groups of PFAS observed using GC-HRMS. Numerical values in the columns EI, PCI, NCI, and Any Mode indicate percent observed out of the total number of compounds (n) with the specified functional group(s). A forward slash (/) indicates multifunctional PFAS. Coloring corresponds to the numerical percentage and ranges from yellow (0%) to green (100%). Each of the 141 PFAS chemicals were classified into only one category.
Four of the 73 PFAS were observed in NCI mode, but not in EI or PCI. In this study, PFAS with functional groups known to ionize in NCI mode (such as alcohols, acrylates, carboxylic acids, aldehydes, sulfonamide, and meta-acrylates; these groups make up ~40% of the sample set observed) were observed using GC-HRMS for this study. Several of these compounds had low molecular weights (MW < 350), were alkanes (e.g., 1,1,1,3,3-pentafluorobutane), possessed functional groups with lower boiling points (e.g., halogens and ethers; 1-bromopentadecafluoroheptane; flurothyl; BP < 70°C), or were low molecular weight cyclic compounds (e.g., 1H,2H-hexafluorocyclopentane; MW < 350). Out of the five fluorinated single ring cyclic compounds none were observed using any of the ionization modes. Smaller chained alkanes and single ring hydrocarbon compounds typically have lower boiling points than larger molecular weight alkanes and/or compounds with multiple cyclic groups. Ring structures typically have higher boiling points compared to linear alkanes of similar size [32–34]. The single six carbon fluorinated compound, due to its weak binding interactions (compared to multiple ring fluorinated species), may have high volatility and low boiling points due to their relatively small size (C<6) and single ring structure.
Single ring fluorinated compounds have been observed using GC-MS. The parameters described in the literature for these compounds’ observations differ from the current experimental setup. Lower starting temperatures (30°C), nonpolar columns (Agilent J&W CP-Sil 5 CB columns), and a split mode for the injection process were used in other studies [35]. Other groups have used LC-MS for cyclic PFAS identification [36–38].
In other studies, various PFAS acids, sulfonamides, alcohols, and acrylates have been observed using GC-MS [39–41]. PFAS with functional groups observed in this study were similarly observed in other studies. PFAS with certain functional groups such as sulfonates (sulfonic acids), which had low observation rates (< 20%) in this GC-MS study, were more commonly observed using LC-MS [42].
3.3. PFAS Alcohols
One of the most common functional groups (along with carboxylic acids) in the set of PFAS analyzed was the alcohol functional group. In Table 1, various PFAS alcohols are compared based on mode of detection, PFAS fragments identified, and the molecular and/or pseudo molecular ion observed. This comparison was performed to determine if similar structures (but different masses) had any observable differences in terms of ionization modes, PFAS fragments, and detection of molecular and/or pseudo molecular ions.
Table 1.
PFAS chemicals containing the functional group alcohol. The ionization mode(s), PFAS fragments detected in relative abundance (compared to most intense ion observed), and detection of molecular and/or pseudo molecular ion for these compounds are listed.
| PFAS Alcohol Chemicals | Mode Detected | CF3 Fragment Detected in > 5% Relative Abundance | C3F5 Fragment Detected in > 5% Relative Abundance |
C7F13 Detected in > 0.8% Relative Abundance | C8F15 Detected in > 0.8% Relative Abundance |
Molecular Ion Detected |
|---|---|---|---|---|---|---|
| 1-(Perfluorofluorooctyl)propane-2,3-diol | EI, PCI, NCI | EI | EI | EI, PCI, NCI | NF | EI, PCI |
| 1H,1H,5H-Perfluoropentanol | EI, PCI, NCI | EI | EI | N/A | N/A | PCI, NCI |
| 1H,1H,7H-Dodecafluoro-1-heptanol | EI, PCI, NCI | EI | EI | N/A | N/A |
PCI, NCI |
| 1H,1H-Heptafluorobutanol | EI, PCI, NCI | EI | EI | N/A | N/A | PCI, NCI |
| 1-Pentafluoroethylethanol | EI, PCI, NCI | EI | NF | N/A | N/A | EI, PCI, NCI |
| 3-(Perfluoro-2-butyl)propane-1,2-diol | EI, PCI, NCI | EI | EI | N/A | N/A | EI, PCI, NCI |
| 3-(Perfluoropropyl)propanol | PCI, NCI | NF | NF | N/A | N/A | NF |
| 3H-Perfluoro-2,2,4,4-tetrahydroxypentane | EI, PCI, NCI | EI | NF | N/A | N/A | NF |
| 4:2 Fluorotelomer alcohol | EI, PCI, NCI | EI | EI | N/A | N/A | EI, PCI |
| 4:4 Fluorotelomer alcohol | EI, PCI, NCI | EI | EI | N/A | N/A | EI, PCI |
| 6:1 Fluorotelomer alcohol | EI, PCI, NCI | EI | EI | PCI | N/A | EI, PCI, NCI |
| 6:2 Fluorotelomer alcohol | EI, PCI, NCI | EI | EI | NF |
N/A | EI, PCI |
| 7:3 Fluorotelomer alcohol | EI, PCI, NCI | EI | EI | NCI | NF | EI, PCI |
| 8:2 Fluorotelomer alcohol | EI, PCI, NCI | EI | EI | EI | PCI | EI, PCI |
| 10:1 Fluorotelomer alcohol | EI, PCI, NCI | EI, PCI | EI, PCI | EI, PCI, NCI | PCI, NCI | PCI |
| 10:2 Fluorotelomer alcohol | EI, PCI, NCI | EI, PCI | EI, PCI | EI, PCI, NCI | PCI, NCI | EI, PCI |
| 11:1 Fluorotelomer alcohol | EI, PCI, NCI | EI, PCI | EI, PCI | PCI, NCI | PCI, NCI | PCI, NCI |
| Hexafluoroamylene glycol | EI, PCI, NCI | EI | EI, NCI | N/A | N/A | PCI, NCI |
EI-Electron Ionization
PCI-Positive Chemical Ionization
NCI-Negative Chemical Ionization
N/A- Not Applicable
NF – Not Found (the ion was not observed)
Of particular interest when building this database was the intensity and ionization modes in which a molecular and/or pseudo molecular ion was observed. Molecular ions and/or pseudo molecular ions were identified across different ionization modes and varied in levels of relative intensity/abundance (relative intensity was compared to the most abundant ion peak in the spectra observed; see Table SI 3). While molecular and/or pseudo molecular ions were observed in all modes, PCI produced the greatest number of these fragments for PFAS containing alcohols (6 more than in EI). This is likely because PCI mode is a softer ionization mode than EI. The addition of H+ to an alcohol in PCI was observed more frequently than the subtraction of an H in NCI [43]. The molecular and/or pseudo molecular ion being observed in PCI mode and not in EI mode tended to occur more frequently with lower molecular weight PFAS (MW < 350). This may be due again to the strength of the different types of ionization modes.
Table 1 also shows the different ionization modes and the common corresponding PFAS fragments for PFAS containing alcohol functional groups. Smaller fragments (CF3 and C3F5) were observed for all of the alcohols in EI mode and occurred at a relative abundance of >5 % compared to the most intense ion peak. Conversely, larger fragments (C7F13 and C8F15), were seen in EI mode, but often at lower relative abundances. The resultant data aligns with our expectations, as EI is a harder ionization mode compared to CI, typically resulting in lower molecular weight fragments observed. In both PCI and NCI, lower molecular weight PFAS fragments (CF3 and C3F5) were observed, but often at lower intensities while larger fragments (C7F13, C8F15, molecular and pseudo-molecular ions) were observed at higher intensities and greater frequencies. The trend of observing smaller fragments in EI mode (e.g., CF3 and C3F5) and larger fragments in CI mode (C7F13, C8F15, and pseudo-molecular ions) at higher intensities and frequencies was observed across the suite of PFAS, regardless of functional groups. For a comprehensive list of fragments and ionization modes, see Table SI 2.
3.4. Analysis of Challenge Sample
Analysis of the challenge sample using the custom PFAS database resulted in three of the three PFAS which existed in the custom PFAS database being correctly identified (two of which were identified at level 1 and one identified at level 3). This resulted in a true positive rate (TPR) of 100% for the compounds that exist in the custom PFAS database. Table 2 outlines PFAS from the challenge sample which were identified, missed, or not in the database.
Table 2. Challenge Sample Analysis.
Reported metrics, database confirmation, and confidence level assignments of PFAS in challenge sample.
| Compound # | Compounds | Chemical Formula | Challenge Sample RI | PFAS Chemicals RI | RHRF | SI Match | Reverse SI Match | Molecular Ion Present? | External Database | Custom Database EI entry | Confidence Score |
|---|---|---|---|---|---|---|---|---|---|---|---|
| 1 | 4:2 Fluorotelomer Alcohol | C6H5F9O | 780 | 784 | 99.8 | 763 | 763 | EI: Yes PCI: Yes NCI: N/A |
NIST20 | Yes | Level 1 |
| 2 | 6:2 Fluorotelomer Alcohol | C8H5F13O | 830 | 825 | 99.8 | 591 | 598 | EI: Yes PCI: Yes NCI: N/A |
NIST20 & Wiley 11 | Yes | Level 1 |
| 3 | Perfluoro-2-methyl-3-oxahexanoic acid | C6HF11O3 | N/A | N/A | 95.1 | 780 | 782 | EI: Yes PCI: N/A NCI: N/A |
N/A | Yes | Level 3 |
| 4 | 1,1,1,2,2,3,3-Heptafluoro-3-(1,2,2,2-tetrafluoroethoxy)propane | C5HF11O | 877 | N/A | 96.2 | 631 | 850 | EI: No PCI: Yes NCI: No |
NIST20 & Wiley 11 | No | Level 3 |
| 5 | Perfluorohexanoic acid | C6HF11O2 | NIST20 | No | N/A | ||||||
| 6 | 1H,1H,2H-Perfluoro-1-decene | C10H3F17 | NIST20 & Wiley 11 | No | N/A | ||||||
| 7 | 1H,1H,2H-Perfluoro-1-hexene* | C6H3F9 | NIST20 & Wiley 11 | No | N/A | ||||||
| 8 | 1H-Perfluoroheptane | C7HF15 | Wiley 11 | No | N/A | ||||||
| 9 | 1H,1H,2H-Perfluoro-1-octene | C8H3F13 | NIST20 & Wiley 11 | No | N/A | ||||||
| 10 | 1H,1H,2H-Perfluoro-1-dodecene | C12H3F21 | N/A | No | N/A |
The two PFAS identified at a level 1 confidence using the custom PFAS database were Compounds 1 and 2 (4:2 fluorotelomer alcohol and 6:2 fluorotelomer alcohol, respectively). The one PFAS identified at level 3 using the internal custom PFAS database was compound 3 (perfluoro-2-methyl-3-oxahexanoic acid). High RHRF scores, SI scores, were attained for compounds 1-3. RIs were attained for Compound 1 and Compound 2 which were < 1% of the RI of the reference PFAS chemical. The RI for Compound 3 was not attained, because the elution time was less than the alkane standard. Therefore, the confidence level assignment for Compound 3 was put at a level 3. The molecular and/or pseudo molecular ions in EI and/or CI for all three compounds were observed (See Table SI 5).
Compound 4 (1,1,1,2,2,3,3-heptafluoro-3-(1,2,2,2-tetrafluoroethoxy)propane), produced many similar metrics as compounds assigned to a level 1 score; however, its RI did not align with the reported RI in the NIST20 and Wiley 11 databases. Additionally, only an external database match was made, and thus a level 3 confidence was assigned to the compound. A standard was later run (same stock used to spike the challenge sample), which then produced an RI match (≤1%). The full list of candidates for the challenge sample matching to NIST20 and Wiley 11 are in Table SI 6.
Compounds 5, 6, 7 were part of the 141 PFAS chemicals which were run but none of these compounds showed distinct chromatographic peaks. There were therefore no spectra for these compounds in the custom PFAS database, although spectra did exist in the external databases. It is thought that these compounds were missed because they did not produce an instrumental response using the current GC-HRMS method. A follow up analysis using pure chemicals of these compounds was performed in EI mode at 100 ppm in DCM. The GC-HRMS analysis still produced no observable chromatographic peaks for these compounds. Compounds 8 and 9, were not part of the 141 PFAS chemicals analyzed and therefore did not have spectra catalogued in the custom PFAS database. Spectra for these compounds do exist in the external NIST20 and/or Wiley 11 databases. As with compounds 5,6, and 7, a follow up analysis of the original standards for Compounds 8 and 9 was performed. The compounds were analyzed at a 100 ppm in DCM. In the resulting chromatograms, no observable peak was detected for these compounds. For Compound 10, no spectra existed in the custom PFAS database or external databases. Therefore, it was not identified in the challenge sample and would have no chance of being identified using our current workflow.
Although spectra for Compounds 5-9 were present in the NIST20 and/or Wiley 11 databases, these compounds were not observed using the current GC-HRMS method and thus had no chance for correct identification. The compounds were either alkanes or alkenes. In the original 141 PFAS chemicals used to build the custom database, 0/2 alkanes were observed, and 0/6 alkenes were observed. Thus, these types of PFAS have a low likelihood of observation using the current GC-HRMS method. Instrumental parameters may be optimized to increase the likelihood of detecting these compound but it was decided optimization for specific compound groups is outside the scope of this study. Of the six compounds that were present in external databases but not in the custom PFAS database (i.e., compounds 4-9), one was correctly identified, and five are known to give no signal using the current GC-HRMS methods. When only considering compounds which gave a signal on the instrument and existed in the databases used, analysis of the challenge sample resulted in a 100% TPR. However, this TPR is calculated based on a small number of compounds and a more rigorous evaluation of the workflow using a larger set of PFAS compounds may be necessary to accurately measure the TPR. Considering all compounds in the challenge sample, the TPR was 40% but, as discussed, the false negatives can be attributed to a lack of signal from the instrument rather than the data processing workflow.
3.5. Analysis of Incineration Samples
As a demonstration of the NTA method to field samples, samples collected from stack emissions at an incinerator in Alaska were analyzed. Database matching resulted in 3 features using the custom PFAS database, and 47 features using the NIST20 and Wiley 11 databases which were prioritized for further analysis using the data workflow. For the comprehensive list of PFAS candidates from the incineration samples using the custom PFAS database, see Table SI 7.
After elimination of many features using the data workflow, the top three compounds were recorded from the custom PFAS database matching (Table 3), which possessed at least a level 3 confidence assignment using the established metrics. For this study, PFAS fragments of CF3, C2F4, C3F5, C4F7 and C5F9 were observed for the compound in relatively high abundance in either EI and CI modes. PFAS fragments of C6F11, C7F13, and C8F15 were observed in CI mode. Table 4 lists example compounds with level 1-4C confidence assignments of the incineration samples matched to the NIST20 and Wiley 11 databases (For complete results, see Table SI 8).
Table 3.
Top candidate matches for the incineration extracts matched to the custom PFAS database.
| Compound # | Compounds | Molecular Ion Detected | Calculated RI from Incineration Extracts | RI from PFAS Chemicals | SI Score | Reverse SI Score | RHRF Score | Confidence Score |
|---|---|---|---|---|---|---|---|---|
| 1 | (Perfluorobutyryl)-2-thenoylmethane | No EI or NCI molecular ions detected | 1007 | 1099 | 811 | 923 | 100 | Level 3 |
| 2 | N-Methyl-N-2-hydroxy-ethylperfluorooctane | No EI or NCI molecular ions detected | 1584 | 1685 | 647 | 779 | 89.5 | Level 3 |
Table 4.
Top candidate matches for the incineration extracts to NIST20 and Wiley 11 databases.
| Compound # | Compound | Molecular Ion Detected | Calculated RI from Incineration Sample | Predicted RI, Estimated RI, NIST20 RI, or RI from In-House Commercial Std | SI score | Reverse SI Score | RHRF Score | Confidence Score |
|---|---|---|---|---|---|---|---|---|
| 1 | 2-fluoro-1,1’-biphenyl* | EI, PCI | 1368 | 1361 | 857 | 924 | 98.4 | Level 1 |
| 2 | 2-fluorophenol* | EI, PCI, NCI | 859 | 865 | 705 | 707 | 100 | Level 1 |
| 3 | 5-Isopropyl-1-ϐ,D-ribofuranosyl)-4-(trifluoromethyl)-1H-pyrimidin-2-one | No | 2121 | 2300 | 601 | 855 | 100 | Level 3 |
| 4 | (1,1-Difluoro-2-phenyl-1-(phenylsulfanyl)propan-2-yloxy)trimethylsilane | No | 2241 | 1977 | 492 | 813 | 100 | Level 4C |
| 5 | 1-ethoxy-2-fluoro-benzene | PCI, NCI | 826 | 944 | 739 | 772 | 100 | Level 3 |
| 6 | 4-Butylbenzoic acid, pentafluorophenyl ester | PCI | 2052 | 1944 | 556 | 892 | 90.7 | Level 3 |
| 7 | 2,5-Di(trifluoromethyl)benzoic acid, 5-tridecyl ester | No | 2323 | 2084 | 410 | 672 | 88.6 | Level 4C |
| 8 | Acetamide, N-(1,5-dimethyl-6-oxo-4-hexenyl)-2,2,2-trifluoro-N-methyl-,(E)-(.+−.) | No | 1368 | 1259 | 477 | 804 | 76 | Level 4C |
Internal Standards
EI- Electron Ionization
PCI- Positive Chemical Ionization
NCI- Negative Chemical Ionization
Reference compounds were not commercially available for the majority of compounds tentatively identified in the incineration samples and none could be confirmed at a level 1 identification. Two internal standard (i.e. in-house reference chemicals spiked with the samples), which were not originally included in the custom PFAS database, were correctly identified using our workflow with the NIST20 and Wiley 11 databases. These compounds were 2-fluorophenol and 2-fluorobiphenyl and were later confirmed at a level 1 using standards (See Figures SI 1 and SI 2 for matching chromatograms and spectra). All other compounds remained tentative identifications. Molecular ions and/or pseudo molecular ions were observed for the following candidate compounds: 1-ethoxy-2-fluoro-benzene, 2-fluorophenol, 2-fluoro-1,1’-biphenyl, 4-butylbenzoic acid, (erythro/threo)-Ethyl 2-cyano-3-fluoro-2-hydroxy-3-phenylpropanoate, trifluoroacetyl derivative of pentadeutero methamphetamine, (E)-2,2-Difluoro-1-(2-hydroxyphenyl)-4-trimethylsilyl-3-buten-1-ol, and 11,17-Di-tert-butyl-12-methyl-3,2-oxaphospha-12-phosphoniapentacyclo(11.5.1.0(2,11).0(4,10).0(12,16)]nonadeca-4(10,5,814,17-pentaen-19-one trifluoromethanesulfonate.
In the analysis of the challenge and incineration samples, the external database matching was limited, although not entirely incorrect in identifying PFAS. As reported Koelmel et. al., an external database match for compounds generally yields lower confidence for compound identification compared to internal database matching [24]. This was evident in the analysis of the challenge sample. Increased availability of PFAS chemicals for constructing in-house spectral databases increases the success rate of identifying unknown PFAS in environmental samples. Also, focus should be placed on developing NTA and suspect screening workflows that are able to identify PFAS rapidly and accurately and other fluorinated species in environmental samples. Other studies using GC-MS have used functional groups to analyze and categorize different types of compounds [44–48].
A limitation of the current workflow is the emphasis placed on EI database matches. However, much of this work lays the foundation for identification of features for which no good database match can be found (de novo NTA). Better use of PCI and NCI data could be very useful in this pursuit, as they produce different fragments than EI. Alignment of features across EI and PCI/NCI remains a challenge as there is currently no automated way to do this. In this study, only the pseudo molecular ions from PCI and NCI were used for compound verification; however, it was observed that most PFAS produced many other ions that could be useful for identification. The use of NCI is particularly important for PFAS, as it was observed more PFAS tended to be observed using NCI than EI or PCI modes. Furthermore, the soft ionization often produces fragments that can help distinguish similar compounds, such as fluorotelomer alcohols and other homologous series, that are common among PFAS.
4. Implications for Environmental Analyses
Numerous studies and reports continue to be published indicating increasing concentrations of PFAS being released into the environment [49–52]. Many of these substances have yet to be identified and may be linked to biological and environmental health issues [53–56]. Many of these substances can traverse long distances (from evaporation/incineration) and redeposit in different food production sources, fisheries, and water supplies[57–60].
In addition to investigating PFAS, other potentially harmful volatile compounds could be investigated using GC-HRMS with NTA workflows. Different governments, industries, and commercial entities use incineration for the elimination of unwanted products and substances. Some of the sources for incinerated waste being released into the environment include trash incineration, biological waste incineration, wildfires, urban fires, halogenated waste incineration, commercial engine exhaust, and industrial waste exhaust [61–67]. Given the versatility of NTA GC-HRMS, other areas could benefit from further development of the work presented here.
The large amount of scientific literature, news reports, and accounts of PFAS entering and increasing in concentration in the environment makes this study relevant as well as urgent [68–70]. As these issues become better understood, it is likely the interest, research, and regulatory considerations surrounding PFAS, and other toxic compounds will continue to grow and evolve.
Supplementary Material
Acknowledgements
This research was supported in part by an appointment to the U.S. Environmental Protection Agency (EPA) Research Participation Program administered by the Oak Ridge Institute for Science and Education (ORISE) through an interagency agreement between the U.S. Department of Energy (DOE) and the U.S. Environmental Protection Agency. ORISE is managed by Oak Ridge Associated Universities (ORAU) under DOE contract number DE-SC0014664. All opinions expressed in this paper are the authors’ and do not necessarily reflect the policies and views of US EPA, DOE, or ORAU/ORISE. The United States Environmental Protection Agency managed and oversaw the research performed for this study. This work was supported by the Office of Research and Development National Program Project Task ID SSWR 8.1.3. The manuscript for this study was submitted for review to the EPA and approved for publication. Trade names, commercial and product names used in the report do not coincide with the endorsement of any personal and/or commercial use of any of the products mentioned. The authors would like to thank Hannah Liberatore and John Sloop for their valuable review of the manuscript. The authors of this study are grateful to Elin Ulrich, our branch chief, for procuring the 141 PFAS chemicals, aliquoting the samples, and distributing it to us the researchers. The authors would like to thank Ariel Wallace, Marci Smeltz, Scott Clifton, Ekong Basey, Larry McMillan, and Matthew Allen for providing data, supplies, and software expertise. Jeremy Koelmel and Krystal Politt of Yale School of Public Health are acknowledged for allowing us access to their manuscript in preparation and for use of their GC-MS scoring criteria.
References
- 1.Ritscher A, et al. , Zürich Statement on Future Actions on Per- and Polyfluoroalkyl Substances (PFASs). Environ Health Perspect, 2018. 126(8): p. 84502. [DOI] [PMC free article] [PubMed] [Google Scholar]
- 2.Buck RC, et al. , Perfluoroalkyl and polyfluoroalkyl substances in the environment: Terminology, classification, and origins. Integrated Environmental Assessment and Management, 2011. 7(4): p. 513–541. [DOI] [PMC free article] [PubMed] [Google Scholar]
- 3.Herzke D, Olsson E, and Posner S, Perfluoroalkyl and Polyfluoroalkyl Substances (PFASs) in Consumer Products in Norway – A Pilot Study. Chemosphere, 2012. 88(8): p. 980–987. [DOI] [PubMed] [Google Scholar]
- 4.Place BJ and Field JA, Identification of Novel Fluorochemicals in Aqueous Film-Forming Foams Used by the US Military. Environmental science & technology, 2012. 46(13): p. 7120–7127. [DOI] [PMC free article] [PubMed] [Google Scholar]
- 5.Zheng G and Salamova A, Are Melamine and Its Derivatives the Alternatives for Per- and Polyfluoroalkyl Substance (PFAS) Fabric Treatments in Infant Clothes? Environ Sci Technol, 2020. 54(16): p. 10207–10216. [DOI] [PubMed] [Google Scholar]
- 6.Zhu Y, Ro A, and Bartell SM, Household Low Pile Carpet Usage was Associated with Increased Serum PFAS Concentrations in 2005-2006. Environ Res, 2021. 195: p. 110758. [DOI] [PMC free article] [PubMed] [Google Scholar]
- 7.Nicole W, PFAS and Miscarriage in Humans: Expanding a Sparse Evidence Base. Environ Health Perspect, 2020. 128(10): p. 104002. [DOI] [PMC free article] [PubMed] [Google Scholar]
- 8.Glenn G, et al. , Per- and Polyfluoroalkyl Substances and their Alternatives in Paper Food Packaging. Compr Rev Food Sci Food Saf, 2021. 20(3): p. 2596–2625. [DOI] [PubMed] [Google Scholar]
- 9.Chen J, et al. , Flows, Stock, and Emissions of Poly- and Perfluoroalkyl Substances in California Carpet in 2000-2030 under Different Scenarios. Environ Sci Technol, 2020. 54(11): p. 6908–6918. [DOI] [PubMed] [Google Scholar]
- 10.[cited 2022 5/10/22]; Available from: https://www.atsdr.cdc.gov/pfas/health-effects/index.html.
- 11.Blake BE, et al. , Associations Between Longitudinal Serum Perfluoroalkyl Substance (PFAS) Levels and Measures of Thyroid Hormone, Kidney function, and Body Mass Index in the Fernald Community Cohort. Environ Pollut, 2018. 242(Pt A): p. 894–904. [DOI] [PMC free article] [PubMed] [Google Scholar]
- 12.Anderko L and Pennea E, Exposures to Per-and Polyfluoroalkyl Substances (PFAS): Potential Risks to Reproductive and Children’s Health. Current Problems in Pediatric and Adolescent Health Care, 2020. 50(2): p. 100760. [DOI] [PubMed] [Google Scholar]
- 13.Grandjean P, et al. , Estimated Exposures to Perfluorinated Compounds in Infancy Predict Attenuated Vaccine Antibody Concentrations at Age 5-Years. Journal of immunotoxicology, 2017. 14(1): p. 188–195. [DOI] [PMC free article] [PubMed] [Google Scholar]
- 14.Salihovic S, et al. , Changes in Markers of Liver Function in Relation to Changes in Perfluoroalkyl Substances-a Longitudinal Study. Environment international, 2018. 117: p. 196–203. [DOI] [PubMed] [Google Scholar]
- 15.Washington JW, et al. , Nontargeted Mass-Spectral Detection of Chloroperfluoropolyether Carboxylates in New Jersey Soils. Science, 2020. 368(6495): p. 1103–1107. [DOI] [PMC free article] [PubMed] [Google Scholar]
- 16.Cousins IT, et al. , The Concept of Essential Use for Determining When Uses of PFASs Can be Phased Out. Environmental Science: Processes & Impacts, 2019. 21(11): p. 1803–1815. [DOI] [PMC free article] [PubMed] [Google Scholar]
- 17.Longendyke GK, Katel S, and Wang Y, PFAS fate and destruction mechanisms during thermal treatment: a comprehensive review. Environmental Science: Processes & Impacts, 2022. 24(2): p. 196–208. [DOI] [PubMed] [Google Scholar]
- 18.Hart M, Farid A, and Sadegh M, Combined Approach to Destroying Legacy AFFF and Concentrated Waste Streams of PFAS. 2019. p. H21I–1842.
- 19.Ryan J and Gullett B. Analysis of Fate of PFAS During Incineration. 2020. [cited 2022; Available from: https://serdp-estcp-storage.s3.us-gov-west-1.amazonaws.com/s3fs-public/project_documents/ER19-1408%2BFinal%2BReport.pdf?VersionId=DjIV697Ahov3t1K8TbM4JBcLLWaZi2Su.
- 20.Brusseau ML, Anderson RH, and Guo B, PFAS concentrations in soils: Background levels versus contaminated sites. Science of The Total Environment, 2020. 740: p. 140017. [DOI] [PMC free article] [PubMed] [Google Scholar]
- 21.Newton S, et al. , Novel Polyfluorinated Compounds Identified Using High Resolution Mass Spectrometry Downstream of Manufacturing Facilities near Decatur, Alabama. Environmental Science & Technology, 2017. 51(3): p. 1544–1552. [DOI] [PMC free article] [PubMed] [Google Scholar]
- 22.Strynar M, et al. , Identification of Novel Perfluoroalkyl Ether Carboxylic Acids (PFECAs) and Sulfonic Acids (PFESAs) in Natural Waters Using Accurate Mass Time-of-Flight Mass Spectrometry (TOFMS). Environmental Science & Technology, 2015. 49(19): p. 11622–11630. [DOI] [PubMed] [Google Scholar]
- 23.Galloway JE, et al. , Evidence of Air Dispersion: HFPO–DA and PFOA in Ohio and West Virginia Surface Water and Soil near a Fluoropolymer Production Facility. Environmental Science & Technology, 2020. 54(12): p. 7175–7184. [DOI] [PMC free article] [PubMed] [Google Scholar]
- 24.Koelmel JP, et al. , An Actionable Annotation Scoring Framework for Gas Chromatography-High-Resolution Mass Spectrometry. Exposome, 2022. 2(1). [DOI] [PMC free article] [PubMed] [Google Scholar]
- 25.BP4NTA Benchmarking and Publications for Non-Targeted Analysis. 2023; Available from: https://nontargetedanalysis.org/glossary/.
- 26.Kwiatkowski CF, et al. , Scientific Basis for Managing PFAS as a Chemical Class. Environmental Science & Technology Letters, 2020. 7(8): p. 532–543. [DOI] [PMC free article] [PubMed] [Google Scholar]
- 27.Naming Conventions and Physical and Chemical Properties of Per- and Polyfluoroalkyl Substances (PFAS). [12/5/22]; Available from: https://pfas-1.itrcweb.org/fact-sheets/.
- 28.Chibwe L, et al. , Identification of Polar Transformation Products and High Molecular Weight Polycyclic Aromatic Hydrocarbons (PAHs) in Contaminated Soil Following Bioremediation. Sci Total Environ, 2017. 599–600: p. 1099–1107. [DOI] [PubMed] [Google Scholar]
- 29.Hoh E, et al. , Nontargeted Comprehensive Two-Dimensional Gas Chromatography/Time-of-Flight Mass Spectrometry Method and Software for Inventorying Persistent and Bioaccumulative Contaminants in Marine Environments. Environmental Science & Technology, 2012. 46(15): p. 8001–8008. [DOI] [PubMed] [Google Scholar]
- 30.Schymanski EL, et al. , Identifying Small Molecules via High Resolution Mass Spectrometry: Communicating Confidence. Environmental Science & Technology, 2014. 48(4): p. 2097–2098. [DOI] [PubMed] [Google Scholar]
- 31.Solomons TWG and Frhyle CB, Organic Chemistry. 2004, 111 River Street, Hoboken, NJ: John Wiley & Sons. pp. 70–8. [Google Scholar]
- 32.Vollhardt KPC and Schore NE, Organic Chemistry: Structure and Function. 2014: W. H. Freeman. [Google Scholar]
- 33.McMurry J and Simanek E, Fundamentals of Organic Chemistry. 2007: Cengage Learning. [Google Scholar]
- 34.Cozzarelli IM, McKelvie JR, and Baehr AL, 11.12 - Volatile Hydrocarbons and Fuel Oxygenates, in Treatise on Geochemistry (Second Edition), Holland HD and Turekian KK, Editors. 2014, Elsevier: Oxford. p. 439–480. [Google Scholar]
- 35.Rauh F, et al. , A Mid-Infrared Sensor for the Determination of Perfluorocarbon-Based Compounds in Aquatic Systems for Geosequestration Purposes. Talanta, 2014. 130: p. 527–35. [DOI] [PubMed] [Google Scholar]
- 36.Kirkwood KI, et al. , Utilizing Pine Needles to Temporally and Spatially Profile Per- and Polyfluoroalkyl Substances (PFAS). Environmental Science & Technology, 2022. 56(6): p. 3441–3451. [DOI] [PMC free article] [PubMed] [Google Scholar]
- 37.Frigerio G, et al. , Development and Validation of an LC–MS/MS Method for the Quantitation of 30 Legacy and Emerging Per- and Polyfluoroalkyl Substances (PFASs) in Human Plasma, Including HFPO-DA, DONA, and cC6O4. Analytical and Bioanalytical Chemistry, 2022. 414(3): p. 1259–1278. [DOI] [PMC free article] [PubMed] [Google Scholar]
- 38.De Silva AO, et al. , Detection of a Cyclic Perfluorinated Acid, Perfluoroethylcyclohexane Sulfonate, in the Great Lakes of North America. Environmental Science & Technology, 2011. 45(19): p. 8060–8066. [DOI] [PubMed] [Google Scholar]
- 39.Scott BF, et al. , Analysis for Perfluorocarboxylic Acids/Anions in Surface Waters and Precipitation Using GC–MS and Analysis of PFOA from Large-Volume Samples. Environmental Science & Technology, 2006. 40(20): p. 6405–6410. [DOI] [PubMed] [Google Scholar]
- 40.Smeltz MG, et al. , Targeted Per- and Polyfluoroalkyl Substances (PFAS) Assessments for High Throughput Screening: Analytical and Testing Considerations to Inform a PFAS Stock Quality Evaluation Framework. Toxicology and Applied Pharmacology, 2023. 459: p. 116355. [DOI] [PMC free article] [PubMed] [Google Scholar]
- 41.Bach C, et al. , Simultaneous Determination of Perfluoroalkyl Iodides, Perfluoroalkane Sulfonamides, Fluorotelomer Alcohols, Fluorotelomer Iodides and Fluorotelomer Acrylates and Methacrylates in Water and Sediments Using Solid-Phase Microextraction-Gas Chromatography/Mass Spectrometry. Journal of Chromatography A, 2016. 1448: p. 98–106. [DOI] [PubMed] [Google Scholar]
- 42.Li D, et al. , The Determination of Trace Per-and Polyfluoroalkyl Substances and Their Precursors Migrated into Food Simulants from Food Contact Materials by Liquid Chromatography–MS/MS and Gas Chromatography–MS/MS. 2020. [Google Scholar]
- 43.Skoog D, Principles of Instrumental Analysis. 6th ed. 2007, Thomson Higher Education, 10 Davis Drive, Belmont California: Thomson Brooks Cole. pp 557–58. [Google Scholar]
- 44.Marcos J and Pozo OJ, Derivatization of Steroids in Biological Samples for GC–MS and LC–MS analyses. Bioanalysis, 2015. 7(19): p. 2515–2536. [DOI] [PubMed] [Google Scholar]
- 45.Ruiz-Matute AI, et al. , Derivatization of Carbohydrates for GC and GC–MS Analyses. Journal of Chromatography B, 2011. 879(17): p. 1226–1240. [DOI] [PubMed] [Google Scholar]
- 46.Schummer C, et al. , Comparison of MTBSTFA and BSTFA in Derivatization Reactions of Polar Compounds Prior to GC/MS Analysis. Talanta, 2009. 77(4): p. 1473–1482. [DOI] [PubMed] [Google Scholar]
- 47.Halket JM, et al. , Chemical Derivatization and Mass Spectral Libraries in Metabolic Profiling by GC/MS and LC/MS/MS. Journal of Experimental Botany, 2004. 56(410): p. 219–243. [DOI] [PubMed] [Google Scholar]
- 48.Li D, Park J, and Oh J-R, Silyl Derivatization of Alkylphenols, Chlorophenols, and Bisphenol A for Simultaneous GC/MS Determination. Analytical Chemistry, 2001. 73(13): p. 3089–3095. [DOI] [PubMed] [Google Scholar]
- 49.Barroso PJ, et al. , Emerging Contaminants in the Atmosphere: Analysis, Occurrence and Future Challenges. Critical Reviews in Environmental Science and Technology, 2019. 49(2): p. 104–171. [Google Scholar]
- 50.Bossi R, Vorkamp K, and Skov H, Concentrations of Organochlorine Pesticides, Polybrominated Diphenyl Ethers and Perfluorinated Compounds in the Atmosphere of North Greenland. Environmental pollution, 2016. 217: p. 4–10. [DOI] [PubMed] [Google Scholar]
- 51.Barber JL, et al. , Analysis of Per-and Polyfluorinated Alkyl Substances in Air Samples from Northwest Europe. Journal of environmental monitoring, 2007. 9(6): p. 530–541. [DOI] [PubMed] [Google Scholar]
- 52.Liu W, et al. , Atmospheric Chlorinated Polyfluorinated Ether Sulfonate and Ionic Perfluoroalkyl Acids in 2006 to 2014 in Dalian, China. Environmental toxicology and chemistry, 2017. 36(10): p. 2581–2586. [DOI] [PubMed] [Google Scholar]
- 53.Simkhovich BZ, Kleinman MT, and Kloner RA, Air Pollution and Cardiovascular Injury. Journal of the American College of Cardiology, 2008. 52(9): p. 719–726. [DOI] [PubMed] [Google Scholar]
- 54.Stanek LW, et al. , Air Pollution Toxicology—A Brief Review of the Role of the Science in Shaping the Current Understanding of Air Pollution Health Risks. Toxicological Sciences, 2011. 120(suppl_1): p. S8–S27. [DOI] [PubMed] [Google Scholar]
- 55.Stone V, Johnston H, and Clift MJ, Air Pollution, Ultrafine and Nanoparticle Toxicology: Cellular and Molecular Interactions. IEEE transactions on nanobioscience, 2007. 6(4): p. 331–340. [DOI] [PubMed] [Google Scholar]
- 56.Aryal N, et al. , Fate of Environmental Pollutants: A Review. Water Environment Research, 2020. 92(10): p. 1587–1594. [DOI] [PubMed] [Google Scholar]
- 57.Kim S-K, et al. , Indoor and Outdoor Poly- and Perfluoroalkyl Substances (PFASs) in Korea Determined by Passive Air Sampler. Environmental Pollution, 2012. 162: p. 144–150. [DOI] [PubMed] [Google Scholar]
- 58.Rauert C, et al. , Atmospheric Concentrations and Trends of Poly-and Perfluoroalkyl Substances (PFAS) and Volatile Methyl Siloxanes (VMS) Over 7 Years of Sampling in the Global Atmospheric Passive Sampling (GAPS) Network. Environmental Pollution, 2018. 238: p. 94–102. [DOI] [PubMed] [Google Scholar]
- 59.Stoiber T, Evans S, and Naidenko OV, Disposal of products and materials containing per- and polyfluoroalkyl substances (PFAS): A cyclical problem. Chemosphere, 2020. 260: p. 127659. [DOI] [PubMed] [Google Scholar]
- 60.Lin H, et al. , Per- and Polyfluoroalkyl Substances in the Atmospheric Total Suspended Particles in Karachi, Pakistan: Profiles, Potential Sources, and Daily Intake Estimates. Chemosphere, 2022. 288: p. 132432. [DOI] [PubMed] [Google Scholar]
- 61.Zhang H, et al. , Determination of Hexachlorobutadiene, Pentachlorobenzene, and Hexachlorobenzene in Waste Incineration Fly Ash Using Ultrasonic Extraction Followed by Column Cleanup and GC-MS Analysis. Anal Bioanal Chem, 2018. 410(7): p. 1893–1902. [DOI] [PubMed] [Google Scholar]
- 62.Qin L, et al. , Thermal Degradation of Medical Plastic Waste by In-Situ FTIR, TG-MS and TG-GC/MS Coupled Analyses. Journal of Analytical and Applied Pyrolysis, 2018. 136: p. 132–145. [Google Scholar]
- 63.González-Vila FJ, et al. , Pyrolysis–GC–MS Analysis of the Formation and Degradation Stages of Charred Residues from Lignocellulosic Biomass. Journal of Agricultural and Food Chemistry, 2001. 49(3): p. 1128–1131. [DOI] [PubMed] [Google Scholar]
- 64.Liu Z, et al. , A Simple GC-MS/MS Method for Determination of Smoke Taint-Related Volatile Phenols in Grapes. Metabolites, 2020. 10(7): p. 294. [DOI] [PMC free article] [PubMed] [Google Scholar]
- 65.Favell JW, et al. , Development and Evaluation of a Vineyard-Based Strategy To Mitigate Smoke-Taint in Wine Grapes. Journal of Agricultural and Food Chemistry, 2019. 67(51): p. 14137–14142. [DOI] [PubMed] [Google Scholar]
- 66.Matti Maricq M, Chemical Characterization of Particulate Emissions from Diesel Engines: A Review. Journal of Aerosol Science, 2007. 38(11): p. 1079–1118. [Google Scholar]
- 67.Griffiths SD, et al. , A Study of Particulate Emissions During 23 Major Industrial Fires: Implications for Human Health. Environment International, 2018. 112: p. 310–323. [DOI] [PubMed] [Google Scholar]
- 68.Meegoda JN, et al. , A Review of the Applications, Environmental Release, and Remediation Technologies of Per- and Polyfluoroalkyl Substances. International journal of environmental research and public health, 2020. 17(21): p. 8117. [DOI] [PMC free article] [PubMed] [Google Scholar]
- 69.Simonnet-Laprade C, et al. , Biomagnification of perfluoroalkyl acids (PFAAs) in the food web of an urban river: assessment of the trophic transfer of targeted and unknown precursors and implications. Environmental Science: Processes & Impacts, 2019. 21(11): p. 1864–1874. [DOI] [PubMed] [Google Scholar]
- 70.Tow EW, et al. , Managing and treating per- and polyfluoroalkyl substances (PFAS) in membrane concentrates. AWWA Water Science, 2021. 3(5): p. e1233. [DOI] [PMC free article] [PubMed] [Google Scholar]
Associated Data
This section collects any data citations, data availability statements, or supplementary materials included in this article.