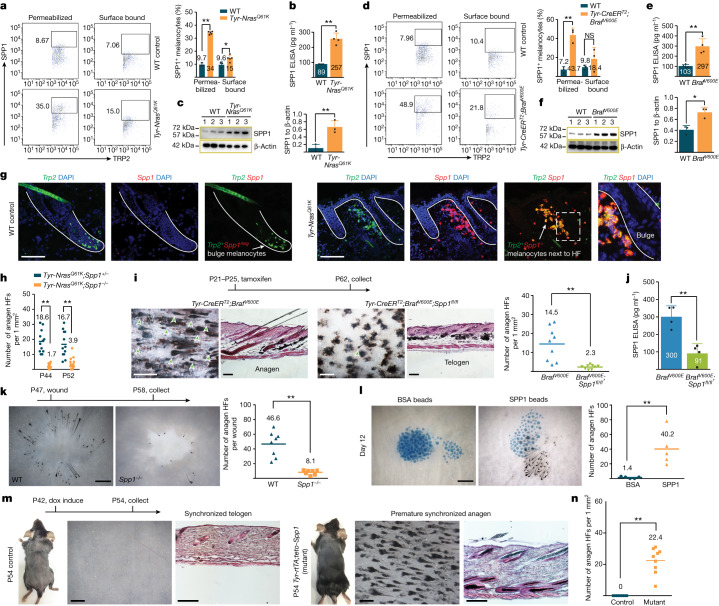
Fig. 3. Secretome of nevus melanocytes contains SPP1 that promotes hair growth.
a,d, On cytometry, SPP1 was increased in P56 Tyr-NrasQ61K (a) and P69 Tyr-CreERT2;BrafV600E (d) melanocytes. In a, for the permeabilized condition, n = 3 in WT and n = 5 in Tyr-NrasQ61K (P = 0.000000115); for the surface-bound condition, n = 3 in WT and n = 5 in Tyr-NrasQ61K (P = 0.0257). In d, for the permeabilized condition, n = 3 (P = 0.001397); for the surface-bound condition, n = 3 (P = 0.2888). See Extended Data Fig. 4. c,f, On western blot, SPP1 levels were increased in P56 Tyr-NrasQ61K (c) and P69 Tyr-CreERT2;BrafV600E (f) melanocytes. In c, n = 3; P = 0.00784. In f, n = 3; P = 0.0109. Uncropped gels are shown in Supplementary Fig. 1. b,e, On ELISA, SPP1 levels increased in day 5 cultures of P56 Tyr-NrasQ61K (b) and P69 Tyr-CreERT2;BrafV600E (e) melanocytes. In b, n = 3 in WT and n = 4 in Tyr-NrasQ61K; P = 0.00072. In e, n = 4; P = 0.00224. See Extended Data Fig. 4e. g, Unlike WT, Tyr-NrasQ61K skin contained Trp2+Spp1+ melanocytes adjacent to HF bulges. h, Anagen HF quantification in Tyr-NrasQ61K;Spp1−/− versus Tyr-NrasQ61K;Spp1+/− control mice. At P44, n = 12 in control and n = 14 in Tyr-NrasQ61K;Spp1−/− (P = 0.0000000191); at P56, n = 12 in control and n = 15 in Tyr-NrasQ61K;Spp1−/− (P = 0.0000195). i, Tyr-CreERT2;BrafV600E;Spp1fl/fl mice showed hair cycle quiescence rescue. Representative samples (left) and quantification (right) are displayed. n = 9; P = 0.000731. Arrowheads mark anagen HFs. j, On ELISA, SPP1 levels were reduced in day 5 cultures of Tyr-CreERT2;BrafV600E;Spp1fl/fl versus Tyr-CreERT2;BrafV600E melanocytes. n = 4; P = 0.00242. k, Spp1−/− mice showed reduced wound-induced hair growth. Representative samples (left) and quantification (right) are displayed. n = 8 in WT and n = 7 in Spp1−/−; P = 0.0000575. l, Unlike BSA-soaked beads (blue), SPP1-soaked beads induced anagen in WT skin 12 days after injection. Representative samples (left) and quantification (right) are displayed. n = 5; P = 0.00562. m,n, Unlike control, doxycycline (dox)-treated P54 Tyr-rtTA;tetO-Spp1 mice displayed premature anagen. Representative mice (m) and quantification (n) are displayed. In n, n = 9; P = 0.000000377. In b,c,e,f,j, n refers to independent experiments. In a,d,h,i,k,l,n, n refers to biologically independent samples. Data are mean ± s.d. P values were calculated using unpaired two-tailed Student’s t-test. NS, P ≥ 0.05, *P ≤ 0.05 and **P ≤ 0.01. Scale bars, 100 μm (g), 200 μm (histology; i,m) and 500 μm (wholemount; i,k,l,m).

