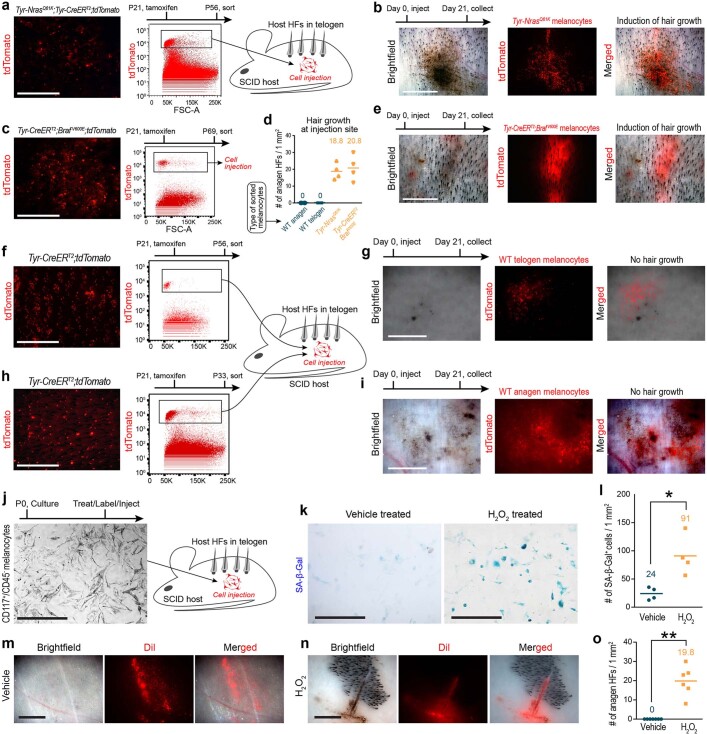
Extended Data Fig. 3. Nevus melanocytes and senescent melanocytes stimulate new hair growth.
a–i, Melanocyte grafting experiments, in which melanocyte lineage cells were isolated as tdTomato+ cells from mice that contain Tyr-CreERT2 and tdTomato constructs, and that were induced with tamoxifen at P21. a–e, tdTomato+ melanocytes were isolated from P56 Tyr-NrasQ61K;Tyr-CreERT2;tdTomato (a) and P69 Tyr-CreERT2;BrafV600E;tdTomato nevus mouse skin (c) and injected into SCID mouse skin. Both types of mutant melanocytes (b, e) induced anagen after 21 days. f–i, Control melanocyte lineage cells were isolated from Tyr-CreERT2;tdTomato mice during telogen at P56 (f) and during anagen at P33 (h) and intradermally injected into telogen skin of SCID mice. Cells from both conditions (g, i) did not induce ectopic anagen 21 days after injection. Representative samples are shown in (b, e, g, i). Anagen HFs for experiments from (b, e, g, i) are quantified in (d). In d, n = 4. j–o, H2O2-induced senescence experiment (j). Senescent status of H2O2-treated melanocytes was confirmed with senescent β-Gal staining (k, l). H2O2-treated (n), but not control DiI-labeled melanocytes (m) induced anagen 21 days after injection into SCID mice. Anagen HFs are quantified in (o). In l, n = 4; P = 0.0112. In o, n = 7 in vehicle, n = 6 in H2O2; P = 0.000024. In d, l, o, n = biologically independent samples. P values are calculated using unpaired two-tailed Student’s t-test. *P ≤ 0.05, **P ≤ 0.01. Scale bars, m, n – 1 mm; a, b, c, e, f–i – 2 mm; j, k – 200 μm.

