

SUMMARY
Disruption of adipocyte de novo lipogenesis (DNL) by deletion of fatty acid synthase (FASN) in mice induces browning in inguinal white adipose tissue (iWAT). However, adipocyte FASN knockout (KO) increases acetyl-coenzyme A (CoA) and malonyl-CoA in addition to depletion of palmitate. We explore which of these metabolite changes triggers adipose browning by generating eight adipose-selective KO mouse models with loss of ATP-citrate lyase (ACLY), acetyl-CoA carboxylase 1 (ACC1), ACC2, malonyl-CoA decarboxylase (MCD) or FASN, or dual KOs ACLY/FASN, ACC1/FASN, and ACC2/FASN. Preventing elevation of acetyl-CoA and malonyl-CoA by depletion of adipocyte ACLY or ACC1 in combination with FASN KO does not block the browning of iWAT. Conversely, elevating malonyl-CoA levels in MCD KO mice does not induce browning. Strikingly, adipose ACC1 KO induces a strong iWAT thermogenic response similar to FASN KO while also blocking malonyl-CoA and palmitate synthesis. Thus, ACC1 and FASN are strong suppressors of adipocyte thermogenesis through promoting lipid synthesis rather than modulating the DNL intermediates acetyl-CoA or malonyl-CoA.
Graphical abstract

In brief
Guilherme et al. generate several adipose-selective KO mouse models targeting each of the de novo lipogenesis enzymes to investigate their contributions to control of adipocyte thermogenesis. They show that disruption of palmitate synthesis caused by loss of adipocyte ACC1 or FASN upregulates UCP1 independent of alterations in acetyl-CoA or malonyl-CoA.
INTRODUCTION
Adipose tissue plays a central role in regulating systemic glucose and lipid homeostasis via multiple pathways.1–6 For example, it is thought that storage of surplus energy as triglycerides within lipid droplets in adipocytes prevents ectopic lipid accumulation in lean tissues, which can disrupt insulin sensitivity.1,7–9 Adipose tissue also secretes bioactive molecules known as adipokines and lipokines to communicate with other organs and modulate glucose tolerance.2,6,10–12 In addition, thermogenic beige adipocytes resident in white adipose tissue (WAT) can be activated to enhance energy expenditure and secrete additional bioactive factors, maintaining energy balance and improving glucose tolerance.3,13–15 In obesity, failure to properly maintain these adipocyte processes can lead to metabolic dysfunction and a number of pathological conditions, such as type 2 diabetes and its comorbidities. Therefore, the search for adipose-derived regulatory factors and better understanding of mechanisms underlying propagation of thermogenic beige adipocytes remain very active areas of investigation in the field of cardiometabolic disease research.
One established regulator of adipocyte browning is the enzyme fatty acid synthase (FASN) in the de novo lipogenesis (DNL) pathway, which catalyzes synthesis of palmitate from the precursor substrates acetyl-coenzyme A (CoA) and malonyl-CoA. Constitutive or inducible knockout of adipocyte FASN (cAdFASN KO or iAdFASN KO, respectively) causes the appearance of beige adipocytes within mouse inguinal WAT (iWAT) and enhances systemic glucose tolerance and fatty acid oxidation.16–19 Adipocyte-selective FASN KO in mice mimics cold exposure, which is the canonical cause of “browning” of WAT in rodents and humans. Upon cold exposure, norepinephrine (NE) released from adipose tissue sympathetic neuron fibers activates adipocyte β-adrenergic receptors (βARs) to stimulate the expression of many thermogenesis-related genes, including mitochondrial uncoupling protein 1 (UCP1).2,20,21 WAT sympathetic fibers are indispensable in this process because WAT sympathetic denervation inhibits this cold response.19,22,23 However, in iAdFASN KO mice, iWAT denervation does not disrupt the appearance of beige adipocytes, indicating that the triggering mechanism differs between these stimuli.19 Interestingly, caloric restriction, intermittent fasting, exercise,24–26 and a number of cell-derived metabolites12,27,28 also cause browning of WAT. The detailed molecular mechanisms at play in these various conditions that can enhance thermogenic adipose tissue are not fully understood.
A key question regarding how adipocyte FASN KO induces browning of iWAT is the identity of the perturbed metabolite in the DNL pathway that triggers the browning response. All three metabolites of DNL are modulated by FASN KO but in opposite directions. Acetyl-CoA and malonyl-CoA levels are elevated, while the FASN end product palmitate is greatly decreased.29,30 The primary source of acetyl-CoA for DNL and protein acetylation in mammalian cells is citrate, which is cleaved to form acetyl-CoA and oxaloacetate by ATP-citrate lyase (ACLY).31–34 However, the contribution of ACLY-derived acetyl-CoA to regulation of thermogenesis in beige adipocytes of iWAT has not been reported. Malonyl-CoA is a tightly regulated metabolic intermediate produced by acetyl-CoA carboxylases (ACC1 and ACC2) and consumed by malonyl-CoA decarboxylase (MCD), FASN, and the fatty acid elongases.35 Elevated levels of malonyl-CoA also promote lysine malonylation of multiple cellular proteins, as reported in cells of MCD-deficient patients.36,37 A recent study suggested that loss of FASN in endothelial cells impairs angiogenesis by causing elevated malonyl-CoA levels and malonylation of mechanistic target of rapamycin (mTOR) protein29 rather than by decreasing palmitate, but how elevated malonyl-CoA and global protein malonylation may impact white adipocyte functions has not been examined.
As the primary product of DNL, palmitate can be incorporated into triglycerides, complex bioactive lipids, and membrane phospholipids or participate in post-translational protein palmitoylation.38 Accordingly, FASN deficiency in skeletal muscle alters the sarcoplasmic reticulum’s phospholipid composition and transport functions.39 In addition, deletion of FASN from endothelial cells impairs endothelial nitric oxide synthase (eNOS) palmitoylation and nitric oxide (NO) production.40 However, the role of newly synthesized palmitate and subsequently derived fatty acids in adipocyte biology is particularly mysterious because their presumed function to become mostly stored in the form of triglyceride contrasts with data indicating that they contribute very little to that pathway in vivo.
Based on these considerations, the aim of the present study was to determine the contribution of each of the metabolites of DNL—acetyl-CoA, malonyl-CoA, and palmitate—to the browning of iWAT induced by adipocyte FASN KO. Specifically, we addressed whether FASN KO might regulate adipocyte thermogenesis via elevated acetyl-CoA or malonyl-CoA levels or through palmitate depletion. Employing a series of single- and double-adipocyte-selective KO mouse models that deplete enzymes involved in the generation or degradation of these metabolites, we could deduce that it is depletion of adipocyte palmitate that is necessary and sufficient to trigger the adipocyte browning response in vivo. Indeed, this study revealed that adipocyte-selective KO of ACC1, which inhibits palmitate synthesis without elevation in malonyl-CoA, also elicits the thermogenic response. These findings reveal that de novo endogenous fatty acid synthesis plays a central role in suppressing white adipocyte thermogenesis under room-temperature conditions and, therefore, in enhancing whole-body energy and metabolic homeostasis.
RESULTS
Blockade of adipocyte DNL by FASN KO elevates acetyl-CoA and malonyl-CoA accumulation
Initial experiments were conducted to examine whether deletion of FASN in adipocytes elevates acyl-lipid intermediates and protein acylation levels, similar to what has been reported in FASN-deficient hepatocytes and endothelial cells.29,30 Figures 1A and 1B show that loss of FASN in adipocytes enhances expression of the DNL enzymes ACLY and ACC, suggesting that accumulation of the intermediate metabolites acetyl-CoA and malonyl-CoA in FASN-depleted adipocytes may occur along with increased UCP1 expression. Consistent with the increased activity of these DNL enzymes and loss of FASN, targeted mass spectrometry-based analysis revealed an increase in acetyl-CoA and a trend of increased malonyl-CoA as well as a significant increase in the closely related metabolites acetyl carnitine and malonyl carnitine, accompanied by a significant decrease in palmitoyl carnitine and palmitoyl-CoA levels in iWAT from iAdFASN KO mice compared with FASN-fl/fl control mice (Figure 1C). We next investigated the impact of these metabolic changes on global protein malonylation and acetylation in iWAT from iAdFASN KO mice. As shown in Figures 1D and 1E, increases in lysine malonylation and lysine acetylation of multiple proteins were observed in adipose tissue depleted of FASN. Enhanced levels of malonylation and acetylation were detected in adipocytes but not in other adipose-resident cells present in iWAT (Figures 1D and 1E). Consistent with these observations, immunohistochemistry (IHC) analysis of iWAT from control and iAdFASN KO mice revealed strong detection of protein malonylation in multilocular adipocytes of iAdFASN KO but not in control wild-type mice (Figure 1F). Altogether, these results indicate that, along with reducing palmitate levels, loss of FASN also promotes accumulation of the intermediate acyl lipids and global protein acylation in adipocytes. These metabolic changes may contribute to browning elicited by iAdFASN KO (Figure 1G), a hypothesis that was tested in the experiments described below.
Figure 1. Ad FASN KO reduces palmitate but enhances acyl-CoA and global protein acylation levels along with the thermogenic program in iWAT.

(A) Immunoblot depicting FASN KO validation (FASN depletion) and enhanced DNL enzyme ACLY, ACC, and UCP1 expression in iWAT of iAdFASN KO mice. n = 3 mice per condition.
(B) qPCR depicting FASN KO validation (FASN mRNA depletion) and enhanced DNL enzyme ACLY, ACC1, ACC2, and UCP1 mRNA levels in iWAT of iAdFASN KO mice. n = 6–8 mice per condition. Depicted is the average of 6–8 mice per condition ± SEM.
(C) Mass spectrometry analysis revealed an increase in DNL intermediates and decrease in palmitate levels in iWAT from iAdFASN KO mice. Top: changes in levels of acetyl-carnitine, malonyl-carnitine/hydroxy-isovaleryl carnitine, and palmitoyl-carnitine in FASN-fl/fl control and iAdFASN KO mice. Bottom: changes in levels of acetyl-CoA, malonyl-CoA, and palmitoyl-CoA levels in FASN-fl/fl and iAdFASN KO mice. Fold Change (F.C.) on the y axis represents the amount of the indicated metabolite relative to that of the control group. Depicted is the average of 6 mice per condition ± SEM.
(D and E) Western blots using anti-malonyl-lysine and anti-acetyl-lysine antibodies to detect protein malonylation or acetylation in lysates from iWAT, Ads, or stromal vascular fraction (SVF) isolated from iWAT of control flox and iAdFASN KO mice. n = 3–4 mice per condition.
(F) IHC to detect global protein malonylation (malonyl-lysine antibody [Ab] staining) in iWAT from FASN-fl/fl control and iAdFASN KO mice. Scale bar, 100 μm
(G) DNL is a source of different lipid intermediates. Upon genetic deletion of FASN, palmitate synthesis is inhibited, while acyl-CoAs and global protein malonylation (K-Mal) are enhanced in Ads. Along with these lipid alterations, browning of iWAT is also noted.
In (B) and (C), *p < 0.05, **p < 0.01, ***p < 0.001, ****p < 0.0001, using unpaired Student’s t test.
Maintaining low acetyl-CoA in adipocytes of AdFASN KO mice fails to inhibit iWAT browning
To assess whether elevated acetyl-CoA mediates browning upon deletion of FASN, we generated inducible adipocyte-specific ACLY KO (iAdACLY KO) mice and inducible FASN-ACLY double-KO (iAdFASN-ACLY DKO) mice (Figures 2A and 2B). Consistent with the results in Figure 1C, metabolomics analysis of iWAT from iAdFASN KO mice revealed elevated levels of acetyl-CoA, acetyl-carnitine, and malonyl-carnitine and a trend of an increase in malonyl CoA, while palmitoyl-CoA and palmitoyl-carnitine were reduced. However, ablation of ACLY in adipocytes from iAdFASN KO mice suppressed accumulation of acetyl-CoA and acetyl-carnitine but not malonyl-CoA or malonyl-carnitine (Figures 2C and 2D). As shown in Figures 2E–2H, loss of adipocyte FASN, but not ACLY, strongly induces UCP1 expression in iWAT. Importantly, in the absence of ACLY protein, the stimulatory effect of iAdFASN-KO on UCP1 expression in adipocytes is completely preserved (Figures 2E–2H) even though acetyl-CoA levels remain low (Figures 2C and 2D). Moreover, IHC analysis to detect UCP1 in iWAT from iAdFASN KO and iAdFASN-ACLY DKO mice indicates that loss of ACLY does not inhibit formation of UCP1+ multilocular adipocytes in iWAT of adipocyte (Ad) DKO mice (Figures 2H and S1B). Also, similar to inducible deletion of FASN in Ads, UCP1 expression in iWAT from cAdFASN KO mice was strongly upregulated. This effect was not inhibited by deleting ACLY in Ad of cAdFASN KO mice (Figure S1C). Thus, preventing acetyl-CoA from accumulating in Ads of AdFASN-KO mice does not block browning of iWAT.
Figure 2. Ad ACLY deficiency reduces acetyl-CoA levels but fails to block iWAT browning induced by FASN KO.

(A) The mouse line and experimental design applied to obtain these results. Genetic deletion of the indicated DNL gene was achieved by treating control, iAdFASN KO, iAdACLY KO, and iAd DKO mice with tamoxifen as indicated.
(B) Schematic depicting the effects of KO and DKO of the Ad DNL enzymes FASN and ACLY on WAT lipid metabolites and browning. Deletion of FASN, but not ACLY, promotes iWAT browning. Moreover, inactivation of ACLY reduces acetyl-CoA in FASN KO Ad s but does not prevent browning of iWAT.
(C and D) Mass spectrometry analysis revealed decreased acetyl-CoA and palmitate levels in iWAT from iAdFASN-ACLY DKO mice. Graphics show respective changes in the levels of acetyl-CoA, malonyl-CoA, and palmitoyl-CoA and levels of acetyl-carnitine, malonyl-carnitine/hydroxy-isovaleryl carnitine, and palmitoyl-carnitine in iWAT from the indicated KO mice. F.C. on the y axis represents the amount of the indicated metabolite relative to that of the control group. n = 11 mice per condition. The results are presented as means ± SEM. Two-way ANOVA test determined statistical significances between the indicated groups.
(E and F) ACLY protein inactivation in Ads does not affect browning of iWAT from iAdFASN KO mice (E). Western blots were used to detect FASN, ACLY, UCP1, and glyceraldehyde 3-phosphate dehydrogenase (GAPDH) proteins in iWAT from the indicated flox/flox controls, iAdFASN KO, iAdACLY KO, and double-KO (iAd DKO) mice. N = 3–5 mice per condition. Western blots using an anti-malonyl lysine Ab were used to detect protein malonylation in lysates of iWAT from the indicated mouse lines (F).
(G) Quantification (densitometry) from western blots shown in (E). Results represent means ± SEM. n = 3–5 mice per condition. Two-tailed Student t test determined the indicated statistical significance.
(H) Loss of ACLY does not prevent formation of UCP1+ multilocular Ad s in iWAT from iAdFASN KO mice. Immunohistochemistry was used to detect UCP1 in iWAT from flox-flox control, iAdFASN KO, iAdACLY KO, and iAd DKO mice. Scale bars, 100 μm.
In (C), (D), and (G), *p < 0.05, **p < 0.01, ***p < 0.001, ****p < 0.0001. See also Figure S1.
Enhancing malonyl-CoA and global protein malonylation levels in Ads failed to induce iWAT browning
Although inactivation of ACLY efficiently inhibited accumulation of acetyl-CoA in AdFASN KO Ads (Figure 2C), the increased levels of malonyl-CoA, malonyl-carnitine, and protein malonylation were not reduced (Figures 2C–2F and S1D). Therefore, it is plausible that malonyl-CoA accumulation, rather than acetyl-CoA, mediates thermogenesis in iWAT. To further investigate this idea, we engaged a strategy of adipose-specific deletion of MCD, which catalyzes degradation of malonyl-CoA to acetyl-CoA. MCD deficiency results in marked accumulation of malonyl-CoA and malonyl-carnitine,36,37 promoting lysine malonylation in proteins in human fibroblasts and mouse heart tissue.37,41 Mice harboring floxed alleles of the Mlycd gene (MCD-flox/flox) were crossed with adiponectin-Cre transgenic mice to generate an adipose-specific model of MCD deficiency (cAdMCD KO mice; Figures 3A, 3B, and S2). Reductions in MCD protein (Figure 3C) and MCD mRNA levels in WAT and interscapular brown adipose tissue (iBAT) depots were noted in cAd-MCD KO mice but not in liver or other tissues of MCD-flox/flox mice (Figure 3D). Importantly, similar to the Ads of cAdFASN KO mice, deficiency of MCD in Ads results in severalfold elevation of malonyl-carnitine and a trend of increases in malonyl-CoA and strongly promotes protein malonylation in iWAT and iBAT (Figures 3E, S3F and S3I). However, despite the marked accumulation of protein malonylation, loss of MCD in Ads failed to enhance UCP1 expression and promote formation of UCP1+ multilocular Ads in iWAT as cAdFASN KO does (Figures 3F–3H and S4L). Therefore, these results indicate that increases in malonyl-CoA and protein malonylation in Ads per se are not sufficient to elicit iWAT browning (Figure 3B). In addition, loss of MCD in Ads does not affect the DNL index (C16:0/C18:2 ratio) or free palmitate levels of iWAT, while both measurements are strongly reduced in iWAT of cAdFASN KO mice (Figure S3).
Figure 3. Inactivation of MCD in Ads enhances global protein malonylation but fails to promote iWAT browning.

(A) The flox-flox control mice (wild type) and the mouse lines with genetically deleted FASN or MCD enzymes through cAdFASN KO or cAdMCD KO mice to obtain the depicted results.
(B) The effects of Ad deletion of the MCD enzyme on WAT lipid metabolites and browning. Deletion of FASN, but not MCD, promotes iWAT browning. Importantly, elevation of malonyl-CoA levels upon inactivation of MCD in Ads is not sufficient to induce browning of iWAT.
(C) Western blots to detect MCD protein levels in iBAT from MCD-fl/fl and cAdMCD KO mice, using an anti-MCD Ab. Vinculin was used as a loading control. n = 5–6 mice per group.
(D) qPCR for MCD gene expression in epididymal WAT (eWAT), iBAT, and liver to validate Ad-specific MCD deletion. n = 6–8 per group. Depicted are means ± SEM. Two-tailed Student’s t-test determined the indicated statistical significance.
(E) Western blots using an anti-malonyl-lysine Ab to detect protein malonylation in lysates from iWAT from the indicated mouse lines. n = 6 mice per condition.
(F) Western blots to detect FASN, UCP1, and GAPDH protein in iWAT from the indicated flox/flox control, cAdFASN KO, and cAdMCD KO mice. n = 4–6 mice per group.
(G) qPCR for UCP1 mRNA expression in iWAT from control flox-flox, cAdFASN KO, and cAdMCD KO mice. Results are representative of 3 independent experiments. n = 10–13 mice per condition. Presented are means ± SEM. Statistical significance was determined by two-tailed Student’s t test.
(H) Loss of MCD does not induce formation of UCP1+ multilocular Ads in iWAT. IHC was performed to detect UCP1 in iWAT from control, cAdFASN KO, and cAdMCD KO mice. Scale bar, 100 μm.
In (D) and (G), *p < 0.05, **p < 0.01, ***p < 0.001, ****p < 0.0001. See also Figures S2, S3, and S4.
Loss of Ad ACC1 inhibits FA synthesis and promotes iWAT browning independent of malonyl-CoA accumulation
The results depicted in Figures 1, 2, and 3 indicate that elevated levels of acetyl-CoA, malonyl-CoA, or protein malonylation in Ads are not sufficient to promote iWAT browning. Therefore, we hypothesized that inhibition of palmitate synthesis in Ads may be sufficient to induce thermogenesis of iWAT independent of the levels of other intermediates. To test this possibility, we deleted the Acaca gene (ACC1) in Ads to suppress malonyl-CoA and palmitate synthesis (Figures 4A and 4B). Indeed, mass spectrometry analysis revealed marked suppression in malonyl-CoA and free palmitate levels in iWAT of adipose-specific ACC1 KO (cAdACC1 KO) mice (Figures S3B and S3F). Strikingly, as shown in Figures 4C–4E, loss of ACC1 in Ads strongly induces UCP1 expression in iWAT, resembling the iAdFASN KO phenotype and consistent with the hypothesis that depletion of palmitate in Ad s promotes thermogenesis in iWAT.
Figure 4. Ad ACC1 deficiency promotes iWAT browning.

(A) The mouse line genetically deleting the enzymes FASN, ACC1, or both through cAdFASN KO, cAdACC1 KO, or cAd DKO mice to obtain the depicted results.
(B) Schematic demonstrating the effects of KO and DKO of the Ad DNL enzymes FASN and ACC1 on WAT lipid metabolites and browning. Deletion of FASN and ACC1 promotes iWAT browning. In addition, reduction of malonyl-CoA upon inactivation of ACC1 in FASN KO Ads does not prevent browning of iWAT.
(C and D) ACC1 protein inactivation in Ads enhances UCP1 expression and does not affect browning of iWAT from cAdFASN-ACC1 DKO (cAd-DKO) mice.
(C) Western blots to detect FASN, ACC, UCP1, and Vinculin proteins in iWAT from the indicated flox/flox control, cAdFASN KO, cAdACC1 KO, and cAd DKO mice.
(D) Quantification (densitometry) from the western blots shown in (C). n = 6 to 10 mice per condition. Presented are means ± SEM. Statistical significance was determined by two-tailed Student’s t test.
(E) qPCR for FASN, ACC1, ACC2, and UCP1 gene expression in adipose tissue from control fl/fl, cAdFASN KO, cAdACC1 KO, and cAd DKO. n = 12 mice per group ± SEM. Presented are means ± SEM. Two-tailed Student’s t test determined statistical significance.
(F) Western blots using an anti-malonyl lysine Ab to detect protein malonylation in lysates from iWAT from the indicated mouse lines. n = 6 animals per group.
(G) Similar to cAdFASN KO, loss of ACC1 promotes formation of UCP1+ multilocular Ads in iWAT. Inactivation of ACC1 does not inhibit browning of iWAT from cAd DKO mice. IHC was used to detect UCP1 in iWAT from control, cAdFASN KO, cAdACC1 KO. and cAd DKO mice. Scale bars, 100 μm.
In (D) and (E), *p < 0.05, **p < 0.01, ***p < 0.001, ****p < 0.0001. See also Figures S3, S4, and S5.
We next investigated whether preventing malonyl-CoA and protein malonylation from accumulating in Ads deficient in FASN protein would affect the browning of iWAT. To this end, we created an adipose-specific FASN-ACC1 DKO (cAdFASN-ACC1 DKO) mouse line in which the enzymes ACC1 and FASN were genetically deleted in mature Ads (Figures 4A and 4B). Consistent with the results in Figures 1 and 2, immunoblotting to detect malonyl lysines in proteins in iWAT from cAdFASN KO mice revealed elevated levels of protein malonylation in FASN KO Ads (Figure 4F). Importantly, deficiency of ACC1 in FASN KO Ads strongly reduces the high levels of protein malonylation in these Ads (Figure 4F). As shown in Figures 4C–4E, however, the absence of ACC1 protein does not block induction of UCP1 expression in iWAT also depleted of FASN (Figures 4C–4E), although the browning is somewhat less marked. Furthermore, immunohistological analysis to detect UCP1+ cells in iWAT from cAdFASN KO, cAdACC1 KO, and cAdFASN-ACC1 DKO mice reveals that loss of ACC1 alone promotes formation of UCP1+, multilocular Ads in iWAT (Figures 4G and S4). In addition, inactivation of ACC1 in Ads also depleted of FASN does not suppress formation of beige cells, as noted in the iWAT samples of cAdFASN-ACC1 DKO mice (Figures 4G and S4). Thus, loss of ACC1 in Ads elicits browning of subcutaneous fat independent of malonyl-CoA and protein malonylation accumulation in association with inhibition of FA synthesis. Moreover, preventing malonyl-CoA production in Ads of cAdFASN KO mice does not block the browning of iWAT, although the extent of browning is less marked, based on the western blot and qPCR results.
ACC2 deficiency in Ads neither inhibits FA synthesis nor promotes iWAT browning
Despite sharing over 70% protein sequence identity and having the same enzymatic activity, ACC1 and ACC2 have distinct cellular roles. ACC1 is cytosolic and provides the malonyl-CoA substrate for fatty acid (FA) synthesis.42 In contrast, ACC2 is mitochondrial and provides malonyl-CoA to regulate fatty acid oxidation via inhibition of carnitine palmitoyltransferase 1.42 Based on these distinct cellular functions, we tested whether ACC2 activity in Ads regulates thermogenesis in iWAT, similar to ACC1 (Figure 4). For this purpose, we crossed adiponectin-Cre mice with ACC2-flox/flox mice and generated cAdACC2 KO mice. The cAdACC2 KO mice were also bred with cAdFASN KO mice to obtain a FASN-ACC2 DKO mouse line (cAdFASN-ACC2-DKO), in which the Acacb and Fasn genes were genetically deleted in mature Ads (Figures 5A and 5B). The effects of ACC2 inactivation on protein malonylation levels and iWAT browning were then evaluated.
Figure 5. ACC2 deficiency in Ads does not stimulate iWAT browning.

(A) The mouse line genetically deleting the enzymes FASN, ACC2, or both through cAdFASN KO, cAdACC2 KO, or cAd DKO mice to obtain the depicted results.
(B) The effects of KO and DKO of the Ad enzymes FASN and ACC2 on WAT lipid metabolites and browning. Deletion of FASN, but not ACC2, promotes iWAT browning. Reduction of malonyl-CoA upon inactivation of ACC2 in FASN KO Ads does not prevent browning of iWAT.
(C) ACC2 protein inactivation in Ads does not affect browning of iWAT from cAdFASN KO mice. Western blots were used to detect FASN, UCP1, and Vinculin proteins in iWAT from the indicated flox/flox control, cAdFASN KO, cAdACC2 KO, and cAd DKO mice. n = 6 per condition.
(D) Quantification (densitometry) from the western blots shown in (C). n = 6–10 mice per condition. Presented are means ± SEM. Statistical significance was determined by two-tailed Student’s t test.
(E) qPCR for FASN, ACC1, ACC2, and UCP1 gene expression in adipose tissue from control, cAdFASN KO, cAdACC1 KO, and cAd DKO mice. n = 6–10 mice per group. Means ± SEM are presented. Two-tailed Student’s t test was performed to determine statistical significance.
(F) Western blots using an anti-malonyl lysine Ab to detect protein malonylation in lysates from iWAT from the indicated mouse lines. The left panel shows the same gel image as in Figure 4F because it served as the same positive control. n = 6 per condition.
In (D) and (E), *p < 0.05, **p < 0.01, ***p < 0.001, ****p < 0.0001.
As shown in Figures 5C–5E, deletion of ACC2 in Ads failed to induce UCP1 expression in iWAT, contrasting with the strong browning phenotype caused by deficiency of ACC1 in Ads (Figures 4C–4E). Interestingly, similar to the effect of ACC1 KO on malonyl-lysine (Figure 4F), loss of ACC2 in FASN KO Ads also reduces the levels of protein malonylation in these cells (Figure 5F). Nevertheless, the absence of ACC2 does not affect expression of UCP1 in iWAT, as shown in Figures 5C–5E. Altogether, these results indicate that deficiency of ACC2 in Ads fails to promote browning in iWAT, contrasting with the thermogenic stimulation induced by ACC1 KO in Ads (Figures 4C–4E). Moreover, disruption of ACC2 does not significantly affect stimulation of the thermogenic program elicited by Ad FASN KO.
Loss of Ad FASN or ACC1, but not ACC2, reduces iWAT DNL
The results in Figures 2, 3, 4, and 5 indicate that neither acetyl-CoA nor malonyl-CoA but, rather, depletion of palmitate mediates browning of iWAT from cAdFASN KO. Because deficiency of FASN and ACC1, but not ACC2, in Ads promotes browning in iWAT, we postulate that loss of either FASN or ACC1, but not ACC2, would inhibit FA synthesis in Ads, if indeed depletion of palmitate stimulates browning. To assess this possibility, we used the [14C]-glucose tracer to measure the ex vivo rates of triglyceride (TG) and de novo FA synthesis in iWAT from cAdFASN KO, cAdACC1 KO, cAdACC2 KO, and their respective control-flox/flox mice.
As shown in Figure S5, glucose incorporation into total TGs, which mostly represents label in the glycerol moiety, was not significantly reduced in iWAT from any KO mouse line examined. However, labeled glucose conversion to TG-FAs was strongly inhibited in iWAT from cAdFASN KO and cAdACC1 KO mice but not from cAdACC2 KO mice (Figures 6A–6C). Moreover, double deletion of FASN and ACC1 or FASN and ACC2 does not further reduce the rates of FA synthesis in iWAT from these DKO mice (Figures 6E and 6F). Altogether, these results indicate that de novo palmitate production is severely diminished in Ads deficient in FASN or ACC1 but not in ACC2. Because inhibition of FASN and ACC1, but not ACC2, stimulates thermogenesis in Ads, these findings support the conclusion that suppression of FA synthesis in fat cells promotes browning in iWAT.
Figure 6. Loss of FASN or ACC1, but not ACC2, in Ads reduces de novo FA synthesis in iWAT.

(A–C) [14C]-glucose conversion into TG FAs was measured ex vivo in iWAT derived from (A) FASN-flox/flox and cAdFASN KO, (B) ACC1-flox/flox and cAdACC1 KO, and (C) ACC2-flox/flox and cAdACC2 KO mice. n = 10 mice per condition. Presented are means ± SEM. Two-tailed Student’s t test was used for statistical analysis between control and KO groups.
(D) The pathways of glucose conversion into glycerol-3-P and palmitate (highlighted) to produce TGs.
(E and F) [14C]-glucose incorporation into TG FAs measured ex vivo in iWAT from (E) FASN-ACC1-flox/flox and cAdFASN-ACC1 DKO and (F) FASN-ACC2-flox/flox and cAdFASN-ACC2 DKO mice. n = 10 mice per condition. Presented are means ± SEM. Two-tailed Student’s t test determined statistical significance.
In (A) and (D), *p < 0.05. See also Figure S5.
Transcriptomic profiling of iWAT in cAdFASN KO and cAdACC1 KO mice reveals extensive upregulation of the thermogenic program
To gain insight into the genomic alterations resulting from Ad FASN KO and ACC1 KO, transcriptome analyses were performed by RNA sequencing (RNA-seq) of iWAT from cAdFASN KO mice, cAdACC1 KO mice, and Ad DKO mice (Figure 7). Principal-component analyses showed distinct clustering of the control flox/flox groups versus the cAdFASN KO, cAdACC1 KO, and cAd DKO samples, indicating distinct gene expression profiles for each group (Figure S6). Differential gene expression comparison between each KO and corresponding control flox samples revealed 2,094, 1,487, and 201 significantly upregulated genes in iWAT from cAdFASN KO, cAdACC1 KO, and cAd DKO mice, respectively, including Ucp1 (Figures 7A–7C). These comparisons also showed several significantly downregulated genes in each KO sample. As expected, FASN, ACC1, or both genes are strongly suppressed in cAdFASN KO, cAdACC1 KO, and cAd DKO samples, respectively (Figures 7A–7C).
Figure 7. Transcriptome analysis of iWAT in cAdFASN KO, cAdACC1 KO, cAdFASN-ACC1 DKO mice with RNA-seq.
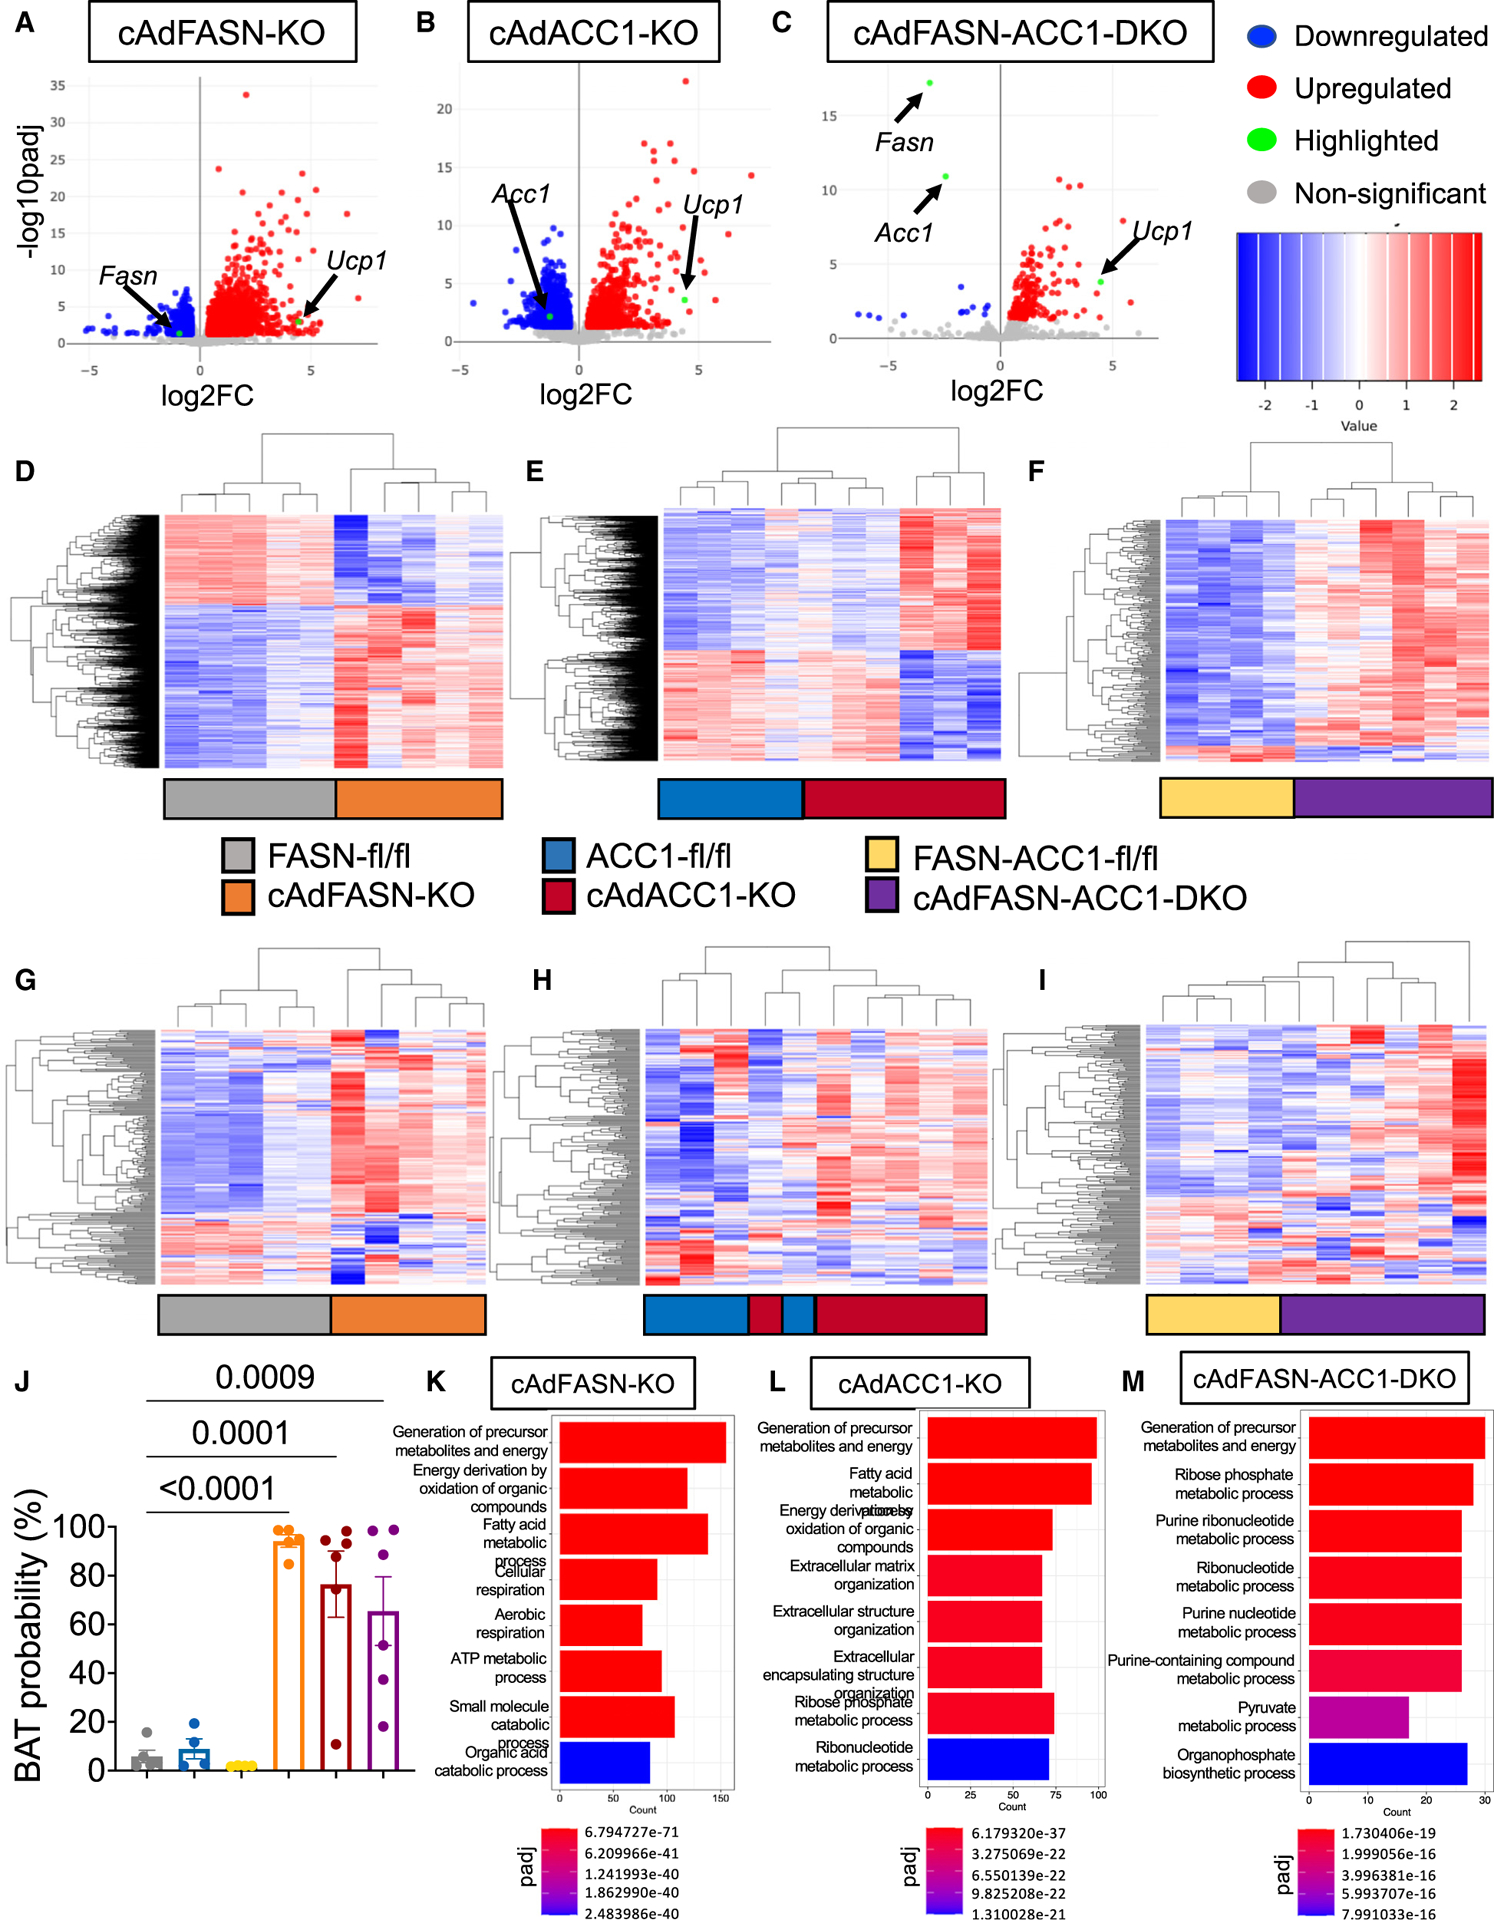
(A–C) Volcano plots of all differentially expressed genes, with blue, red, green, and gray illustrating downregulated, upregulated, highlighted, or not significantly differentially expressed genes, respectively. The three comparisons are cAdFASN KO vs. FASN-flox (left), cAdACC1 KO vs. ACC1-flox (center), and cAdFASN-ACC1 DKO vs. FASN-ACC1-DFlox (right). n = 6 mice per condition.
(D–F) Heatmaps of all differentially expressed genes with statistical significance, with blue and red illustrating downregulated or upregulated genes, respectively. The three comparisons are cAdFASN KO vs. FASN-flox (left), cAdACC1 KO vs. ACC1-flox (center), and cAdFASN-ACC1 DKO vs. FASN-ACC1-DFlox (right). (G–I) Heatmaps of all statistically significant differentially expressed genes associated with thermogenesis, with blue and red illustrating downregulated and upregulated genes, respectively. The three comparisons are cAdFASN KO vs. FASN-flox (left), cAdACC1 KO vs. ACC1-flox (center), and cAdFASN-ACC1 DKO vs. FASN-ACC1-DFlox (right). A list of genes in the heatmap is provided in the source data file.
(J) Browning potential based on the RNA-seq data in iWAT from FASN-flox, cAdFASN KO vs. ACC1-flox, cAd-ACC1 KO, FASN-ACC1-DFlox, and cAdFASNACC1 DKO mice, calculated with the ProFAT online tool. Bars denote mean and error bars denote mean ± SEM.
(K–M) GO enrichment pathway analysis of upregulated genes, depicting biological process association. The three comparisons are cAdFASN KO vs. FASN-flox (left), cAdACC1 KO vs. ACC1-flox (center), and cAdFASN-ACC1 DKO vs. FASN-ACC1-DFlox (right).
In (A)–(I) and (K)–(M), genes considered statistically differentially expressed based on padj < 0.05 and F.C. > 1.3 by likelihood ratio test (LRT) in DolphinNext. In (H), one-way ANOVA p < 0.0001, and multiple comparisons were performed using FASN-flox as a control, with Dunnett’s multiple-comparisons test in Prism GraphPad 9. In (K)–(M), enrichGO was performed in DolphinNext with cutoff p < 0.05. See also Figure S6.
Among the pathways associated with the top upregulated genes in Ads from FASN-, ACC1-, and FASN-ACC1-depleted mice are energy metabolism and FA metabolism and oxidation (Figures 7D–7F). In addition, a detailed pathway analysis of the upregulated genes revealed predicted functions, including adaptive thermogenesis and browning of WAT. Within the differentially expressed genes, 231 are associated with thermogenesis (Figures 7G–7I), most of which are found to be upregulated. Therefore, to assess the overall thermogenic potential, the ProFAT computational tool43 was applied to the cAdFASN KO, cAdACC1 KO, and cAd DKO groups of samples, and these analyses revealed 95%, 77%, and 66% “brown” Ad type probability in FASN, ACC1, and FASN-ACC1-deficient cells, respectively (Figure 7J). In contrast, the thermogenic potential from control flox samples ranged from 2% to only 8% brown probability (Figure 7J). Moreover, Gene Ontology (GO) enrichment analysis of upregulated genes revealed that metabolic programs associated with energy metabolism and FA oxidation were enriched in cAdFASN KO and cAd-ACC1 KO (Figures 7K–7M). Such processes are known to be characteristic of brown and beige Ads.44 Altogether, these results suggest that, by inhibiting DNL in Ads via inactivation of either FASN or ACC1, similar transcriptional and signaling mechanisms promote beige Ad formation in iWAT.
We next tested whether such stimulation of thermogenic genes in Ads lacking FASN or ACC1 would affect energy metabolism. To this end, metabolic cage studies were performed on cAdFASN KO, cAdACC1 KO, and control mice using indirect calorimetry and biochemical techniques. Body composition analysis by MRI revealed a lower proportion of body fat in cAd-FASN KO but not in cAdACC1 KO mice compared with control mice (Figure S7). Analyses of lean body mass and Ad sizes showed no significant differences between the KO and control mice (Figures S4 and S7). Moreover, food intake and locomotor activity were indistinguishable between each KO and its respective control (Figures S7J–S7M). We then examined the energy expenditure in these animals. Consistent with their described adipose browning phenotype, cAdFASN KO and cAdACC1 KO mice exhibited higher oxygen consumption and energy expenditure rates (Figure S7). Enrichment of the FA oxidation (FAO) pathway was detected in transcriptome analyses of FASN KO and ACC1 KO Ads, suggesting increased use of lipid in their energy production (Figures 7K–7L). Overall, these results indicate that beige Ad formation in iWAT from cAd-FASN KO or cAdACC1 KO mice enhances energy expenditure, improving their systemic metabolism.
DISCUSSION
The major findings presented here demonstrate that, in white Ads, FAs derived from the DNL pathway or complex lipids formed from such FAs strongly block the thermogenic program associated with appearance of beige Ads in iWAT. The DNL intermediates acetyl-CoA and malonyl-CoA as well as MalProteins are unlikely to be drivers of this browning effect based on data summarized here. Thus, deletion of ACLY in Ads reduces acetyl-CoA without preventing the browning induced by cAdFASN KO (Figure 2), and ACC1 deficiency, which blocks synthesis of malonyl-CoA, actually activated Ad browning (Figure 4). These data strongly suggest that acetyl-CoA, which promotes histone acetylation and controls the transcription of genes involved in Ad metabolism and thermogenesis,45,46 is unlikely to be involved in driving induction of Ad thermogenesis. Similarly, malonyl-CoA, which can inhibit the mitochondrial enzyme CPT1, suppressing FAO,47 and is involved in post-translational regulation of histone and non-histone proteins,48 is not a primary inducer of Ad browning.
Malonylation of proteins was of particular interest based on involvement of this post-translational modification in chromatin remodeling via modification of histones49,50 and in angiogenesis in endothelial cells through mTORC1 modification.29 Moreover, malonylation of GAPDH controls mRNA binding and expression of proinflammatory cytokines in macrophages.51 These recent studies, combined with our findings of marked elevation in protein malonylation in Ads deficient in FASN (Figures 1 and 2), prompted us to test whether malonyl-lysine mediates browning of iWAT. The results shown in Figures 3 and 4 clearly indicate that (1) elevated levels of malonyl-lysine are insufficient to drive browning and (2) suppression of malonyl-lysine modifications in Ads by depletion of FASN does not inhibit browning of iWAT. Thus, despite the striking accumulation of malonylated proteins in beige Ads depleted of FASN (Figure 1), this phenomenon does not drive the appearance of beige Ads in iWAT. It is possible that increased malonylation of proteins occurs as part of a cellular mechanism to reduce the levels of “free” malonyl-CoA, which has been suggested as a possible toxic intermediate at high concentrations.52,53 However, it is also possible that other metabolic processes and pathways in Ads might be controlled by malonyl-lysine modifications. If so, then the KO mouse lines generated in the course of the current study (Figures 3, 4 and 5) will be useful tools for future investigation of such mechanisms.
Based on our findings, one important conclusion is that depleting endogenous FAs through inactivation of FASN or ACC1 in Ads activates signals that stimulate thermogenesis in WAT. Although a mouse model of ACC1 KO in Ads has been reported in one earlier study,54 possible induction of beige cell formation by Ads devoid of ACC1 was not examined by the authors. Notably, the conditional ACC1 KO in this earlier study was driven by a Cre-aP2 mouse line and thus likely lacked full cell type selectivity because aP2 is expressed in additional cell types.55
The extent to which cAdFASN KO enhances the expression of UCP1 appears to be significantly greater than cAdACC1 KO in Ads (Figure 4), even though they appear to have similar effects on DNL ex vivo (Figure 6). The reasons for less browning caused by ACC1 deficiency are not fully understood, although the inability to strongly suppress the free FA pool in vivo may account for this. For instance, quantification in iWAT revealed more substantial depletion of free palmitate in AdFASN KO compared with AdACC1 KO (Figure S3). Thus, it is plausible that, in ACC1 KO Ads, alternative sources of malonyl-CoA provide substrates for palmitate production. Indeed, the recent identification of ACC-independent malonyl-CoA biosynthesis in other cells supports that possibility.56,57 Such pathways might operate in ACC1 KO Ads, preventing efficient FA depletion (Figure S3), thus accounting for the thermogenic differences between cAdACC1 KO and cAdFASN KO. Further investigations will be necessary to test this possibility.
An important question raised by our findings is how depletion of intracellular FAs activates the thermogenic program in Ads. Previous reports have suggested that endogenous FAs inhibit βAR-cyclic AMP (cAMP)-protein kinase A (PKA) signaling to induce UCP1 in white Ads58 and promote mitochondrial degradation and whitening of BAT.59 Accordingly, limiting FAs produced from lipolysis in white fat cells potentiates βAR stimulation to UCP1, while promoting intracellular FA accumulation blunts such stimulation.58 Mechanistically, it has been proposed that FAs interact with adenylyl cyclase (AC) to inhibit cAMP production,58,60,61 suggesting that reduction of intracellular FAs would favor AC activation and cAMP synthesis. Therefore, it is plausible that such stimulation of AC activity occurs in Ads deficient in FASN because of depletion of intracellular FAs. Consistent with this possibility, we have demonstrated previously that deletion of FASN in Ads stimulates cAMP-PKA signaling and that this signaling was essential for browning of iWAT mediated by FASN KO.17,19 Initial studies on FASN-depleted Ads suggested that a lipid intermediate dependent on FASN activity may be involved in Ad browning.16 Nonetheless, we have not demonstrated that induction of Ad thermogenesis is a cell-autonomous phenomenon, and the results in cAdFASN KO mice suggest that macrophages/phagocytes are required in vivo to induce browning.17,19 Thus, further experiments will be necessary to determine how inhibition of Ad palmitate synthesis mediates browning in cAdFASN KO mice and whether this is in part a cell-autonomous pathway in vivo.
In addition to acting as suppressors of β-AR-cAMP-PKA signaling in white Ads, endogenous FAs are essential for membrane biogenesis, organelle recycling, and cellular homeostasis,62 as highlighted in recent studies. One example is a report by Schlein et al.,59 showing that FA synthesis drives mitochondrial degradation, whitening, and involution of BAT at thermoneutral conditions. Thus, inhibiting FA synthesis through deletion of ChREBP or pharmacological inactivation of ACC activity in brown Ads prevents mitochondrial degradation and whitening of BAT at thermoneutrality.59 Overall, our recent findings are in agreement with the study from Schlein et al.59 because inhibition of FA synthesis in white Ads deficient in FASN or ACC1 attenuates autophagosome progression63 while favoring thermogenesis. Studies that inhibit autophagy by KO of Atg7, Atg5, and Atg12 in Ads also show a browning effect in vivo,64,65 but it is not clear whether FASN KO or ACC1 KO in our studies acts through this mechanism to cause Ad browning. In any case, the studies presented here indicate that inhibition of FA synthesis selectively in white Ad s is a potential therapeutic approach for activating thermogenesis in WAT, which, in turn, could lead to improved systemic metabolism.
Limitations of the study
Our conclusion that DNL-derived palmitate, its derivative FAs, or the complex lipids in which they reside account for suppression of the Ad thermogenic program is based on a combination of DNL gene KO and analyses of tissue metabolites and FAs. A limitation of this interpretation is that the latter analyses do not distinguish between the different cell types within adipose tissue. It is possible that changes in metabolites that we observe, or the lack of changes, are not specific to Ads within the tissue, given the many other cell types present. Our interpretations are likely correct, however, because DNL activity is particularly high in Ads compared with other cell types, and the changes we measure are elicited by Ad-selective gene KO. We also acknowledge that the DNL flux measurements we made were performed ex vivo and therefore may not exactly reflect such flux in vivo. While measuring DNL flux in vivo will be of great interest in future studies, such experiments are beyond the scope of the questions we address here. Also, while our findings appear to eliminate acetyl-CoA and malonyl-CoA and implicate palmitate or its derivative FAs and lipids in the WAT browning process, additional work addressing how DNL-derived lipids cause browning of WAT are needed for a complete understanding of this interesting phenomenon.
STAR⋆METHODS
RESOURCE AVAILABILITY
Lead contact
Further information and requests for resources and reagents should be directed to and will be fulfilled by the lead contact, Michael P. Czech (michael.czech@umassmed.edu).
Materials availability
All unique/stable reagents generated in this study are available from the lead contact with a completed materials transfer agreement.
Data and code availability
The RNA sequencing data generated in this study have been deposited in Sequencing Reads Archive (SRA) under BioProject accession number: PRJNA947210. The lipidomic data have been deposited on Mendeley, https://doi.org/10.17632/zsvnzhf4hv.2, https://data.mendeley.com/datasets/zsvnzhf4hv/2. These data are listed in the key resources table.
This paper does not report original code.
Any additional information required to reanalyze the data reported in this paper is available from the lead contact upon request.
KEY RESOURCES TABLE
| REAGENT or RESOURCE | SOURCE | IDENTIFIER | |
|---|---|---|---|
| Antibodies | |||
| Anti-Fatty Acid Synthase, Clone 23 | BD Bioscience | Cat# 610963; RRID:AB_398276 | |
| Anti-Fatty Acid Synthase (C20G5) Rabbit mAb | Cell Signaling Technology | Cat# 3180; RRID:AB_2100796 | |
| Anti-Vinculin (E1E9V) XP | Cell Signaling Technology | Cat# 18799; RRID:AB_2714181 | |
| Anti-GAPDH (D16H11)XP | Cell Signaling Technology | Cat# 8884; RRID:AB_11129865 | |
| Anti-ACC | Cell Signaling Technology | Cat# 3662; RRID:AB_2219400 | |
| Anti-UCP1 | Abcam | Cat# ab10983; RRID:AB_2241462 | |
| Anti-ACLY | Proteintech | Cat# 15421–1-AP; RRID:AB_2223741 | |
| Anti-MLYCD | Proteintech | Cat#15265–1-AP; RRID:AB_2146403 | |
| Anti-Ac-lysine (7F8) | Santa Cruz Biotechnology | Cat# sc-81623; RRID:AB_1118639 | |
| Pan anti-malonyllysine antibody | PTM Biolabs | Cat# PTM-901; RRID: AB_2687947 | |
| Anti-Rabbit IgG antibody, HRP-conjugated | Millipore | Cat# AP307P; RRID:AB_11212848 | |
| Anti-Mouse IgG antibody HRP-conjugated | Millipore | Cat# AP308P; RRID:AB_11215796 | |
| Chemicals, peptides, and recombinant proteins | |||
| Tamoxifen | Sigma-Aldrich | Cat# T5648 | |
| Tween 20 | Sigma Aldrich | Cat# P1379 | |
| Bovine serum albumin (fatty acid free) | Sigma-Aldrich | Cat# A8806 | |
| D-(+)-Glucose | Sigma-Aldrich | Cat# G8270 | |
| Sodium pyruvate | Gibco | Cat# 11360070 | |
| L-Glutamine | Gibco | Cat# 25030081 | |
| [14C]-U-Glucose | Perkin Elmer | Cat# NEC042X250UC | |
| Critical commercial assays | |||
| Enhanced Chemiluminescent Substrate it | Perkin Elmer | Cat# NEL104001EA | |
| iScript™ cDNA Synthesis Kit | Bio-Rad Laboratories | Cat# 1708891 | |
| iTaq Universal SYBR® Green Supermix | Bio-Rad Laboratories | Cat# 1725121 | |
| Deposited data | |||
| RNA-seq - accession number: PRJNA947210 | This paper | https://www.ncbi.nlm.nih.gov/bioproject/PRJNA947210 | |
| Lipidomics datasets, https://doi.org/10.17632/zsvnzhf4hv.2 | This paper | https://data.mendeley.com/datasets/zsvnzhf4hv/2 | |
| Experimental models: Organisms/strains | |||
| Mouse: cAdipoq-cre: B6;FVB-T(IAdipoq-cre)1Evdr/J | The Jackson Laboratory | Strain #010803; RRID: IMSR_JAX:010803 | |
| Mouse: Adipo-Cre: B6.129-Tg(Adipoq-cre/Esr1*)1Evdr/j | The Jackson Laboratory | Strain #024671; RRID: IMSR_JAX:024671 | |
| Mouse: Acl/’ox/flox) | Taconic Bioscience | Model #7917; RRID: IMSR_TAC:7917 | |
| Mouse: Acacafllox/flox) | The Jackson Laboratory | Strain # 030954; RRID: IMSR_JAX:030954 | |
| Mouse: Acacbfllox/flox) | The Jackson Laboratory | Strain #013042; RRID: IMSR_JAX:013042 | |
| Mouse: M/ycdfllox/flox) | Fisher-Wellman et al41 | N/A | |
| Mouse: Fasnfllox/flox) | Guilherme et al.17 | N/A | |
| Mouse: cAdACLYKO | This paper | N/A | |
| Mouse: iAdACLYKO, inducible | This paper | N/A | |
| Mouse: cAdACCIKO | This paper | N/A | |
| Mouse: cAdACC2KO | This paper | N/A | |
| Mouse: cAdMCDKO | This paper | N/A | |
| Mouse: cAdFASNKO | This paper | N/A | |
| Mouse: iAdFASNKO, inducible | Guilherme et al.17 | N/A | |
| Mouse: cAdFASNKO | This paper | N/A | |
| Mouse: cAdFASN-ACLYDKO | This paper | N/A | |
| Mouse: iAdFASN-ACLYDKO, inducible | This paper | N/A | |
| Mouse: cAdFASN-ACC1DKO | This paper | N/A | |
| Mouse: cAdFASN-ACC2DKO | This paper | N/A | |
| Oligonucleotides | |||
| Primers used for Real-time PCR reactions | See Table S1 | https://www.genewiz.com/en | |
| Software and algorithms | |||
| GraphPad Prism 9.5.1 | GraphPad | https://www.graphpad.com/ | |
| Image Lab 5 Analysis Software | Bio-Rad Laboratories | Iten# 1709690 | |
| ImageJ | ImageJ | ImageJ.nih.gov | |
| Adiposoft | Galarraga et al.66 | N/A | |
| CalR | Mina et al.67 | https://calrapp.org/ | |
| ProFAT | Cheng et al.43 | http://profat.genzentrum.lmu.de. | |
| Other | |||
| ChemiDoc™ XRS+ Imaging System | Bio-Rad Laboratories | Model# 1708265 | |
| Leica DM2500 LED optical microscope | Leica Microsystems | Model# DM2500 LED | |
| Leica MC170 HD camera | Leica Microsystems | Model# MC170 HD | |
EXPERIMENTAL MODEL AND SUBJECT DETAILS
Mice
All studies performed were approved by the institutional Animal Care and Use Committee (IACUC) of the University of Massachusetts Medical School (IACUC protocol no.202200006 to Michael P. Czech). Mice were housed at 20–22°C on a 12-h light/12-h dark cycle with ad libitum access to food and water. To selectively delete Fasn in adipocytes, mice with conditional Fasnflox/flox alleles16 were crossed to Adiponectin-Cre mice to generate the constitutive adipocyte-specific knockout mice referred to as cAdFASNKO. To inducibly knockout Fasn in adipocytes of adult mice, homozygous Fasnflox/flox animals were crossed to Adiponectin-Cre-ERT2 mice to generate the inducible adipocyte-specific knockout mice referred to as iAdFASNKO.17 At eight weeks of age, Fasn-flox/flox control and iAdFASNKO mice were treated with 1 mg of tamoxifen and 21 days later experiments were conducted. Acly floxed mice were purchased from Taconic Biosciences (model number 7917). To delete Acly in adipocytes from mice, homozygous Aclyflox/flox mice were crossed to Adiponectin-Cre mice to generate the adipose-specific Acly knockout mice, named as cAdACLYKO. Inducible deletion of Acly gene from adipocytes was obtained by crossing the homozygous Aclyflox/flox mice with to Adiponectin-Cre-ERT2 to create the Tamoxifen-inducible, adipocyte-specific, Acly knockout mice, referred to as iAdACLY-KO. To obtain the double knockout mouse model deleting Fasn and Acly genes in adipocytes, the AdFASNKO was bred with AdACLYKO mice to generate constitutive and inducible Ad-FASN-ACLYDKO mouse lines as indicated. The Acc1flox/flox conditional knockout mice possessing loxP sites flanking exons 22–26 of the Acaca (acetyl-Coenzyme A carboxylase alpha) gene, were obtained at Jackson Lab (strain number 030954). To delete ACC1 in adipocytes from mice, homozygous Acacaflox/flox mice were crossed to Adiponectin-Cre mice to generate the adipose specific ACC1 knockout mice, referred to as cAdACC1KO. The Acc2flox/flox conditional knockout mice possessing loxP sites flanking the biotin-binding motif exon (and the preceding exon) of the targeted locus of the Acacb (acetyl-Coenzyme A carboxylase beta) gene, were obtained at Jackson Lab (strain number 013042). Delete of Acacb gene in adipocytes from mice was achieved by crossing homozygous Acacbflox/flox mice to Adiponectin-Cre mice to generate the adipose specific ACC2 knockout mice, referred to as cAdACC2KO. To obtain the double knockout mouse models deleting Fasn and Acaca genes or Fasn and Acacb genes in adipocytes, the cAdFASNKO was either bred with cAdACC1KO mice or with the cAdACC2KO mice to generate the cAd-FASN-ACC1DKO or the cAd-FASN-ACC2DKO mouse lines respectively. The MCD-flox/flox mice41 were kindly provided by Debora Muoio’s Lab. The homozygous MCDflox/flox mouse were crossed with Adiponectin-Cre mouse to generate the adipose MCD knockout mice named here as cAdMCDKO mice. For the experiments described, mice were used from 8 to 16 weeks of age. Male mice were used for most of the experiments. However, female mice were used for the metabolic cage study, as indicated in the Figure legend.
METHOD DETAILS
Western blot analysis
Adipose tissues were homogenized and tissue lysate immunoblotted with the indicated antibodies. Total lysates were resolved by SDS-PAGE and electrotransferred to nitrocellulose membranes. Membranes were incubated with the indicated antibodies overnight at 4°C. Immunoblots were washed with TBST (0.2% Tween 20 in Tris-Buffered saline), incubated with horseradish peroxidase conjugated anti-mouse or anti-rabbit secondary antibody and visualized using enhanced chemiluminescent substrate kit (PerkinElmer).
RNA isolation and RT-qPCR
Total RNA was isolated from mouse tissue using Trizol Reagent following the manufacturer’s instructions. The isolated RNA was resuspended in RNase-free water and concentrations determined by Nanodrop 2000. cDNA was synthesized from 1 μg of isolated RNA using iScript cDNA Synthesis Kit (BioRad) according to manufacturer’s instructions for cDNA synthesis. Quantitative RT-PCR was performed using iQ SybrGreen supermix on a BioRad CFX97 RT-PCR system. Expression of genes was determined with the ΔΔCT method,68 using Rplp0 (36B4), βM2, and 18S served as housekeeping genes. Primer sequences used for qRT–PCR analyses were listed in Key Resource Table.
Acyl-CoAs and acylcarnitines measurements
To determine the levels of different acyl-CoAs or acylcarnitines present in iWAT, 50 mg of WAT samples were homogenized in isopropanol/KH2PO4 (1:1) buffer or 50% aqueous acetonitrile containing 0.3% formic acid buffer. Tissue samples were homogenized in bead beater Qiagen Tissue Lyser, set to a frequency of 30 oscillations/sec for a total of 3 min with one 5 mm bead per tube. The acetyl-CoA and malonyl-CoA present in tissue extracts were then analyzed by LC MS/MS method.69 Briefly, the extracts were spiked with 13C2-Acetyl-CoA (Sigma, MO, USA), centrifuged, and filtered through the Millipore Ultrafree-MC 0.1 μm centrifugal filters before being injected onto the Chromolith FastGradient RP-18e HPLC column, 50 3 2 mm (EMD Millipore) and analyzed on a Waters Xevo TQ-S triple quadrupole mass spectrometer coupled to a Waters Acquity UPLC system (Waters, Milford, MA).
To measure palmitoyl-CoA the levels in tissue extracts, palmitoyl-CoA were further purified by solid phase extraction70,71 and analyzed by flow injection analysis using positive electrospray ionization on a Waters TQD mass spectrometer equipped with Acquity UPLC system (Waters, Milford, MA) employing methanol/water (80/20, v/v) containing 30 mM ammonium hydroxide as the mobile phase. Spectra were acquired in the multichannel acquisition mode monitoring the neutral loss of 507 amu. heptadecanoyl CoA was used as an internal standard.
Acylcarnitine measurements were made by flow injection tandem mass spectrometry.72,73 The data were acquired using a Waters TQD mass spectrometer equipped with Acquity UPLC system and controlled by MassLynx 4.1 operating system (Waters, Milford, MA). Applying these methods, the obtained amounts of acylcarnitines per gram of iWAT from control mice were: acetyl-carnitine 31μM, malonyl-carnityne/hydroxy-isolaveryl-carnitine 0.68 μM and palmitoyl-carnitine 1.85 μM. The amounts of acyl-CoA levels per gram of iWAT from control mice were acetyl-CoA 521 pmol, malonyl-CoA 20.7 pmol and palmitoyl-CoA 202.5 pmol.
RNA-sequencing of iWAT
To determine the gene expression profile in iWAT of control-flox, cAdFASNKO, cAdACC1KO, and cAdFASN-ACC1 DKO samples, total RNA was isolated, DNase treated and submitted to Azenta/Genewiz for RNA sequencing (Illumina, RNA with PolyA selection). The data obtained were demultiplexed in the form of FASTQ files and the sequence alignments and quantification of gene expression levels were performed using the DolphinNext RNA-seq pipeline.14,74,75 Genes differentially expressed (DE) between two group of samples were identified using DESeq2 software, setting the parameters and applying the suitable test.76 In brief, the identification of enriched pathways based on DE genes found were acquired using BiomaRt EnrichGO routine, applaying the following parameters: orgDb = “org.Mm.eg.db”, pAdjustMethod = “fdr”, p valueCutoff = 0.05, ont = “BP”, and minGSSize = 10.77 The ClusterProfile78 simplify function were used to combine similar pathways and the top 8 pathways were then displayed as bar graphics and each pathway’s name manually specified. To generate heatmaps of selected genes, normalized values acquired by the DESeq2 counts function were used. The displayed values were standardized by each gene having its mean expression level subtracted and then divided by the gene’s standard deviation. The gplot package, via heatmap2 function, were employed to display the heatmap. Principal component analysis was applied to the normalized data (DESeq2 getNormalizedMatrix() with method = “MRN”) and the debrowser package’s run_pca() routine was used to calculate the principal components.79,80
Body composition and energy balance analysis
Whole-body fat and lean mass were noninvasively measured in 16 weeks old control flox, AdFASNKO and AdACC1KO female mice using 1H-MRS (Echo Medical Systems, Houston, TX). Energy balance was noninvasively measured using metabolic cages (TSE Systems, Chesterfield, MO) and indirect calorimetry to assess food and water intake, energy expenditure, respiratory exchange ratio, and physical activity for 3 days.81 The CalR app67,82 was used for the statistical analysis and data presentation of the metabolic cage studies.
Lipogenesis assay
To determine lipogenesis in white adipose tissue, iWAT explants from indicated mouse line were incubated with labeling media containing 0.2% fatty acid-free BSA, 0.5 mM d(+)-Glucose, 2 mM sodium pyruvate, 2 mM L-glutamine, and 2 μCi/mL [14C]-U-glucose. Adipose tissue explants were then incubated at 37°C in a humidified incubator (5% CO2) for 4.5 h before total neutral lipid extraction with Doley’s extraction mixture (80 mL isopropanol, 20 mL hexane, 2 mL of 1N H2SO4).17,83 Triglycerides (TG) were extracted with hexane, washed, and the solvent was evaporated and counted by liquid scintillation to determine 14C-glucose incorporation into total TG. The incorporation of 14C-glucose into fatty acids of TGs (TG-fatty acids) was determined by adding 1 mL KOH-ethanol (20 mL of 95% ethanol, 1 mL water, 1 mL saturated KOH) to evaporated total TG and heating samples to 80°C for 1 h. Then sulfuric acid was added to the mixture to ensure complete saponification. Addition of hexane allowed hydrophobic separation, which was evaporated and counted by liquid scintillation as TG-fatty acids.17,84,85
Lipidomics analysis
Lipid species were analyzed using multidimensional mass spectrometry-based shotgun lipidomic analysis.86 Briefly, adipose tissue homogenate containing 0.5 mg of protein (Pierce BCA assay) was accurately transferred to a disposable glass culture test tube. A premixture of lipid internal standards (IS) was added prior to conducting lipid extraction for quantification of the targeted lipid species. Lipid extraction was performed using a modified Bligh and Dyer procedure,87 and each lipid extract was reconstituted in chloroform:methanol (1:1, v:v) at a volume of 400 μL/mg protein. For shotgun lipidomics, lipid extract was further diluted to a final concentration of ~500 fmol total lipids per μL. Mass spectrometric analysis was performed on a triple quadrupole mass spectrometer (TSQ Altis, Thermo Fisher Scientific, San Jose, CA) which was equipped with an automated nanospray device (TriVersa NanoMate, Advion Bioscience Ltd., Ithaca, NY).88 Identification and quantification of lipid species were performed using an automated software program.89,90 Data processing (e.g., ion peak selection, baseline correction, data transfer, peak intensity comparison and quantitation) was performed and result was normalized to the protein content (nmol lipid/mg protein) or wet tissue weight (nmol lipid/mg tissue).
Histological analysis
For the immunohistochemistry (IHC), tissue samples were fixed in 4% paraformaldehyde and embedded in paraffin. Sectioned slides were then stained for hematoxylin and eosin (H&E), malonyl-lysine (PTM) and UCP1 (Abcam) at the UMass Medical School Morphology Core. The semi-quantification of UCP1 immunohistochemical staining in images were acquired by ImageJ software.91
Adipocyte size measurements
To determine the size of adipocytes in eWAT and iWAT from indicated mouse lines, tissues were harvested, sectioned and H&E stained. The sections were then analyzed with a Leica DM2500 LED optical microscope equipped with a Leica MC170 HD camera. Measurement of adipocyte size (as the area in μm2) was acquired using the morphometric Adiposoft (ImageJ) software.66 A total of 100 adipocytes per stained section was measured, with five images for each animal and five to six mice per condition. A total of 2500–3000 cells per group were studied.
QUANTIFICATION AND STATISTICAL ANALYSIS
For the statistical analysis of the data, GraphPad Prism 9.5.1 was used unless otherwise specified. For the statistical analysis and data presentation of the metabolic cage studies we used the CalR app. The statistical methods used for each analysis are described in the corresponding figure legend. The data are presented as means ± SEM. p values %0.05 were considered statistically significant.
Supplementary Material
Highlights.
Adipocyte FASN KO blocks lipid synthesis but increases malonyl-CoA and browning
Preventing malonyl-CoA elevation in FASN KO adipocytes does not inhibit browning
Conversely, elevating malonyl-CoA in adipocytes fails to induce browning
Loss of adipocyte FASN or ACC1 promotes browning by inhibiting FA synthesis
ACKNOWLEDGMENTS
We thank all members of Michael Czech’s lab for helpful discussions and critical reading of the manuscript. We thank the UMASS Morphology Core for assistance with immunohistochemistry analysis. We also would like to thank Dr. Lawrence M. Lifshitz, computer scientist of the Program in Molecular Medicine, UMass Chan Medical School, for excellent assistance with archiving the datasets in repositories. This work was supported by NIH grants DK116056, DK103047, and DK030898 to M.P.C.; DK124723 and DK121710 to C.B.N.; and 3DK089312 to D.M.M. The metabolic cage study was performed at the National Mouse Metabolic Phenotyping Center (MMPC) at UMass Chan Medical School, funded by NIH grant 5U2C-DK093000 to J.K.K. The graphical abstract was created with BioRender.
Footnotes
SUPPLEMENTAL INFORMATION
Supplemental information can be found online at https://doi.org/10.1016/j.celrep.2023.112488.
DECLARATION OF INTERESTS
The authors declare no competing interests.
REFERENCES
- 1.Guilherme A, Virbasius JV, Puri V, and Czech MP (2008). Adipocyte dysfunctions linking obesity to insulin resistance and type 2 diabetes. Nat. Rev. Mol. Cell Biol 9, 367–377. 10.1038/nrm2391. [DOI] [PMC free article] [PubMed] [Google Scholar]
- 2.Guilherme A, Henriques F, Bedard AH, and Czech MP (2019). Molecular pathways linking adipose innervation to insulin action in obesity and diabetes mellitus. Nat. Rev. Endocrinol 15, 207–225. 10.1038/s41574-019-0165-y. [DOI] [PMC free article] [PubMed] [Google Scholar]
- 3.Czech MP (2020). Mechanisms of insulin resistance related to white, beige, and brown adipocytes. Mol. Metab 34, 27–42. 10.1016/j.molmet.2019.12.014. [DOI] [PMC free article] [PubMed] [Google Scholar]
- 4.Villarroya F, Cereijo R, Villarroya J, and Giralt M (2017). Brown adipose tissue as a secretory organ. Nat. Rev. Endocrinol 13, 26–35. 10.1038/nrendo.2016.136. [DOI] [PubMed] [Google Scholar]
- 5.Santoro A, McGraw TE, and Kahn BB (2021). Insulin action in adipocytes, adipose remodeling, and systemic effects. Cell Metab. 33, 748–757. 10.1016/j.cmet.2021.03.019. [DOI] [PMC free article] [PubMed] [Google Scholar]
- 6.Funcke JB, and Scherer PE (2019). Beyond adiponectin and leptin: adipose tissue-derived mediators of inter-organ communication. J. Lipid Res 60, 1648–1684. 10.1194/jlr.R094060. [DOI] [PMC free article] [PubMed] [Google Scholar]
- 7.Czech MP, Tencerova M, Pedersen DJ, and Aouadi M (2013). Insulin signalling mechanisms for triacylglycerol storage. Diabetologia 56, 949–964. 10.1007/s00125-013-2869-1. [DOI] [PMC free article] [PubMed] [Google Scholar]
- 8.Mann JP, and Savage DB (2019). What lipodystrophies teach us about the metabolic syndrome. J. Clin. Invest 129, 4009–4021. 10.1172/JCI129190. [DOI] [PMC free article] [PubMed] [Google Scholar]
- 9.Montgomery MK, De Nardo W, and Watt MJ (2019). Impact of lipotoxicity on tissue “cross talk” and metabolic regulation. Physiology 34, 134–149. 10.1152/physiol.00037.2018. [DOI] [PubMed] [Google Scholar]
- 10.Scherer PE (2019). The many secret lives of adipocytes: implications for diabetes. Diabetologia 62, 223–232. 10.1007/s00125-018-4777-x. [DOI] [PMC free article] [PubMed] [Google Scholar]
- 11.Yilmaz M, Claiborn KC, and Hotamisligil GS (2016). De novo lipogenesis products and endogenous lipokines. Diabetes 65, 1800–1807. 10.2337/db16-0251. [DOI] [PMC free article] [PubMed] [Google Scholar]
- 12.Lynes MD, Leiria LO, Lundh M, Bartelt A, Shamsi F, Huang TL, Takahashi H, Hirshman MF, Schlein C, Lee A, et al. (2017). The cold-induced lipokine 12,13-diHOME promotes fatty acid transport into brown adipose tissue. Nat. Med 23, 631–637. 10.1038/nm.4297. [DOI] [PMC free article] [PubMed] [Google Scholar]
- 13.Min SY, Kady J, Nam M, Rojas-Rodriguez R, Berkenwald A, Kim JH, Noh HL, Kim JK, Cooper MP, Fitzgibbons T, et al. (2016). Human ‘brite/beige’ adipocytes develop from capillary networks, and their implantation improves metabolic homeostasis in mice. Nat. Med 22, 312–318. 10.1038/nm.4031. [DOI] [PMC free article] [PubMed] [Google Scholar]
- 14.Tsagkaraki E, Nicoloro SM, DeSouza T, Solivan-Rivera J, Desai A, Lifshitz LM, Shen Y, Kelly M, Guilherme A, Henriques F, et al. (2021). CRISPR-enhanced human adipocyte browning as cell therapy for metabolic disease. Nat. Commun 12, 6931. 10.1038/s41467-021-27190-y. [DOI] [PMC free article] [PubMed] [Google Scholar]
- 15.Klepac K, Georgiadi A, Tschöp M, and Herzig S (2019). The role of brown and beige adipose tissue in glycaemic control. Mol. Aspects Med 68, 90–100. 10.1016/j.mam.2019.07.001. [DOI] [PubMed] [Google Scholar]
- 16.Lodhi IJ, Yin L, Jensen-Urstad APL, Funai K, Coleman T, Baird JH, El Ramahi MK, Razani B, Song H, Fu-Hsu F, et al. (2012). Inhibiting adipose tissue lipogenesis reprograms thermogenesis and PPARgamma activation to decrease diet-induced obesity. Cell Metab. 16, 189–201. 10.1016/j.cmet.2012.06.013. [DOI] [PMC free article] [PubMed] [Google Scholar]
- 17.Guilherme A, Pedersen DJ, Henchey E, Henriques FS, Danai LV, Shen Y, Yenilmez B, Jung D, Kim JK, Lodhi IJ, et al. (2017). Adipocyte lipid synthesis coupled to neuronal control of thermogenic programming. Mol. Metab 6, 781–796. 10.1016/j.molmet.2017.05.012. [DOI] [PMC free article] [PubMed] [Google Scholar]
- 18.Guilherme A, Pedersen DJ, Henriques F, Bedard AH, Henchey E, Kelly M, Morgan DA, Rahmouni K, and Czech MP (2018). Neuronal modulation of brown adipose activity through perturbation of white adipocyte lipogenesis. Mol. Metab 16, 116–125. 10.1016/j.molmet.2018.06.014. [DOI] [PMC free article] [PubMed] [Google Scholar]
- 19.Henriques F, Bedard AH, Guilherme A, Kelly M, Chi J, Zhang P, Lifshitz LM, Bellvé K, Rowland LA, Yenilmez B, et al. (2020). Single-cell RNA profiling reveals adipocyte to macrophage signaling sufficient to enhance thermogenesis. Cell Rep. 32, 107998. 10.1016/j.celrep.2020.107998. [DOI] [PMC free article] [PubMed] [Google Scholar]
- 20.Cannon B, and Nedergaard J (2004). Brown adipose tissue: function and physiological significance. Physiol. Rev 84, 277–359. 10.1152/physrev.00015.2003. [DOI] [PubMed] [Google Scholar]
- 21.Ceddia RP, and Collins S (2020). A compendium of G-protein-coupled receptors and cyclic nucleotide regulation of adipose tissue metabolism and energy expenditure. Clin. Sci 134, 473–512. 10.1042/CS20190579. [DOI] [PMC free article] [PubMed] [Google Scholar]
- 22.Chi J, Wu Z, Choi CHJ, Nguyen L, Tegegne S, Ackerman SE, Crane A, Marchildon F, Tessier-Lavigne M, and Cohen P (2018). Three-Dimensional adipose tissue imaging reveals regional variation in beige fat biogenesis and PRDM16-dependent sympathetic neurite density. Cell Metab. 27, 226–236.e3. 10.1016/j.cmet.2017.12.011. [DOI] [PubMed] [Google Scholar]
- 23.Jiang H, Ding X, Cao Y, Wang H, and Zeng W (2017). Dense intraadipose sympathetic arborizations are essential for cold-induced beiging of mouse white adipose tissue. Cell Metab. 26, 686–692.e3. 10.1016/j.cmet.2017.08.016. [DOI] [PubMed] [Google Scholar]
- 24.Fabbiano S, Suárez-Zamorano N, Rigo D, Veyrat-Durebex C, Stevanovic Dokic A, Colin DJ, and Trajkovski M (2016). Caloric restriction leads to browning of white adipose tissue through type 2 immune signaling. Cell Metab. 24, 434–446. 10.1016/j.cmet.2016.07.023. [DOI] [PubMed] [Google Scholar]
- 25.Marinho T.d.S., Ornellas F, Aguila MB, and Mandarim-de-Lacerda CA (2020). Browning of the subcutaneous adipocytes in diet-induced obese mouse submitted to intermittent fasting. Mol. Cell. Endocrinol 513, 110872. 10.1016/j.mce.2020.110872. [DOI] [PubMed] [Google Scholar]
- 26.Severinsen MCK, Schéele C, and Pedersen BK (2020). Exercise and browning of white adipose tissue - a translational perspective. Curr. Opin. Pharmacol 52, 18–24. 10.1016/j.coph.2020.04.004. [DOI] [PubMed] [Google Scholar]
- 27.Roberts LD, Boström P, O’Sullivan JF, Schinzel RT, Lewis GD, Dejam A, Lee YK, Palma MJ, Calhoun S, Georgiadi A, et al. (2014). beta-Aminoisobutyric acid induces browning of white fat and hepatic beta-oxidation and is inversely correlated with cardiometabolic risk factors. Cell Metab. 19, 96–108. 10.1016/j.cmet.2013.12.003. [DOI] [PMC free article] [PubMed] [Google Scholar]
- 28.Carrière A, Jeanson Y, Berger-Müller S, André M, Chenouard V, Arnaud E, Barreau C, Walther R, Galinier A, Wdziekonski B, et al. (2014). Browning of white adipose cells by intermediate metabolites: an adaptive mechanism to alleviate redox pressure. Diabetes 63, 3253–3265. 10.2337/db13-1885. [DOI] [PubMed] [Google Scholar]
- 29.Bruning U, Morales-Rodriguez F, Kalucka J, Goveia J, Taverna F, Queiroz KCS, Dubois C, Cantelmo AR, Chen R, Loroch S, et al. (2018). Impairment of angiogenesis by fatty acid synthase inhibition involves mTOR malonylation. Cell Metab. 28, 866–880.e15. 10.1016/j.cmet.2018.07.019. [DOI] [PMC free article] [PubMed] [Google Scholar]
- 30.Chakravarthy MV, Pan Z, Zhu Y, Tordjman K, Schneider JG, Coleman T, Turk J, and Semenkovich CF (2005). New” hepatic fat activates PPARalpha to maintain glucose, lipid, and cholesterol homeostasis. Cell Metab. 1, 309–322. 10.1016/j.cmet.2005.04.002. [DOI] [PubMed] [Google Scholar]
- 31.Wellen KE, Hatzivassiliou G, Sachdeva UM, Bui TV, Cross JR, and Thompson CB (2009). ATP-citrate lyase links cellular metabolism to histone acetylation. Science 324, 1076–1080. 10.1126/science.1164097. [DOI] [PMC free article] [PubMed] [Google Scholar]
- 32.Carrer A, Parris JLD, Trefely S, Henry RA, Montgomery DC, Torres A, Viola JM, Kuo YM, Blair IA, Meier JL, et al. (2017). Impact of a high-fat diet on tissue acyl-CoA and histone acetylation levels. J. Biol. Chem 292, 3312–3322. 10.1074/jbc.M116.750620. [DOI] [PMC free article] [PubMed] [Google Scholar]
- 33.Zhao S, Torres A, Henry RA, Trefely S, Wallace M, Lee JV, Carrer A, Sengupta A, Campbell SL, Kuo YM, et al. (2016). ATP-citrate lyase controls a glucose-to-acetate metabolic switch. Cell Rep. 17, 1037–1052. 10.1016/j.celrep.2016.09.069. [DOI] [PMC free article] [PubMed] [Google Scholar]
- 34.Mariño G, Pietrocola F, Eisenberg T, Kong Y, Malik SA, Andryushkova A, Schroeder S, Pendl T, Harger A, Niso-Santano M, et al. (2014). Regulation of autophagy by cytosolic acetyl-coenzyme A. Mol. Cell 53, 710–725. 10.1016/j.molcel.2014.01.016. [DOI] [PubMed] [Google Scholar]
- 35.Fadó R, Rodríguez-Rodríguez R, and Casals N (2021). The return of malonyl-CoA to the brain: cognition and other stories. Prog. Lipid Res 81, 101071. 10.1016/j.plipres.2020.101071. [DOI] [PubMed] [Google Scholar]
- 36.Pougovkina O, Te Brinke H, Wanders RJA, Houten SM, and de Boer VCJ (2014). Aberrant protein acylation is a common observation in inborn errors of acyl-CoA metabolism. J. Inherit. Metab. Dis 37, 709–714. 10.1007/s10545-014-9684-9. [DOI] [PubMed] [Google Scholar]
- 37.Colak G, Pougovkina O, Dai L, Tan M, Te Brinke H, Huang H, Cheng Z, Park J, Wan X, Liu X, et al. (2015). Proteomic and biochemical studies of lysine malonylation suggest its malonic aciduria-associated regulatory role in mitochondrial function and fatty acid oxidation. Mol. Cell. Proteomics 14, 3056–3071. 10.1074/mcp.M115.048850. [DOI] [PMC free article] [PubMed] [Google Scholar]
- 38.Solinas G, Borén J, and Dulloo AG (2015). De novo lipogenesis in metabolic homeostasis: more friend than foe? Mol. Metab 4, 367–377. 10.1016/j.molmet.2015.03.004. [DOI] [PMC free article] [PubMed] [Google Scholar]
- 39.Funai K, Song H, Yin L, Lodhi IJ, Wei X, Yoshino J, Coleman T, and Semenkovich CF (2013). Muscle lipogenesis balances insulin sensitivity and strength through calcium signaling. J. Clin. Invest 123, 1229–1240. 10.1172/JCI65726. [DOI] [PMC free article] [PubMed] [Google Scholar]
- 40.Wei X, Schneider JG, Shenouda SM, Lee A, Towler DA, Chakravarthy MV, Vita JA, and Semenkovich CF (2011). De novo lipogenesis maintains vascular homeostasis through endothelial nitric-oxide synthase (eNOS) palmitoylation. J. Biol. Chem 286, 2933–2945. 10.1074/jbc.M110.193037. [DOI] [PMC free article] [PubMed] [Google Scholar]
- 41.Fisher-Wellman KH, Draper JA, Davidson MT, Williams AS, Narowski TM, Slentz DH, Ilkayeva OR, Stevens RD, Wagner GR, Najjar R, et al. (2019). Respiratory phenomics across multiple models of protein hyperacylation in cardiac mitochondria reveals a marginal impact on bioenergetics. Cell Rep. 26, 1557–1572.e8. 10.1016/j.celrep.2019.01.057. [DOI] [PMC free article] [PubMed] [Google Scholar]
- 42.Wang Y, Yu W, Li S, Guo D, He J, and Wang Y (2022). Acetyl-CoA carboxylases and diseases. Front. Oncol 12, 836058. 10.3389/fonc.2022.836058. [DOI] [PMC free article] [PubMed] [Google Scholar]
- 43.Cheng Y, Jiang L, Keipert S, Zhang S, Hauser A, Graf E, Strom T, Tschöp M, Jastroch M, and Perocchi F (2018). Prediction of adipose browning capacity by systematic integration of transcriptional profiles. Cell Rep. 23, 3112–3125. 10.1016/j.celrep.2018.05.021. [DOI] [PubMed] [Google Scholar]
- 44.Rosell M, Kaforou M, Frontini A, Okolo A, Chan YW, Nikolopoulou E, Millership S, Fenech ME, MacIntyre D, Turner JO, et al. (2014). Brown and white adipose tissues: intrinsic differences in gene expression and response to cold exposure in mice. Am. J. Physiol. Endocrinol. Metab 306, E945–E964. 10.1152/ajpendo.00473.2013. [DOI] [PMC free article] [PubMed] [Google Scholar]
- 45.Martinez Calejman C, Trefely S, Entwisle SW, Luciano A, Jung SM, Hsiao W, Torres A, Hung CM, Li H, Snyder NW, et al. (2020). mTORC2-AKT signaling to ATP-citrate lyase drives brown adipogenesis and de novo lipogenesis. Nat. Commun 11, 575. 10.1038/s41467-020-14430-w. [DOI] [PMC free article] [PubMed] [Google Scholar]
- 46.Ferrari A, Longo R, Fiorino E, Silva R, Mitro N, Cermenati G, Gilardi F, Desvergne B, Andolfo A, Magagnotti C, et al. (2017). HDAC3 is a molecular brake of the metabolic switch supporting white adipose tissue browning. Nat. Commun 8, 93. 10.1038/s41467-01700182-7. [DOI] [PMC free article] [PubMed] [Google Scholar]
- 47.Foster DW (2012). Malonyl-CoA: the regulator of fatty acid synthesis and oxidation. J. Clin. Invest 122, 1958–1959. 10.1172/jci63967. [DOI] [PMC free article] [PubMed] [Google Scholar]
- 48.Hirschey MD, and Zhao Y (2015). Metabolic regulation by lysine malonylation, succinylation, and glutarylation. Mol. Cell. Proteomics 14, 2308–2315. 10.1074/mcp.R114.046664. [DOI] [PMC free article] [PubMed] [Google Scholar]
- 49.Xie Z, Dai J, Dai L, Tan M, Cheng Z, Wu Y, Boeke JD, and Zhao Y (2012). Lysine succinylation and lysine malonylation in histones. Mol. Cell. Proteomics 11, 100–107. 10.1074/mcp.M111.015875. [DOI] [PMC free article] [PubMed] [Google Scholar]
- 50.Zhang Q, Cai T, Xiao Z, Li D, Wan C, Cui X, and Bai B (2020). Identification of histone malonylation in the human fetal brain and implications for diabetes-induced neural tube defects. Mol. Genet. Genomic Med 8, e1403. 10.1002/mgg3.1403. [DOI] [PMC free article] [PubMed] [Google Scholar]
- 51.Galván-Peña S, Carroll RG, Newman C, Hinchy EC, Palsson-McDermott E, Robinson EK, Covarrubias S, Nadin A, James AM, Haneklaus M, et al. (2019). Malonylation of GAPDH is an inflammatory signal in macrophages. Nat. Commun 10, 338. 10.1038/s41467-018-08187-6. [DOI] [PMC free article] [PubMed] [Google Scholar]
- 52.Pizer ES, Thupari J, Han WF, Pinn ML, Chrest FJ, Frehywot GL, Townsend CA, and Kuhajda FP (2000). Malonyl-coenzyme-A is a potential mediator of cytotoxicity induced by fatty-acid synthase inhibition in human breast cancer cells and xenografts. Cancer Res. 60, 213–218. [PubMed] [Google Scholar]
- 53.Zhou W, Tu Y, Simpson PJ, and Kuhajda FP (2009). Malonyl-CoA decarboxylase inhibition is selectively cytotoxic to human breast cancer cells. Oncogene 28, 2979–2987. 10.1038/onc.2009.160. [DOI] [PubMed] [Google Scholar]
- 54.Mao J, Yang T, Gu Z, Heird WC, Finegold MJ, Lee B, and Wakil SJ (2009). aP2-Cre-mediated inactivation of acetyl-CoA carboxylase 1 causes growth retardation and reduced lipid accumulation in adipose tissues. Proc. Natl. Acad. Sci. USA 106, 17576–17581. 10.1073/pnas.0909055106. [DOI] [PMC free article] [PubMed] [Google Scholar]
- 55.Lee KY, Russell SJ, Ussar S, Boucher J, Vernochet C, Mori MA, Smyth G, Rourk M, Cederquist C, Rosen ED, et al. (2013). Lessons on conditional gene targeting in mouse adipose tissue. Diabetes 62, 864–874. 10.2337/db12-1089. [DOI] [PMC free article] [PubMed] [Google Scholar]
- 56.Bowman CE, Rodriguez S, Selen Alpergin ES, Acoba MG, Zhao L, Hartung T, Claypool SM, Watkins PA, and Wolfgang MJ (2017). The mammalian malonyl-CoA synthetase ACSF3 is required for mitochondrial protein malonylation and metabolic efficiency. Cell Chem. Biol 24, 673–684.e4. 10.1016/j.chembiol.2017.04.009. [DOI] [PMC free article] [PubMed] [Google Scholar]
- 57.Liu B, Zhang Y, Cui Q, Wu S, Tang S, Chen Y, Ma Y, Liu W, and Tao Y (2022). An alternative malonyl-CoA producing pathway in nature. Preprint at bioRxiv. 10.1101/2022.10.28.514148. [DOI] [Google Scholar]
- 58.Mottillo EP, and Granneman JG (2011). Intracellular fatty acids suppress beta-adrenergic induction of PKA-targeted gene expression in white adipocytes. Am. J. Physiol. Endocrinol. Metab 301, E122–E131. 10.1152/ajpendo.00039.2011. [DOI] [PMC free article] [PubMed] [Google Scholar]
- 59.Schlein C, Fischer AW, Sass F, Worthmann A, Tödter K, Jaeckstein MY, Behrens J, Lynes MD, Kiebish MA, Narain NR, et al. (2021). Endogenous fatty acid synthesis drives Brown adipose tissue involution. Cell Rep. 34, 108624. 10.1016/j.celrep.2020.108624. [DOI] [PMC free article] [PubMed] [Google Scholar]
- 60.Nakamura J, Okamura N, Usuki S, and Bannai S (2001). Inhibition of adenylyl cyclase activity in brain membrane fractions by arachidonic acid and related unsaturated fatty acids. Arch. Biochem. Biophys 389, 68–76. 10.1006/abbi.2001.2315. [DOI] [PubMed] [Google Scholar]
- 61.Fain JN, and Shephard RE (1976). Inhibition of adenosine 3’:k’-monophosphate accumulation white fat acids, lactate, and beta-hydroxybutyrate. J. Lipid Res 17, 377–385. [PubMed] [Google Scholar]
- 62.Wallace M, and Metallo CM (2020). Tracing insights into de novo lipogenesis in liver and adipose tissues. Semin. Cell Dev. Biol 108, 65–71. 10.1016/j.semcdb.2020.02.012. [DOI] [PubMed] [Google Scholar]
- 63.Rowland LA, Guilherme A, Henriques F, DiMarzio C, Wetoska N, Kelly M, Reddig K, Hendricks G, Pan M, Han X, et al. (2022). De novo lipogenesis fuels adipocyte autophagosome membrane dynamics. Preprint at bioRxiv. 10.1101/2022.05.25.493413. [DOI] [PMC free article] [PubMed] [Google Scholar]
- 64.Singh R, Xiang Y, Wang Y, Baikati K, Cuervo AM, Luu YK, Tang Y, Pessin JE, Schwartz GJ, and Czaja MJ (2009). Autophagy regulates adipose mass and differentiation in mice. J. Clin. Invest 119, 3329–3339. 10.1172/JCI39228. [DOI] [PMC free article] [PubMed] [Google Scholar]
- 65.Altshuler-Keylin S, Shinoda K, Hasegawa Y, Ikeda K, Hong H, Kang Q, Yang Y, Perera RM, Debnath J, and Kajimura S (2016). Beige adipocyte maintenance is regulated by autophagy-induced mitochondrial clearance. Cell Metab 24, 402–419. 10.1016/j.cmet.2016.08.002. [DOI] [PMC free article] [PubMed] [Google Scholar]
- 66.Galarraga M, Campión J, Muñoz-Barrutia A, Boqué N, Moreno H, Martínez JA, Milagro F, and Ortiz-de-Solórzano C (2012). Adiposoft: automated software for the analysis of white adipose tissue cellularity in histological sections. J. Lipid Res 53, 2791–2796. 10.1194/jlr.D023788. [DOI] [PMC free article] [PubMed] [Google Scholar]
- 67.Mina AI, LeClair RA, LeClair KB, Cohen DE, Lantier L, and Banks AS (2018). CalR: a web-based analysis tool for indirect calorimetry experiments. Cell Metab. 28, 656–666.e1. 10.1016/j.cmet.2018.06.019. [DOI] [PMC free article] [PubMed] [Google Scholar]
- 68.Schmittgen TD, and Livak KJ (2008). Analyzing real-time PCR data by the comparative C(T) method. Nat. Protoc 3, 1101–1108. 10.1038/nprot.2008.73. [DOI] [PubMed] [Google Scholar]
- 69.Gao L, Chiou W, Tang H, Cheng X, Camp HS, and Burns DJ (2007). Simultaneous quantification of malonyl-CoA and several other short-chain acyl-CoAs in animal tissues by ion-pairing reversed-phase HPLC/MS. J. Chromatogr. B Analyt. Technol. Biomed. Life Sci 853, 303–313. 10.1016/j.jchromb.2007.03.029. [DOI] [PubMed] [Google Scholar]
- 70.Minkler PE, Kerner J, Ingalls ST, and Hoppel CL (2008). Novel isolation procedure for short-medium-and long-chain acyl-coenzyme A esters from tissue. Anal. Biochem 376, 275–276. 10.1016/j.ab.2008.02.022. [DOI] [PMC free article] [PubMed] [Google Scholar]
- 71.Klett EL, Chen S, Edin ML, Li LO, Ilkayeva O, Zeldin DC, Newgard CB, and Coleman RA (2013). Diminished acyl-CoA synthetase isoform 4 activity in INS 832/13 cells reduces cellular epoxyeicosatrienoic acid levels and results in impaired glucose-stimulated insulin secretion. J. Biol. Chem 288, 21618–21629. 10.1074/jbc.M113.481077. [DOI] [PMC free article] [PubMed] [Google Scholar]
- 72.An J, Muoio DM, Shiota M, Fujimoto Y, Cline GW, Shulman GI, Koves TR, Stevens R, Millington D, and Newgard CB (2004). Hepatic expression of malonyl-CoA decarboxylase reverses muscle, liver and whole-animal insulin resistance. Nat. Med 10, 268–274. 10.1038/nm995. [DOI] [PubMed] [Google Scholar]
- 73.Ferrara CT, Wang P, Neto EC, Stevens RD, Bain JR, Wenner BR, Ilkayeva OR, Keller MP, Blasiole DA, Kendziorski C, et al. (2008). Genetic networks of liver metabolism revealed by integration of metabolic and transcriptional profiling. PLoS Genet. 4, e1000034. 10.1371/journal.pgen.1000034. [DOI] [PMC free article] [PubMed] [Google Scholar]
- 74.Yukselen O, Turkyilmaz O, Ozturk AR, Garber M, and Kucukural A (2020). DolphinNext: a distributed data processing platform for high throughput genomics. BMC Genom. 21, 310. 10.1186/s12864-020-6714-x. [DOI] [PMC free article] [PubMed] [Google Scholar]
- 75.Bolger AM, Lohse M, and Usadel B (2014). Trimmomatic: a flexible trimmer for Illumina sequence data. Bioinformatics 30, 2114–2120. 10.1093/bioinformatics/btu170. [DOI] [PMC free article] [PubMed] [Google Scholar]
- 76.Love MI, Huber W, and Anders S (2014). Moderated estimation of fold change and dispersion for RNA-seq data with DESeq2. Genome Biol. 15, 550. 10.1186/s13059-014-0550-8. [DOI] [PMC free article] [PubMed] [Google Scholar]
- 77.Durinck S, Spellman PT, Birney E, and Huber W (2009). Mapping identifiers for the integration of genomic datasets with the R/Bioconductor package biomaRt. Nat. Protoc 4, 1184–1191. 10.1038/nprot.2009.97. [DOI] [PMC free article] [PubMed] [Google Scholar]
- 78.Yu G, Wang LG, Han Y, and He QY (2012). clusterProfiler: an R package for comparing biological themes among gene clusters. OMICS 16, 284–287. 10.1089/omi.2011.0118. [DOI] [PMC free article] [PubMed] [Google Scholar]
- 79.Durinck S, Moreau Y, Kasprzyk A, Davis S, De Moor B, Brazma A, and Huber W (2005). BioMart and Bioconductor: a powerful link between biological databases and microarray data analysis. Bioinformatics 21, 3439–3440. 10.1093/bioinformatics/bti525. [DOI] [PubMed] [Google Scholar]
- 80.Kucukural A, Yukselen O, Ozata DM, Moore MJ, and Garber M (2019). DEBrowser: interactive differential expression analysis and visualization tool for count data. BMC Genom. 20, 6. 10.1186/s12864-018-5362-x. [DOI] [PMC free article] [PubMed] [Google Scholar]
- 81.Dagdeviren S, Jung DY, Lee E, Friedline RH, Noh HL, Kim JH, Patel PR, Tsitsilianos N, Tsitsilianos AV, Tran DA, et al. (2016). Altered interleukin-10 signaling in skeletal muscle regulates obesity-mediated inflammation and insulin resistance. Mol. Cell Biol 36, 2956–2966. 10.1128/MCB.00181-16. [DOI] [PMC free article] [PubMed] [Google Scholar]
- 82.Corrigan JK, Ramachandran D, He Y, Palmer CJ, Jurczak MJ, Chen R, Li B, Friedline RH, Kim JK, Ramsey JJ, et al. (2020). A big-data approach to understanding metabolic rate and response to obesity in laboratory mice. Elife 9, e53560. 10.7554/eLife.53560. [DOI] [PMC free article] [PubMed] [Google Scholar]
- 83.Pedersen DJ, Guilherme A, Danai LV, Heyda L, Matevossian A, Cohen J, Nicoloro SM, Straubhaar J, Noh HL, Jung D, et al. (2015). A major role of insulin in promoting obesity-associated adipose tissue inflammation. Mol. Metab 4, 507–518. 10.1016/j.molmet.2015.04.003. [DOI] [PMC free article] [PubMed] [Google Scholar]
- 84.Guilherme A, Yenilmez B, Bedard AH, Henriques F, Liu D, Lee A, Goldstein L, Kelly M, Nicoloro SM, Chen M, et al. (2020). Control of adipocyte thermogenesis and lipogenesis through beta3-adrenergic and thyroid hormone signal integration. Cell Rep. 31, 107598. 10.1016/j.celrep.2020.107598. [DOI] [PMC free article] [PubMed] [Google Scholar]
- 85.Rodbell M (1964). Metabolism of isolated fat cells. I. Effects of hormones on glucose metabolism and lipolysis. J. Biol. Chem 239, 375–380. [PubMed] [Google Scholar]
- 86.Han X (2016). Lipidomics: Comprehensive Mass Spectrometry of Lipids (John Wiley & Sons, Inc.). [Google Scholar]
- 87.Wang M, and Han X (2014). Multidimensional mass spectrometry-based shotgun lipidomics. Methods Mol. Biol 1198, 203–220. 10.1007/978-1-4939-1258-2_13. [DOI] [PMC free article] [PubMed] [Google Scholar]
- 88.Han X, Yang K, and Gross RW (2008). Microfluidics-based electrospray ionization enhances the intrasource separation of lipid classes and extends identification of individual molecular species through multidimensional mass spectrometry: development of an automated high-throughput platform for shotgun lipidomics. Rapid Commun. Mass Spectrom 22, 2115–2124. 10.1002/rcm.3595. [DOI] [PMC free article] [PubMed] [Google Scholar]
- 89.Wang M, Wang C, Han RH, and Han X (2016). Novel advances in shotgun lipidomics for biology and medicine. Prog. Lipid Res 61, 83–108. 10.1016/j.plipres.2015.12.002. [DOI] [PMC free article] [PubMed] [Google Scholar]
- 90.Yang K, Cheng H, Gross RW, and Han X (2009). Automated lipid identification and quantification by multidimensional mass spectrometry-based shotgun lipidomics. Anal. Chem 81, 4356–4368. 10.1021/ac900241u. [DOI] [PMC free article] [PubMed] [Google Scholar]
- 91.Crowe AR, and Yue W (2019). Semi-quantitative determination of protein expression using immunohistochemistry staining and analysis: an integrated protocol. Bio. Protoc 9, e3465. 10.21769/Bio-Protoc.3465. [DOI] [PMC free article] [PubMed] [Google Scholar]
Associated Data
This section collects any data citations, data availability statements, or supplementary materials included in this article.
Supplementary Materials
Data Availability Statement
The RNA sequencing data generated in this study have been deposited in Sequencing Reads Archive (SRA) under BioProject accession number: PRJNA947210. The lipidomic data have been deposited on Mendeley, https://doi.org/10.17632/zsvnzhf4hv.2, https://data.mendeley.com/datasets/zsvnzhf4hv/2. These data are listed in the key resources table.
This paper does not report original code.
Any additional information required to reanalyze the data reported in this paper is available from the lead contact upon request.
KEY RESOURCES TABLE
| REAGENT or RESOURCE | SOURCE | IDENTIFIER | |
|---|---|---|---|
| Antibodies | |||
| Anti-Fatty Acid Synthase, Clone 23 | BD Bioscience | Cat# 610963; RRID:AB_398276 | |
| Anti-Fatty Acid Synthase (C20G5) Rabbit mAb | Cell Signaling Technology | Cat# 3180; RRID:AB_2100796 | |
| Anti-Vinculin (E1E9V) XP | Cell Signaling Technology | Cat# 18799; RRID:AB_2714181 | |
| Anti-GAPDH (D16H11)XP | Cell Signaling Technology | Cat# 8884; RRID:AB_11129865 | |
| Anti-ACC | Cell Signaling Technology | Cat# 3662; RRID:AB_2219400 | |
| Anti-UCP1 | Abcam | Cat# ab10983; RRID:AB_2241462 | |
| Anti-ACLY | Proteintech | Cat# 15421–1-AP; RRID:AB_2223741 | |
| Anti-MLYCD | Proteintech | Cat#15265–1-AP; RRID:AB_2146403 | |
| Anti-Ac-lysine (7F8) | Santa Cruz Biotechnology | Cat# sc-81623; RRID:AB_1118639 | |
| Pan anti-malonyllysine antibody | PTM Biolabs | Cat# PTM-901; RRID: AB_2687947 | |
| Anti-Rabbit IgG antibody, HRP-conjugated | Millipore | Cat# AP307P; RRID:AB_11212848 | |
| Anti-Mouse IgG antibody HRP-conjugated | Millipore | Cat# AP308P; RRID:AB_11215796 | |
| Chemicals, peptides, and recombinant proteins | |||
| Tamoxifen | Sigma-Aldrich | Cat# T5648 | |
| Tween 20 | Sigma Aldrich | Cat# P1379 | |
| Bovine serum albumin (fatty acid free) | Sigma-Aldrich | Cat# A8806 | |
| D-(+)-Glucose | Sigma-Aldrich | Cat# G8270 | |
| Sodium pyruvate | Gibco | Cat# 11360070 | |
| L-Glutamine | Gibco | Cat# 25030081 | |
| [14C]-U-Glucose | Perkin Elmer | Cat# NEC042X250UC | |
| Critical commercial assays | |||
| Enhanced Chemiluminescent Substrate it | Perkin Elmer | Cat# NEL104001EA | |
| iScript™ cDNA Synthesis Kit | Bio-Rad Laboratories | Cat# 1708891 | |
| iTaq Universal SYBR® Green Supermix | Bio-Rad Laboratories | Cat# 1725121 | |
| Deposited data | |||
| RNA-seq - accession number: PRJNA947210 | This paper | https://www.ncbi.nlm.nih.gov/bioproject/PRJNA947210 | |
| Lipidomics datasets, https://doi.org/10.17632/zsvnzhf4hv.2 | This paper | https://data.mendeley.com/datasets/zsvnzhf4hv/2 | |
| Experimental models: Organisms/strains | |||
| Mouse: cAdipoq-cre: B6;FVB-T(IAdipoq-cre)1Evdr/J | The Jackson Laboratory | Strain #010803; RRID: IMSR_JAX:010803 | |
| Mouse: Adipo-Cre: B6.129-Tg(Adipoq-cre/Esr1*)1Evdr/j | The Jackson Laboratory | Strain #024671; RRID: IMSR_JAX:024671 | |
| Mouse: Acl/’ox/flox) | Taconic Bioscience | Model #7917; RRID: IMSR_TAC:7917 | |
| Mouse: Acacafllox/flox) | The Jackson Laboratory | Strain # 030954; RRID: IMSR_JAX:030954 | |
| Mouse: Acacbfllox/flox) | The Jackson Laboratory | Strain #013042; RRID: IMSR_JAX:013042 | |
| Mouse: M/ycdfllox/flox) | Fisher-Wellman et al41 | N/A | |
| Mouse: Fasnfllox/flox) | Guilherme et al.17 | N/A | |
| Mouse: cAdACLYKO | This paper | N/A | |
| Mouse: iAdACLYKO, inducible | This paper | N/A | |
| Mouse: cAdACCIKO | This paper | N/A | |
| Mouse: cAdACC2KO | This paper | N/A | |
| Mouse: cAdMCDKO | This paper | N/A | |
| Mouse: cAdFASNKO | This paper | N/A | |
| Mouse: iAdFASNKO, inducible | Guilherme et al.17 | N/A | |
| Mouse: cAdFASNKO | This paper | N/A | |
| Mouse: cAdFASN-ACLYDKO | This paper | N/A | |
| Mouse: iAdFASN-ACLYDKO, inducible | This paper | N/A | |
| Mouse: cAdFASN-ACC1DKO | This paper | N/A | |
| Mouse: cAdFASN-ACC2DKO | This paper | N/A | |
| Oligonucleotides | |||
| Primers used for Real-time PCR reactions | See Table S1 | https://www.genewiz.com/en | |
| Software and algorithms | |||
| GraphPad Prism 9.5.1 | GraphPad | https://www.graphpad.com/ | |
| Image Lab 5 Analysis Software | Bio-Rad Laboratories | Iten# 1709690 | |
| ImageJ | ImageJ | ImageJ.nih.gov | |
| Adiposoft | Galarraga et al.66 | N/A | |
| CalR | Mina et al.67 | https://calrapp.org/ | |
| ProFAT | Cheng et al.43 | http://profat.genzentrum.lmu.de. | |
| Other | |||
| ChemiDoc™ XRS+ Imaging System | Bio-Rad Laboratories | Model# 1708265 | |
| Leica DM2500 LED optical microscope | Leica Microsystems | Model# DM2500 LED | |
| Leica MC170 HD camera | Leica Microsystems | Model# MC170 HD | |