

Abstract
Rationale & Objective:
Living in environments with low access to food may increase the risk of chronic diseases. We investigated the association of household distance to the nearest supermarket (as a measure of food access) with the incidence of hypertension, diabetes, and chronic kidney disease (CKD) in a metropolitan area of the United States.
Study Design:
Retrospective cohort study.
Setting & Participants:
777,994 individuals without hypertension, diabetes, or CKD at baseline within the HealthLNK Data Repository, which contains electronic health records from 7 health care institutions in Chicago, Illinois.
Exposure:
Zip code–level average distance between households and nearest supermarket.
Outcome:
Incidence of hypertension, diabetes, and CKD based on presence of ICD-9 code and/or blood pressure ≥ 140/90 mm Hg, hemoglobin A1c ≥ 6.5%, and eGFR < 60 mL/min/1.73m2, respectively.
Analytical Approach:
Average distance to nearest supermarket was aggregated from street-level metrics for 56 Chicagoland zip codes. The cumulative incidence of hypertension, diabetes, and CKD from 2007–2012 was calculated for each zip code in patients free of these diseases in 2006. Spatial analysis of food access and disease incidence was performed using bivariate local indicator of spatial association (BiLISA) maps and bivariate local Moran I statistics. The relationship between supermarket access and outcomes was analyzed using logistic regression.
Results:
Of 777,994 participants, 408,608 developed hypertension, 51,380 developed diabetes, and 56,365 developed CKD. There was significant spatial overlap between average distance to supermarket and incidence of hypertension and diabetes but not CKD. Zip codes with large average supermarket distances and high incidence of hypertension and diabetes were clustered in southern and western neighborhoods. Models adjusted only for neighborhood factors (zip code–level racial composition, access to vehicles, median income) revealed significant associations between zip code–level average distance to supermarket and chronic disease incidence. Relative to tertile 1 (shortest distance), ORs in tertiles 2 and 3, respectively, were 1.27 (95% CI, 1.23–1.30) and 1.38 (95% CI, 1.33–1.43) for diabetes, 1.03 (95% CI, 1.02–1.05) and 1.04 (95% CI, 1.02–1.06) for hypertension, and 1.18 (95% CI, 1.15–1.21) and 1.33 (95% CI, 1.29–1.37) for CKD. Models adjusted for demographic factors and health insurance showed significant and positive association with greater odds of incident diabetes (tertile 2: 1.29 [95% CI, 1.26–1.33]; tertile 3: 1.35 [95% CI, 1.31–1.39]) but lesser odds of hypertension (tertile 2: 0.95 [95% CI, 0.94–0.97]; tertile 3: 0.91 [95% CI, 0.89–0.92]) and CKD (tertile 2: 0.80 [95% CI, 0.78–0.82]; tertile 3: 0.73 [95% CI, 0.72–0.76]). After adjusting for both neighborhood and individual covariates, supermarket distance remained significantly associated with greater odds of diabetes and lesser odds of hypertension, but there was no significant association with CKD.
Limitations:
Unmeasured neighborhood and social confounding variables, zip code–level analysis, and limited individual-level information.
Conclusions:
There are significant disparities in supermarket proximity and incidence of hypertension, diabetes, and CKD in Chicago, Illinois. The relationship between supermarket access and chronic disease is largely explained by individual- and neighborhood-level factors.
Hypertension, diabetes, and chronic kidney disease (CKD) are leading contributors to excess health care costs, morbidity, and premature mortality in the United States.1–3 Substantial research has explored the complex biological and sociocontextual factors that contribute to these diseases and their associated clinical outcomes. Important factors like nutrition and dietary patterns interplay with income, education, neighborhood racial composition, neighborhood economic investment, and other social factors to influence disease development.4–12
To explore the connections between diet and chronic disease, efforts are underway to understand the effects of the built environment on access to healthy, nutritious food. The US Department of Agriculture (USDA) defines low food access urban areas as census tracts in which at least 500 people or 33% of the population live greater than one-half mile from a supermarket, super center, or large grocery store.13 These communities tend to have lower levels of income and education, higher proportions of Black and Latinx/Hispanic residents, and greater access to independent grocery stores and convenience stores than to chain and nonchain supermarkets. Relative to supermarkets, independent grocery stores often have higher prices, fewer and lower quality fruits and vegetables, and more energy-dense food options.14–17 Years of living in communities characterized by deprivation of resources and nutrition may increase residents’ risk of obesity, cardiovascular disease, and malignancy, and may reduce their life expectancy.18–20 However, few studies have investigated nutritious food access and incident chronic illness using electronic health data.
Merging electronic health record data from health centers across the city of Chicago with zip code–level grid mapping of supermarket access, we investigated associations between neighborhood food environments and the risk of incident hypertension, diabetes, and CKD. We hypothesized that zip codes with larger average distances to the nearest supermarket would have higher incidence of hypertension, diabetes, and CKD compared with zip codes with shorter average distances to the nearest supermarket.
Methods
Data Acquisition
We used data from the HealthLNK Data Repository (HDR), which contains electronic health records from 7 health care institutions in Chicago, Illinois: 4 large academic medical centers (Northwestern Medicine, Rush University Medical Center, University of Illinois at Chicago Medical Center, and University of Chicago Hospitals and Clinic), 1 large academic safety net health care system (Cook County Health and Hospitals System), and a network of community health centers with multiple care outlets (the Alliance of Chicago). The HDR uses a secure, Health Insurance Portability and Accountability Act–compliant, Secure Hash Algorithm-512 hashing algorithm and a probability-weighted, deterministic matching algorithm to create deduplicated, deidentified patient-level data linked across health care sites. The HDR includes data on patient demographics, insurance status, and zip code (collected at time of most recent visit), and longitudinal clinical data on approximately 5 million unique patients aged 18–89 years old residing in Chicago and its surrounding suburbs. Additional details regarding the creation of the HDR have been published.21 Institutional review board approval (no. STU00053183) was obtained at each participating site. Because deidentified data was used for the analysis, the study was conducted under a waiver of informed consent. The HDR currently contains records for encounters in 2006–2016. Our study used all data from 2006 to 2012 except for those from the Alliance of Chicago, which were unavailable at the time of our data acquisition.
From the HDR, we obtained individual-level demographic data from 2006–2007 including age, sex, race, ethnicity, insurance status (categorized by the most recent insurance type as Medicare, Medicaid, private insurance, self-pay, no charge, and other), and zip code of residence. We also retrieved the total number of patients in the HDR who resided in each zip code. We extracted data on hemoglobin A1c, systolic blood pressure (SBP), diastolic blood pressure (DBP), height, weight, body mass index (BMI), and estimated glomerular filtration rate (eGFR) from medical records from 2006–2012. <monospace>International Classification of Diseases, Ninth Revision</monospace> (ICD-9) codes from 2006–2012 were also obtained. The complete HDR data request is shown in Table S1. For each zip code, we obtained median household income.22 Neighborhood racial and ethnic composition and access to a vehicle were obtained from 2010 US census data.
Quantification of Supermarket Access
The primary measure of food accessibility was the average distance to the nearest supermarket. A supermarket was defined as a full-service store that (1) carried a diverse line of groceries including fresh produce, fresh meats, and a deli in addition to packaged and dry goods; and (2) contained 5 or more checkout lanes. The supermarket classification methodology was based on prior systematic surveys of all available food stores in Chicagoland communities in 2007 and 2011.23,24 In a subsequent study, we calculated the distance in feet between a residence’s street address and the street address of the nearest validated supermarket, including supermarkets in adjacent census tracts.25,26 We then reaggregated the street-level distances to calculate the average distance to the nearest supermarket for each Chicago zip code, using zip code as opposed to census tract to align with the HDR data.
Disease Determination and Incidence Calculation
Hypertension was defined as having a single systolic blood pressure recording greater than 140 mm Hg, a single diastolic blood pressure recording greater than 90 mm Hg, or having an ICD-9 code of 401.xx, 402.xx, 403.xx, or 404.xx. Diabetes was defined as having any hemoglobin A1c ≥ 6.5% or having an ICD-9 code of 250.xx. CKD was defined by a single eGFR of <60 mL/min/1.73 m2 (calculated using the 2009 CKD-EPI creatinine equation27) or an ICD-9 code of 585.xx or 586.00. A full list of the requested ICD-9 codes can be found in Table S1. To limit our analysis to incident cases of disease, we removed all participants from the individual analysis if they met criteria for hypertension, diabetes, or CKD at any point during 2006 and assessed new disease onset between 2007 and 2012.
Spatial and Statistical Analysis
We mapped the average distance to the nearest supermarket in 2007 for each Chicago zip code. We calculated means, SD, and percentages to describe participant baseline characteristics by tertiles of zip code–level supermarket distance. We calculated the cumulative incidence of hypertension, diabetes, and CKD by zip code from 2007 to 2012.
To investigate spatial relationships between food proximity and disease incidence, we constructed bivariate local indicator of spatial association (BiLISA) maps based on bivariate local Moran I statistics for average zip code distance to nearest supermarket and incident hypertension, diabetes, and CKD.28 The local Moran I statistic assessed whether a positive or negative spatial association between supermarket proximity and incidence of hypertension, diabetes, or CKD exists, with a value greater than 0 reflecting that zip codes with large or small average distances to the nearest supermarket were neighbored by zip codes with a similarly large or small incidence of hypertension, diabetes, or CKD. We defined a neighboring zip code as one that shares a border or vertex.
The BiLISA maps produced a visual analysis of zip code clustering based on the local Moran I statistic and determined whether the clustering was statistically significant. Statistically significant zip code clustering was established at a level of P < 0.05, based on 999 permutations of randomly reshuffling zip code supermarket access and zip code incidence of hypertension, diabetes, and CKD. This was based on the rationale that some clustering is possible with complete spatial randomness, but statistical significance occurs when clustering is greater than 95% of clustering found in 999 permutations of random zip code shuffling.28
The BiLISA maps identified statistically significant, “high-high” clustered zip codes in which zip codes with longer average distances to the nearest supermarket were neighbored by zip codes with a higher average incidence of disease. “Low-low” regions, conversely, were statistically significant clusters of zip codes with shorter distances to the nearest supermarket and a lower average incidence of disease. “High-low” outlier zip codes had a larger average supermarket distance and is bordered by zip codes with low incidence of the disease. By contrast, “low-high” outlier zip codes had a shorter average supermarket distance but is surrounded by zip codes with greater incidence of disease. To determine whether the differences in supermarket proximity and disease incidence between the “high-high” and other zip codes were statistically significant, we performed an analysis of variance and established statistical significance using P < 0.05. Spatial statistical analysis and mapping were performed in the open source software GeoDa.29
We determined the association between supermarket access and incidence of hypertension, diabetes, and CKD using logistic regression in which we adjusted for individual-level variables (race, ethnicity, age, sex, and insurance status) and zip code–level variables (median income, racial and ethnic composition, and vehicle access). Incident hypertension and diabetes were further adjusted in the CKD model. We modeled supermarket access as a continuous distance and in tertiles of distance, with the lowest tertile serving as the reference group. All analyses were performed using Stata 16 (StataCorp). A 2-tailed P < 0.05 was considered statistically significant.
Results
Participant Characteristics
The study included a total population of 777,994 unique participants obtained from the HDR who were free of hypertension, diabetes, and CKD at baseline (2006) and resided in 56 Chicago zip codes. We used the average distance to a supermarket in each zip code to categorize the zip codes into tertiles (with tertile 1 having the shortest distance); zip codes in tertiles 2 and 3 had average supermarket distances of 0.73 miles and 1.23 miles, respectively, which met the USDA criteria for low-access urban environments. Table 1 shows the baseline characteristics overall and by supermarket distance tertile. Compared with individuals in tertile 1 zip codes, a greater proportion of individuals in the upper tertiles were female and had Medicare or Medicaid. In terms of race and ethnicity, across the tertiles there was a relatively equal distribution of participants who were Hispanic, most of those in the highest tertiles were Black, and the majority of those in tertile 1 were White. Across tertiles, access to vehicles was relatively equal.
Table 1.
Participant Characteristics by Tertile of Supermarket Distance
| All Participants (N= 777,994) | Tertile 1 (n = 268,786) | Tertile 2 (n = 263,373) | Tertile 3 (n = 245,835) | |
|---|---|---|---|---|
| Distance to supermarket, miles | 0.79 ± 0.37 | 0.44 ± 0.99 | 0.73 ± 0.11 | 1.23 ± 0.29 |
| Individual Characteristics | ||||
| Age, y | 47.02 ± 16.77 | 45.35 ± 15.57 | 47.52 ± 16.99 | 48.32 ± 1 7.64 |
| Male sex | 42.30% | 44.65% | 42.76% | 39.07% |
| Racea | ||||
| White | 37.71% | 58.41% | 34.28% | 18.77% |
| Black | 37.70% | 10.87% | 39.37% | 65.26% |
| Hispanic | 7.90% | 9.51% | 8.91 % | 5.04% |
| Asian | 3.21% | 4.45% | 3.02% | 2.05% |
| Other | 1.08% | 1.49% | 0.97% | 0.74% |
| Unknown | 12.40% | 15.27% | 13.45% | 8.13% |
| Ethnicityb | ||||
| Hispanic | 14.66% | 16.73% | 16.42% | 10.51 % |
| Non-Hispanic | 85.34% | 83.27% | 83.58% | 89.49% |
| Insurance status | ||||
| Medicaid or Medicare | 24.50% | 14.35% | 25.66% | 33.28% |
| Private insurance | 43.70% | 54.84% | 39.89% | 35.61 % |
| No insurance | 31.80% | 30.81% | 34.45% | 31.11% |
| Neighborhood Characteristics | ||||
| Median incomec | ||||
| <$30,000 | 11.19% | 0 | 7.73% | 27.14% |
| $30,000–50,000 | 45.73% | 1 7.99% | 66.67% | 53.62% |
| $50,000–75,000 | 28.24% | 45.83% | 18.70% | 19.24% |
| >$75,000 | 14.85% | 36.18% | 6.91 % | 0 |
| Racial and ethnic compositiond | ||||
| White | 49.18% | 85.38% | 46.77% | 12.18% |
| Black | 34.46% | 0 | 31.31% | 75.50% |
| Hispanic | 15.96% | 22.15% | 18.45% | 6.55% |
| No vehicle accessd | 28.19% | 28.80% | 27.23% | 28.55% |
Distance refers to the average distance between a household and the nearest supermarket for each zip code.
Options in the HealthLNK Data Repository race field were American Indian/Alaskan Native, Asian, Black or African American, Hispanic or Latino, Native Hawaiian or Other Pacific Islander, White, Declined, Other.
Options in the HealthLNK Data Repository ethnicity field were Hispanic/Latino or non-Hispanic/Latino.
Obtained from Michigan Population Studies Center, expressed in US dollars.22
Obtained from the 2010 American Community Survey.
Spatial Analysis
The map in Figure 1 displays the zip code boundaries, with shading indicating the tertiles of zip code–average distance to the nearest supermarket in 2007. Zip codes in tertile 1 (the shortest distance to supermarkets) had an average distance of 0.27 to 0.60 miles and were in the northern parts of Chicago. Areas with the lowest access, in some places almost 2 miles to the nearest supermarket, were located primarily in southern and western neighborhoods.
Figure 1.
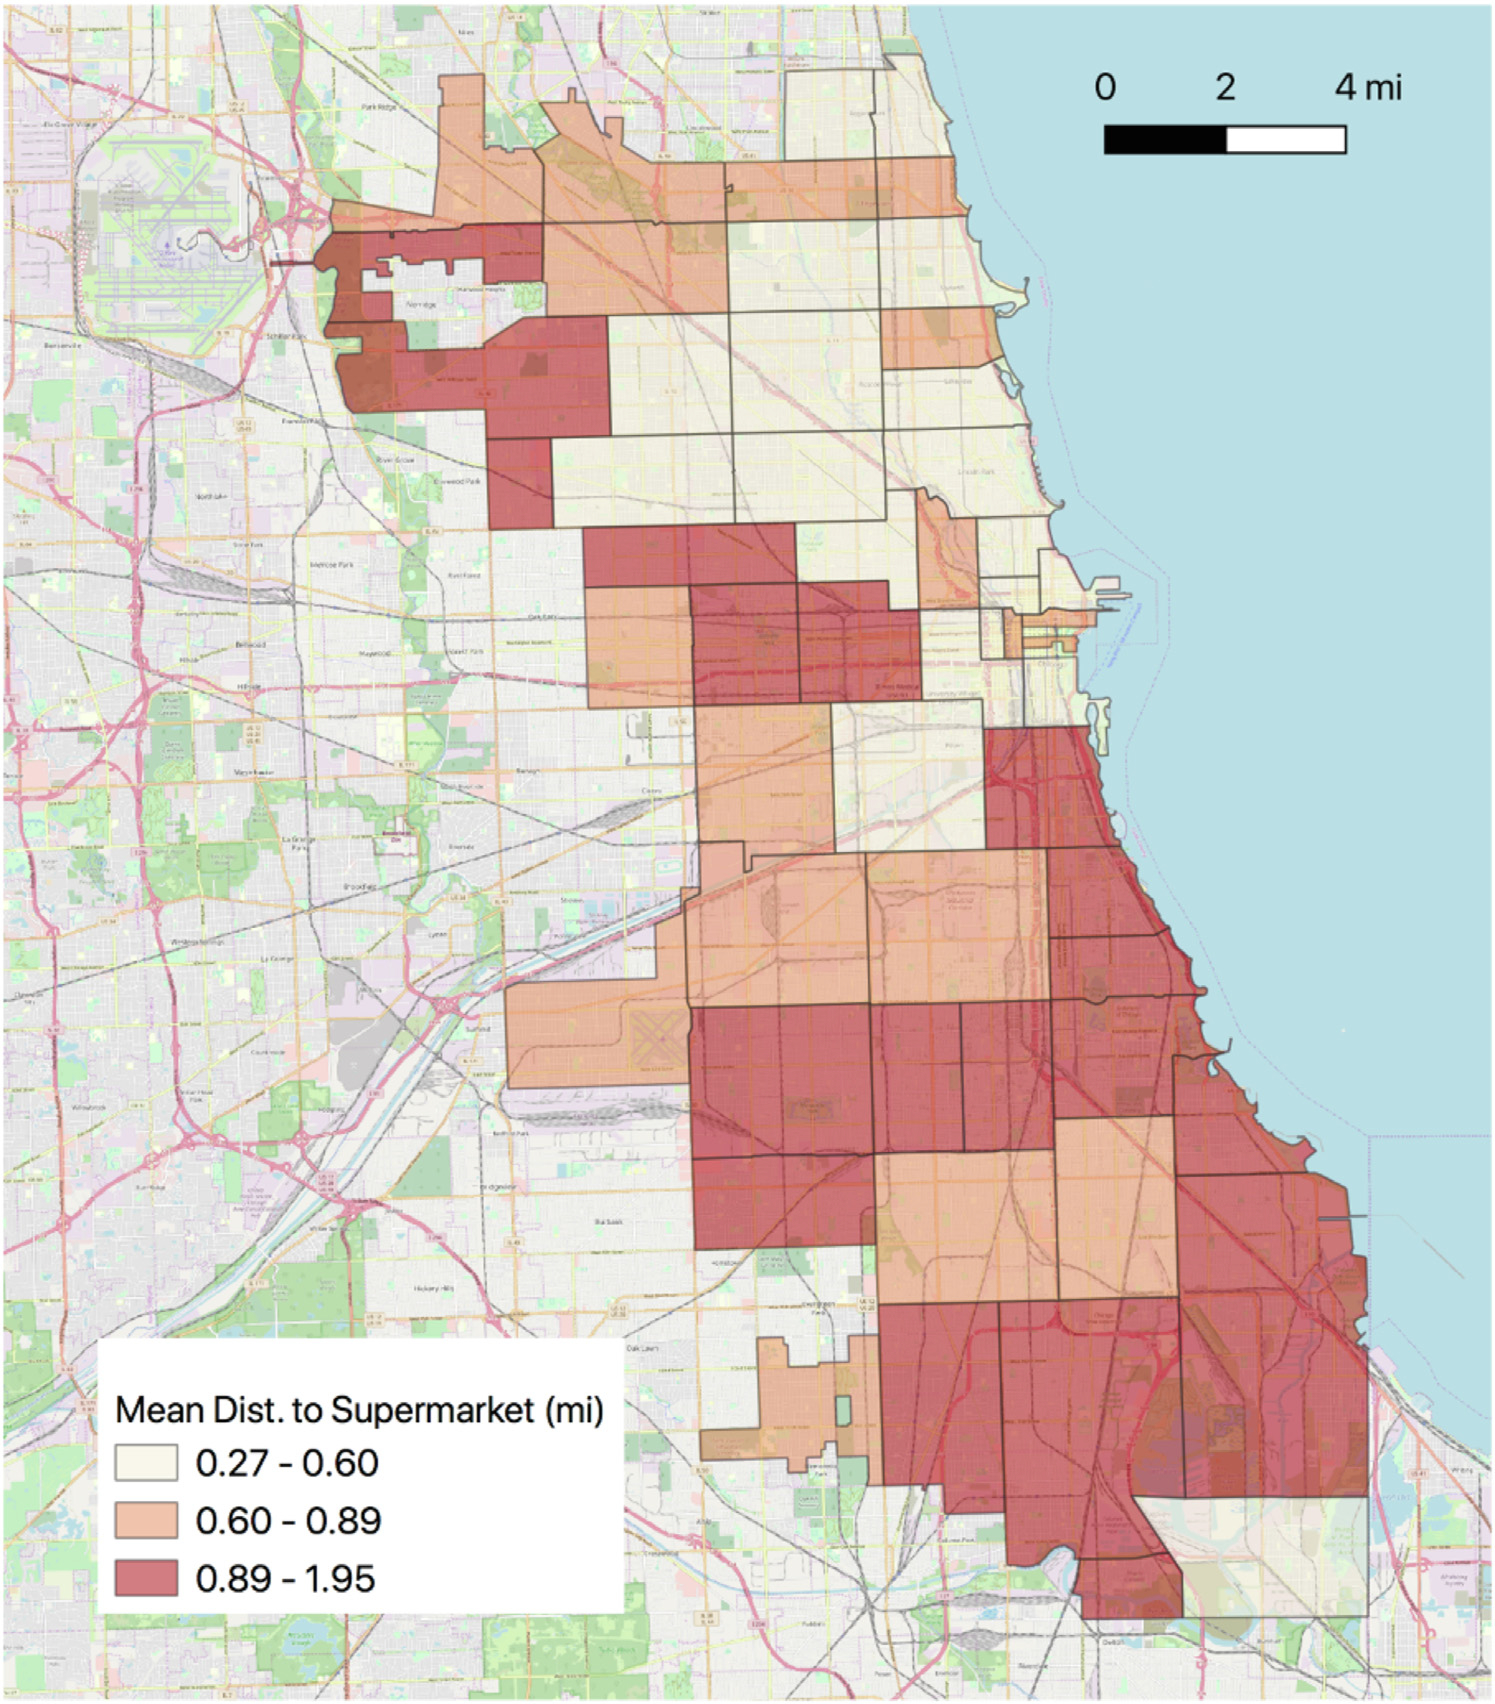
Map of Chicago zip codes with shading showing tertile of average distance to the nearest supermarket. Zip codes with longer supermarket distance have darker shading. Abbreviation: Dist, distance.
Food Access and Hypertension
The bivariate Moran I was significant and demonstrated a positive spatial autocorrelation for low food access and hypertension, indicating zip codes with large average distances to the nearest supermarket had neighboring zip codes with high average incidence of hypertension (Moran I = 0.45; z value = 6.21; pseudo P value = 0.001). Of the 56 zip codes, 10 had a significantly elevated incidence of hypertension and large average distances to the supermarket, noted as “high-high” zip codes (Fig 2). Table 2 shows that, compared with the other zip codes, the “high-high” zip codes had longer average distances to the nearest supermarket (1.26 ± 0.39 miles vs 0.73 ± 0.33 miles; P < 0.001) and a significantly higher incidence of hypertension (45 ± 4 vs 32 ± 6 per 100 participants; P < 0.001).
Figure 2.
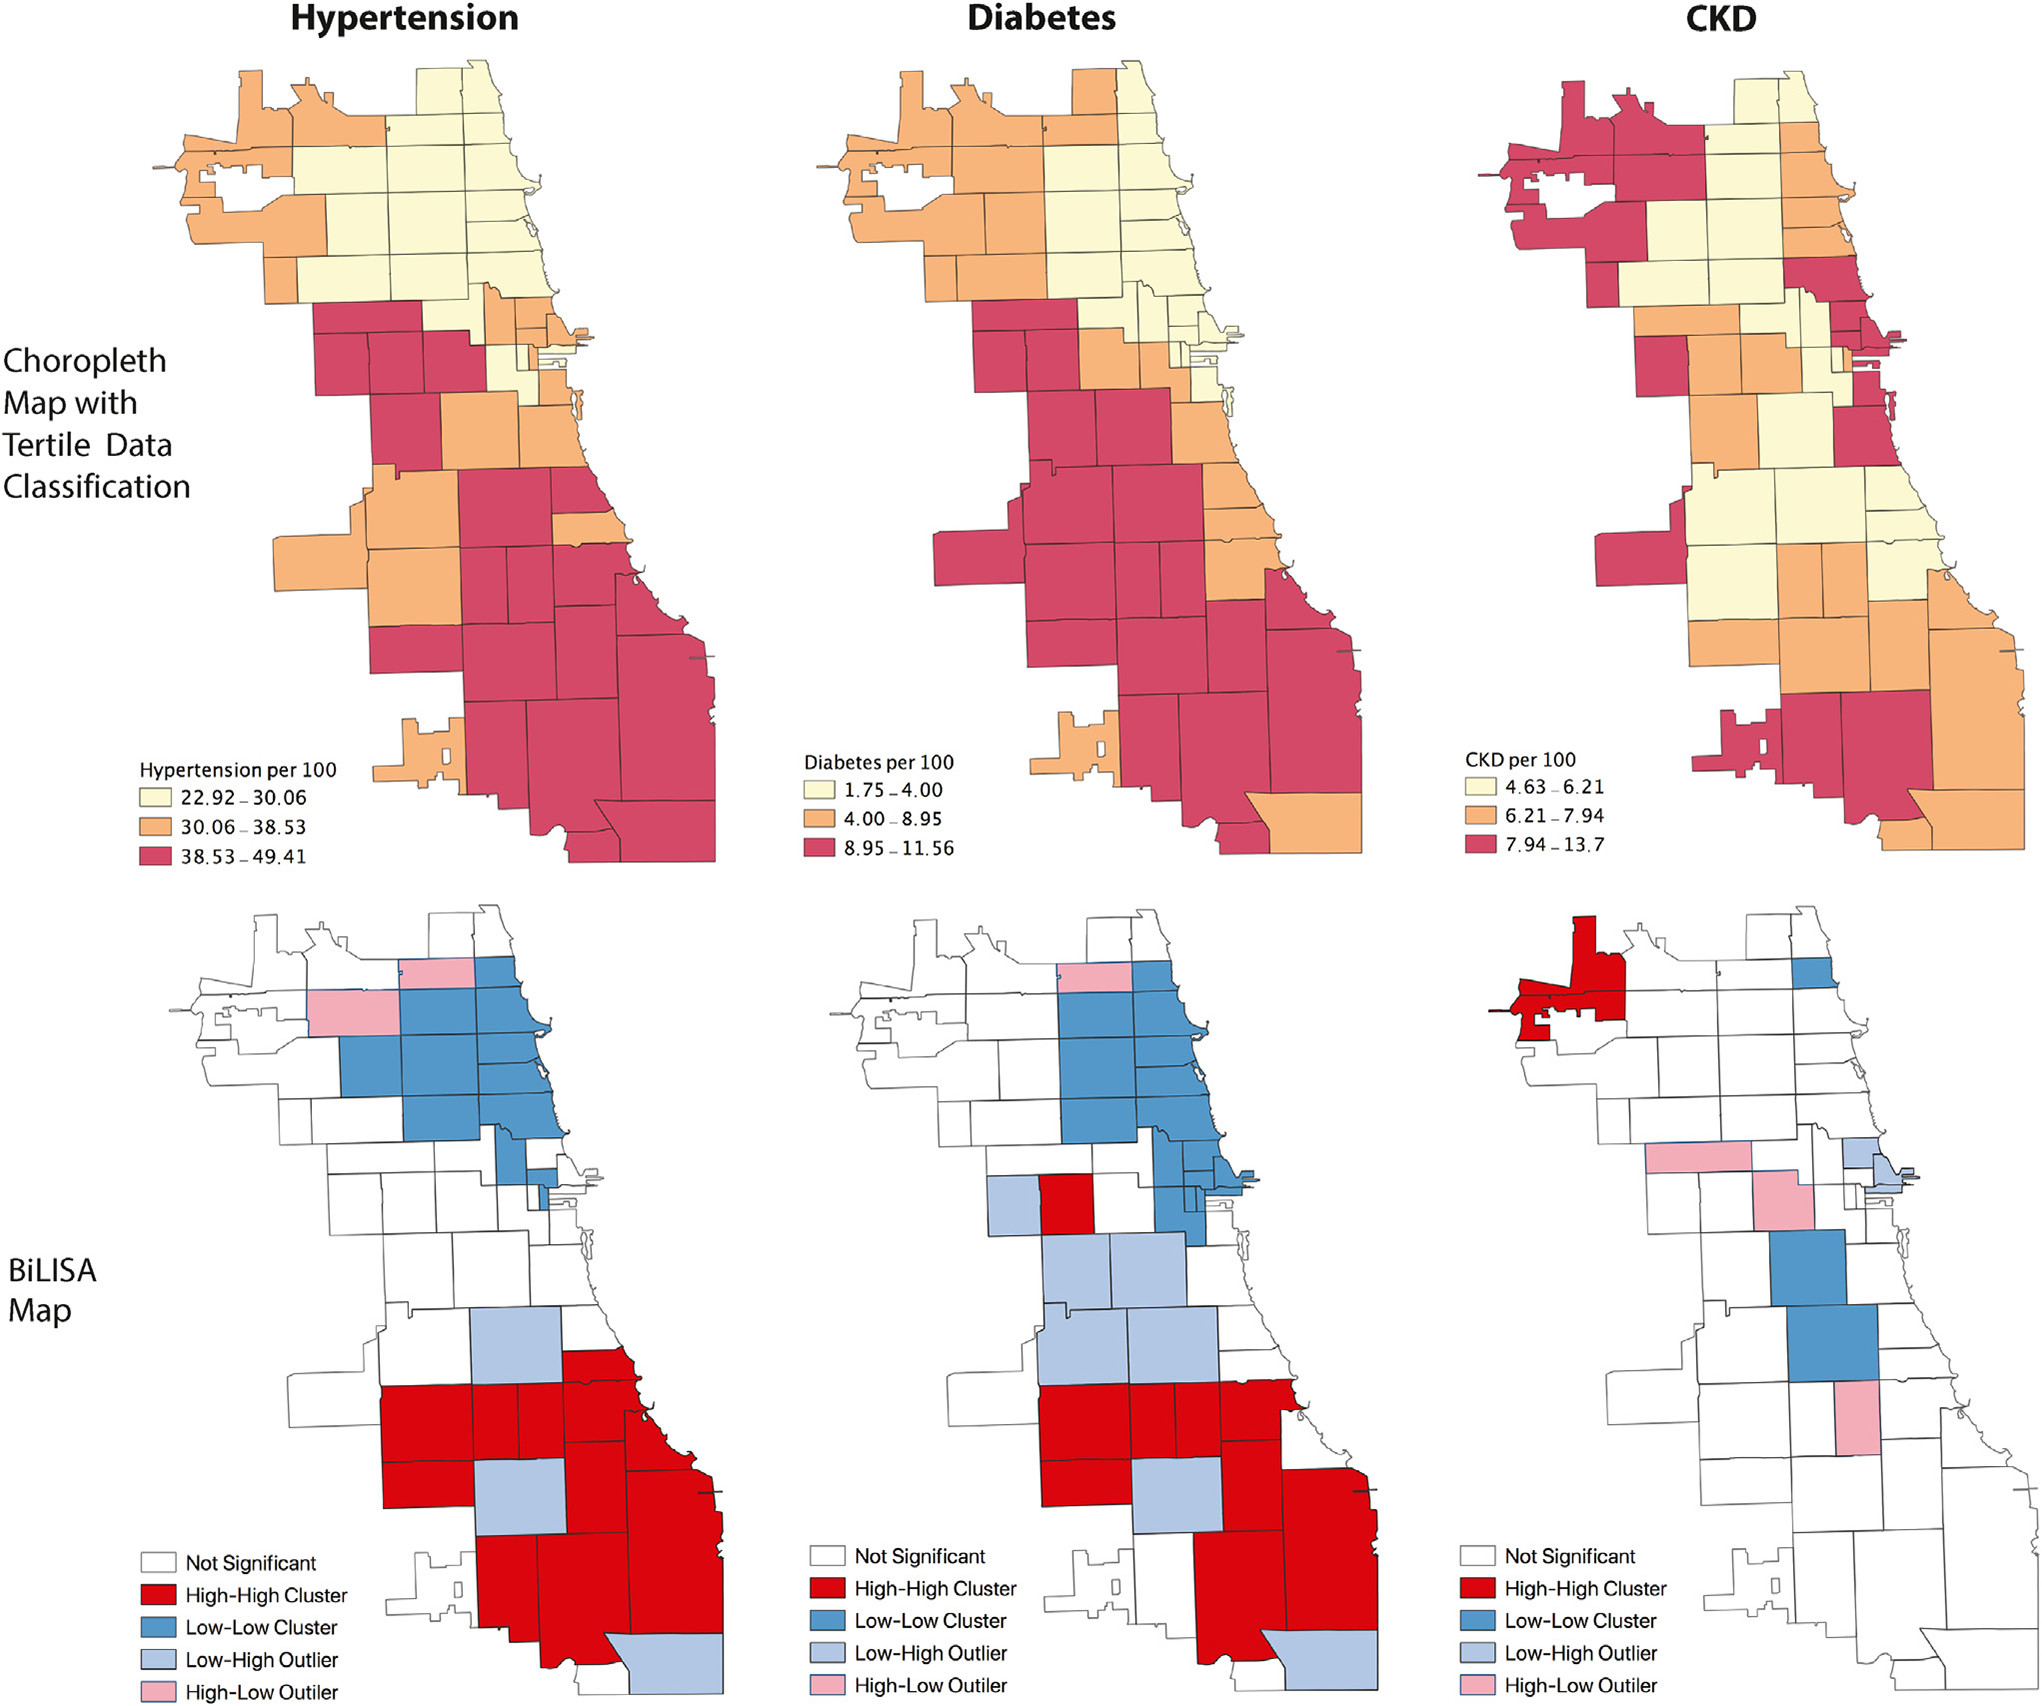
Spatial analysis of supermarket proximity and disease incidence. The upper maps show the geographic distribution of incident hypertension, diabetes, and CKD by Chicago zip codes from 2007–2012. The lower maps show BiLISA cluster maps. High-high zip code clusters reflect zip codes with longer average supermarket distance and higher average incidence of disease. Low-low clusters are those with shorter average supermarket distance and lower average incidence of disease. High-low clusters have longer supermarket distance and lower disease incidence, while low-high clusters indicate the opposite: shorter supermarket distance and higher incidence of disease. Abbreviations: BiLISA, bivariate local indicator of spatial association; CKD, chronic kidney disease.
Table 2.
Differences in Supermarket Distance and Disease Incidence Between “High-High” Zip Codes and Other Zip Codes
| Distance in 2007 to Nearest Supermarket, Miles | Disease Incidence 2007–2012, per 100 Participants | |
|---|---|---|
| Hypertension | ||
| High-high zip codes (n = 10) | 1.26 ± 0.39 | 45 ± 4 |
| Other zip codes (n = 46) | 0.73 ± 0.33 | 32 ± 6 |
| P value | <0.001 | <0.001 |
| Diabetes | ||
| High-high zip code (n = 9) | 1.31 ± 0.40 | 10±1 |
| Other zip codes (n = 47) | 0.73 ± 0.33 | 6 ± 3 |
| P value | <0.001 | <0.001 |
| CKD | ||
| High-high zip code (n = 2) | 1.17 ± 0.4 | 11 ± 0 |
| Other zip codes (n = 54) | 0.81 ± 0.4 | 7 ± 2 |
| P value | 0.2 | 0.01 |
Values given as mean ± SD. Based on analysis of variance, which determined if differences in supermarket proximity and disease incidence were statistically significant between zip codes in “high-high” clusters compared with other zip codes. High-high zip code clusters reflect zip codes with farther average supermarket distance. Analysis performed in GeoDa.
Abbreviation: CKD, chronic kidney disease.
There were 12 “low-low” zip codes in which low incidence of hypertension and short distances to supermarket overlapped. The “low-low” zip codes were clustered in northern parts of the city whereas “high-high” zip codes were concentrated in the southern and western parts (Fig 2).
Food Access and Diabetes
Similar to the hypertension analysis, a significant positive spatial autocorrelation indicated clustering of zip codes with large average supermarket distances and a high incidence of diabetes (Moran I = 0.51; z value = 6.21; pseudo P value = 0.001). Of the 56 zip codes, 9 had a significantly elevated incidence of diabetes and large average distances to the nearest supermarket, noted as “high-high” zip codes (Fig 2). Compared with the other zip codes, the “high-high” zip codes had longer average distances to the nearest supermarket (1.31 ± 0.40 miles vs 0.73 ± 0.33 miles; P < 0.001) and a higher incidence of diabetes (10 ± 1 vs 6 ± 3 per 100 participants; P < 0.001) (Table 2). By contrast, there were 16 “low-low” zip codes in which short average supermarket distances and a low incidence of diabetes overlapped. Similar to hypertension, the “low-low” zip codes were concentrated in the northern parts of the city whereas “high-high” zip codes were clustered in the southern and western neighborhoods (Fig 2).
Food Access and CKD
There was no spatial overlap between supermarket access and incidence of CKD (Moran I =−0.04; z value =−0.57; pseudo P value = 0.3). There were 2 “high-high” zip codes (Fig 2), which had long average supermarket distances and a high incidence of CKD. The “high-high” zip codes had a significantly higher incidence of CKD compared with the other zip codes (11 ± 0 vs 7 ± 2 per 100 participants; P = 0.01) but no significant difference in distance to nearest supermarket (1.17 ± 0.4 miles vs 0.81 ± 0.4 miles; P = 0.2) (Table 2). Conversely, there were 5 “low-low” zip codes (Fig 2).
Average Supermarket Distance and Odds of Incident Disease
Out of 777,994 participants without hypertension, diabetes, or CKD at baseline (2006), 408,608 developed hypertension, 51,380 developed diabetes, and 56,365 developed CKD during 2007–2012.
In the unadjusted model (Table 3), compared with tertile 1 the zip codes in tertiles 2 and 3, respectively, were associated with higher incidence of hypertension (odds ratios [ORs] of 1.22 [95% CI, 1.20–1.23] and 1.49 [95% CI, 1.47–1.50]), prediabetes (ORs of 2.27 [95% CI, 2.03–2.52] and 3.14 [95% CI, 2.83–3.48]), and diabetes (ORs of 1.94 [95% CI, 1.89–1.99] and 2.55 [95% CI, 2.49–2.61]). Zip codes in tertile 2 were associated with a lower incidence of CKD (OR, 0.95 [95% CI, 0.93–0.97]), but for those in tertile 3 there was no association with CKD incidence (OR, 1.00 [95% CI, 0.98–1.02]).
Table 3.
Association of Supermarket Distance With Incidence of Hypertension, Diabetes, and CKD
| Outcome | Unadjusted Model | Adjusted | ||
|---|---|---|---|---|
| Model 1 | Model 2 | Model 3 | ||
| Hypertension | ||||
| Distance, per 0.5-mile greater | 1.23 (1.22–1.24)a | 1.02 (1.01–1.024)b | 0.97 (0.96–0.97)a | 0.96 (0.95–0.97)a |
| Categorical | ||||
| Distance tertile 1 | 1.00 (reference) | 1.00 (reference) | 1.00 (reference) | 1.00 (reference) |
| Distance tertile 2 | 1.22 (1.20–1.23)a | 1.03 (1.02–1.05)a | 0.95 (0.94–0.97)a | 0.93 (0.92–0.95)a |
| Distance tertile 3 | 1.49 (1.47–1.50)a | 1.04 (1.02–1.06)a | 0.91 (0.89–0.92)a | 0.87 (0.86–0.89)a |
| Prediabetes | ||||
| Distance, per 0.5-mile greater | 1.53 (1.47–1.59)a | 1.13 (1.07–1.20)a | 1.08 (1.02–1.13)b | 1.08 (1.02–1.15)b |
| Categorical | ||||
| Distance tertile 1 | 1.00 (reference) | 1.00 (reference) | 1.00 (reference) | 1.00 (reference) |
| Distance tertile 2 | 2.27 (2.03–2.52)a | 1.51 (1.33–1.71)a | 1.33 (1.18–1.50)a | 1.18 (1.04–1.34)b |
| Distance tertile 3 | 3.14 (2.83–3.48)a | 1.78 (1.55–2.05)a | 1.37 (1.21–1.55)a | 1.30 (1.13–1.49)a |
| Diabetes | ||||
| Distance, per 0.5-mile greater | 1.48 (1.47–1.49) | 1.12 (1.09–1.13)a | 1.13 (1.12–1.14)a | 1.06 (1.05–1.08)a |
| Categorical | ||||
| Distance tertile 1 | 1.00 (reference) | 1.00 (reference) | 1.00 (reference) | 1.00 (reference) |
| Distance tertile 2 | 1.94 (1.89–1.99)a | 1.27 (1.23–1.30)a | 1.29 (1.26–1.33)a | 1.05 (1.02–1.09)b |
| Distance tertile 3 | 2.55 (2.49–2.61)a | 1.38 (1.33–1.43)a | 1.35 (1.31–1.39)a | 1.09 (1.05–1.13)a |
| CKD | ||||
| Distance, per 0.5-mile greater | 0.95 (0.94–0.96)b | 1.04 (1.03–1.06)b | 0.83 (0.82–0.84)b | 0.95 (0.94–0.98)b |
| Categorical | ||||
| Distance tertile 1 | 1.00 (reference) | 1.00 (reference) | 1.00 (reference) | 1.00 (reference) |
| Distance tertile 2 | 0.95 (0.93–0.97)b | 1.18 (1.15–1.21)b | 0.80 (0.78–0.82)b | 0.98 (0.96–1.01) |
| Distance tertile 3 | 1.00 (0.98–1.02) | 1.33 (1.29–1.37)b | 0.73 (0.72–0.76)b | 1.00 (0.97–1.04) |
Logistic regression analysis; values shown are OR (95% CI). Model 1 includes neighborhood factors (ie, zip code-level racial and ethnic composition, vehicle access, median income), Model 2 includes individual factors (ie, race, ethnicity, age in 2012, sex, insurance status), Model 3 includes neighborhood and individual factors. For the CKD outcome, model 3 is further adjusted for status of hypertension and diabetes. Abbreviations: CKD, chronic kidney disease; OR, odds ratio.
P < 0.001.
P < 0.01.
Adjusting for neighborhood factors (zip code–level median household income, racial and ethnic composition, and vehicle access; model 1 of Table 3) revealed significant associations between supermarket distance tertile and incidence of hypertension (tertile 2: OR, 1.03 [95% CI, 1.02–1.05]; tertile 3: OR, 1.04 [95% CI, 1.02–1.06]), prediabetes (tertile 2: OR, 1.51 [95% CI, 1.33–1.71]; tertile 3: OR, 1.78 [95% CI, 1.55–2.05]), diabetes (tertile 2: OR, 1.27 [95% CI, 1.23–1.30]; tertile 3: OR, 1.38 [95% CI, 1.33–1.43]), and CKD (tertile 2: OR, 1.18 [95% CI, 1.15–1.21]; tertile 3: OR, 1.33 [95% CI, 1.29–1.37]). Similar results were observed when distance to the nearest supermarket was included as a continuous variable.
By contrast, models adjusted solely for individual factors (age, sex, race, ethnicity, and health insurance; model 2 of Table 3) showed significant associations of tertiles 2 and 3 with greater odds of prediabetes and diabetes but lesser odds of hypertension and CKD (prediabetes: OR, 1.33 [95% CI, 1.18–1.50] and 1.37 [95% CI, 1.21–1.55]; diabetes: OR, 1.29 [95% CI, 1.26–1.33] and 1.35 [95% CI, 1.31–1.39]; hypertension: OR, 0.95 [95% CI, 0.94–0.97] and 0.91 [95% CI, 0.89–0.92]; and CKD: OR, 0.80 [95% CI, 0.78–0.82] and 0.73 [95% CI, 0.72–0.76]).
After adjusting for both neighborhood- and individual-level covariates (model 3 in Table 3), tertiles 2 and 3 of supermarket distance were associated with a higher incidence of diabetes (OR, 1.05 [95% CI, 1.02–1.09] and 1.09 [95% CI, 1.05–1.13]). Conversely, zip codes in the second and third tertiles of supermarket distance were associated with a lower incidence of hypertension (OR, 0.93 [95% CI, 0.92–0.95] and 0.87 [95% CI, 0.86–0.89]). For tertiles 2 and 3, there was no significant association with incidence of CKD (OR, 0.98 [95% CI, 0.96–1.01] and 1.00 [95% CI, 0.97–1.04]). There was a statistically significant association of incident hypertension (OR, 4.05 [95% CI, 3.94–4.16]; P < 0.001) and incident diabetes (OR, 3.13 [95% CI, 3.05–3.21]; P < 0.001) with incident CKD.
Discussion
In this retrospective cohort study, we found substantial disparities in food access paralleled by disparities in rates of hypertension, diabetes, and CKD across Chicago zip codes. These findings were mirrored by notable residential socioeconomic and sociodemographic trends. The initial spatial analysis revealed clustering of zip codes in northern Chicago neighborhoods with shorter average distances to the nearest supermarket and lower incidence of hypertension and diabetes. These zip codes comprised predominantly White, affluent residents. Conversely, zip codes in southern and western Chicago neighborhoods were associated with almost 3 times farther average distances to the nearest supermarket and a higher incidence of hypertension, diabetes, and CKD. Individuals residing in these zip codes tended to be low income, Black, and female. These findings corroborate existing literature on the neighborhood characteristics of urban environments with low food access.17,23,30–33
We found associations between farther supermarket distance and incidence of hypertension, diabetes, and CKD in models adjusted for neighborhood factors. However, after accounting for numerous individual and neighborhood level covariates, the associations were greatly attenuated for diabetes, became negative with for hypertension, and were no longer significant for CKD.
Although supermarket proximity may be an independent predictor of incident diabetes, for diseases such as hypertension and CKD it may also be a proxy measure for individual-level variables (eg, race, sex) and neighborhood-level variables (eg, neighborhood segregation, income, wealth, and education). Indeed, in the models that adjusted for only individual-level factors and models that adjusted for both individual and neighborhood factors, there was a high degree of collinearity, with a variance inflation factor of >10 for the individual-level factors. Our findings are consistent with the existing literature that has shown individual and neighborhood factors accounting for associations between chronic disease outcomes and food access, especially diabetes, hypertension, and late-stage CKD.34–39
Our research adds to the existing literature regarding the potential role of the built environment in health outcomes. Prior analyses using complex neighborhood-level deprivation indexes including a variety of factors such as neighborhood-level education, employment, income, and racial composition have shown clear associations between the built environment and disease outcomes, even after accounting for individual-level factors.40–43 The vast majority of individuals residing in such environments are racial and ethnic minorities from low-income backgrounds. This demographic makeup of neighborhoods in the United States reflects, in part, racialized policy influences such as historical redlining policies and present day housing and lending discrimination44–46 rather than the residential preferences of racial and ethnic minorities themselves.47–50 As a clear demonstration of structural racism, which has been well described in neighborhood-health literature, residential sociodemographic characteristics, such as the racial makeup of a neighborhood, often determine the availability of health-promoting resources and infrastructure.
As neighborhood characteristics such as supermarket proximity are modifiable risk factors in disease development, initiatives to increase supermarket access have been proposed but have yielded mixed results. In some studies, enhanced supermarket access in urban environments increased awareness of healthy food options and consumption of fruits and vegetables by minority groups, reduced participation in SNAP (Supplemental Nutrition Assistance Program, ie, government nutrition assistance), reduced levels of obesity and high cholesterol, provided a safe environment for positive social interaction and social support among shoppers, and was a potential source for neighborhood investment.51–55 Other studies reported more modest effects of increasing supermarket access alone, including concerns that despite providing better access and reduced prices, supermarket introduction did not increase healthy food and vegetable intake, did not alter BMI, and increased exposure to unhealthy items.54,56,57
The mixed results yielded by supermarket research underscores the complexity of the problem at hand. Significant reduction in health disparities may require a greater breadth and depth of policies and interventions to improve more than just physical access to supermarkets, but also critical health-influencing social contexts like housing, education, capital investment, and job creation.
The strengths of our study include merging large-scale electronic health data from 777,994 participants in the HDR with information about supermarket access in Chicago based on a published method. The use of a diverse cohort of electronic patient data offers an alternative method for studying disease than traditional survey-based approaches. The use of visual maps provides greater context to the data and raises additional questions on why such geographic segregation of access, opportunity, and disease exists.
Our study also has limitations. We were not able to capture many complex neighborhood and social dynamics involving poverty, social cohesion, housing, education, gentrification, and discriminatory public policies that may also affect health outcomes. Examining a specific neighborhood characteristic like food access oversimplifies this larger context.58,59 We were also unable to capture important individual-level information such as individual income, access to automobiles or public transportation, purchasing power, food purchasing patterns, or information regarding health outcomes for family members. Zip code–level income, vehicle access, and racial composition may not be sufficiently granular surrogates.
The data source for our study was a limited dataset, and we did not have individual-level residence address to calculate the distance between each individual residence and the nearest supermarket. Instead, we used the average distance from households to the nearest supermarket for each zip code. The study method assumes that participants reside in one zip code, solely shop for food within their zip code of residence, and are not traveling to other zip codes with more abundant options. We are also limited by not knowing specific nutrition-related behaviors, including the particular items participants purchase or consume.
Although we assessed medical history, using a 1-year lag is short to establish that a participant did not have hypertension, diabetes, or CKD before 2007 when calculating the incidence of these diseases in 2007–2012.60 Similarly, though the HDR covers many large hospital systems in Chicago, it is possible that participants may have been diagnosed with diabetes, hypertension, or CKD at other health care institutions before 2007. Although we have made sure the participants were free of hypertension, diabetes, and CKD based on ICD codes or laboratory values, baseline blood pressure, eGFR, and HbA1C values were not available for the majority of our participants. We may be overestimating the rates of hypertension and CKD by using just 1 measurement of SBP >140 mm Hg, DBP >90 mm Hg, and eGFR < 60 mL/min/1.73 m2 to define these diseases. Finally, causality cannot be established, and these results may not be generalizable to other communities or neighborhoods.
In conclusion, we observed notable disparities in rates of hypertension, diabetes, and CKD across Chicago zip codes. Except for diabetes, the association of supermarket proximity with hypertension and CKD was largely explained by individual- and neighborhood-level factors. Additional studies using neighborhood deprivation indexes and hierarchical models may further elucidate the respective individual- and neighborhood-level contribution to disease outcomes.
Supplementary Material
PLAIN-LANGUAGE SUMMARY.
Residing in an environment with limited access to healthy food may be a modifiable risk factor for the development of hypertension, diabetes, and kidney disease. We used a household’s distance to the closest supermarket as a measure of food access and calculated the average distance to the nearest supermarket for 56 Chicago zip codes. We also calculated the incidence of hypertension, diabetes, and kidney disease for each of those zip codes using electronic health data. We found that supermarket distance is a confounding marker for a number of other important individual factors like race, sex, and age and neighborhood factors like income, racial composition, and access to a vehicle. Changing disparities in chronic diseases will require broad, multifaceted solutions.
Acknowledgements:
We thank the Institute for Public Health and Medicine at Northwestern University, Feinberg School of Medicine, for assistance in background research; Zahra Hosseinian and the HDR team for assistance with data acquisition; and Daniel R. Block, PhD, at the Chicago State University for previous data and guidance.
Support:
Dr Wolf is supported by AHA Strategically Focused Research Network Center in Health Disparities grant. The supporters had no role in study design, data collection, analysis, reporting, or the decision to submit for publication.
Footnotes
Financial Disclosure: The authors declare that they have no relevant financial interests.
Contributor Information
Gaurang Garg, Department of Medicine, Feinberg School of Medicine, Northwestern University, Chicago, Illinois.
Yacob G. Tedla, Division of Epidemiology, Department of Medicine, Vanderbilt University Medical Center, Nashville, Tennessee.
Anika S. Ghosh, Center for Health Information Partnership, Institute for Public Health and Medicine, Division of Internal Medicine, Feinberg School of Medicine, Northwestern University, Chicago, Illinois.
Dinushika Mohottige, Division of Nephrology, Department of Medicine and Duke Clinical Research Institute, School of Medicine, Duke University, Durham, North Carolina.
Marynia Kolak, Center for Spatial Data Science, University of Chicago, Chicago, Illinois.
Myles Wolf, Division of Nephrology, Department of Medicine and Duke Clinical Research Institute, School of Medicine, Duke University, Durham, North Carolina.
Abel Kho, Center for Health Information Partnership, Institute for Public Health and Medicine, Division of Internal Medicine, Feinberg School of Medicine, Northwestern University, Chicago, Illinois
References
- 1.American Diabetes Association. Economic costs of diabetes in the U.S. in 2017. Diabetes Care. 2018;41(5):917–928. doi: 10.2337/dci18-0007 [DOI] [PMC free article] [PubMed] [Google Scholar]
- 2.Murray CJL, Abraham J, Ali MK, et al. The state of US health, 1990–2010: burden of diseases, injuries, and risk factors. JAMA. 2013;310(6):591–608. doi: 10.1001/jama.2013.13805 [DOI] [PMC free article] [PubMed] [Google Scholar]
- 3.Benjamin EJ, Blaha MJ, Chiuve SE, et al. Heart disease and stroke statistics 2017 update: a report from the American Heart Association. Circulation. 2017;135(10):e146–e603. doi: 10.1161/CIR.0000000000000485 [DOI] [PMC free article] [PubMed] [Google Scholar]
- 4.James WP, Nelson M, Ralph A, Leather S. Socioeconomic determinants of health: the contribution of nutrition to inequalities in health. BMJ. 1997;314(7093):1545–1549. doi: 10.1136/bmj.314.7093 [DOI] [PMC free article] [PubMed] [Google Scholar]
- 5.Darmon N, Drewnowski A. Does social class predict diet quality? Am J Clin Nutr. 2008;87(5):1107–1117. doi: 10.1093/ajcn/87.5.1107 [DOI] [PubMed] [Google Scholar]
- 6.Horowitz CR, Colson KA, Hebert PL, Lancaster K. Barriers to buying healthy foods for people with diabetes: evidence of environmental disparities. Am J Public Health. 2004;94(9):1549–1554. doi: 10.2105/ajph.94.9.1549 [DOI] [PMC free article] [PubMed] [Google Scholar]
- 7.Savica V, Bellinghieri G, Kopple JD. The effect of nutrition on blood pressure. Annu Rev Nutr. 2010;30:365–401. doi: 10.1146/annurev-nutr-010510-103954 [DOI] [PubMed] [Google Scholar]
- 8.Crews DC, Novick TK. Social determinants of CKD hotspots. Semin Nephrol. 2019;39(3):256–262. doi: 10.1016/j.semnephrol.2019.02.003 [DOI] [PMC free article] [PubMed] [Google Scholar]
- 9.Gutiérrez OM. Contextual poverty, nutrition, and chronic kidney disease. Adv Chronic Kidney Dis. 2015;22(1):31–38. doi: 10.1053/j.ackd.2014.05.005 [DOI] [PMC free article] [PubMed] [Google Scholar]
- 10.Jannasch F, Kröger J, Schulze MB. Dietary patterns and type 2 diabetes: a systematic literature review and meta-analysis of prospective studies. J Nutr. 2017;147(6):1174–1182. doi: 10.3945/jn.116.242552 [DOI] [PubMed] [Google Scholar]
- 11.Erber E, Hopping BN, Grandinetti A, Park SY, Kolonel LN, Maskarinec G. Dietary patterns and risk for diabetes: the multiethnic cohort. Diabetes Care. 2010;33(3):532–538. doi: 10.2337/dc09-1621 [DOI] [PMC free article] [PubMed] [Google Scholar]
- 12.Jhee JH, Kee YK, Park JT, et al. A diet rich in vegetables and fruit and incident CKD: a community-based prospective cohort study. Am J Kidney Dis. 2019;74(4):491–500. doi: 10.1053/j.ajkd.2019.02.023 [DOI] [PubMed] [Google Scholar]
- 13.Rhone A, Ver Ploeg M, Dicken C, Williams R, Breneman V. Low-Income and Low-Supermarket-Access Census Tracts, 2010–2015. EIB-165. U.S. Department of Agriculture, Economic Research Service; January 2017. [Google Scholar]
- 14.Chung C, Myers SL. Do the poor pay more for food? An analysis of grocery store availability and food price disparities. J Consumer Aff. 1999;33:276–296. doi: 10.1111/j.1745-6606.1999.tb00071.x [DOI] [Google Scholar]
- 15.Beaulac J, Kristjansson E, Cummins S. A systematic review of food deserts, 1966–2007. Prev Chronic Dis. 2009;6(3):A105. https://www.cdc.gov/pcd/issues/2009/Jul/08_0163.htm [PMC free article] [PubMed] [Google Scholar]
- 16.Drewnowski A, Specter SE. Poverty and obesity: the role of energy density and energy costs. Am J Clin Nutr. 2004;79(1):6–16. doi: 10.1093/ajcn/79.1.6 [DOI] [PubMed] [Google Scholar]
- 17.Walker RE, Keane CR, Burke JG. Disparities and access to healthy food in the United States: a review of food deserts literature. Health Place. 2010;16(5):876–884. doi: 10.1016/j.healthplace.2010.04.013 [DOI] [PubMed] [Google Scholar]
- 18.Thompson D, Edelsberg J, Colditz GA, Bird AP, Oster G. Lifetime health and economic consequences of obesity. Arch Intern Med. 1999;159(18):2177–2183. doi: 10.1001/archinte.159.18.2177 [DOI] [PubMed] [Google Scholar]
- 19.Poirier P, Giles TD, Bray GA, et al. American Heart Association; Obesity Committee of the Council on Nutrition, Physical Activity, and Metabolism. Obesity and cardiovascular disease: pathophysiology, evaluation, and effect of weight loss: an update of the 1997 American Heart Association Scientific Statement on Obesity and Heart Disease from the Obesity Committee of the Council on Nutrition, Physical Activity, and Metabolism. Circulation. 2006;113(6):898–918. doi: 10.1161/CIRCULATIONAHA.106.171016 [DOI] [PubMed] [Google Scholar]
- 20.Pi-Sunyer FX. The obesity epidemic: pathophysiology and consequences of obesity. Obes Res. 2002;10(suppl 2):97S–104S. doi: 10.1038/oby.2002.202 [DOI] [PubMed] [Google Scholar]
- 21.Kho AN, Cashy JP, Jackson KL, et al. Design and implementation of a privacy preserving electronic health record linkage tool in Chicago. J Am Med Inform Assoc. 2015;22(5):1072–1080. doi: 10.1093/jamia/ocv038 [DOI] [PMC free article] [PubMed] [Google Scholar]
- 22.Michigan Population Studies Center. Zip code characteristics: mean and median household income. Institute for Social Research, University of Michigan; 2006–2010. https://www.psc.isr.umich.edu/dis/census/Features/tract2zip/ [Google Scholar]
- 23.Block D, Kouba J. A comparison of the availability and affordability of a market basket in two communities in the Chicago area. Public Health Nutr. 2006;9(7):837–845. doi: 10.1017/phn2005924 [DOI] [PubMed] [Google Scholar]
- 24.Block D, Chavez N, Birgen J. The Report of the Northeastern Illinois Community Food Security Assessment. Chicago State University Frederick Blum Neighborhood Assistance Center and University of Illinois/Chicago School of Public Health, Division of Community Health Sciences; 2008. [Google Scholar]
- 25.Kolak M, Bradley M, Block DR, et al. Urban foodscape trends: disparities in healthy food access in Chicago, 2007–2014. Health Place. 2018;52:231–239. doi: 10.1016/j.healthplace.2018.06.003 [DOI] [PubMed] [Google Scholar]
- 26.Kolak M, Bradley M, Block D, et al. Chicago supermarket data and food access analytics in census tract shapefiles for 2007–2014. Data Brief. 2018;21:2482–2488. doi: 10.1016/j.dib.2018.11.014 [DOI] [PMC free article] [PubMed] [Google Scholar]
- 27.Levey AS, Stevens LA, Schmid CH, et al. CKD-EPI (Chronic Kidney Disease Epidemiology Collaboration). A new equation to estimate glomerular filtration rate. Ann Intern Med. 2009;150(9):604–612. doi: 10.7326/0003-4819-150-9-200905050-00006 [DOI] [PMC free article] [PubMed] [Google Scholar]
- 28.Anselin L Local Indicators of Spatial Association—LISA. Geogr Anal. 1995;27:93–115. doi: 10.1111/j.1538-4632.1995.tb00338.x [DOI] [Google Scholar]
- 29.Anselin L, Syabri I, Kho Y. GeoDa: An introduction to spatial data analysis. Geogr Anal. 2006;38:5–22. doi: 10.1111/j.0016-7363.2005.00671.x [DOI] [Google Scholar]
- 30.Morland K, Wing S, Diez Roux A, Poole C. Neighborhood characteristics associated with the location of food stores and food service places. Am J Prev Med. 2002;22(1):23–29. doi: 10.1016/s0749-3797(01)00403-2 [DOI] [PubMed] [Google Scholar]
- 31.Moore LV, Diez Roux AV. Associations of neighborhood characteristics with the location and type of food stores. Am J Public Health. 2006;96(2):325–331. doi: 10.2105/AJPH.2004.058040 [DOI] [PMC free article] [PubMed] [Google Scholar]
- 32.Zenk SN, Schulz AJ, Israel BA, James SA, Bao S, Wilson ML. Neighborhood racial composition, neighborhood poverty, and the spatial accessibility of supermarkets in metropolitan Detroit. Am J Public Health. 2005;95(4):660–667. doi: 10.2105/AJPH.2004.042150 [DOI] [PMC free article] [PubMed] [Google Scholar]
- 33.Ball K, Timperio A, Crawford D. Neighbourhood socioeconomic inequalities in food access and affordability. Health Place. 2009;15(2):578–585. doi: 10.1016/j.healthplace.2008.09.010 [DOI] [PubMed] [Google Scholar]
- 34.Kelli HM, Hammadah M, Ahmed H, et al. Association between living in food deserts and cardiovascular risk. Circ Cardiovasc Qual Outcomes. 2017;10(9):e003532. doi: 10.1161/CIRCOUTCOMES.116.003532 [DOI] [PMC free article] [PubMed] [Google Scholar]
- 35.Berkowitz SA, Karter AJ, Corbie-Smith G, et al. Food insecurity, food “deserts,” and glycemic control in patients with diabetes: a longitudinal analysis. Diabetes Care. 2018;41(6):1188–1195. doi: 10.2337/dc17-1981 [DOI] [PMC free article] [PubMed] [Google Scholar]
- 36.Banerjee T, Crews DC, Wesson DE, et al. ; CDC CKD Surveillance Team. Food insecurity, CKD, and subsequent ESRD in US adults. Am J Kidney Dis. 2017;70(1):38–47. doi: 10.1053/j.ajkd.2016.10.035 [DOI] [PMC free article] [PubMed] [Google Scholar]
- 37.Ghosh-Dastidar B, Cohen D, Hunter G, et al. Distance to store, food prices, and obesity in urban food deserts. Am J Prev Med. 2014;47(5):587–595. doi: 10.1016/j.amepre.2014.07.005 [DOI] [PMC free article] [PubMed] [Google Scholar]
- 38.Suarez JJ, Isakova T, Anderson CA, Boulware LE, Wolf M, Scialla JJ. Food access, chronic kidney disease, and hypertension in the U.S. Am J Prev Med. 2015;49(6):912–920. doi: 10.1016/j.amepre.2015.07.017 [DOI] [PMC free article] [PubMed] [Google Scholar]
- 39.Hicken MT, Katz R, Crews DC, Kramer HJ, Peralta CA. Neighborhood social context and kidney function over time: the multi-ethnic study of atherosclerosis. Am J Kidney Dis. 2019;73(5):585–595. doi: 10.1053/j.ajkd.2018.10.015 [DOI] [PMC free article] [PubMed] [Google Scholar]
- 40.Merkin SS, Diez Roux AV, Coresh J, Fried LF, Jackson SA, Powe NR. Individual and neighborhood socioeconomic status and progressive chronic kidney disease in an elderly population: the Cardiovascular Health Study. Soc Sci Med. 2007;65(4):809–821. doi: 10.1016/j.socscimed.2007.04.011 [DOI] [PubMed] [Google Scholar]
- 41.Laraia BA, Karter AJ, Warton EM, Schillinger D, Moffet HH, Adler N. Place matters: neighborhood deprivation and cardiometabolic risk factors in the Diabetes Study of Northern California (DISTANCE). Soc Sci Med. 2012;74(7):1082–1090. doi: 10.1016/j.socscimed.2011.11.036 [DOI] [PMC free article] [PubMed] [Google Scholar]
- 42.Cubbin C, Hadden WC, Winkleby MA. Neighborhood context and cardiovascular disease risk factors: the contribution of material deprivation. Ethn Dis. 2001;11(4):687–700. [PubMed] [Google Scholar]
- 43.Claudel SE, Adu-Brimpong J, Banks A, et al. Association between neighborhood-level socioeconomic deprivation and incident hypertension: a longitudinal analysis of data from the Dallas heart study. Am Heart J. 2018;204:109–118. doi: 10.1016/j.ahj.2018.07.005 [DOI] [PMC free article] [PubMed] [Google Scholar]
- 44.Collins AJ, Foley RN, Herzog C, et al. US Renal Data System 2012 annual data report. Am J Kidney Dis. 2013;61 (1)(Suppl 1):A7, e1–e476. doi: 10.1053/j.ajkd.2012.11.031 [DOI] [PubMed] [Google Scholar]
- 45.Turner MA, Ross SL, Galster GC, Yinger J. Discrimination in Metropolitan Housing Markets: National Results from Phase I HDS 2000. Final Report. Urban Institute; 2002. https://www.huduser.gov/publications/pdf/phase1_report.pdf [Google Scholar]
- 46.Charles CZ . Processes of racial residential segregation. In:O’Connor A, Tilly C, Bobo L, eds. Urban Inequality: Evidence From Four Cities. Russell Sage Foundation; 2001:217–271. [Google Scholar]
- 47.Williams DR, Collins C. Racial residential segregation: a fundamental cause of racial disparities in health. Public Health Rep. 2001;116(5):404–416. doi: 10.1093/phr/116.5.404 [DOI] [PMC free article] [PubMed] [Google Scholar]
- 48.Acevedo-Garcia D, Lochner KA, Osypuk TL, Subramanian SV. Future directions in residential segregation and health research: a multilevel approach. Am J Public Health. 2003;93(2):215–221. doi: 10.2105/ajph.93.2.215 [DOI] [PMC free article] [PubMed] [Google Scholar]
- 49.Chowkwanyun M The strange disappearance of history from racial health disparities research. Du Bois Rev. 2011;8(1):253–270. doi: 10.1017/S1742058X11000142 [DOI] [Google Scholar]
- 50.Farley R Neighborhood preferences and aspirations among blacks and whites. In: Kingsley G, Turner M, eds. Housing Markets and Residential Mobility, Vol 161. Washington, DC: Urban Institute Press; 1993:161–191. [Google Scholar]
- 51.Richardson AS, Ghosh-Dastidar M, Beckman R, et al. Can the introduction of a full-service supermarket in a food desert improve residents’ economic status and health? Ann Epidemiol. 2017;27(12):771–776. doi: 10.1016/j.annepidem.2017.10.011 [DOI] [PMC free article] [PubMed] [Google Scholar]
- 52.Morland K, Wing S, Diez Roux A. The contextual effect of the local food environment on residents’ diets: the atherosclerosis risk in communities study. Am J Public Health. 2002;92(11):1761–1767. doi: 10.2105/ajph.92.11.1761 [DOI] [PMC free article] [PubMed] [Google Scholar]
- 53.Chrisinger B A mixed-method assessment of a new supermarket in a food desert: contributions to everyday life and health. J Urban Health. 2016;93(3):425–437. doi: 10.1007/s11524-016-0055-8 [DOI] [PMC free article] [PubMed] [Google Scholar]
- 54.Cummins S, Flint E, Matthews SA. New neighborhood grocery store increased awareness of food access but did not alter dietary habits or obesity. Health Aff (Millwood). 2014;33(2):283–291. doi: 10.1377/hlthaff.2013.0512 [DOI] [PMC free article] [PubMed] [Google Scholar]
- 55.Gittelsohn J, Song HJ, Suratkar S, et al. An urban food store intervention positively affects food-related psychosocial variables and food behaviors. Health Educ Behav. 2010;37(3): 390–402. doi: 10.1177/1090198109343886 [DOI] [PubMed] [Google Scholar]
- 56.Ghosh-Dastidar M, Hunter G, Collins RL, et al. Does opening a supermarket in a food desert change the food environment? Health Place. 2017;46:249–256. doi: 10.1016/j.healthplace.2017.06.002 [DOI] [PMC free article] [PubMed] [Google Scholar]
- 57.Vaughan CA, Cohen DA, Ghosh-Dastidar M, Hunter GP, Dubowitz T. Where do food desert residents buy most of their junk food? Supermarkets. Public Health Nutr. 2017;20(14):2608–2616. doi: 10.1017/S136898001600269X [DOI] [PMC free article] [PubMed] [Google Scholar]
- 58.Diez Roux AV. Investigating neighborhood and area effects on health. Am J Public Health. 2001;91(11):1783–1789. doi: 10.2105/ajph.91.11.1783 [DOI] [PMC free article] [PubMed] [Google Scholar]
- 59.Osypuk TL, Acevedo-Garcia D. Beyond individual neighborhoods: a geography of opportunity perspective for understanding racial/ethnic health disparities. Health Place. 2010;16(6): 1113–1123. doi: 10.1016/j.healthplace.2010.07.002 [DOI] [PMC free article] [PubMed] [Google Scholar]
- 60.Bagley SC, Altman RB . Computing disease incidence, prevalence and comorbidity from electronic medical records. J Biomed Inform. 2016;63:108–111. doi: 10.1016/j.jbi.2016.08.005 [DOI] [PMC free article] [PubMed] [Google Scholar]
Associated Data
This section collects any data citations, data availability statements, or supplementary materials included in this article.