

Abstract
Extracellular ATP (eATP) increases cytosolic free calcium ([Ca2+]cyt) as a specific second messenger ‘signature’ through the plasma membrane DORN1/P2K1 receptor. Previous studies revealed a biphasic signature in Arabidopsis thaliana roots that is altered by inorganic phosphate (Pi) deprivation. The relationship between the two phases of the signature and possible wave formation have been tested as a function of Pi nutrition.
The bioluminescent aequorin and intensiometric GCaMP3 reporters were used to resolve the spatial origin of the eATP [Ca2+]cyt signature in Arabidopsis root tips. Application of eATP only to the root apex allowed [Ca2+]cyt wave resolution without the confounding effects of eATP delivery by superfusion.
The first apical millimetre of the root generates the first [Ca2+]cyt increase by eATP, regardless of nutritional status. The second increase occurs sub‐apically in the root hair zone, has some autonomy and is significantly reduced in Pi‐starved roots. A significant component of the Pi‐replete signature does not require DORN1/P2K1, but Pi‐starved roots appear to have an absolute requirement for that receptor. Application of eATP specifically to the root apex provides evidence for cell‐to‐cell propagation of a [Ca2+]cyt wave that diminishes sub‐apically.
The apex maintains a robust [Ca2+]cyt increase (even under Pi starvation) that is the basis of a propagative wave, with implications for the ability of the root’s eATP signalling systems to signal systemically. Partial autonomy of the sub‐apical region may be relevant to the perception of eATP from microbes. eATP‐induced [Ca2+]cyt increase may not have always have an obligate requirement for DORN1/P2K1.
Keywords: Arabidopsis, calcium, extracellular ATP, phosphate, root, signature, wave
Extracellular ATP increases cytosolic free calcium at the root apex to induce a wave.

INTRODUCTION
Extracellular ATP (eATP) is a plant cell regulator. It is involved in the maintenance of cell viability, growth and development (Chivasa et al. 2005; Clark et al. 2010; Wu et al. 2018), stomatal aperture regulation (Chen et al. 2018), abiotic stress responses (Hou et al. 2018), wounding and immunity (Choi et al. 2014a; Tripathi et al. 2018; Jewell et al. 2019; Nizam et al. 2019; Kumar et al. 2020). Application of ATP to plant tissue causes increases in free cytosolic Ca2+ ([Ca2+]cyt; Demidchik et al. 2003; Choi et al. 2014a; Matthus 2019a,b,c). Stimulus‐specific [Ca2+]cyt elevations, or ‘signatures’, are decoded by specific suites of Ca2+‐binding proteins to direct transcriptional or physiological responses (Lenzoni et al. 2018). eATP can evoke [Ca2+]cyt signatures in Arabidopsis seedlings (Jeter et al. 2004; Tanaka et al. 2010; Choi et al. 2014a; Chen et al. 2018; Lenzoni et al. 2018), leaves (Tanaka et al. 2010; Matthus et al. 2019c; Mohammad‐Sidik et al. 2021) and roots (e.g. Demidchik et al. 2003, 2009; Tanaka et al. 2010; Costa et al. 2013; Shi et al. 2015; Kelner et al. 2018; Matthus et al. 2019a‐c; Krogman et al. 2020; Waadt et al. 2020; Mohammad‐Sidik et al. 2021). Studies on Arabidopsis seedlings and roots suggest that eATP‐induced [Ca2+]cyt elevation is totally reliant on the plasma membrane DORN1 (Does not Respond to Nucleotides1)/P2K1 eATP receptor (Choi et al. 2014a; Chen et al. 2018; Matthus et al. 2019c). This Ca2+ signalling directs a transcriptional response through the Ca2+‐dependent CAMTA3 transcriptional regulator (Jewell et al. 2019).
The eATP‐induced [Ca2+]cyt signature in Arabidopsis roots is influenced by inorganic phosphate (Pi) nutrition (Matthus et al. 2019a). Pi‐replete excised root tips sustained a biphasic [Ca2+]cyt increase in response to eATP. In contrast, Pi‐starved excised root tips only supported a monophasic eATP‐induced [Ca2+]cyt increase – the second phase of [Ca2+]cyt increase was absent (Matthus et al. 2019a). These findings, from using aequorin as a luminometric reporter of [Ca2+]cyt, were corroborated by using the ratiometric [Ca2+]cyt reporter Yellow Cameleon 3.6 (YC3.6) to allow spatial resolution. Pi‐replete intact roots sustained a biphasic eATP‐induced [Ca2+]cyt increase, with the first increment at the apex followed by a second, sub‐apical increase. The second, sub‐apical [Ca2+]cyt increase was absent in Pi‐starved roots (Matthus et al. 2019a). The mechanism for suppression of that second sub‐apical [Ca2+]cyt increase as a consequence of Pi nutrition remains unknown, but at the phenomenological level it relates to iron (Fe) availability (Matthus et al. 2019a,b). The second sub‐apical [Ca2+]cyt increase was restored in Pi‐starved roots by removing Fe from the growth medium (Matthus et al. 2019a).
As the transcriptional response to a [Ca2+]cyt signature depends on its temporal phases (Lenzoni et al. 2018), it is important to understand whether the first eATP‐induced [Ca2+]cyt elevation activates the second and to what extent the second increase is autonomous. This is also relevant to the phenomenon of ‘Ca2+ waves’, in which a [Ca2+]cyt signal may be propagated along a tissue (Choi et al. 2014b; Evans et al. 2016; Nguyen et al. 2018) to evoke a distal response. To date, a [Ca2+]cyt wave has been detected in Arabidopsis roots challenged with salt stress (Choi et al. 2014b; Evans et al. 2016) and a [Ca2+]cyt wave has been suggested to occur in response to eATP (Costa et al. 2013; Matthus et al. 2019c; Krogman et al. 2020). Studies on eATP have been limited by superfusive eATP application to the whole root. In this study, the spatial origin of the root’s apical eATP‐induced [Ca2+]cyt elevation has been examined further (using aequorin and the GFP‐based intensiometric [Ca2+]cyt reporter GCaMP3; Vincent et al. 2017). These [Ca2+]cyt reporters have also been used to test the relationship between the apical and sup‐apical eATP‐induced [Ca2+]cyt elevations, as a function of Pi nutrition. In wave studies, a simple technique has allowed eATP application only to the apex, overcoming the limitation of superfusion.
MATERIAL AND METHODS
Plant material and growth conditions
Arabidopsis thaliana Col‐0 constitutively expressing cytosolic (apo)aequorin or GCaMP3 were as previously described (Matthus et al. 2019a,c). The dorn1‐1 mutant constitutively expressing cytosolic (apo)aequorin was as described by Choi et al. (2014a) and Matthus et al. (2019a,c). Growth conditions were as described by Matthus et al. (2019a). Growth medium was half strength Murashige and Skoog with vitamins (Duchefa, Haarlem, Netherlands) and 0.8% (w/v) agar (Bacto agar, BD Biosciences, Wokingham, UK), pH 5.6; ‘half MS’. This contained 0.625 mM phosphate (‘full Pi’). A custom‐made MS without Pi was used for ‘zero Pi’ conditions (Duchefa, DU1072) and KCl substituted for missing potassium from KH2PO4 exclusion (Matthus et al. 2019a).
Root growth assay
Arabidopsis Col and dorn1‐1 (both constitutively expressing cytosolic (apo)aequorin) were grown on full or zero Pi medium for 11 days. Plates were scanned using an Epson scanner with 300 dpi resolution. ImageJ software with the NeuronJ plugin was used to quantify primary root length (the 8‐ to 11‐day interval).
Aequorin luminometry
Excised 1‐cm long root tips (with or without the first apical millimetre excised) of 10‐day old seedlings were incubated overnight, in darkness at room temperature in 100 µl half MS containing 10 µM coelenterazine (NanoLight Technology, Pinetop AZ, USA), pH 5.6. with MES/Tris (Sigma, Darmstadt, Germany). Half MS medium had the same nutrient status (i.e. full Pi or zero Pi) as the plants were grown on. One root tip (1‐cm long with or without the first apical millimetre excised) was placed per well (containing 100 µl of the appropriate full Pi or zero Pi half MS) in a white 96‐well plate (Greiner Bio‐One, Kremsmuenster, Austria). Luminescence was recorded every second for 200 s (FLUOstar OPTIMA plate reader, BMG Labtech, Aylsebury, UK). After 35 s, 100 µl of control (full Pi or zero Pi half MS) or test solution (plus 1 mM ATP; Melford, Ipswich, UK) were added. Discharge solution (final concentration: 10% (v/v) ethanol, 1 M CaCl2) was injected after 120 s. [Ca2+]cyt and changes in [Ca2+]cyt were estimated according to Matthus et al. (2019a), in which peak maxima were detected in set timeframes. Total [Ca2+]cyt mobilized was estimated as ‘Area Under the Curve’ (AUCLenzoni et al. 2018; Matthus et al. 2019a). A summary schematic is shown in Fig. 1.
Fig. 1.

Schematic of [Ca2+]cyt analysis from aequorin time‐course data. Each value was calculated with the average baseline value (i) subtracted. Touch peak was the highest value of the touch response because of mechanical stimulus from the treatment application (ii; 35–41 s or 35–155 s for control solution). Maximum Peak 1 (iii; 42–63 s) and Maximum Peak 2 (iv; 64–155 s) were the maximum values for each peak. Total [Ca2+]cy accumulation (v) was obtained by integrating the area under the curve (AUC).
Imaging of GCaMP3
Roots or root tips from 10‐ to 11‐day‐old seedlings were placed on growth plates or, in ‘wave’ experiments, a root was placed across a gap in growth medium agar (Matthus et al. 2019c; Fig. S1). Recovery was for 5 to 10 min. Solution (3 µl) was applied by pipette; control solution (full Pi or zero Pi liquid half MS) ± 1 mM eATP. Imaging was with a Stereomicroscope M205 FA (Leica Microsystems, Wetzlar, Germany), with a DFC365FX camera (Leica) and a Sola SE365 light source (Lumencor, Beaverton OR, USA); excitation 470/40 nm, emission every 5 s at 525/50 nm, gain of 2.0 and 30× magnification. ImageJ Fiji was used to process GCaMP3 GFP signal intensities, fitting regions of interest (Roi) with the ‘ROI Manager’ tool. Z‐axis profiles were plotted for each Roi, and background signal was subtracted. Data normalization was as described by Vincent et al. (2017): ΔF/F0 = (F–F0)/F0, where F is the fluorescence signal and F0 is the baseline fluorescence signal. Maximal response was ΔFmax/F0. Intensiometric false‐colour videos of response to control solution or ATP were compiled from a representative time series.
Statistical analyses
Analyses used R software (www.r‐project.org; version 3.5.1). An anova, Welch two sample t‐test or paired Student’s t‐test was used to test for statistically significant differences, using a significance threshold of P < 0.05. When using an anova, the Tukey HSD post‐hoc test was employed to determine differences among the groups.
RESULTS
The first millimetre of the root apex is essential for the initial response to eATP
Root apical dissection was used to determine the spatial origin of the eATP‐induced [Ca2+]cyt signature. Either the apical first centimetre of a root (termed ‘intact’) was used, or such root tips were further dissected by removal of approximately the first apical millimetre (termed ‘cut’). The first apical millimetre was removed as imaging with YC3.6 indicated that this region was responsible for the first eATP‐induced [Ca2+]cyt elevation (Matthus et al. 2019a). In control experiments, solution added to intact root tips caused the characteristic monophasic ‘touch response’ (Matthus et al. 2019a, 2020; Mohammad‐Sidik et al. 2021). Maximum [Ca2+]cyt touch response of full Pi‐grown ‘intact’ tips (Fig. 2A) was significantly larger than those (‘cut’) lacking the apical first millimetre (P < 0.001; Fig. 2B). Pi‐starved tips responded less to mechanical stimulation than full Pi‐grown root tips, regardless of whether the apical first millimetre was present (Fig. 2B). The same pattern was observed when analysing the area under the curve (AUC; estimating total [Ca2+]cyt mobilized; Fig. 2C). eATP (1 mM) caused an initial [Ca2+]cyt touch peak, followed by two eATP‐specific peaks in full Pi‐grown intact tips (Fig. 3A). Pi‐starved intact root tips showed the dampened [Ca2+]cyt signature (Fig. 3A), with significantly diminished touch and peak 2 responses compared to full Pi‐grown intact root tips (touch, P < 0.001; peak 1, P = 0.9; peak 2, P < 0.001) and overall lower AUC (P < 0.001). These responses resembled the [Ca2+]cyt signatures of intact aequorin‐expressing Col‐0 root tips to 1 mM eATP reported by Matthus et al. (2019a) using the same conditions.
Fig. 2.

The [Ca2+]cyt response of Pi‐replete and Pi‐starved intact or cut root tips to control solution. Arabidopsis Col‐0 aequorin‐expressing seedlings were grown on full or zero Pi medium. Root tips (1 cm; 'root tip intact’) or cut root tips (1 cm of root tip with the apical 1 mm cut off) were challenged with control solution applied at 35 s, and [Ca2+]cyt was measured for 155 s. (A) Mechanical stimulation (caused by control solution): time course trace represents mean ± SEM from 2 independent trials, with n = 5 individual intact root tips, and 3 independent trials, with n = 15 individual cut root tips averaged per data point. Time course data were analysed for (B) touch maximum, (C) area under the curve (AUC), all baseline‐subtracted, with each dot representing an individual data point. In the boxplot, each dot represents an individual data point. The thick middle line denotes the median, separating the upper and lower half of the data; the hinges (box outline) denote median of the upper and the lower half of the data, respectively; bars denote entirety of data excluding outliers. anova with post‐hoc Tukey test was used to assess statistical differences. Significance ***P < 0.001, n.s. not significant.
Fig. 3.

The [Ca2+]cyt response of Pi‐replete and Pi‐starved intact or cut root tips to eATP. Arabidopsis Col‐0 aequorin‐expressing seedlings were grown on full or zero Pi medium. Root tips (1 cm; ‘root tip intact’) or cut root tips (1 cm of root tip with the apical 1 mm cut off) were challenged with 1 mM eATP applied at 35 s, and [Ca2+]cyt was measured for 155 s. (A) eATP; time course trace represents mean ± SEM from 2 independent trials, with n = 5 individual intact root tips, and 3 independent trials, with n = 19 individual cut root tips averaged per data point. Time course data were analysed for (B) touch maximum, (C) Peak 1 maxima, (D) Peak 2 maxima and (E) area under the curve (AUC), all baseline‐subtracted, with each dot representing an individual data point. In the boxplot, each dot represents an individual data point. The thick middle line denotes the median, separating the upper and lower half of the data; the hinges (box outline) denote median of the upper and the lower half of the data, respectively; the bars denote entirety of data excluding outliers. anova with post‐hoc Tukey test was used to assess statistical differences. Significance: ***P < 0.001, n.s. not significant.
Removing the apical 1 mm of the tip had no significant effect on touch response when eATP was added, regardless of growth regime (Fig. 3B). However, full Pi‐grown tips lacking the apical first millimetre also lacked the characteristic eATP‐induced peak 1. Mean [Ca2+]cyt decreased to almost pre‐treatment baseline level before showing another increase in [Ca2+]cyt, which temporally aligned with the peak 2 observed in intact root tips from full Pi‐grown plants (Fig. 3A). Although the loss of peak 1 appeared striking (Fig. 3A), the effect was not statistically significant (P = 0.057; Fig. 3C). However, in the absence of the first peak, the method of detecting maxima in the sampling phase (Fig. 1) could report values from the end of the touch response or beginning of peak 2, thus overestimating the [Ca2+]cyt of cut tips. When the mean ± SEM [Ca2+]cyt of full Pi‐grown intact tips was compared to that of cut tips at 50 s (a time point within the mean peak 1 of full Pi‐grown intact tips), the response of cut tips was significantly lower than intact tips (cut, 0.04 ± 0.01 µM at 50 s; intact, 0.26 ± 0.01 µM at 50 s; P < 0.001; Fig. 3A), suggesting that the apical first millimetre of the root supports the first eATP‐induced [Ca2+]cyt elevation in Pi‐replete conditions. Peak 2 maxima of full Pi‐grown cut tips were not significantly lower than intact tips, whether using phase analysis or comparing equivalent time points (Fig. 3D). AUC was significantly lower in full Pi‐grown cut root tips compared to intact root tips (Fig. 3E).
Removal of the apical first millimetre abolished the eATP‐specific [Ca2+]cyt increase in zero Pi‐grown root tips (Fig. 3A). Mean [Ca2+]cyt of cut tips was significantly lower than intact tips in the phases encompassing peaks 1 (Fig. 3C) and 2 (Fig. 3D). This was also the case when considering equivalent time points (e.g. peak 1 at 52 s, P < 0.001; peak 2 at 102 s, P < 0.005). AUC was significantly lower in zero Pi‐grown cut root tips compared to intact root tips (Fig. 3E). Overall, the data show that the apical first millimetre of the root tip is a key site for the generation of the first eATP‐induced [Ca2+]cyt increase, regardless of Pi growth status. At this level of resolution, any dependency of peak 2 on peak 1 appears more likely in Pi‐starved roots.
DORN1/P2K1 may not be the only eATP receptor in roots
The [Ca2+]cyt response to eATP of Pi‐replete whole Arabidopsis roots appears to be wholly reliant on the DORN1/P2K1 receptor (Matthus et al. 2019c). Whether it is needed for the eATP response of Pi‐starved roots is unknown. In growth experiments, Pi deprivation impaired primary root growth of both Col and the dorn1‐1 loss‐of‐function mutant, both constitutively expressing (apo)aequorin. Col mean ± SEM primary root length decreased significantly from 4.88 ± 0.06 cm in full Pi to 3.31 ± 0.06 cm in ‐Pi (P < 0.001; 106 and 100 roots, respectively, in 3 independent trials), while dorn1‐1 decreased significantly from 3.81 ± 0.04 cm to 2.22 ± 0.05 cm, respectively (P < 0.001; 90 and 99 roots, respectively, in 3 independent trials). Although the dorn1‐1 roots were significantly shorter than Col under full Pi (P < 0.001) and zero Pi (P < 0.01), the decrease in mean root length on Pi starvation of the two genotypes was similar (1.57 cm for Col, 1.59 for dorn1‐1), suggesting that growth inhibition was independent of DORN1/P2K1. The requirement of DORN1/P2K1 for the response of Pi‐starved and Pi‐replete root apices was tested here, using ‘intact’ 1 cm root tips of the dorn1‐1 loss of function mutant (Fig. 4). In response to control solution, maximal [Ca2+]cyt increase was significantly higher in full Pi‐grown root tips (Col‐0, 0.57 ± 0.07 µM; dorn1‐1: 0.49 ± 0.06 µM) than in zero Pi‐grown root tips (Col‐0, 0.13 ± 0.03 µM; dorn1‐1, 0.17 ± 0.05 µM) for both genotypes (Col‐0, P < 0.001; dorn1‐1, P = 0.001), but did not differ significantly between the genotypes for either Pi condition (Fig. 4A). AUC was significantly higher in full Pi‐grown root tips than zero Pi‐grown tips, regardless of genotype (Col‐0, P = 0.001; dorn1‐1, P = 0.002), and did not differ significantly between genotypes (Fig. 4B). In response to 1 mM eATP, Pi‐starved Col‐0 had a significantly diminished second eATP‐specific peak (full Pi, 0.26 ± 0.01 µM; zero Pi, 0.13 ± 0.01 µM, P < 0.001; Fig. 4C) and significantly lower AUC compared to Pi‐replete root tips (P < 0.001; Fig. 4D). The dorn1‐1 response to eATP was dominated by the touch response, which did not differ significantly from Col‐0, regardless of Pi status (P ≥ 0.424; Fig. 4C). However, a significant increase in [Ca2+]cyt was evident in Pi‐replete dorn1‐1 after the touch response, within the 51–80 s analysis ‘window’ (0.11 ± 0.004 µM, P < 0.001, paired t‐test; Fig. 4C inset). Pi‐starved dorn1‐1 lacked this response. These results point to a DORN1/P2K1‐independent pathway in Pi‐replete root tips that is lost under Pi deprivation.
Fig. 4.

The [Ca2+]cyt response to extracellular ATP requires DORN1/P2K1. Col‐0 and dorn1‐1 were grown on full or zero Pi. Root tips (1 cm) were challenged at 35 s. (A) Control solution; mean ± SEM time course from 3 independent trials, with n = 13–18 individual root tips averaged per data point. Maximum [Ca2+]cyt increase did not differ significantly between the genotypes for either Pi condition. (B) Time course data were analysed for area under the curve (AUC), baseline‐subtracted, with each dot representing an individual data point. Boxplot middle line denotes median. Comparisons shown are Col‐0 versus dorn1‐1 for full Pi and zero Pi. (C, D) Responses to 1 mM eATP (3 independent trials, n = 16–18 individual root tips per growth condition and genotype). In (C) pink arrowhead points to the significant [Ca2+]cyt increase in Pi‐replete dorn1‐1, an enlarged version of which is shown in the pink inset box. anova with post‐hoc Tukey test was used to assess statistical differences. Significance: ***P < 0.001, n.s. not significant.
Phosphate‐starved roots are impaired in sub‐apical [Ca2+]cyt increase in response to eATP measured with GCaMP3
To afford spatial resolution of [Ca2+]cyt changes, Col‐0 expressing cytosolic GCaMP3 was challenged with control solution (Videos S1 and S2) or 1 mM eATP (Videos S3 and S4). Two Roi (‘Region of interest’) were then analysed to assess spatial differences in the response to eATP (Fig. 5). The apical ‘Roi A’ was within the first millimetre of the apex and ‘Roi C’ was distal at 2.5 mm. Control solution led to little change in fluorescence (Fig. 5A–F). There were no significant differences in normalized fluorescence maxima between Pi‐grown and Pi‐starved roots in Roi A (P = 0.999) or Roi C (P = 0.998; Fig. 5C,F). Full Pi‐grown root tips showed a significant fluorescence increase in Roi A with 1 mM eATP (compared to control) that reached its maximum amplitude within 10 s (Fig. 5D–F; normalized fluorescence maxima, P < 0.001). After a time‐lag of approximately 50 s, a significant increase in fluorescence maximum was found in Roi C (Fig. 5A–C; P < 0.001), with the response to eATP being significantly stronger in Roi C compared to Roi A (normalized fluorescence maxima, P < 0.001).
Fig. 5.

The [Ca2+]cyt response to eATP in specific regions of root tips using an intensiometric reporter. Arabidopsis Col‐0 expressing cytosolic GCaMP3 was grown on either full or zero Pi medium for 10 days. Control or 1 mM eATP treatment solution was applied 20 s after the start of image acquisition to the root tip of a seedling resting on gel‐based growth medium, then imaged for 250 s in total. On the left, example root tip with annotated regions of interest (‘Roi’, white boxes), scale bar: 1 mm. (A, B): Roi C; (D, E): Roi A. (A, D) Mean GFP fluorescence intensity ± SEM, background subtracted, and (B, E) normalized GFP fluorescence (ΔF/F0) ± SEM; data from 3 independent trials, with n = 4–7 individual roots per growth condition and treatment. (C, F) Extracted normalized fluorescence maxima (ΔFmax/F0). Boxplot thick line denotes median. anova with post‐hoc Tukey test was used to assess statistical differences. Significance: ***P < 0.001, n.s. not significant.
Zero Pi‐grown root tips also responded significantly more strongly to eATP than to control treatment in Roi A (Fig. 5D–F; normalized fluorescence maxima, P = 0.002). Although the kinetics of the response were altered in zero Pi‐grown roots (Fig. 5D,E), the eATP‐induced normalized maximum in Roi A was not significantly different from full Pi‐grown roots (P = 0.118). In contrast to full Pi‐grown roots, those grown without Pi showed a weak response to eATP treatment in Roi C (Fig. 5A–C; P = 0.58). Thus, these data confirm the observations from aequorin trials: the first millimetre of the apex supports the first eATP‐induced [Ca2+]cyt increase, regardless of Pi nutritional status. The spatial resolution afforded by GCaMP3 resolves a secondary and sub‐apical eATP‐induced [Ca2+]cyt increase, distal to the first millimetre, that is weaker in Pi‐starved roots.
The sub‐apical eATP‐induced [Ca2+]cyt increase is not fully autonomous and relies in part on the apical increase
Full Pi‐grown GCaMP3‐expressing roots were dissected to investigate whether the first apical millimetre influenced the magnitude of the eATP‐induced sub‐apical second [Ca2+]cyt peak. The apical first millimetre was excised and imaged alongside the remaining distal root ‘stump’, so that they received treatment simultaneously (Video S5), then compared with intact roots. Roi A was positioned at the apical root tip, Roi C was positioned 2.5 mm from the apical root tip (white boxes in Fig. 6A). After a slight decrease in fluorescence due to treatment application at 20 s, 1 mM eATP led to an immediate and strong increase in fluorescence intensity in Roi A of both intact and cut roots (Fig. 6B). While intact root Roi A supported a broad monophasic increase (grey trace; Fig. 6B), cut root tip Roi A exhibited a much narrower peak, followed by a smaller shoulder (light green trace; Fig. 6B,C). Nevertheless, normalized maximum response in Roi A was not significantly affected by apical excision (Fig. 6D; P = 0.975). eATP triggered a more gradual fluorescence increase in Roi C, with apical excision’s having little effect on time‐course (Fig. 6B,C). However, intact roots had a significantly higher normalized fluorescence maximum in Roi C (Fig. 6D; P < 0.001). These results suggest that sub‐apical regions can respond directly to eATP but, at the finer spatial resolution afforded by GCaMP3 compared to aequorin, part of their [Ca2+]cyt increase is determined by the initial [Ca2+]cyt increase at the apex.
Fig. 6.

Root dissection reveals that the sub‐apical [Ca2+]cyt response to eATP is not fully autonomous. Arabidopsis Col‐0 expressing the cytosolic GCaMP3 was grown on half MS growth medium (full Pi). Primary roots of 10‐day‐old seedlings were modified prior to the assays by excising 0.8–1.0 mm of apical root tip (‘cut root’) or left as ‘intact root’. At 20 s after the start of image acquisition, control or 1 mM eATP solution was applied to the root tip (and stump), which were then imaged for 250 s in total. (A) Root micrographs depicting cut root (yellow dashed line indicates site of cut, with root tip being placed next to root stump), and intact root, including regions of interest used for analysis (Roi A, Roi C; indicated by white boxes). Scale bar: 1 mm. (B) Mean GFP fluorescence intensity ± SEM, background subtracted, and (C) normalized GFP fluorescence (ΔF/F0) ± SEM; data from 3 independent trials, with n = 6–9 individual roots per root modification. (D) Extracted normalized fluorescence maxima (ΔFmax/F0) of individual Roi, each dot represents an individual data point, boxplot thick line denotes median. anova with post‐hoc Tukey test was used to assess statistical differences. Significance: ***P < 0.001, n.s. not significant.
Transmission of an eATP‐induced [Ca2+]cyt signal from the apex in Pi‐starved roots
The finding of a semi‐autonomous sub‐apical [Ca2+]cyt increase in response to superfusion with eATP necessitated application of eATP to the apex only. This allowed further tests of the relationship between apical and sub‐apical [Ca2+]cyt elevations in a possible ‘wave’. A GCaMP3‐expressing Pi‐starved root was placed over an air gap in the underlying agar medium, thus isolating the regions on either side of that gap from addition of eATP (Fig. S1). The air gap began approximately 1 mm from the root apex, such that the apical tissue likely to generate the first [Ca2+]cyt peak was in contact with the agar. Three Roi were set: at the apex (Roi A), over the air gap (Roi B) and in the mature zone (Roi C at 2.5 mm from the apex; Fig. 7A). Control solution had no effect (Fig. 7B‐J). eATP applied to the apex caused a rapid and significant increase in fluorescence with no recovery to baseline level (Roi A, P < 0.001; Fig. 7B, E, H). Smaller but significant transient fluorescence increases (normalized maxima compared to control) were detected later in the root section over the air gap (Roi B; Fig. 7C–J; P = 0.04) and in the mature zone (Roi C; Fig. 7C–J; P = 0.02). Roi C was in the equivalent position to Roi C in the superfusion experiment (2.5 mm from apex; Fig. 5A–C). In the latter, eATP did not induce a significant [Ca2+]cyt elevation (due to variation) in Roi C, but it is important to note that the mean peak normalized increase in this region was five times larger under superfusion than when eATP was applied only to the apex (mean ± SEM superfusion Roi C, 0.25 ± 0.11; apical application and resultant response in Roi C, 0.05 ± 0.01). As the mature zone was not exposed to eATP, the results suggest a cell‐to‐cell propagative mechanism for [Ca2+]cyt over short distances.
Fig. 7.
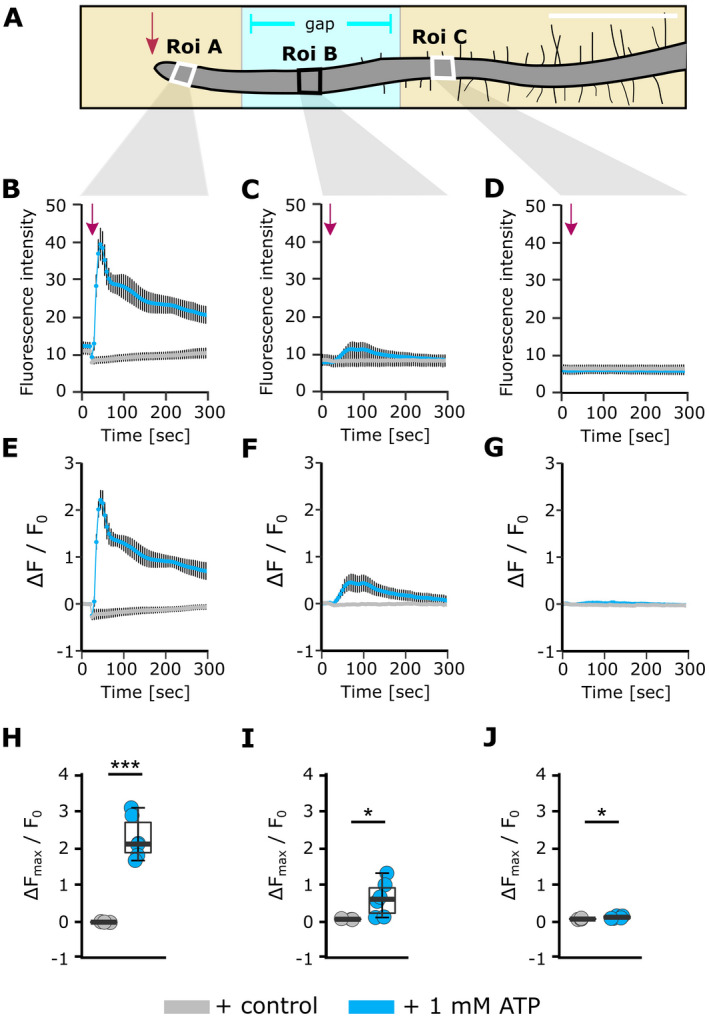
Localized eATP application to the root tip causes progressive [Ca2+]cyt increases in the root. (A) Schematic of a 10‐day‐old Arabidopsis Pi‐starved Col‐0 seedling (expressing cytosolic GCaMP3) placed across a gap in the growth medium agar (Fig. S1). Annotated regions of interest (Roi) were used for analysis, scale bar: 1 mm. At 20 s after the start of image acquisition, 3 μl of control or 1 mM eATP solution was applied to the root tip (indicated by arrow), then imaged for a total 495 s. (B, C, D) Mean GFP fluorescence intensity±SEM, background subtracted, and (E, F, G) normalized GFP fluorescence (ΔF/F0) ± SEM for Roi A, B and C, respectively. Data are from 3 independent trials, with n = 3 individual roots for control treatments per growth condition, and n = 6–9 individual roots per eATP treatment and growth condition. (H, I, J) Extracted normalized fluorescence maxima (ΔFmax/F0) for Roi A, B and C, respectively. Each dot represents an individual data point, middle line denotes median. Significance (P‐values, Welch two sample t‐test) in H–J: ***P < 0.001, *P < 0.05, n.s. >0.05.
DISCUSSION
Root apices are key to the plant’s sensing of and adaptive responses to heterogeneity in soil conditions. Pi starvation results in altered abiotic stress‐induced [Ca2+]cyt signatures in Arabidopsis root tips (Matthus et al. 2019a). These include the response to mechanical stress: Pi‐starved root tips or whole roots expressing cytosolic aequorin were found to have a lower [Ca2+]cyt touch response than Pi‐replete root tips (Matthus et al. 2019a, 2020). This phenomenon was also observed here (Fig. 2). Mechanical stimulation can evoke a spatially complex [Ca2+]cyt signature, and sensitivity varies along the root (Monshausen et al. 2009; Krogman et al. 2020). The simple experiment of removing the first apical millimetre of full Pi‐grown root tips significantly reduced (but did not abolish) their touch response, helping to site the origin of this mechanically‐induced [Ca2+]cyt signature. Pi‐starved root tips were unaffected by excision of the first apical millimetre, suggesting that their [Ca2+]cyt touch response originates more sub‐apically. These Pi‐dependent changes in the touch response were not evident in the trials using GCaMP3 as the [Ca2+]cyt reporter. This may be due to the differences in mechanical stress experienced by the root tip as a consequence of different solution application methods (pump injection for aequorin versus pipette application for GCaMP3), or differences in experimental handling/conditions that could change the root’s touch sensitivity. It is unlikely to reflect the sensitivity of GCaMP3 as it has a far higher Kd for Ca2+ (405 to 660 nM) than aequorin (7 to 13 µM). The mechanistic basis of the dampened touch response of Pi‐starved aequorin‐expressing roots could have a variety of origins, including downregulation of mechano‐sensitive Ca2+ influx pathways involving the plasma membrane proteins MCA1 (Mid1‐Complementing Activity1; Okamoto et al. 2021), AtPiezo (Fang et al. 2021) or DEK1 (Defective Kernel 1; Tran et al. 2017). It would be interesting to determine whether Pi‐starved roots also have aberrant touch‐induced hormonal responses, such as impaired regulation of ethylene and jasmonic acid, and whether these relate to touch‐induced changes in root system architecture (Chehab et al. 2012; Jacobsen et al. 2021; Okamoto et al. 2021). This could be relevant to the challenge of breeding crops for compacted and Pi‐poor soils (Kolb et al. 2017).
The primary root apex is also a hotspot of extracellular ATP accumulation (Weerasinghe et al. 2009), and the abundance of the DORN1/P2K1 eATP receptor is higher there than in distal regions (Matthus et al. 2019c). The mechanical stress experienced as roots grow through soil is sufficient to promote further eATP accumulation, regulated by plasma membrane heterotrimeric G proteins (Weerasinghe et al. 2009). Salt, osmotic and cold stress can also increase eATP accumulation by roots (Dark et al. 2011; Lang et al. 2014; Deng et al. 2015), as can wounding and endophyte colonization (Dark et al. 2011; Nizam et al. 2019). eATP appears able to stimulate root adaptive responses, affording protection against abiotic stress (Lang et al. 2014), limiting colonization of the endophyte Serendipita indica (Nizam et al. 2019) and enhancing protection against pathogens (Kumar et al. 2020). Using excised root tips to study the eATP‐evoked [Ca2+]cyt signature helps to negate any possible effects of changes in root architecture caused by Pi deprivation (Matthus et al. 2019a). Moreover, using tips rather than whole roots has permitted resolution of a small, but significant, DORN1/P2K1‐independent pathway to [Ca2+]cyt elevation in Pi‐replete roots (Fig. 4C). This was lost under Pi‐starvation. DORN1‐P2K1 expression does not respond to Pi starvation (Lin et al. 2011; Lan et al. 2012; genevestigator.com), neither to nitrogen nor K+ deficiency (Kellermeier et al. 2014). However, the abundance of DORN1/P2K1 in roots has been reported to increase on Pi starvation (Lan et al. 2012). These data suggest that DORN1‐P2K1 remains operational under nutrient shortages to effect a robust eATP signalling system and that the impaired second eATP‐induced [Ca2+]cyt response of Pi‐starved roots may not simply be due to lack of the receptor in the sub‐apical region. That the putative DORN1‐P2K1‐independent pathway was Pi‐sensitive may help resolve its mechanistic basis. Recently, a DORN1/P2K1‐independent [Ca2+]cyt elevation was observed in leaves (Matthus et al. 2019c), and results presented here in roots augment the findings of Zhu et al. (2018, 2020) that eATP effects on roots may not always require DORN1/P2K1.
It is clear from use of both aequorin and GCaMP3 trials that Pi‐starvation impairs the eATP‐induced [Ca2+]cyt response, in agreement with a previous study using aequorin and YC3.6 (Matthus et al. 2019a). Specifically, the second eATP‐induced [Ca2+]cyt elevation is consistently weakened. Excision experiments using aequorin revealed that the first apical millimetre of Pi‐replete root tips is essential for the first eATP‐induced [Ca2+]cyt peak and seemingly the entire [Ca2+]cyt response of Pi‐starved root tips (Fig. 1). That first apical millimetre includes the root cap, meristem and elongation zone; as previously stated, this is a region of high eATP accumulation and DORN1/P2K1 eATP receptor abundance. The spatial resolution afforded by GCaMP3 showed that the kinetics of the [Ca2+]cyt response to eATP within the first apical millimetre was influenced by Pi nutrition (Fig. 5). This, in addition to overall change in [Ca2+]cyt signature, could be relevant to any downstream transcriptional response, as modelling suggests that decay time strongly influences those events (Lenzoni et al. 2018). It would be interesting to determine whether such an altered transcriptional response governed by the first eATP‐induced [Ca2+]cyt peak in that first apical millimetre could be involved in the altered root growth that occurs on Pi starvation, although preliminary experiments here suggested that inhibition of primary root growth was independent of DORN1/P2K1. Excision experiments with GCaMP3 showed that sub‐apical regions can respond directly to eATP, indicating a level of autonomy, but with a weaker response than in intact roots. This autonomy could be important for the root’s ability to sense eATP emanating from microbes in the vicinity. The use of an air gap in the underlying growth medium permitted application of eATP only to the apex, allowing the effect of Pi starvation on the sub‐apical response to be resolved clearly and without any confounding effects that excision or superfusion with eATP might cause. Although small, a significant [Ca2+]cyt increase occurred in the mature zone (beyond the air gap) when eATP was added to the apex. This is consistent with a [Ca2+]cyt ‘wave’ that propagates from the apex but gradually diminishes. As the GCaMP3 reporter is comparably insensitive to subtle changes in [Ca2+]cyt, the data presented likely underestimate the extent of any systemic [Ca2+]cyt signal propagation compared to the more sensitive reporter (YCnano‐65) used in studying salt‐induced‐waves (Choi et al. 2014b). Nevertheless, the intensiometric GCaMP3 reporter promises ease of imaging using a less specific microscope set‐up.
The salt‐induced [Ca2+]cyt wave is underpinned by RBOHD and the vacuolar Ca2+ release channel TPC1 (Two Pore Channel1; Evans et al. 2016). As DORN1/P2K1 interacts with RBOHD in guard cells (Chen et al. 2018), and is involved in eATP regulation of root hair growth (Clark et al. 2010), this NADPH oxidase may reprise its role in the root eATP‐induced wave. As with the salt wave, the plasma membrane Ca2+ channels that contribute to initiation and propagation need to be identified at the genetic level. It has been suggested that DORN1/P2K1 could generate cyclic nucleotides that could activate Cyclic Nucleotide‐Gated Channels (CNGC) (Sun et al. 2021). CNGC14 has been tested in Pi‐replete conditions and found not to be involved (Shih et al. 2015). However, CNGC2, CNGC4 and CNGC6 have since been shown to contribute to the root eATP‐induced [Ca2+]cyt elevation in Pi‐replete conditions (Duong et al. 2022; Wang et al. 2022). Among the Glutamate Receptor‐Like family (GLR), GLR3.3 and GLR3.6 are involved in leaf wounding and signal propagation (Vincent et al. 2017). It is tempting to place them in the eATP‐induced signature and wave, particularly if (as in tea) Pi deficiency decreases glutamate (Ding et al. 2017). This might help explain the diminution of the sub‐apical component. As yet, no putative Ca2+ channels have been found to be downregulated at the protein level in response to Pi deprivation (e.g. Lan et al. 2012). Neither have they been found in phosphorylation studies of Pi deprivation (Duan et al. 2013). Annexins may have Ca2+ transport capacity but are multifunctional proteins (Laohavisit & Davies, 2010). Arabidopsis Annexin4 can support an eATP‐induced [Ca2+]cyt elevation when expressed in HEK cells (Ma et al. 2019), while Annexin1 supports a significant proportion of the whole root [Ca2+]cyt response to eATP (Mohammad‐Sidik et al. 2021). Identification of the components involved will greatly improve understanding of the eATP‐induced signature and wave as a function of Pi nutrition, helping to elucidate the downstream consequences in roots and potentially shoots.
Supporting information
Fig S1. Brightfield image of a phosphate‐starved Arabidopsis root laid across an air gap on an agar plate to carry out GCaMP3 ‘wave’ experiments.
Video S1. Full Pi‐grown Col0 root expressing GCaMP3 responding to control solution added at 20 s after start of image acquisition; scale bar, 1 mm.
Video S2. Zero Pi‐grown Col0 root expressing GCaMP3 responding to control solution added at 20 s after start of image acquisition; scale bar, 1 mm.
Video S3. Full Pi‐grown Col0 root expressing GCaMP3 responding to 1 mM ATP added at 20 s after start of image acquisition; scale bar, 1 mm.
Video S4. Zero Pi‐grown Col0 root expressing GCaMP3 responding to 1 mM ATP added at 20 s after start of image acquisition; scale bar, 1 mm.
Video S5. Full Pi‐grown Col0 root expressing GCaMP3, with apex excised and placed next to remaining ‘stump’, responding to 1 mM ATP added at 20 s after start of image acquisition; scale bar, 1 mm.
Acknowledgements
We thank the BBSRC Doctoral Training Programme (BB/J014540/1), Yayasan Daya Diri and the University of Cambridge Broodbank Trust and Commonwealth, European and International Trusts for financial support. The GCaMP3 line was a gift from Prof. Alex Webb (University of Cambridge) and the dorn1‐1 mutant was a gift from Prof. Gary Stacey (University of Missouri). We thank Dr Limin Wang for helpful discussion and Dr Adeeba Dark for technical support.
References
- Chehab E.W., Yao C., Henderson Z., Kim S., Braam J. (2012) Arabidopsis touch‐induced morphogenesis is jasmonate‐mediated and protects against stress. Current Biology, 22, 701–706. [DOI] [PubMed] [Google Scholar]
- Chen D., Cao Y., Li H., Kim D., Ahsan N., Thelen J., Stacey G. (2018) Extracellular ATP elicits DORN1‐mediated RBOHD phosphorylation to regulate stomatal aperture. Nature Communications, 18, 2265. [DOI] [PMC free article] [PubMed] [Google Scholar]
- Chivasa S., Ndimba B.K., Simon W.J., Lindsey K., Slabas A.R. (2005) Extracellular ATP functions as an endogenous external metabolite regulating plant cell viability. The Plant Cell, 17, 3019–3034. [DOI] [PMC free article] [PubMed] [Google Scholar]
- Choi J., Tanaka K., Cao Y., Qi Y., Qiu J., Liang Y., Lee S.Y., Stacey G. (2014a) Identification of a plant receptor for extracellular ATP. Science, 343, 290–294. [DOI] [PubMed] [Google Scholar]
- Choi W.G., Toyota M., Kim S.H., Hilleary R., Gilroy S. (2014b) Salt stress‐induced Ca2+ waves are associated with rapid, long‐distance root‐to‐shoot signalling in plants. Proceedings of the National Academy of Sciences, USA, 111, 6497–6502. [DOI] [PMC free article] [PubMed] [Google Scholar]
- Clark G., Wu M., Wat N., Onyirimba J., Pham T., Herz N., Ogoti J., Gomez D., Canales A.A., Aranda G., Blizard M., Nyberg T., Terry A., Torres J., Wu J., Roux S.J. (2010) Both the stimulation and inhibition of root hair growth induced by extracellular nucleotides in Arabidopsis are mediated by nitric oxide and reactive oxygen species. Plant Molecular Biology, 74, 423–435. [DOI] [PubMed] [Google Scholar]
- Costa A., Candeo A., Fieramonti L., Valentini G., Bassi A. (2013) Calcium dynamics in root cells of Arabidopsis thaliana visualized with Selective Plane Illumination Microscopy. PLoS One, 10.1371/journal.pone.0075646. [DOI] [PMC free article] [PubMed] [Google Scholar]
- Dark A.M., Demidchik V., Richards S.L., Shabala S.N., Davies J.M. (2011) Release of extracellular purines from plant roots and effect on ion fluxes. Plant Signaling and Behavior, 6, 1855–1857. [DOI] [PMC free article] [PubMed] [Google Scholar]
- Demidchik V., Nichols C., Dark A., Oliynyk M., Glover B.J., Davies J.M. (2003) Is ATP a signaling agent in plants? Plant Physiology, 133, 456–461. [DOI] [PMC free article] [PubMed] [Google Scholar]
- Demidchik V., Shang Z., Shin R., Thompson E.P., Rubio L., Laohavisit A., Mortimer J.C., Chivasa S., Slabas A.R., Glover B.J., Schachtman D.P., Davies J.M. (2009) Plant extracellular ATP signalling by plasma membrane NADPH oxidase and Ca2+ channels. The Plant Journal, 58, 903–913. [DOI] [PubMed] [Google Scholar]
- Deng S., Sun J., Zhao R., Ding M., Zhang Y., Sun Y., Wang W., Tan Y., Liu D., Ma X., Hou P., Wang M., Lu C., Shen X., Chen S. (2015) Populus euphratica APYRASE2 enhances cold tolerance by modulating vesicular trafficking and extracellular ATP in Arabidopsis plants. Plant Physiology, 169, 530–548. [DOI] [PMC free article] [PubMed] [Google Scholar]
- Ding Z., Jia S., Wang Y., Xiao J., Zhang Y. (2017) Phosphate stresses affect ionome and metabolome in tea plants. Plant Physiology and Biochemistry, 120, 30–39. [DOI] [PubMed] [Google Scholar]
- Duan G., Walther D., Schulze W.X. (2013) Reconstruction and analysis of nutrient‐induced phosphorylation networks in Arabidopsis thaliana . Frontiers in Plant Science, 4, 10.3389/fpls.2013.00540. [DOI] [PMC free article] [PubMed] [Google Scholar]
- Duong H.N., Cho S.‐H., Wang L., Pham A.Q., Davies J.M., Stacey G. (2022) Cyclic Nucleotide Gated Ion Channel 6 is involved in extracellular ATP signaling and plant immunity. The Plant Journal, 109, 1386‐1396. [DOI] [PMC free article] [PubMed] [Google Scholar]
- Evans M.J., Choi W.G., Gilroy S., Morris R.J. (2016) A ROS‐associated calcium wave dependent on the AtRBOHD NADPH oxidase and TPC1 cation channel propagates the systemic response to salt stress. Plant Physiology, 171, 1771–1784. [DOI] [PMC free article] [PubMed] [Google Scholar]
- Fang X.M., Liu B.B., Shao Q.S., Huang X.M., Li J., Luan S., He K. (2021) AtPiezo plays an important role in root cap mechanostranduction. International Journal of Molecular Sciences, 22, 467. [DOI] [PMC free article] [PubMed] [Google Scholar]
- Hou Q.Z., Sun K., Zhang H., Su X., Fan B.Q., Feng H.Q. (2018) The responses of photosystem II and intracellular ATP production of Arabidopsis leaves to salt stress are affected by extracellular ATP. Journal of Plant Research, 131, 331–339. [DOI] [PubMed] [Google Scholar]
- Jacobsen A.G.R., Jervis G., Xu J., Topping J.F., Lindsey K. (2021) Root growth responses to mechanical impedance are regulated by a network of ROS, ethylene and auxin signalling in Arabidopsis. New Phytologist, 231, 225–242. [DOI] [PMC free article] [PubMed] [Google Scholar]
- Jeter C.R., Tang W., Henaff E., Butterfield T., Roux S.J. (2004) Evidence of a novel cell signaling role for extracellular adenosine triphosphates and diphosphates in Arabidopsis . The Plant Cell, 16, 2652–2664. [DOI] [PMC free article] [PubMed] [Google Scholar]
- Jewell J.B., Sowders J.M., He R., Willis M.A., Gang D.R., Tanaka K. (2019) Extracellular ATP shapes a defense‐related transcriptome both independently and along with other defense signaling pathways. Plant Physiology, 179, 1144–1158. [DOI] [PMC free article] [PubMed] [Google Scholar]
- Kellermeier F., Armengaud P., Seditas T.J., Danku J., Salt D.E., Amtmann A. (2014) Analysis of root system architecture provides a quantitative readout of crosstalk between nutritional signals. The Plant Cell, 26, 1480–1496. [DOI] [PMC free article] [PubMed] [Google Scholar]
- Kelner A., Leitão N., Chaboud M., Charpentier M., de Carvalho‐Niebel F. (2018) Dual color sensors for simultaneous analysis of calcium signal dynamics in the nuclear and cytoplasmic compartments of plant cells. Frontiers in Plant Science, 9, 242. [DOI] [PMC free article] [PubMed] [Google Scholar]
- Kolb E., Legué V., Bogeat‐Triboulot M.B. (2017) Physical root–soil interactions. Physical Biology, 14, 065004. [DOI] [PubMed] [Google Scholar]
- Krogman W., Sparks J.A., Blancaflor E.B. (2020) Cell type‐specific imaging of calcium signaling in Arabidopsis thaliana seedling roots using GCaMP3. International Journal of Molecular Sciences, 21, 6385–6399. [DOI] [PMC free article] [PubMed] [Google Scholar]
- Kumar S., Tripathi D., Okubara P.A., Tanaka K. (2020) Purinoceptor P2K1/DORN1 enhances plant resistance against a soilborne fungal pathogen. Rhizoctonia Solani. Frontiers in Plant Science, 11, 572920. [DOI] [PMC free article] [PubMed] [Google Scholar]
- Lan P., Li W., Schmidt W. (2012) Complementary proteome and transcriptome profiling in phosphate‐deficient Arabidopsis roots reveals multiple levels of gene regulation. Molecular and Cellular Proteomics, 11, 1156–1166. [DOI] [PMC free article] [PubMed] [Google Scholar]
- Lang T., Sun H.M., Li N.Y., Lu Y.J., Shen Z.D., Jing X.S., Xiang M., Shen X., Chen S.L. (2014) Multiple signalling networks of extracellular ATP, hydrogen peroxide, calcium and nitric oxide in the mediation of root ion fluxes in secretor and non‐secretor mangroves under salt stress. Aquatic Botany, 119, 33–43. [Google Scholar]
- Laohavisit A., Davies J.M. (2010) Annexins. New Phytologist, 189, 40–53. [DOI] [PubMed] [Google Scholar]
- Lenzoni G., Liu J., Knight M.R. (2018) Predicting plant immunity gene expression by identifying the decoding mechanism of calcium signatures. New Phytologist, 217, 1598–1609. [DOI] [PubMed] [Google Scholar]
- Lin W.‐D., Liao Y.‐Y., Yang T.J.W., Pan C.‐Y., Buckhout T.J., Schmidt W. (2011) Coexpression‐based clustering of Arabidopsis root genes predicts functional modules in early phosphate deficiency signaling. Plant Physiology, 155, 1383–1402. [DOI] [PMC free article] [PubMed] [Google Scholar]
- Ma L., Ye J., Yang Y., Lin H., Yue L., Luo J., Long Y.U., Fu H., Liu X., Zhang Y., Wang Y.I., Chen L., Kudla J., Wang Y., Han S., Song C.‐P., Guo Y. (2019) The SOS2‐SCaBP8 complex generates and fine‐tunes an AtANN4‐dependent calcium signature under salt stress. Developmental Cell, 48, 697–709. [DOI] [PubMed] [Google Scholar]
- Matthus E., Doddrell N.H., Guillaume G., Mohammad‐Sidik A., Wilkins K.A., Swarbreck S.M., Davies J.M. (2020) Phosphate deprivation can impair mechano‐stimulated cytosolic free calcium elevation in Arabidopsis roots. Plants, 9, 1205. [DOI] [PMC free article] [PubMed] [Google Scholar]
- Matthus E., Sun J., Wang L., Bhat M.G., Mohammad‐Sidik A.B., Wilkins K.A., Leblanc‐Fournier N., Legué V., Moulia B., Stacey G., Davies J.M. (2019c) DORN1/P2K1 and purino‐calcium signalling in plants: making waves with extracellular ATP. Annals of Botany, 124, 1227–1242. [DOI] [PMC free article] [PubMed] [Google Scholar]
- Matthus E., Wilkins K.A., Swarbreck S.M., Doddrell N.H., Doccula F.G., Costa A., Davies J.M. (2019a) Phosphate starvation alters abiotic‐stress‐induced cytosolic free calcium increase in roots. Plant Physiology, 179, 1754–1767. [DOI] [PMC free article] [PubMed] [Google Scholar]
- Matthus E., Wilkins K.A., Davies J.M. (2019b) Iron availability modulates the Arabidopsis thaliana root calcium signature evoked by exogenous ATP. Plant Signalling and Behavior, 10.1080/15592324.2019.1640563. [DOI] [PMC free article] [PubMed] [Google Scholar]
- Mohammad‐Sidik A., Sun J., Shin R., Song Z., Ning Y., Matthus E., Wilkins K.A., Davies J.M. (2021) Annexin1 is a component of eATP‐induced cytosolic calcium elevation in Arabidopsis thaliana roots. International Journal of Molecular Sciences, 22, 494. [DOI] [PMC free article] [PubMed] [Google Scholar]
- Monshausen G.B., Bibikova T.N., Weisenseel M.H., Gilroy S. (2009) Ca2+ regulates reactive oxygen species production and pH during mechanosensing in Arabidopsis roots. The Plant Cell, 21, 2341–2356. [DOI] [PMC free article] [PubMed] [Google Scholar]
- Nguyen C.T., Kurenda A., Stolz S., Chetelat A., Farmer E.E. (2018) Identification of cell populations necessary for leaf to leaf electrical signalling in a wounded plant. Proceedings of the National Academy of Sciences, USA, 115, 10178–10183. [DOI] [PMC free article] [PubMed] [Google Scholar]
- Nizam S., Qiang X., Wawra S., Nostadt R., Getzke F., Schwanke F., Dreyer I., Langen G., Zuccaro A. (2019) Serendipita indica E50NT modulates extracellular nucleotide levels in the plant apoplast and affects fungal colonization. EMBO Reports, 20, e47430. [DOI] [PMC free article] [PubMed] [Google Scholar]
- Okamoto T., Takatani S., Noutoshi Y., Motose H., Iida H., Takahashi T. (2021) The root growth reduction in response to mechanical stress involves ethylene‐mediated microtubule reorganization and transmembrane receptor‐mediated signal transduction in Arabidopsis . Plant Cell Reports, 40, 575–582. [DOI] [PubMed] [Google Scholar]
- Shih H.W., De Pew C.L., Miller N.D., Monshausen G.B. (2015) The cyclic nucleotide‐gated channel CNGC14 regulates root gravitropism in Arabidopsis thaliana . Current Biology, 25, 3119–3125. [DOI] [PubMed] [Google Scholar]
- Sun J., Ning Y., Wang L., Wilkins K.A., Davies J.M. (2021) Damage signalling by extracellular nucleotides; a role for cyclic nucleotides in elevating cytosolic free calcium? Frontiers in Plant Sciences, 10.3389/fpls.2021.788514. [DOI] [PMC free article] [PubMed] [Google Scholar]
- Tanaka K., Swanson S.J., Gilroy S., Stacey G. (2010) Extracellular nucleotides elicit cytosolic free calcium oscillations in Arabidopsis . Plant Physiology, 154, 705–719. [DOI] [PMC free article] [PubMed] [Google Scholar]
- Tran D., Galletti R., Neumann E.D., Dubois A., Sharif‐Naeni R., Geitmann A., Frachisse J.‐M., Hamant O., Ingram G.C. (2017) A mechanosensitive Ca2+ channel activity is dependent on the developmental regulator DEK1. Nature Communications, 8, 1009. [DOI] [PMC free article] [PubMed] [Google Scholar]
- Tripathi D., Zhang T., Koo A.J., Stacey G., Tanaka K. (2018) Extracellular ATP acts on jasmonate signaling to reinforce plant defense. Plant Physiology, 176, 511–523. [DOI] [PMC free article] [PubMed] [Google Scholar]
- Vincent T.R., Avramova M., Canham J., Higgins P., Bilkey N., Mugford S.T., Pitino M., Toyota M., Gilroy S., Miller A.J., Hogenhout S.A., Sanders D. (2017) Interplay of plasma membrane and vacuolar ion channels, together with BAK1, elicits rapid cytosolic calcium elevations in Arabidopsis during aphid feeding. The Plant Cell, 29, 1460–1479. [DOI] [PMC free article] [PubMed] [Google Scholar]
- Waadt R., Köster P., Andrés Z., Waadt C., Bradamante G., Lampou K., Kudla J., Schumacher K. (2020) Dual‐reporting transcriptionally linked genetically encoded fluorescent indicators resolve the spatiotemporal coordination of cytosolic abscisic acid and second messenger dynamics in Arabidopsis . The Plant Cell, 32, 2582–2601. [DOI] [PMC free article] [PubMed] [Google Scholar]
- Wang L., Ning Y., Sun J., Wilkins K.A., Matthus E., McNelly R.E., Dark A., Rubio L., Moeder W., Yoshioka K., Véry A.A., Stacey G., Leblanc‐Fournier N., Legué V., Moulia B., Davies J.M. (2022) Arabidopsis thaliana Cyclic Nucleotide‐Gated Channel2 mediates extracellular ATP signal transduction in root epidermis. New Phytologist, 234, 412–421. [DOI] [PMC free article] [PubMed] [Google Scholar]
- Weerasinghe R.R., Swanson S.J., Okada S.F., Garrett M.B., Kim S.‐Y., Stacey G., Boucher R.C., Gilroy S., Jones A.M. (2009) Touch induces ATP release in Arabidopsis roots that is modulated by the heterotrimeric G‐protein complex. FEBS Letters, 583, 2521–2526. [DOI] [PMC free article] [PubMed] [Google Scholar]
- Wu Y.S., Qin B.Z., Feng K.L., Yan R.L., Kang E.F., Liu T., Shang Z.L. (2018) Extracellular ATP promoted pollen germination and tube growth of Nicotiana tabacum through promoting K+ and Ca2+ absorption. Plant Reproduction, 31, 399–410. [DOI] [PubMed] [Google Scholar]
- Zhu R., Dong X., Hao W., Gao W., Zhang W., Xia S., Liu T., Shang Z. (2018) Heterotrimeric G protein‐regulated Ca2+ influx and PIN2 asymmetric distribution are involved in Arabidopsis thaliana roots’ avoidance response to extracellular ATP. Frontiers in Plant Science, 8, 1522. [DOI] [PMC free article] [PubMed] [Google Scholar]
- Zhu R., Dong X., Xue Y., Xu J., Zhang A., Feng Z.Q., Xia S., Yin Y., He S., Li Y., Liu T., Kang E., Shang Z. (2020) Redox‐Responsive transcription Factor 1 (RRTF1) is involved in ATP‐regulated Arabidopsis thaliana seedling growth. Plant and Cell Physiology, 61, 685–698. [DOI] [PubMed] [Google Scholar]
Associated Data
This section collects any data citations, data availability statements, or supplementary materials included in this article.
Supplementary Materials
Fig S1. Brightfield image of a phosphate‐starved Arabidopsis root laid across an air gap on an agar plate to carry out GCaMP3 ‘wave’ experiments.
Video S1. Full Pi‐grown Col0 root expressing GCaMP3 responding to control solution added at 20 s after start of image acquisition; scale bar, 1 mm.
Video S2. Zero Pi‐grown Col0 root expressing GCaMP3 responding to control solution added at 20 s after start of image acquisition; scale bar, 1 mm.
Video S3. Full Pi‐grown Col0 root expressing GCaMP3 responding to 1 mM ATP added at 20 s after start of image acquisition; scale bar, 1 mm.
Video S4. Zero Pi‐grown Col0 root expressing GCaMP3 responding to 1 mM ATP added at 20 s after start of image acquisition; scale bar, 1 mm.
Video S5. Full Pi‐grown Col0 root expressing GCaMP3, with apex excised and placed next to remaining ‘stump’, responding to 1 mM ATP added at 20 s after start of image acquisition; scale bar, 1 mm.