Summary
Tomographic diffraction microscopy (TDM) is a tool of choice for high‐resolution, marker‐less 3D imaging of biological samples. Based on a generalization of digital holographic microscopy with full control of the sample's illumination, TDM measures, from many illumination directions, the diffracted fields in both phase and amplitude. Photon budget associated to TDM imaging is low. Therefore, TDM is not limited by phototoxicity issues. The recorded information makes it possible to reconstruct 3D refractive index distribution (with both refraction and absorption contributions) of the object under scrutiny, without any staining. In this contribution, we show an alternate use of this information. A tutorial for multimodal image reconstruction is proposed. Both intensity contrasts and phase contrasts are proposed, from the image formation model to the final reconstruction with both 2D and 3D rendering, turning TDM into a kind of ‘universal’ digital microscope.
Keywords: holography, microscopy, tomography
1. INTRODUCTION
Optical microscopy is essential in bio‐imaging. Fluorescence microscopy has become the reference, thanks to its unique chemical, therefore functional, specificity and its unsurpassed resolution, allowed by the development of fluorescence nanoscopy techniques. 1 , 2 , 3 , 4 However, fluorescence can also present limitations like photobleaching of fluorophores, which handicaps long‐term measurements and can induce phototoxicity, 5 or difficulties in labelling in some cases, or because of legal requirements, in particular in biology or in food industry, when one cannot label samples or use genetically modified organisms. Also, markers can sometimes interfere with the measurements. 6 , 7
Interferometric microscopy techniques can be considered to tackle this issue. These methods allow for quantitative phase imaging (QPI) in biomedicine. 8 Implementations based on short coherence interferometry, 9 Fourier ptychography, 10 and digital holographic microscopy (DHM) 11 have been demonstrated. In the remaining, we will focus on DHM implementations of QPI. DHM, in association with light‐backpropagation algorithms, 12 , 13 makes it possible for pseudo‐3D volumetric reconstruction over a large depth of field. 14 However, resolution along the light propagation axis is lost, inhibiting DHM to be considered as a full 3D imaging technique. 15 , 16
Full 3D reconstruction of biological samples have been demonstrated with tomographic diffraction microscopy (TDM). 15 , 16 , 17 , 18 , 19 TDM is a generalization of DHM experiments with a full control of the investigated object illumination angle. This angle can be modified by rotating the object within the illumination beam, 20 sweeping the illumination beam on the object 21 or combining both approaches. 22 , 23 , 24 , 25 From these acquisitions, it is possible to reconstruct, in 3D, both the real (refraction) and imaginary part (absorption) of the imaged sample's refractive index, 26 , 27 , 28 with an improved lateral resolution, compared to conventional microscopes, 16 even down to the 100 nm resolution. 29 Three‐dimensional isotropic resolution imaging has also been recently demonstrated. 23 , 25 The possibility of extracting 3D information about the refractive index of the imaged sample is an appealing feature of TDM. However, selectivity of the content is lost, and structural details can be missed. Therefore, TDM images can be difficult to interpret compared to images extracted with more common microscope modalities.
In this work, we propose to take benefit of the capabilities of TDM to accurately measure the 3D optical field coming from an object, to reconstruct images that would have been obtained with other microscopic imaging modalities. This will allow to take benefits of the TDM capabilities, together with the content discrimination brought by other techniques. Starting from TDM acquisitions, and using the image formation models of classical optical microscopes, we are able to simulate the behaviour of ‘routine’ microscopes (e.g. bright‐field or dark‐field microscopes), phase‐contrast improved microscopes (e.g. phase contrast or differential interference contrast [DIC] microscopes), as well as some less common imaging modalities (e.g. oblique illumination, or Rheinberg illumination microscopes), leading to a kind of ‘universal digital microscope’ from TDM acquisitions.
2. TDM PRINCIPLES
QPI techniques rely on the use of interferometry to extract both amplitude and phase of the field diffracted by the imaged object. As far as DHM is concerned, this extraction is either performed by spatial 30 or temporal demodulation. 31 , 32 TDM is a generalized version of DHM with a full control of the object illumination angle. 17 , 33 A sketch of the transmission TDM we developed is proposed in Figure 1. Light, emerging from a He–Ne laser ( nm), is split into a reference beam (depicted in red in Figure 1) and an object beam (in blue in Figure 1). Both paths are brought to interfere on the CMOS (Complementary Metal Oxyde Semi‐conductor) sensor within an off‐axis Mach–Zenhder configuration. The main difference between DHM and TDM consists in the use of a Tip/Tilt mirror (Newport™ FSM 300 fast steering mirror) for condenser back‐focal plane scanning. Therefore, a plane wave with a controlled angle illuminates the sample. From these acquired holograms, 3D information can be reconstructed using a synthetic aperture process. Considering the first Born approximation, the object wavevectors can be reconstructed using the elasticity condition
| (1) |
with the illumination wavevector (associated with the illumination angle) and the associated set of diffracted wavevectors for each hologram. 34 The wavevectors map the Ewald sphere. 26 However, as diffracted light is collected in transmission with a limited numerical aperture (NA), the measured vector set maps the Mc Cutchen pupil, which can be viewed as a cap of sphere, whose cord is limited by the collection objective NA. 35 Construction of the 3D object potential is depicted Figure 1B. The diffracted wavectors maps the Ewald sphere (blue dashed line Figure 1). The Mc Cutchen pupil, denoted is shown in red. From Equation (1), information is reallocated by subtracting the illumination vector contribution. The case of perpendicular illumination, along the optical axis, corresponding to classical DHM, is illustrated in Figure 1(i). Case of illumination at maximal NA is proposed in Figure 1(ii,iii). Combining tens to hundreds of holograms makes it possible to build the full 3D object potential as can be seen in Figure 1(iv) in transmission 36 (similar constructions holds for reflection or 4Pi TDM 17 , 37 ). Taking the 3D inverse Fourier transform of this 3D object potential, one can reconstruct the 3D complex refractive index distribution of the investigated sample.
FIGURE 1.
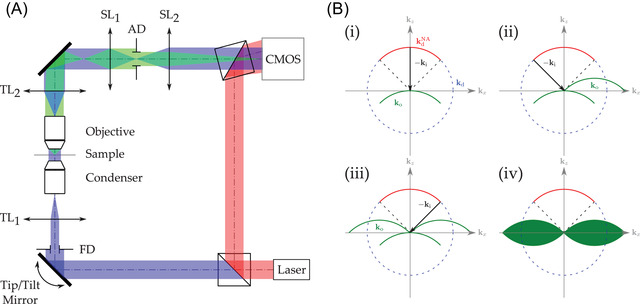
(A) Sketch of a typical DHM‐based TDM configuration. Red beam is associated with the reference wavefront, blue beam is the illumination wavefront and green beam is the wavefront diffracted by the investigated sample. and , respectively, denote the condenser and microscope objective tube lenses. The sampling doublet made of and lenses ensures adequate sampling of the interferograms. FD and AD are the Field Diaphragm and the Aperture Diaphragm, respectively. (B) Building of the 3D object potential from sequential hologram acquisitions (illustrated in 2D for convenience). Hologram spectrum registering according to Equation (1) for perpendicular illumination (i), at collection objective maximum NA (ii,iii), full 3D object potential (iv)
An example of tomographic reconstruction is proposed in Figure 2. The slices of the 3D reconstructed data cube show both the refraction (A) and absorption (B) of a Helianthus tuberosus pollen grain for a given z position (3D rendering of both refraction and absorption is provided in Media TDM.avi). The associated TDM acquisition is consisted in the sequential acquisition of 400 holograms. The illumination scanning pattern was chosen to be the 3D‐Uniform Sampled scheme proposed in Refs. 36, 37, as it has been shown to provide the best possible filling of the Fourier space. It can also be noticed that both images reveal different information about the sample. For instance, looking at the absorption image (Figure 2B), we can remark that this pollen only weakly absorbs light, except for some structures of its double‐wall envelope, 38 a behaviour already observed for Betula pollen grain. 23
FIGURE 2.
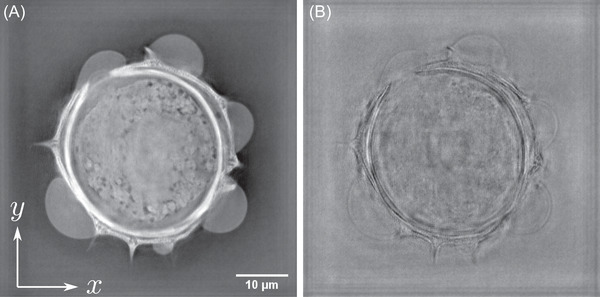
Reconstruction of a Helianthus tuberosus pollen grain acquired with our TDM configuration. (A) Refraction contribution. (B) Absorption contribution
So, to reconstruct 3D index of refraction images, TDM requires precise measurement of the diffracted field. This represents the entirety of the physical information carried out by the light‐sample interaction, contrary to conventional transmission microscopes, which record intensity‐only images. This property can be beneficially used if one is interested in obtaining an image of the sample under another imaging modality. Knowing the image formation model of a specific microscope, it is indeed possible to simulate the behaviour of classical intensity (bright‐field, dark‐field, Rheinberg, ...) and phase‐contrast (Zernike, DIC, …) microscopes, as shown in the next sections.
3. FROM TDM TO OPTICAL MICROSCOPY
As recalled in Section 2, a TDM acquisition consists in the sequential capture of holograms acquired with different illumination angles. But instead of performing a classical tomographic reconstruction, one can also directly use the optical fields extracted for each hologram, using either Born or Rytov approximations. 39 Combination and proper filtering of the holograms will then allow for mimicking different microscopic imaging modalities. We split these methods in two main families: intensity techniques relying on the combination of intensity‐only images, and phase‐dependent modalities, for which a phase modulation, possibly combined with an amplitude modulation, is introduced. One can also differentiate 2D approaches, recombining information at focal plane of acquisition, from true 3D reconstructions, which make use of the angular spectrum approach described in Figure 1. A collection of the accesible 2D microscopy techniques is proposed Figure 3, and will be used for further discussions in the next section.
FIGURE 3.
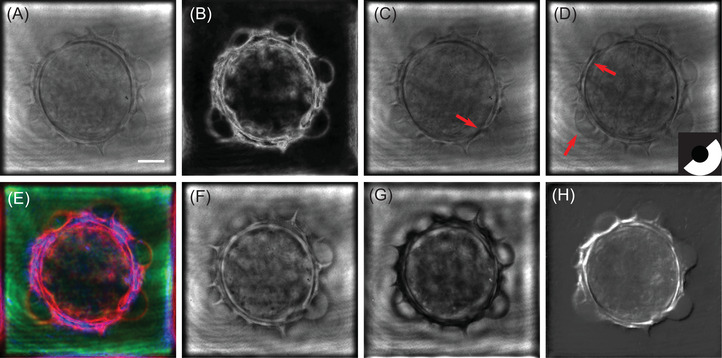
Simulated multimodal 2D images of a Helianthus tuberosus pollen grain. (A) Bright‐field microscopy, (B) Dark‐field microscopy, (C,D) Oblique illumination microscopy with an oblique filter at 144° (C) and 312°, (E) Rheinberg illumination microscope, (F) positive phase‐contrast microscope, (G) negative phase‐contrast microscope, (H) DIC microscope. Scale bar is 10
3.1. Intensity‐only imaging
3.1.1. Bright‐field imaging
Bright‐field imaging corresponds to optimal use of the condenser to simultaneously illuminate the sample under many directions, using incoherent light (Köhler illumination): in bright‐field imaging, intensity information for each illumination angle is simply multiplexed. So, from an information point of view, bright‐field microscopy can be considered as a parallel information processing system, while TDM is a sequential one. The synoptic of the bright‐field microscope emulation is therefore straightforward, as proposed in Figure 4. Starting from the wavefront extracted from each angular hologram, an intensity image is calculated. All the intensity images are simply added to obtain the final bright‐field image. Applying this scheme makes it possible to obtain the image in Figure 3A. As it has been noticed from Figure 2, this pollen grain is weakly absorbing. This point is also noticeable on the reconstructed bright‐field image which presents a small contrast, except in the pollen wall structures.
FIGURE 4.
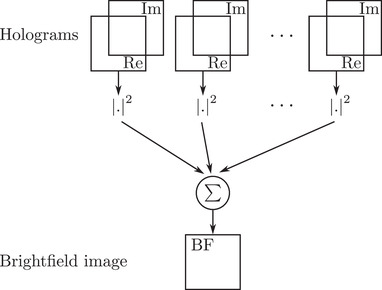
Synoptic of bright‐field imaging from TDM acquisition
For such weakly scattering samples, other imaging modalities, such as dark‐field, oblique, Rheinberg microscopy have been developed, which can also easily be computed from TDM data, as developed in the next paragraphs.
3.1.2. Dark‐field imaging
In conventional dark‐field operation, the investigated sample is illuminated using an annular illumination, at a higher angle that than of the maximal collecting angle of the objective. Doing so ensures that only the light diffracted by the sample is captured, so that its image appears on a black background, therefore the name of the technique, and its high sensitivity. To simulate dark‐field microscopy, we therefore only keep the holograms distributed along an annulus associated to the maximal NA of the condenser, while limiting the NA of the collection through Fourier space pupil filtering. Taking the intensity of each filtered hologram and summing the results allows to obtain the dark‐field image proposed in Figure 3B, which has been simulated according to the scheme proposed Figure 5.
FIGURE 5.
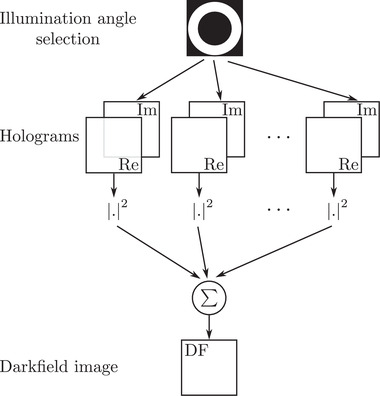
Synoptic of dark‐field imaging from TDM acquisition
Compared to the result obtained in Figure 3B, structural details about the pollen's membrane can be clearly noticed. This is an intrinsic property of dark‐field microscopy that allows to enhance high spatial frequency content in the images.
Note here the peculiar advantage of this purely numerical approach, which is that one can perform same NA, or even higher NA, at detection than at illumination by filtering out the specular illumination information in the Fourier space, while a physical dark‐field microscope set‐up imposes a lower NA at detection than at illumination. Other high‐pass filtering can also be considered to extract smaller details about cellular samples. 40 However, we here limited our discussion to the most commonly available techniques.
3.1.3. Oblique illumination microscope
Methods based on the directional selection of the illumination angle make it possible to enhance contrast along a specific direction. This is, for instance, the case of oblique illumination microscopy, 41 for which part of the illumination is blocked, as in dark‐field microscopy, but here not only high‐angle illuminations are allowed, and detection can also be performed at high NA. To mimic this behaviour, the synoptic of Figure 6 can be considered. Here, only half of the condenser pupil is selected from the acquired holograms. The remaining holograms are then processed according to the classical bright‐field scheme, that is, the reconstructed optical field's intensities are summed for each processed hologram.
FIGURE 6.
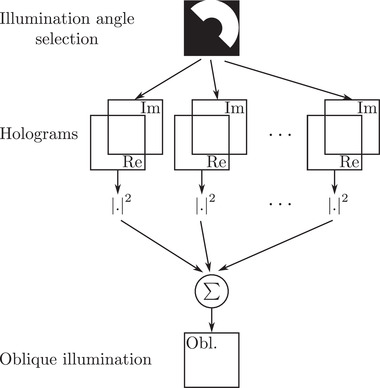
Synoptic of oblique illumination microscope from TDM acquisition
Comparing Figure 3C,D with the bright‐field result (see Figure 3A), it can be noticed that the contrast is improved for the features whose direction is perpendicular to the illumination filter. This point is specifically pointed out when considering two different orientations of the oblique filter. Results proposed in Figure 3C for an oblique filter rotation of 144°, and 3D with an oblique filter rotated at an angle of 312°. Different features, pointed out by red arrows in Figure 3C,D can be extracted from the two oblique filter position images. Full rotation of the oblique filter is proposed in Media ObliqueStack.avi.
3.1.4. Rheinberg contrast imaging
In some cases, both low and high spatial frequency content is of interest, and in such cases, other methods, like Rheinberg contrast microscopy, also known as optical staining, can be of interest. 42 Rheinberg illumination is similar to dark‐field imaging, but (in its most classical form) instead of simply blocking by an opaque screen the central part of the cone of light emerging from the condenser, a coloured disk filter is used. For high angle incidence illumination rays, a different‐coloured annular filter is used (note that many different, more complex shapes of Rheinberg filters do exist). As a consequence, the observed specimen appears with the colour of the outer rays, on a background of the central filter colour, which greatly increases contrast.
Adapting the Rheinberg filter can improve the image contrast, but such modification is not really convenient/rapid on an actual microscope, and also the set of available Rheinberg filters is usually limited. On the contrary, one can easily imagine an equivalent of the coloured illumination filter in the numerical version of Rheinberg microscope, which could provide a much greater flexibility, as in Ref. 43.
A holographic implementation of Rheinberg microscope has been recently proposed, 44 and we will here focus on the hologram processing.
The simulation scheme for Rheinberg contrast microscopy is proposed in Figure 7. As in its classical implementation, the illumination is colour‐filtered according to its angle, that is, holograms are associated to a colour filter according to their angles of incidence. The spectrum of each hologram (equivalently the collection objective back‐focal plane) is then computed and filters are applied accordingly, in a similar way as what is done with dark‐field microscopy.
FIGURE 7.
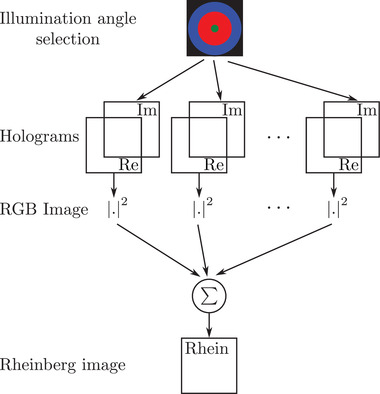
Synoptic of Rheinberg imaging from TDM acquisition
Here, we propose a triple‐colour Rheinberg filter. Three filters are applied to the holograms: the first one for the low illumination angles, in green in Figure 7), the second one in red for the mid‐illumination angles (in red in Figure 7), and the last one in blue for the highest illumination angles. Three images are computed accordingly, as in bright‐field microscopy. These three images are then fused to build an RGB‐composite intensity image, giving the Rheinberg contrast image proposed in Figure 3E. As expected, low spatial frequency content like the image background or slowly varying features appear in green, while high spatial frequency content associated with the pollen shell is red‐ and blue‐coloured.
Up to now, we described intensity‐based microscopic imaging techniques. However, techniques based on the phase information can also be considered, as presented in the next section.
3.2. Phase‐induced enhanced contrast
In the previous sections, we have drawn attention to intensity‐based microscopy techniques. But contrast can also be brought to images by acting on the phase of the light field. This can conveniently be performed from TDM images as we are able to measure both amplitude and phase of the optical field scattered by the investigated object. Classical techniques, like phase‐contrast imaging, and DIC microscopy can therefore also be emulated.
3.2.1. Zernike phase‐contrast microscopy
Phase‐contrast microscopy has been introduced by Zernike in 1935. 45 , 46 , 47 The main idea of the method is, qualitatively, the following: an annular illumination is used, and noticing that at microscopic scale, a ray traversing a cell experiences an about 1/4 wavelength delay, inducing a supplemental 1/4 wavelength phase‐shift between the illumination wave and the wave scattered by the object results in an enhancement of the image contrast, as both waves interfere destructively.
To mimic this behaviour using TDM data, the processing scheme presented in Figure 8 is considered. After proper selection of the illumination angle, a back‐focal plane filter , defined as
| (2) |
allows for shifting the phase of the specular illumination spot, while also slightly attenuating its amplitude. In Equation (2), α corresponds to the amount of attenuation of the specular beam (note that it also attenuates/shifts the corresponding portion of the diffracted rays).
| (3) |
with and the spectral coordinates of the specular illumination spot and ρpc the radius of the pupil filter. The introduced phase‐shift can be similarly defined by
| (4) |
Reconstruction of the pollen grain with phase‐contrast configuration is depicted in Figure 3 for both positive (F) and negative (G) phase contrasts. Here, and (see Equations 3 and 4) for positive and negative phase contrast, respectively. As expected, one can notice than the pollen images exhibit better contrasts than the bright‐field image reconstructed in Figure 4, which is explained by the attenuation coupled with the introduced phase‐shift, as in an actual phase‐contrast microscope.
FIGURE 8.
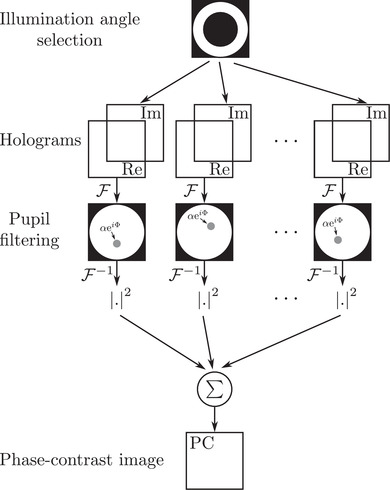
Synoptic of phase‐contrast imaging from TDM acquisition
3.2.2. DIC microscopy
DIC microscopy, proposed by Nomarski in 1955, is another classical technique for the characterization of weakly scattering samples. 48 , 49 Here, the investigated object is illuminated using two orthogonally polarized light fields (ordinary and extraordinary light fields emerging from a Nomarski prism). Parallel and slightly shifted orthogonally polarized rays passing through the observed samples are recombined, and then pass through an analyzer. This leads to two cases. If both rays experience the same dephasing, they are recombined by the Nomarski prism into a linearly polarized ray, blocked by the analyzer. If one or the other ray emerges in advance, an elliptically polarized beam emerges from the analyzer to form an image onto the detector. Properly adjusted, the imaged contrast corresponds to gradients in specimen optical path lengths, hence the name of Differential Interference Contrast.
Simulations of DIC images have been proposed under the framework of DHM acquisition. 50 , 51 Moreover, an implementation has recently been proposed for generalization to tomographic experiment. 52 As our reconstruction algorithms are based on the scalar implementation of the Born formalism, polarization of the incident light is not accounted for. This issue can easily be overcome considering that two orthogonally polarized beam are in phase quadrature. Thus, for each hologram corresponding to an illumination angle θ, we will estimate the DIC image I DIC considering
| (5) |
with ΦDIC and , denoting the introduced phase‐shift and the spatial shift between the two holograms, respectively.
The associated simulation scheme is proposed in Figure 9. For each hologram, a difference image is calculated according to Equation (5). Results are then summed in intensity for all illumination angles, leading to the final DIC image.
FIGURE 9.
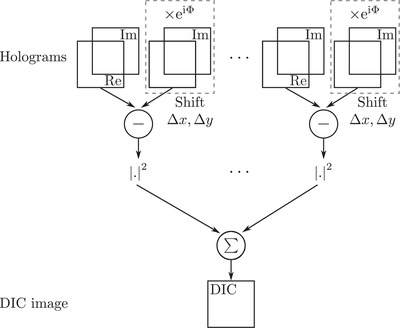
Synoptic of DIC microscopy from TDM acquisition
The obtained image is presented in Figure 3H. The gradient effect, which is a basic signature of DIC microscopy, is here clearly noticeable, and makes it possible to better point out the sample structure.
Classical microscopy set‐ups have been successfully simulated from TDM acquisitions. Depending on hologram combination and filtering, we were able to obtain multimodal 2D information about the investigated sample. But as far as we are working with holographic data, we can also mimic the focusing/defocusing occurring when moving the sample holder along the microscope optical axis, as described in the next section.
3.3. Numerical refocusing
Illustrations proposed up to now consisted in the simulation of 2D microscopic image modalities. In this situation, determining the best focalized image of a thick sample can be challenging. 53 So for our simulation framework to be complete, we can also consider taking into account the focus adjustment. This can be performed using classical angular spectrum propagation algorithms. 12 , 13 Other approaches can also be envisaged. 54 , 55 Considering the simulated intensity images for a given imaging modality, the intensity after propagation over a distance is given by
| (6) |
with and , respectively, denoting Fourier and inverse Fourier transforms. Here, is the angular spectrum propagation term expressed as
| (7) |
with n imm the refractive index of the immersion medium. Illustration of numerical refocusing is available in supplementary materials (Media Zfocus.avi).
4. EXTENSION TO 3D IMAGING
Reconstruction modalities presented so far were built by acting on the reconstruction of individual holograms, leading to 2D modalities (with possible refocusing), as often done in holographic imaging. However, TDM being intrinsically a true 3D imaging approach, applying our schemes to the 3D object frequency support will allow a direct extension to the most common microscopy imaging modalities, delivering 3D images.
4.1. Dark‐field and phase‐contrast 3D microscopy
The processing scheme for 3D generalization of both dark‐field and phase‐contrast microscopy from tomographic data is proposed in Figure 10. Here, as for 2D schemes, the acquired spectra are filtered in the low spatial frequency region. 56 In such case, the filter to apply is defined as
| (8) |
with
| (9) |
and
| (10) |
Here, are the 3D frequency coordinates of the object's spectrum and is the filtering sphere radius. Attenuation and filter phase‐shift are, respectively, given by and . If one wants to simulate dark‐field images, Equations (9) and (10) are simply modified so that:
| (11) |
and
| (12) |
Here appears one advantage of this numerical approach compared to an actual dark‐field or phase‐contrast microscope. In these systems, an annular illumination has to be used to increase contrast, but can be detrimental to image reconstruction quality, especially in terms of resolution, as the optical transfer function is not optimally filled in Fourier space, contrary to TDM, which can use, via synthetic aperture, the full NA of the condenser, 23 , 33 , 57 the necessary phase/amplitude correction factor being applied after acquisition of the data. Results obtained for both dark‐field and phase‐contrast microscopy are presented in Figure 11 for qualitative comparison (see Media 3D Modalities.avi for z‐slicing). Imaging properties of both modalities are here compared with an axial cut (A,B) and longitudinal cut (C,D) in the reconstructed volume.
FIGURE 10.
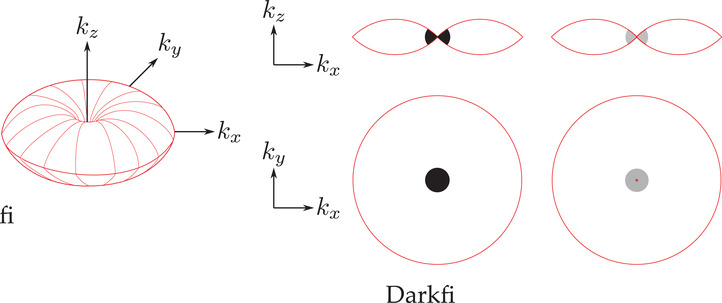
TDM data processing for 3D dark‐field and phase‐contrast imaging
FIGURE 11.
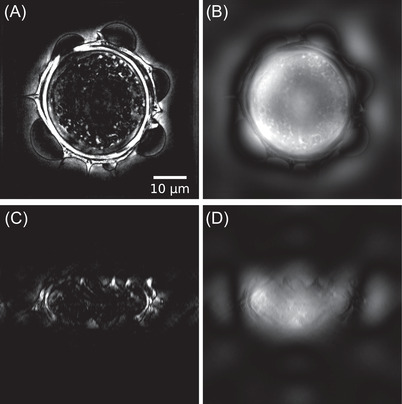
Slices of the 3D reconstruction considering (A) dark‐field and (B) phase‐contrast modalities, (C, D) associated ‐plane cuts
4.2. DIC microscopy
The 3D generalization of DIC microscopy is fairly straightforward. Remembering that the contrast in DIC is directly proportional to gradients in the optical specimen, instead of shifting and phase‐shifting the holograms to build a DIC image as in Section 3.2.2 (see Figure 9), one can now apply this approach directly to the 3D reconstructed tomographic images.
Obtained results are proposed in Figure 12A,C (see Media 3D Modalities.avi for z‐slicing). Here, a 3 pixel spatial shift along the x‐axis, corresponding to a 165‐nm physical shift (accounting for imaging system magnification) and a 0.01 rad phase‐shift is applied to the tomographic volume. As for the 2D case, the gradient effect can be clearly noticed. The advantage of this numerical approach is that bias and retardation can easily be tuned to highlight different features of interest. One could even apply gradient operation in out‐of‐plane directions (i.e. not only in the x‐y plane), something which is not feasible in an actual DIC microscope. An example is given in Section 5. Such a feature remains to be fully explored, as it adds a new parameter to DIC imaging, which is promising but may also complicate interpretation of the observed contrast.
FIGURE 12.
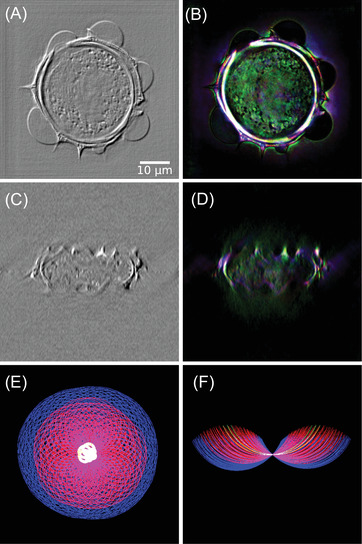
Slices of the 3D reconstruction considering (A) DIC and (B) Rheinberg illumination contrast modalities, (C, D) associated ‐plane cuts, (E) cut of the frequency support, (F) cut of the frequency support
4.3. Rheinberg illumination contrast
Rheinberg illumination contrast (see Figure 7) can also be generalized for 3D operation. To this aim, each acquired hologram is associated to a filter colour according to its corresponding illumination angle. For each colour channel, a separate TDM reconstruction is performed. Reconstructed intensities are finally merged to build a composite RGB reconstruction of the object as depicted in Figure 12B,D. Here, green channel is associated with small illumination angle holograms, red channel with ‘intermediate’ illumination angles and blue channel with the highest illumination angles. Size and position of these illumination filters can easily be tuned depending on the sample's feature one wants to highlight.
Note that mimicking the Rheinberg illumination gives a different‐coloured spectrum than simply assigning colours to low‐, intermediary‐ and high frequencies, as could also be done in Fourier filtering. The peculiarities of 2D/3D image formation in transmission microscopy/TDM 33 , 57 make that, for example, high illumination angles, here assigned blue colour, also contribute to the low‐frequency spectrum of the observed object, as can be seen in Figure 12E,F (see Media 3D Modalities.avi for z‐slicing).
5. DISCUSSION
This study is mainly driven by the fact that tomographic microscopes become more and more common, with commercial TDM devices being even now available. 58 , 59 While this image contrast presents several advantages, it can in some cases remain difficult to interpret, due to the lack of selectivity of the reconstructed data. For this reason, manufacturers are now proposing coupled fluorescence/TDM devices. Another possible way to add selectivity in data reconstruction is to reexplore conventional imaging contrasts, in order to provide experimentalists, with images they are more familiar with and used to interpret. This is made possible by the QPI nature of a TDM configuration. In other words, this article is a tutorial on how to obtain different imaging contrasts, from TDM data (holograms), when available. Considering this, some remarks can be formulated considering the obtained results.
When using a DHM configuration with coherent illumination of the sample, coupled with simple/rapid Fourier inversions, noise can be noticed in reconstructed images in Figure 3. This noise structure is coming from a constructive interference phenomenon occurring at the sensor's protection window plane. This effect can be limited if one consider a short coherence light source, or using an image sensor without protection windows. The immediate consequence is that the simulated results are of a lower overall quality than that possibly obtained using a dedicated phase contrast, DIC… configuration. However, all the simulated results share the same field of view, which is not that trivial for multimodal imaging if one has to use multiple microscopes, as such modalities can exclude each other: a physical dark‐field microscope, for example, cannot use the same high NA objectives than a DIC .
As 3D microscopy techniques are concerned (see Figures 2, 11, 12 and 14), reconstructions can also be prone to Gibbs artefact at the border of the obtained field of view. These are coming from the Fourier space processing of acquired data. Moreover, looking at the associated supplementary media files, a strong noise structure can be noticed in the central imaging plane. This plane corresponds to the coherent summation of the reference beam for all the acquired holograms. It can be reduced considering either a blank acquisition (i.e. a sample less acquisition) or using a sensor without protection window. It should be noted that as 3D techniques are concerned, there is, to the best of our knowledge no commercial equivalent to our simulation protocol.
FIGURE 14.
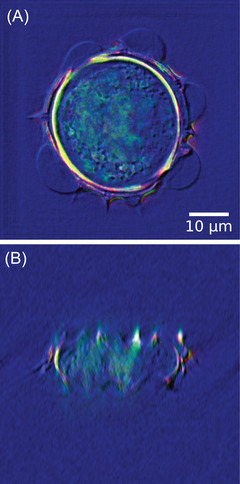
Simulated composite image combining Rheinberg contrast on the ‘R’ and ‘G’ channels, and DIC microscope on the ‘B’ channel. (A) ‐plane cut, (B) ‐plane cut
This work therefore does not aim at replacing routine microscopes. Instead, we propose a simple way to possibly add visualization modalities to existing TDM systems. As a matter of fact, superposing conventional imaging results to TDM results can bring back some of the contrast selectivity, which is lost when considering a marker‐less technique.
6. CONCLUSION AND OUTLOOKS
The sequential nature of data acquisition in TDM can be a drawback in terms of speed, but, contrary to classic optical transmission microscopes, allows for proper identification of the contribution of each illuminating ray, in both amplitude and phase. This makes it possible, considering adequate data processing, to emulate conventional 2D intensity and phase‐contrast microscopes, even taking into account possible defocus, similar to what occurs on a bench‐top microscope. We have therefore studied reconstructing conventional microscopy imaging modalities from TDM acquisitions. Furthermore, considering the 3D reconstruction possibilities of TDM, we extended this work to full 3D imaging.
Note that other imaging modalities could also be similarly emulated. For example, Hoffman modulation contrast 60 is based on an amplitude spatial filter, inserted at the back‐focal plane of the objective, therefore performing Fourier filtering, combined with a (usually offset) slit illumination, also equivalent to properly selecting illumination angles in TDM.
This study also paves the way for imaging new microscopy modalities that are not easily feasible in practice, for example, out‐of‐focal‐plane DIC, as suggested in previous section, and as illustrated in Figure 13. Here, effect of both lateral and axial shearing in either or cuts is illustrated. If lateral shearing is routinely performed with a DIC microscope, axis shearing cannot be performed. It, however seems to improve axial detection of our 3D digital DIC microscope. Similarly, confocal transmission microscopy should be feasible, as already done in reflection TDM. 61 One of the difficulty of transmission confocal microscopy is to keep confocalized both illumination and detection, which are performed through two different optical trains, while reflection‐ and fluorescence confocal microscopy are autoconfocal. A numerical approach could help leverage this difficulty, even if transmission confocal does not provide same optical sectioning as fluorescence confocal microscopy. Imaging modalities based on Fourier filtering using phase plates or Spatial Light Modulators could also be simulated. 62 , 63 , 64 Residual aberrations correction has already been numerically implemented. 65 , 66 , 67 Finally, some microscopy modalities combination not implementable in practice, can easily be computed, for example, the combined Rheinberg–DIC microscopy, as illustrated in Figure 14, in which Rheinberg illumination is simulated in green () and red () and DIC is computed for . Axial (A) and longitudinal (B) cuts are proposed. Three‐dimensional rendering is available in Media RheinbergDIC.avi.
FIGURE 13.
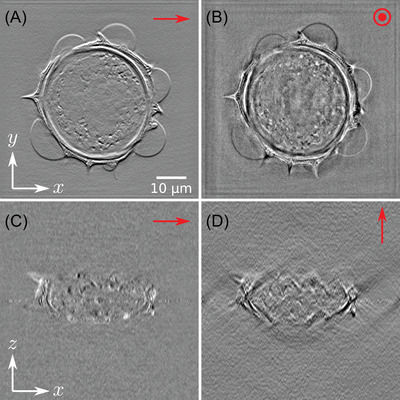
Influence of the shearing direction on the simulated 3D DIC results. (A) cut, (C) cut with a lateral shearing along x‐direction. (B) cut, (D) cut with an axial shearing along z‐direction. Shearing direction is figured out by the arrows in red
In the given simulated modalities, pre‐determined intensity filters have been proposed to reconstruct dark‐field, Rheinberg or oblique illumination imaging. Similarly, fixed phase changes (phase contrast) or bias and retardation (DIC) have been used. A promising approach could be to introduce dynamic variations of the Fourier filtering, in both amplitude and phase, which, coupled to an adapted image contrast optimization criteria, could lead to a dynamic, purely‐numerical contrast optimization, as performed in intensity‐only imaging in Refs. 43, 68, in order to efficiently highlight the structures of interest to be investigated.
A scalar‐approach TDM microscope delivers all the optical information, in terms of amplitude and phase, resulting from the sample under investigation with controlled illumination, and has already clearly demonstrated improved resolution compared to conventional transmission microscopy. 16 , 21 , 32 Note that extension towards polarized TDM has already been proposed, 17 , 69 , 70 , 71 as well as multispectral or hyperspectral tomography. 72 , 73 , 74
So, at least in theory, a combined polarized, hyperspectral TDM system could, with proper data processing, emulate all kind of existing optical transmission microscopes, even the classical polarization microscope, which works in white light. Such an approach would be tremendously challenging in terms of instrumentation (speed of acquisition 75 , 76 , 77 and data processing 78 , 79 , 80 ), but could pave the way towards a kind of all‐in‐one, universal system for optical transmission microscopy.
CONFLICT OF INTEREST
The authors declare that there is no conflict of interest that could be perceived as prejudicing the impartiality of the research reported.
Supporting information
Data S1
Data S2
Data S3
Data S4
Data S5
Abbessi, R. , Verrier, N. , Taddese, A. M. , Laroche, S. , Debailleul, M. , Lo, M. , Courbot, J.‐B. , & Haeberlé, O. (2022). Multimodal image reconstruction from tomographic diffraction microscopy data. Journal of Microscopy, 288, 193–206. 10.1111/jmi.13131
Funding informationAgence Nationale de la Recherche (ANR), Contracts ANR‐18‐CE45‐0010 and ANR‐19‐CE42‐0004; Région Grand Est, Contracts FRCR 18P‐07855 and FRCR 19P‐10656
REFERENCES
- 1. Hell, S. W. , & Wichmann, J. (1994). Breaking the diffraction resolution limit by stimulated emission: Stimulated‐emission‐depletion fluorescence microscopy. Optics Letters, 19(11), 780–782. [DOI] [PubMed] [Google Scholar]
- 2. Betzig, E. , Patterson, G. H. , Sougrat, R. , Lindwasser, O. W. , Olenych, S. , Bonifacino, J. S. , Davidson, M. W. , Lippincott‐Schwartz, J. , & Hess, H. F. (2006). Imaging intracellular fluorescent proteins at nanometer resolution. Science, 313(5793), 1642–1645. [DOI] [PubMed] [Google Scholar]
- 3. Rust, M. J. , Bates, M. , & Zhuang, X. (2006). Sub‐diffraction‐limit imaging by stochastic optical reconstruction microscopy (storm). Nature Methods, 3(10), 793–796. [DOI] [PMC free article] [PubMed] [Google Scholar]
- 4. Balzarotti, F. , Eilers, Y. , Gwosch, K. C. , Gynnå, A. H. , Westphal, V. , Stefani, F. D. , Elf, J. , & Hell, S. W. (2017). Nanometer resolution imaging and tracking of fluorescent molecules with minimal photon fluxes. Science, 355(6325), 606–612. [DOI] [PubMed] [Google Scholar]
- 5. Icha, J. , Weber, M. , Waters, J. C. , & Norden, C. (2017). Phototoxicity in live fluorescence microscopy, and how to avoid it. BioEssays, 39(8), 1700003. [DOI] [PubMed] [Google Scholar]
- 6. Kumari, A. , Kesarwani, S. , Javoor, M. G. , Vinothkumar, K. R. , & Sirajuddin, M. (2020). Structural insights into actin filament recognition by commonly used cellular actin markers. EMBO Journal, 39(14), e104006. [DOI] [PMC free article] [PubMed] [Google Scholar]
- 7. Pospich, S. , Merino, F. , & Raunser, S. (2020). Structural effects and functional implications of phalloidin and jasplakinolide binding to actin filaments. Structure, 28(4), 437–449. [DOI] [PubMed] [Google Scholar]
- 8. Park, Y. , Depeursinge, C. , & Popescu, G. (2018). Quantitative phase imaging in biomedicine. Nature Photonics, 12(10), 578–589. [Google Scholar]
- 9. Lee, K. , & Park, Y. (2014). Quantitative phase imaging unit. Optics Letters, 39(12), 3630–3633. [DOI] [PubMed] [Google Scholar]
- 10. Ou, X. , Horstmeyer, R. , Yang, C. , & Zheng, G. (2013). Quantitative phase imaging via Fourier ptychographic microscopy. Optics Letters, 38(22), 4845–4848. [DOI] [PMC free article] [PubMed] [Google Scholar]
- 11. Bokemeyer, A. , Tepasse, P. R. , Quill, L. , Lenz, P. , Rijcken, E. , Vieth, M. , Ding, N. , Ketelhut, S. , Rieder, F. , Kemper, B. , & Bettenworth, D. (2019). Quantitative phase imaging using digital holographic microscopy reliably assesses morphology and reflects elastic properties of fibrotic intestinal tissue. Scientific Reports, 9(1), 1–11. [DOI] [PMC free article] [PubMed] [Google Scholar]
- 12. Schnars, U. , & Jüptner, W. (1994). Direct recording of holograms by a ccd target and numerical reconstruction. Applied Optics, 33(2), 179–181. [DOI] [PubMed] [Google Scholar]
- 13. Verrier, N. , & Atlan, M. (2011). Off‐axis digital hologram reconstruction: Some practical considerations. Applied Optics, 50(34), H136–H146. [DOI] [PubMed] [Google Scholar]
- 14. Verrier, N. , Donnarumma, D. , Tessier, G. , & Gross, M. (2015). High numerical aperture holographic microscopy reconstruction with extended z range. Applied Optics, 54(32), 9540–9547. [DOI] [PubMed] [Google Scholar]
- 15. Debailleul, M. , Simon, B. , Georges, V. , Haeberlé, O. , & Lauer, V. (2008). Holographic microscopy and diffractive microtomography of transparent samples. Measurement Science and Technology, 19(7), 074009. [Google Scholar]
- 16. Debailleul, M. , Georges, V. , Simon, B. , Morin, R. , & Haeberlé, O. (2009). High‐resolution three‐dimensional tomographic diffractive microscopy of transparent inorganic and biological samples. Optics Letters, 34(1), 79–81. [DOI] [PubMed] [Google Scholar]
- 17. Lauer, V. (2002). New approach to optical diffraction tomography yielding a vector equation of diffraction tomography and a novel tomographic microscope. Journal of Microscopy, 205(2), 165–176. [DOI] [PubMed] [Google Scholar]
- 18. Kim, K. , Kim, K. S. , Park, H. , Ye, J. C. , & Park, Y. (2013a). Real‐time visualization of 3‐D dynamic microscopic objects using optical diffraction tomography. Optics Express, 21(26), 32269–32278. [DOI] [PubMed] [Google Scholar]
- 19. Kostencka, J. , Kozacki, T. , Kuś, A. , Kemper, B. , & Kujawińska, M. (2016). Holographic tomography with scanning of illumination: Space‐domain reconstruction for spatially invariant accuracy. Biomedical Optics Express, 7(10), 4086–4101. [DOI] [PMC free article] [PubMed] [Google Scholar]
- 20. Kozacki, T. , Krajewski, R. , & Kujawińska, M. (2009). Reconstruction of refractive‐index distribution in off‐axis digital holography optical diffraction tomographic system. Optics Express, 17(16), 13758–13767. [DOI] [PubMed] [Google Scholar]
- 21. Simon, B. , Debailleul, M. , Beghin, A. , Tourneur, Y. , & Haeberlé, O. (2010). High‐resolution tomographic diffractive microscopy of biological samples. Journal of Biophotonics, 3(7), 462–467. [DOI] [PubMed] [Google Scholar]
- 22. Vertu, S. , Flügge, J. , Delaunay, J. J. , & Haeberlé, O. (2011). Improved and isotropic resolution in tomographic diffractive microscopy combining sample and illumination rotation. Central European Journal of Physics, 9(4), 969–974. [Google Scholar]
- 23. Simon, B. , Debailleul, M. , Houkal, M. , Ecoffet, C. , Bailleul, J. , Lambert, J. , Spangenberg, A. , Liu, H. , Soppera, O. , & Haeberlé, O. (2017). Tomographic diffractive microscopy with isotropic resolution. Optica, 4(4), 460–463. [Google Scholar]
- 24. Vinoth, B. , Lai, X. J. , Lin, Y. C. , Tu, H. Y. , & Cheng, C. J. (2018). Integrated dual‐tomography for refractive index analysis of free‐floating single living cell with isotropic superresolution. Scientific Reports, 8(1), 1–7. [DOI] [PMC free article] [PubMed] [Google Scholar]
- 25. Lee, M. , Kim, K. , Oh, J. , & Park, Y. (2021). Isotropically resolved label‐free tomographic imaging based on tomographic moulds for optical trapping. Light: Science & Applications, 10(1), 1–9. [DOI] [PMC free article] [PubMed] [Google Scholar]
- 26. Wolf, E. (1969). Three‐dimensional structure determination of semi‐transparent objects from holographic data. Optics Communications, 1(4), 153–156. [Google Scholar]
- 27. Devaney, A. J. (1981). Inverse‐scattering theory within the Rytov approximation. Optics Letters, 6(8), 374–376. [DOI] [PubMed] [Google Scholar]
- 28. Kamilov, U. S. , Papadopoulos, I. N. , Shoreh, M. H. , Goy, A. , Vonesch, C. , Unser, M. , & Psaltis, D. (2016). Optical tomographic image reconstruction based on beam propagation and sparse regularization. IEEE Transactions on Computational Imaging, 2(1), 59–70. [Google Scholar]
- 29. Cotte, Y. , Toy, F. , Jourdain, P. , Pavillon, N. , Boss, D. , Magistretti, P. , Marquet, P. , & Depeursinge, C. (2013). Marker‐free phase nanoscopy. Nature Photonics, 7(2), 113–117. [Google Scholar]
- 30. Cuche, E. , Marquet, P. , & Depeursinge, C. (2000). Spatial filtering for zero‐order and twin‐image elimination in digital off‐axis holography. Applied Optics, 39(23), 4070–4075. [DOI] [PubMed] [Google Scholar]
- 31. Yamaguchi, I. , & Zhang, T. (1997). Phase‐shifting digital holography. Optics Letters, 22(16), 1268–1270. [DOI] [PubMed] [Google Scholar]
- 32. Atlan, M. , Gross, M. , & Absil, E. (2007). Accurate phase‐shifting digital interferometry. Optics Letters, 32(11), 1456–1458. [DOI] [PubMed] [Google Scholar]
- 33. Haeberlé, O. , Belkebir, K. , Giovaninni, H. , & Sentenac, A. (2010). Tomographic diffractive microscopy: Basics, techniques and perspectives. Journal of Modern Optics, 57(9), 686–699. [Google Scholar]
- 34. Born, M. , & Wolf, E. (1999). Principles of optics: Electromagnetic theory of propagation, interference and diffraction of light (7th ed.). Cambridge University Press. [Google Scholar]
- 35. McCutchen, C. W. (1964). Generalized aperture and the three‐dimensional diffraction image. Journal of the Optical Society of America, 54(2), 240–244. [DOI] [PubMed] [Google Scholar]
- 36. Taddese, A. M. , Verrier, N. , Debailleul, M. , Courbot, J. B. , & Haeberlé, O. (2021). Optimizing sample illumination scanning in transmission tomographic diffractive microscopy. Applied Optics, 60(6), 1694–1704. [DOI] [PubMed] [Google Scholar]
- 37. Taddese, A. M. , Verrier, N. , Debailleul, M. , Courbot, J. B. , & Haeberlé, O. (2021). Optimizing sample illumination scanning for reflection and 4Pi tomographic diffractive microscopy. Applied Optics, 60(25), 7745–7753. [DOI] [PubMed] [Google Scholar]
- 38. Halbritter, H. , Ulrich, S. , Grímsson, F. , Weber, M. , Zetter, R. , Hesse, M. , Buchner, R. , Svojtka, M. , & Frosch‐Radivo, A. (2018). Pollen morphology and ultrastructure. In: Illustrated pollen terminology (pp. 37–65). Springer International Publishing. [Google Scholar]
- 39. Devaney, A. J. (2012). Mathematical foundations of imaging, tomography and wavefield inversion. Cambridge University Press. [Google Scholar]
- 40. Bon, P. , Lécart, S. , Fort, E. , & Lévêque‐Fort, S. (2014). Fast label‐free cytoskeletal network imaging in living mammalian cells. Biophysical Journal, 106(8), 1588–1595. [DOI] [PMC free article] [PubMed] [Google Scholar]
- 41. Sanchez, C. , Cristóbal, G. , Bueno, G. , Blanco, S. , Borrego‐Ramos, M. , Olenici, A. , Pedraza, A. , & Ruiz‐Santaquiteria, J. (2018). Oblique illumination in microscopy: A quantitative evaluation. Micron, 105, 47–54. [DOI] [PubMed] [Google Scholar]
- 42. Nelson, E. M. (1896). Transactions of the society: On an addition to the methods of microscopical research, by a new way of optically producing colour‐contrast between an object and its background, or between definite parts of the object itself. Journal of the Royal Microscopical Society, 16(4), 373–388. [Google Scholar]
- 43. Samson, E. C. , & Blanca, C. M. (2007). Dynamic contrast enhancement in widefield microscopy using projector‐generated illumination patterns. New Journal of Physics, 9(10), 363. [Google Scholar]
- 44. Fan, X. , Healy, J. J. , O'Dwyer, K. , & Hennelly, B. M. (2019). Label‐free color staining of quantitative phase images of biological cells by simulated Rheinberg illumination. Applied Optics, 58(12), 3104–3114. [DOI] [PubMed] [Google Scholar]
- 45. Zernike, F. (1934). Beugungstheorie des schneidenver‐fahrens und seiner verbesserten form, der phasenkontrastmethode. Physica, 1(7), 689–704. [Google Scholar]
- 46. Zernike, F. (1942a). Phase contrast, a new method for the microscopic observation of transparent objects. Physica, 9(7), 686–698. [Google Scholar]
- 47. Zernike, F. (1942b). Phase contrast, a new method for the microscopic observation of transparent objects Part II. Physica, 9(10), 974–986. [Google Scholar]
- 48. Nomarski, G. (1955). Microinterféromètre différentiel à ondes polarisées. Journal de Physique et Le Radium, 16, 9S–13S. [Google Scholar]
- 49. Pluta, M. (1994). Nomarski's DIC microscopy: A review. In Phase Contrast and Differential Interference Contrast Imaging Techniques and Applications (Vol. 1846, pp. 10–25). [Google Scholar]
- 50. Kemper, B. , Langehanenberg, P. , Kosmeier, S. , Przibilla, S. , Vollmer, A. , Ketelhut, S. , & von Bally, G. (2009). 3D tracking and multi‐wavelength techniques for digital holographic microscopy based cell analysis. In Advanced Microscopy Techniques paper 7367_14. Optica Publishing Group. [Google Scholar]
- 51. Miccio, L. , Finizio, A. , Puglisi, R. , Balduzzi, D. , Galli, A. , & Ferraro, P. (2011). Dynamic DIC by digital holography microscopy for enhancing phase‐contrast visualization. Biomedical Optics Express, 2(2), 331–344. [DOI] [PMC free article] [PubMed] [Google Scholar]
- 52. Vishnyakov, G. , Levin, G. , Minaev, V. , Latushko, M. , Nekrasov, N. , & Pickalov, V. (2016). Differential interference contrast tomography. Optics Letters, 41(13), 3037–3040. [DOI] [PubMed] [Google Scholar]
- 53. Baczewska, M. , Eder, K. , Ketelhut, S. , Kemper, B. , & Kujawinska, M. (2021). Refractive index changes of cells and cellular compartments upon paraformaldehyde fixation acquired by tomographic phase microscopy. Cytometry Part A, 99(4), 388–398. [DOI] [PMC free article] [PubMed] [Google Scholar]
- 54. Kemper, B. , Carl, D. D. , Schnekenburger, J. , Bredebusch, I. , Schäfer, M. , Domschke, W. , & von Bally, G. (2006). Investigation of living pancreas tumor cells by digital holographic microscopy. Journal of Biomedical Optics, 11(3), 1–8. [DOI] [PubMed] [Google Scholar]
- 55. Kim, M. K. , Yu, L. , & Mann, C. J. (2006). Interference techniques in digital holography. Journal of Optics A: Pure and Applied Optics, 8(7), S518–S523. [Google Scholar]
- 56. Chang, T. , Shin, S. , Lee, M. , & Park, Y. (2020). Computational approach to dark‐field optical diffraction tomography. APL Photonics, 5(4), 040804. [Google Scholar]
- 57. Streibl, N. (1985). Three‐dimensional imaging by a microscope. JOSA A, 2(2), 121–127. [Google Scholar]
- 58. Nanolive webpage . https://www.nanolive.ch/
- 59. Tomocube webpage . https://www.tomocube.com/
- 60. Hoffman, R. , & Gross, L. (1975). Modulation contrast microscope. Applied Optics, 14(5), 1169–1176. [DOI] [PubMed] [Google Scholar]
- 61. Rasedujjaman, M. , Affannoukoué, K. , Garcia‐Seyda, N. , Robert, P. , Giovannini, H. , Chaumet, P. C. , Theodoly, O. , Valignat, M. P. , Belkebir, K. , Sentenac, A. , & Maire, G. (2020). Three‐dimensional imaging with reflection synthetic confocal microscopy. Optics Letters, 45(13), 3721–3724. [DOI] [PubMed] [Google Scholar]
- 62. Fürhapter, S. , Jesacher, A. , Bernet, S. , & Ritsch‐Marte, M. (2005). Spiral phase contrast imaging in microscopy. Optics Express, 13(3), 689–694. [DOI] [PubMed] [Google Scholar]
- 63. Ikeda, T. , Popescu, G. , Dasari, R. R. , & Feld, M. S. (2005). Hilbert phase microscopy for investigating fast dynamics in transparent systems. Optics Letters, 30(10), 1165–1167. [DOI] [PubMed] [Google Scholar]
- 64. Maurer, C. , Jesacher, A. , Bernet, S. , & Ritsch‐Marte, M. (2011). What spatial light modulators can do for optical microscopy. Laser & Photonics Reviews, 5(1), 81–101. [Google Scholar]
- 65. Colomb, T. , Cuche, E. , Charrière, F. , Kühn, J. , Aspert, N. , Montfort, F. , Marquet, P. , & Depeursinge, C. (2006). Automatic procedure for aberration compensation in digital holographic microscopy and applications to specimen shape compensation. Applied Optics, 45(5), 851–863. [DOI] [PubMed] [Google Scholar]
- 66. Liu, H. , Bailleul, J. , Simon, B. , Debailleul, M. , Colicchio, B. , & Haeberlé, O. (2014). Tomographic diffractive microscopy and multiview profilometry with flexible aberration correction. Applied Optics, 53(4), 748–755. [DOI] [PubMed] [Google Scholar]
- 67. Kujawińska, M. , Krauze, W. , Kus, A. , Kostencka, J. , Kozacki, T. , Kemper, B. , & Dudek, M. (2014). Problems and solutions in 3‐D analysis of phase biological objects by optical diffraction tomography. International Journal of Optomechatronics, 8(4), 357–372. [Google Scholar]
- 68. Bimber, O. , Klöck, D. , Amano, T. , Grundhöfer, A. , & Kurz, D. (2010). Closed‐loop feedback illumination for optical inverse tone‐mapping in light microscopy. IEEE Transactions on Visualization and Computer Graphics, 17(6), 857–870. [DOI] [PubMed] [Google Scholar]
- 69. van Rooij, J. , & Kalkman, J. (2020). Polarization contrast optical diffraction tomography. Biomedical Optics Express, 11(4), 2109–2121. [DOI] [PMC free article] [PubMed] [Google Scholar]
- 70. Saba, A. , Lim, J. , Ayoub, A. B. , Antoine, E. E. , & Psaltis, D. (2021). Polarization‐sensitive optical diffraction tomography. Optica, 8(3), 402–408. [Google Scholar]
- 71. Shin, S. , Eun, J. , Lee, S. S. , Lee, C. , Hugonnet, H. , Yoon, D. K. , Kim, S. H. , Jeong, J. , & Park, Y. (2022). Tomographic measurement of dielectric tensors at optical frequency. Nature Materials, 21(3), 317–324. [DOI] [PubMed] [Google Scholar]
- 72. Jung, J. , Kim, K. , Yoon, J. , & Park, Y. (2016). Hyperspectral optical diffraction tomography. Optics Express, 24(3), 2006–2012. [DOI] [PubMed] [Google Scholar]
- 73. Sung, Y. (2018). Spectroscopic microtomography in the visible wavelength range. Physical Review Applied, 10(5), 054041. [Google Scholar]
- 74. Zdańkowski, P. , Winnik, J. , Patorski, K. , Gocłowski, P. , Ziemczonok, M. , Józwik, M. , Kujawińska, M. , & Trusiak, M. (2021). Common‐path intrinsically achromatic optical diffraction tomography. Biomedical Optics Express, 12(7), 4219–4234. [DOI] [PMC free article] [PubMed] [Google Scholar]
- 75. Kim, M. , Choi, Y. , Fang‐Yen, C. , Sung, Y. , Dasari, R. R. , Feld, M. S. , & Choi, W. (2011). High‐speed synthetic aperture microscopy for live cell imaging. Optics Letters, 36(2), 148–150. [DOI] [PMC free article] [PubMed] [Google Scholar]
- 76. Jin, D. , Zhou, R. , Yaqoob, Z. , & So, P. T. (2018). Dynamic spatial filtering using a digital micromirror device for high‐speed optical diffraction tomography. Optics Express, 26(1), 428–437. [DOI] [PMC free article] [PubMed] [Google Scholar]
- 77. Sung, Y. (2019). Snapshot holographic optical tomography. Physical Review Applied, 11(1), 014039. [DOI] [PMC free article] [PubMed] [Google Scholar]
- 78. Kim, K. , Kim, K. S. , Park, H. , Ye, J. C. , & Park, Y. (2013b). Real‐time visualization of 3‐D dynamic microscopic objects using optical diffraction tomography. Optics Express, 21(26), 32269–32278. [DOI] [PubMed] [Google Scholar]
- 79. Dardikman, G. , Habaza, M. , Waller, L. , & Shaked, N. T. (2016). Video‐rate processing in tomographic phase microscopy of biological cells using CUDA. Optics Express, 24(11), 11839–11854. [DOI] [PubMed] [Google Scholar]
- 80. Bailleul, J. , Simon, B. , Debailleul, M. , Foucault, L. , Verrier, N. , & Haeberlé, O. (2018). Tomographic diffractive microscopy: Towards high‐resolution 3‐D real‐time data acquisition, image reconstruction and display of unlabeled samples. Optics Communications, 422, 28–37. [Google Scholar]
Associated Data
This section collects any data citations, data availability statements, or supplementary materials included in this article.
Supplementary Materials
Data S1
Data S2
Data S3
Data S4
Data S5


