

Abstract
Nocturnal hypoxemia that is common in chronic obstructive pulmonary disease (COPD) patients is associated with skeletal muscle loss or sarcopenia, which contributes to adverse clinical outcomes. In COPD, we have defined this as prolonged intermittent hypoxia (PIH) because the duration of hypoxia in skeletal muscle occurs through the duration of sleep followed by normoxia during the day in contrast to recurrent brief hypoxic episodes during obstructive sleep apnea (OSA). Adaptive cellular responses to PIH are not known. Responses to PIH induced by 3-cycles of 8h hypoxia followed by 16h normoxia were compared to those during chronic hypoxia (CH) or normoxia for 72h in murine C2C12 and human inducible pluripotent stem cell-derived differentiated myotubes. RNA sequencing followed by downstream analyses were complemented by experimental validation of responses that included both unique and shared perturbations in ribosomal and mitochondrial function during PIH and CH. A sarcopenic phenotype characterized by decreased myotube diameter and protein synthesis, and increased phosphorylation of eIF2α (Ser51) by eIF2α kinase, GCN-2 (general controlled non-derepressed-2), occurred during both PIH and CH. Mitochondrial oxidative dysfunction, disrupted supercomplex assembly, lower activity of Complexes I, III, IV and V, and reduced intermediary metabolite concentrations occurred during PIH and CH. Decreased mitochondrial fission occurred during CH. Physiological relevance was established in skeletal muscle of mice with COPD that had increased phosphorylation of eIF2α, lower protein synthesis, and mitochondrial oxidative dysfunction. Molecular and metabolic responses with PIH suggests an adaptive exhaustion with failure to restore homeostasis during normoxia.
Keywords: Prolonged intermittent hypoxia, unbiased data, RNA sequencing, mitochondrial oxidation, intermediary metabolites
Graphical Abstract

Prolonged intermittent hypoxia (PIH) is commonly demonstrated in patients with COPD (chronic obstructive pulmonary disease); however, the effects of PIH on skeletal muscle are unclear. We tested the hypothesis that PIH causes skeletal muscle loss or sarcopenia in vitro by down-regulating protein synthesis and causing mitochondrial oxidative dysfunction associated with dysregulation of hypoxia inducible factors (HIF1α and HIF2α). α-ketoglutarate (αKG), a critical TCA cycle intermediate and co-factor for the degradation of HIF1α, was reduced due to PIH. Physiological relevance was established in skeletal muscle of mice with COPD. Our findings suggest that PIH causes sarcopenia through adaptive exhaustion and failure to restore homeostasis during normoxia.
Introduction.
Regulation of mRNA translation and protein synthesis is a highly energy-dependent process utilizing ATP for physiological function. In aerobic organisms, oxygen is critical for ATP synthesis during mitochondrial oxidative phosphorylation with adaptive responses to hypoxia that increase oxygen delivery and decrease non-essential energy utilization in different tissues(Neubauer, 2001). The primary molecular sensors of cellular oxygen, hypoxia-inducible factors (primarily HIF1α and HIF2α), mediate the adaptive responses by inhibiting highly energy-dependent processes including mitochondrial oxidative phosphorylation(Thomas & Ashcroft, 2019). During hypoxia, cells limit oxygen consumption and shift from mitochondrial respiration to glycolysis to produce ATP and lower protein synthesis due to the high energy needs of mRNA translation(Kierans & Taylor, 2021). A major regulator of these cellular responses is HIF1α-mediated inhibition of oxidative phosphorylation and dysregulated protein homeostasis via impaired mTORC1 signaling(Wolff et al., 2011; Slot et al., 2014). Upon restoration of oxygen supply, cellular homeostasis is expected to be fully restored. However, a number of molecular and metabolic adaptations that occur in response to hypoxia may not be immediately or completely reversed following restoration of oxygen supply. In mammals, despite being the largest protein store, the skeletal muscle possesses remarkable plasticity with maintained cell viability at the cost of decreased protein synthesis in response to hypoxia(Clanton & Klawitter, 2001; Favier et al., 2015). The result of dysregulated protein homeostasis during hypoxia causes a phenotype of skeletal muscle loss or sarcopenia(Favier et al., 2015).
Cells adapt to hypoxia through a coordinated set of responses mediated by HIFs depending on the duration of hypoxia(Semenza, 2012). With prolonged sublethal hypoxia, HIF1α protein levels peak around 4–8h and subsequently decrease, while HIF2α stabilizes later during chronic hypoxia (CH) for 24–72h. HIF1α has both overlapping and distinct target genes compared to other factors(Keith et al., 2011; Saxena & Jolly, 2019) and initiates adaptive responses to acute hypoxia by downregulating genes associated with mRNA translation(Fähling, 2009) while HIF2α targets chronic adaptive responses such as angiogenesis and upregulation of the amino acid exchanger, SLC7A5(Hu et al., 2003; Onishi et al., 2019). Episodes of intermittent hypoxia may, therefore, exaggerate the early adaptive response by downregulating protein synthesis without stimulating the later adaptive responses, known as “HIF switch”(Bartoszewski et al., 2019). Repeated hypoxia followed by reoxygenation also induces mitochondrial free radical generation(Abramov et al., 2007) that overcomes the energy consuming antioxidant responses, especially during cyclical hypoxia as in clinical models of intermittent hypoxia including obstructive sleep apnea (OSA) and chronic obstructive pulmonary disease (COPD)(Okur et al., 2013). While the hypoxia/reoxygenation pattern during OSA is rapid and transient(Dewan et al., 2015), COPD patients experience persistent nocturnal hypoxia during sleep(Fletcher et al., 1987). Observational studies have demonstrated increased risk of mortality associated with nocturnal hypoxia in COPD(Fletcher et al., 1992a); however, small or under-powered randomized control trials failed to show a survival benefit to nocturnal oxygen supplementation(Fletcher et al., 1992b; Chaouat et al., 1999; Lacasse et al., 2020). Therefore, the consequences of nocturnal hypoxia in COPD have been largely ignored. Current guidelines do not recommend screening for or treating nocturnal hypoxia unless patients are symptomatic with fatigue and/or poor sleep quality, or have evidence of pulmonary hypertension(Lacasse et al., 2018). However, observational studies of COPD patients with nocturnal hypoxia have noted significant evidence of sarcopenia or loss of muscle mass demonstrated by reductions in exercise work rate(Chaouat et al., 1997), six minute walk test(Marin Trigo et al., 2017), skeletal muscle contraction of the diaphragm(Okura et al., 2017), and evidence of increased inflammation(Mueller Pde et al., 2008).
To recreate a clinically relevant model of COPD-related nocturnal hypoxia (unique from the transient desaturations of OSA), we developed a myotube model of prolonged intermittent hypoxia (PIH) with 3 cycles of 8 hours (h) hypoxia followed by 16h normoxia that mimics an in vitro sarcopenic phenotype to a similar degree as CH (72h hypoxia). We chose 72h for our studies because previous reports show that the molecular responses to chronic hypoxia are mediated acutely by HIF1α (peaking after 4–8h of hypoxia), while HIF2α peaks at 24–48h of hypoxia(Saxena & Jolly, 2019). Shorter periods of intermittent hypoxia (4h hypoxia followed by 20h normoxia) did not cause consistent and significant reductions in myotube diameter or perturbations in signaling molecules regulating protein homeostasis, showing that hypoxia initiates time-dependent responses despite intervening normoxia. Multiple molecular and functional perturbations that occur in our myotube models of PIH include unique transcriptomic responses and impaired protein synthesis. An integrated stress response occurred via a general control non-derepressible-2 (GCN2)-dependent eIF2α phosphorylation, and supported by gene deletion studies in myotubes and mouse embryonic fibroblasts with PIH and CH. We also observed lower oxidative phosphorylation, more mitochondrial free radical generation, oxidative modifications of proteins, lipids, and DNA, lower TCA cycle intermediates, and ultrastructural changes to mitochondria with CH suggesting decreased mitochondrial fission. Translational relevance was established by validating our critical observations in human inducible pluripotent stem cell (hiPSC) derived myotubes. In vivo studies in a mouse model of COPD showed a molecular phenotype of chronic hypoxia with increased skeletal muscle HIF2α expression. These data suggest that PIH results in an adaptive exhaustion with failure to restore cellular homeostasis laying the foundation for future studies to dissect the effects of PIH on skeletal muscle and potentially other organs in clinical studies evaluating nocturnal oxygen therapy in sarcopenic patients with COPD.
Results.
Since less is known about the global perturbations and responses to PIH, we used unbiased data analyses followed by direct experimental validation of key observations.
PIH causes global changes in protein synthesis and hypoxia inducible factor signaling
RNA sequencing from murine C2C12 myotubes following normoxia, PIH, and CH was performed to identify global responses of differentially expressed genes (DEGs). Clear separation of unique and shared DEGs was noted between groups (Figure 1,A,B). Functional enrichment analysis with feature extraction demonstrated associations of PIH with protein synthesis, HIF1α signaling, and senescence-related pathways (Figure 1,C). Pathway enrichments of HIF1α signaling and senescence were greater in PIH compared to CH (Figure 1,D). Experimental validation showed increased expression of HIF1α and HIF2α proteins, senescence-associated beta-galactosidase activity and phosphorylated p53Ser15 protein in PIH and CH compared to normoxia (Figure 1,E). Heatmaps of HIF1α and HIF2α target DEGs showed that HIF1α targets in PIH were preferentially overexpressed compared to normoxia. A search of the STRING database(Szklarczyk et al., 2019) to determine the relationship between DEGs in the HIF1α signaling pathway showed a number of interacting proteins in pathways related to glycolysis (i.e. Pgk1, Hk2) with PIH compared to normoxia (Figure 1,F). Pathway enrichments of all DEGs (Figure 2,A–C) showed additional associations of PIH with mitochondrial dysfunction and apoptosis. Targeted heat maps of gene pathways associated with a sarcopenic phenotype showed significant associations with PIH and CH (DEG p<0.001) (Figure 3). To avoid reliance on only one pathway algorithm, we used additional pathway analyses (i.e. g:Profiler) to validate our findings (Figures 4–7), which are consistent with our experimental data that PIH and CH are associated with dysregulated proteostasis and mitochondrial dysfunction underlying the sarcopenic phenotype.
Figure 1. Global transcriptomics analyses and differentially expressed genes during hypoxia.

All studies performed in differentiated murine C2C12 myotubes during normoxia (N), prolonged intermittent hypoxia (PIH with 3 cycles of 8h hypoxia/16h normoxia) or chronic hypoxia (CH) over 72 h. A. Heat map of differentially expressed genes (DEGs) from RNAseq in myotubes treated with PIH, CH, or N. Significance for DEGs was set at p<0.001. B. Venn diagrams showing unique and shared DEGs during PIH vs. CH, PIH vs. N, and CH vs. N; downregulated/upregulated DEGs in PIH and CH (vs. N); significance for DEGs was set at p<0.0001. C. Significantly enriched canonical pathways (-log[p value]≥1.3) in RNAseq from myotubes during PIH vs. N, CH vs. N, and PIH vs. CH. Number of genes in the pathway and the -log[p-value] are shown in parentheses to the right of each pathway. D. Heat map comparing enriched pathways in PIH and CH (vs. N). E. Representative immunoblots and densitometry of hypoxia-inducible factors (HIF1α and HIF2α) in response to PIH and CH, β-galactosidase activity with N, PIH or CH (100 mM of ceramide [Cer] as a positive control); representative immunoblots and densitometry of phosphorylated p53. Models used for the HIF1α and HIF2α expression in these immunoblots were reversed (16h normoxia/8h hypoxia) to demonstrate the level of HIF1α and HIF2α at the end of a hypoxic cycle. Full uncropped blots are provided in Supplementary Figure 2. F. Heat maps and STRING network analyses of HIF1α and HIF2α targets demonstrate associations with HIF signaling pathways and all genes on RNAseq analysis regardless of significance. All RNAseq and immunoblots were performed in 3 biological replicates per group. Exact p values are stated in the figure and in the Statistical Summary Table.
Figure 2. Pathway enrichment in RNA sequencing in myotubes during hypoxia.

RNA sequencing performed in differentiated murine C2C12 myotubes during normoxia (N), prolonged intermittent hypoxia (PIH with 3 cycles of 8h hypoxia/16h normoxia) or chronic hypoxia (CH) over 72 h. Stacked bar chart of canonical pathways enriched in differentially expressed genes (DEGs) in RNA sequencing. A. PIH vs. N; B. PIH vs. CH, and C. CH vs. N. Number of genes in the pathway and the -log[p-value] are shown in parentheses to the right of each pathway. Significance for DEGs was set at p<0.0001.
Figure 3. Feature selected heatmaps of RNA sequencing during hypoxia.

RNA sequencing was performed in differentiated murine C2C12 myotubes during normoxia (N), prolonged intermittent hypoxia (PIH with 3 cycles of 8h hypoxia/16h normoxia) or chronic hypoxia (CH) over 72 h. Feature selected heatmaps of differentially expressed genes (DEGs) were generated for: A. Hedgehog signaling, B. Myogenesis genes, C. Notch genes, D. Transforming growth factor (TGF) β genes, E. WNT β-Catenin genes, F. Phosphoinositide-3-kinase (PI3K)-Akt-mTOR signaling, and G. Protein secretion genes. Significance for DEGs was set at p<0.001.
Figure 4. Analyses of RNA sequencing in myotubes during hypoxia using multiple functional enrichment databases.
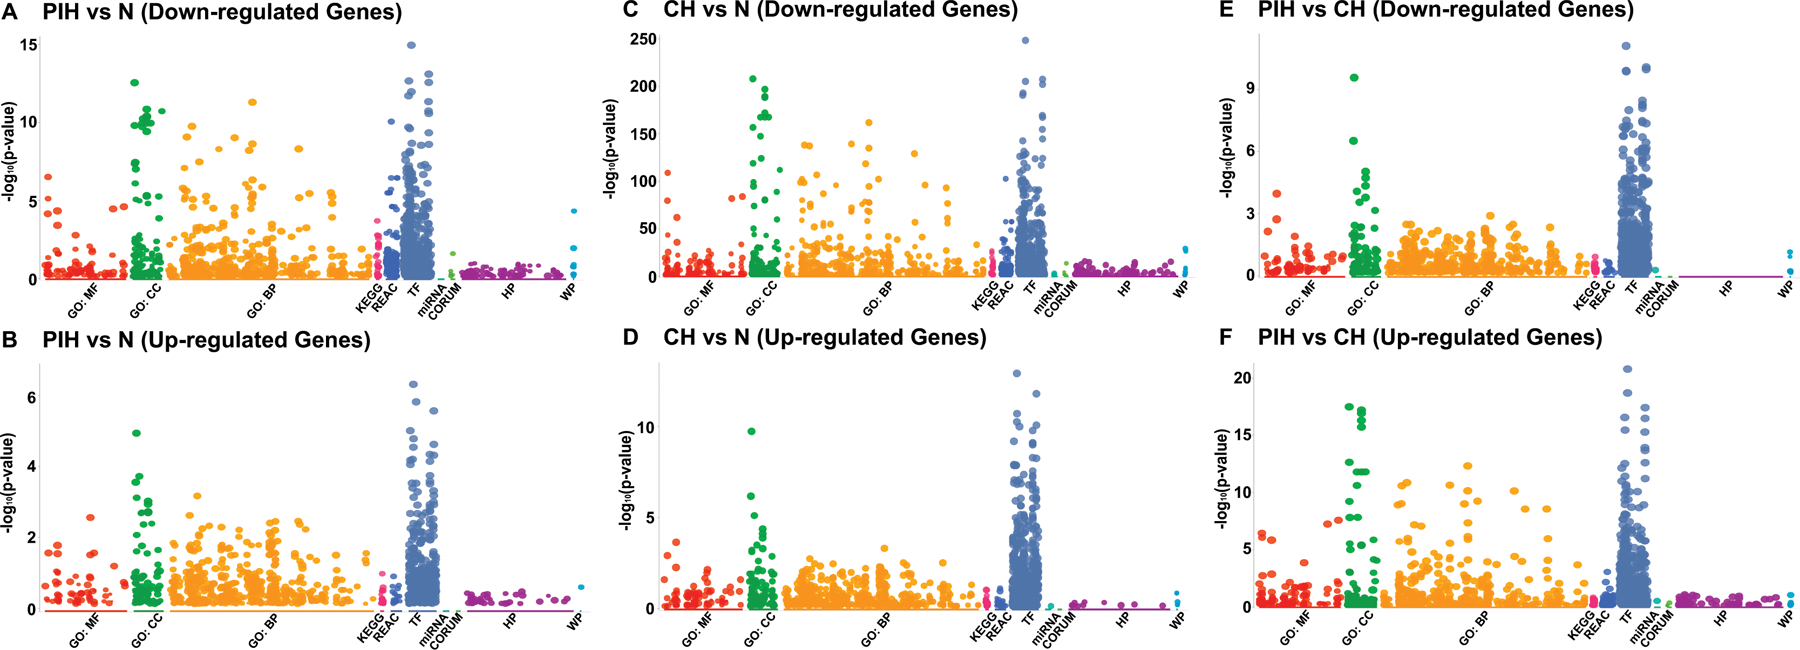
RNA sequencing was performed in differentiated murine C2C12 myotubes during normoxia (N), prolonged intermittent hypoxia (PIH with 3 cycles of 8h hypoxia/16h normoxia) or chronic hypoxia (CH) over 72 h. Manhattan plots were generated using g:Profiler integrating multiple pathway analyses including GO:MF (molecular function), GO (gene ontology):BP (biological process), GO:CC (cellular component), Kyoto Encyclopedia of Genes and Genomes (KEGG), REACTOME (database focused on biologic processes, intermediary metabolism, signal transduction of cell cycle), TF (putative transcription factor binding sites), miRNA (micro RNA targets), CORUM (comprehensive resource of mammalian protein complexes), HP (Human disease Phenotype), and WP (Wiki Pathways). Functional enrichment in differentially expressed genes (DEGs) with decreased or increased expression during: A, B. PIH vs. N; C,D. CH vs N; E,F. PIH vs CH. Significance for DEGs was set at p<0.001.
Figure 7. Enriched processes in RNA sequencing from myotubes during hypoxia.

RNA sequencing performed in differentiated murine C2C12 myotubes during prolonged intermittent hypoxia (PIH with 3 cycles of 8h hypoxia/16h normoxia) and chronic hypoxia (CH) over 72 h. Pathways enriched in: A, B. Differentially expressed genes (DEGs) with decreased or increased expression in PIH vs. CH using GO (gene ontology):BP (biological process), GO:CC (cellular component), GO:MF (molecular function), Kyoto Encyclopedia of Genes and Genomes (KEGG) and REACTOME (database focused on biologic processes, intermediary metabolism, signal transduction of cell cycle). All experiments were done in n=3 biological replicates. Significance for DEGs was set at p<0.05 (Student’s t-test with Benjamini-Hotchberg correction).
Lower myotube diameter and cell viability during hypoxia
Based on the global transcriptomic responses to PIH, we performed feature extraction of mTORC1 signaling genes and STRING network analysis in our RNAseq data. We found significant associations between transcripts associated with cell survival (i.e. CXCR4) and intracellular amino acid transport (i.e. SLC7A5) (DEG p<0.001) (Figure 8,A). We then observed a smaller diameter in differentiated C2C12 myotubes during both PIH and CH. However, 3 cycles of shorter duration of 4h hypoxia followed by 20h normoxia did not show significant responses (p=0.340) compared to those with 8h/16h PIH (p<0.0001) or CH (p<0.0001) (Figure 8,B). Cell viability determined by trypan blue exclusion and resazurin reduction assays(Qiu et al., 2012) showed lower cell viability in both PIH and CH compared to N (89% of N for the resazurin assay, p=0.012 for 8h PIH and p=0.011 for CH) while 4h PIH did not show a significant difference compared to controls (p=0.983 (Figure 8,C). Since mTORC1 is a critical regulator of proteostasis(Dasarathy & Hatzoglou, 2018), and was significantly altered in our RNAseq data, we analyzed the mTORC1 signaling pathway in the 4h/20h PIH and 8h/16h PIH models. Phosphorylation of mTORC1Ser2448 and its downstream target, P70s6KThr389 was unchanged in 4h/20h PIH and 8h/16h PIH models and decreased in CH. Hypoxia is known to initiate a cellular stress response with decreased protein synthesis via phosphorylation of eIF2αSer51(Liu et al., 2006). Interestingly, eIF2α also inhibits mTORC1 signaling with cross talk between these 2 critical protein homeostasis regulatory pathways(Davuluri et al., 2016a; Nikonorova et al., 2018). We, therefore, tested if eIF2α phosphorylation is altered during 4h PIH and 8h PIH models. Expression of phosphorylated eIF2αSer51 was increased in murine myotubes during 8h PIH but not in the 4h PIH model (Figure 8,D). Given these functional and molecular perturbations were observed only in our 8h PIH model, and since clinical nocturnal hypoxia usually lasts ~8h, all subsequent studies were performed using the 8h PIH model and compared with CH and normoxia. We observed reduced phosphorylation of p70s6K and its downstream signaling molecule mTOR in CH but not PIH. We also noted decreased activity of skeletal muscle protein phosphatase 2A (PP2A) in PIH and CH compared to normoxia (Figure 8,E). To demonstrate translational relevance, we generated and performed studies in hiPSCs that were differentiated into myotubes (Figure 9,A,B). Similar to the responses in C2C12 myotubes, reduction in hiPSC derived myotube diameter with PIH (8h model) and CH were noted. Phosphorylation of mTORC1Ser2448 and its downstream target, P70s6KThr389 was unchanged in PIH and decreased in CH. Consistently, phosphorylation of RiboS6 Ser240/244, an mTORC1 target(Noh et al., 2011), was also unchanged in PIH but decreased with CH. These data show that our findings in murine myotubes are reproduced in hiPSC-derived myotubes demonstrating translational relevance.
Figure 8. Sarcopenic phenotype in murine myotubes during hypoxia.

All studies performed in differentiated murine C2C12 myotubes during normoxia (N), prolonged intermittent hypoxia (PIH with 3 cycles of 8h hypoxia/16h normoxia unless specified) or chronic hypoxia (CH) over 72 h. A. Feature extracted heat map and STRING network analyses of differentially expressed genes (DEGs) in the mTORC1 pathway on RNA sequencing from myotubes. Significance for DEGs was set at p<0.001. n=3 biological replicates in each group. B. Representative photomicrographs of differentiated myotubes during N, two models of PIH (3 cycles of hypoxia/normoxia 4h/20h or 8h/16h) or CH for 72 h. Scale bar is 100 μm. Myotube diameter of differentiated murine C2C12 myotubes exposed to N, 2 models of PIH (3 cycles of hypoxia/normoxia 4h/20h or 8h/16h) or CH for 72 h. All data mean±SD from 80 myotubes in 4 fields for each biologic replicate (n=3). C. Percent cell viability as determined by resazurin assay and trypan blue assay are presented for N, 2 models of PIH (3 cycles of hypoxia/normoxia 4h/20h or 8h/16h) or CH for 72 h. All data are mean±SD of percentage of N (control). n=6 per group. D. Representative immunoblots and densitometry of phosphorylation of eIF2αSer51, mTORC1Ser2448, P70S6 KinaseThr389 with N, PIH or CH. Cells were harvested at the end of a normoxic cycle. n=3 biological replicates in each group. Full uncropped blots are provided in Supplementary Figure 2. E. PP2A activity in myotubes with N, PIH (8h/16h) and CH. n=6 biologic replicates for each group. Exact p values are stated in the figure and in the Statistical Summary Table.
Figure 9. Prolonged intermittent hypoxia results in a sarcopenic phenotype in human inducible pluripotent stem cell derived skeletal myotubes.

All studies performed in differentiated murine C2C12 myotubes during normoxia (N), prolonged intermittent hypoxia (PIH with 3 cycles of 8h hypoxia/16h normoxia unless specified) or chronic hypoxia (CH) over 72 h. A. Representative photomicrographs and diameter of differentiated myotubes. Scale bar is 100 μm. All data are mean±SD of percentage of N (control) from at least 80 myotubes in 4 fields from each biological replicate (n=3). B. Representative immunoblots and densitometry of phospho-eIF2αSer51, phospho-mTORC1Ser2448, phospho-P70S6KThr389, phospho-RiboS6Ser240/244. All immunoblots were performed in 3 biological replicates per group. Full uncropped blots are provided in Supplementary Figure 2. Exact p values are stated in the figure and in the Statistical Summary Table.
PIH lowers protein synthesis and perturbs signaling molecules by regulating proteostasis differently from that in CH
We then quantified protein synthesis by puromycin incorporation in myotubes which was reduced in both PIH and CH-treated C2C12 myotubes (Figure 10,A). The unfolded protein response (UPR) is an intracellular signaling pathway that responds to environmental stressors including hypoxia to cause decreased protein synthesis(Costa-Mattioli & Walter, 2020). Analysis of UPR genes in our RNAseq data showed significant differences in DEGs during PIH and CH compared to normoxia (Figure 10,B). Protein-protein interaction analyses using STRING network(Szklarczyk et al., 2019) also found distinct associations with chaperone proteins and the UPR response (Figure 10,B). During hypoxia, UPR has been reported to be mediated by the eIF2α kinases, GCN2 and Protein kinase R–like endoplasmic reticulum kinase (PERK) which phosphorylate eIF2αSer51 causing decreased protein synthesis(Costa-Mattioli & Walter, 2020). In our myotube models of PIH and CH, we did not observe a mobility shift of PERK reflecting absence of PERK phosphorylation (Figure 10,C). However, increased phosphorylation of GCN2 was observed in both PIH and CH (Figure 10,D). Consistently, we observed lower phosphorylation of eIF2αSer51 with PIH and CH in C2C12 myotubes with stable knockdown of GCN2 and in GCN2−/− mouse embryonic fibroblasts (MEF) compared to WT cells (Figure 10,E,F). These data show that in myotubes, hypoxia causes increased phosphorylation of eIF2αSer51 via a GCN2-dependent mechanism.
Figure 10. Cellular stress response during hypoxia in myotubes.

All studies performed in differentiated murine C2C12 myotubes during normoxia (N), prolonged intermittent hypoxia (PIH with 3 cycles of 8h hypoxia/16h normoxia) or chronic hypoxia (CH) over 72 h unless specified. A. Representative immunoblots of puromycin incorporation. B. Feature extracted heat map and STRING network analyses of differentially expressed genes (DEGs) in the unfolded protein response (UPR) pathway on RNA sequencing in myotubes. Significance for DEGs set at p<0.001. n=3 biological replicates in each group. C. Representative immunoblots for PERK for mobility shift in response to N, PIH, CH. Thapsigargin (TG) treatment was used as a positive control. TG3 = Thapsigargin (10mM) for 3 h, TG6 = Thapsigargin (10mM) for 6 h. Ponceau stain of membrane as loading control. D. Representative immunoblots and densitometry of phosphorylation of GCN2Thr899. E. Representative immunoblots and densitometry of phosphorylated eIF2αSer51 from murine myotubes transfected with shRandom (shRan) or shGCN2−/− during N, PIH or CH. F. Representative immunoblots and densitometry from GCN2−/− and wild type mouse embryonic fibroblasts (MEFs). Full uncropped blots are provided in Supplementary Figure 2. All immunoblots were performed in 3 biological replicates per group. Exact p values are stated in the figure and in the Statistical Summary Table.
To determine changes in translational capacity, we performed a feature extraction with generation of heat maps and STRING analyses for protein-protein interaction(s) of ribosomal proteins from the ribosomal protein gene database (RPG)(Nakao et al., 2004) that showed similarities and differences between PIH and CH (Figure 11,A–D). These transcriptomic responses were then experimentally validated (Figure 11,E,F). Ribosomal protein S6 is a component of the 40S ribosomal subunit required for mRNA translation which becomes activated by phosphorylation (RiboS6Ser240/244). Lower expression of phospho-RiboS6Ser240/244 was observed noted in CH but not in PIH. Phosphorylation of 4E-binding protein 1 (4E-BP1), a protein that directly interacts with eukaryotic translation initiation factor 4E (eIF4E), is another target of mTORC1 signaling(Gingras et al., 1999). Phosphorylation of 4E-BP1 causes its dissociation from eIF4E and activation of cap-dependent mRNA translation(Dasarathy & Hatzoglou, 2018). Phosphorylation of 4E-BP1 was lower with CH compared to that in PIH and normoxic myotubes. Expression of ribosomal proteins critical for mRNA translation included RPL32 that was reduced in PIH and CH whereas RPL5 and RPL23 were reduced only in CH.
Figure 11. Prolonged intermittent hypoxia causes perturbations in ribosomal biosynthesis as determined by transcriptomic analysis.

All studies performed in differentiated murine C2C12 myotubes during normoxia (N), prolonged intermittent hypoxia (PIH with 3 cycles of 8h hypoxia/16h normoxia) or chronic hypoxia (CH) over 72 h unless specified. Feature extracted heat map and STRING network analyses of differentially expressed genes (DEGs) in the cytosolic and mitochondrial ribosome genes on RNA sequencing in myotubes. Significance for DEGs set at p<0.001. n=3 biological replicates in each group. A. Small ribosomal cytosolic genes, B. Large ribosomal cytosolic genes, C. Small ribosomal mitochondrial genes, D. Large ribosomal mitochondrial genes. E. Representative immunoblots and densitometry of phosphorylated ribosomal S6 protein (RiboS6)Ser240/244 and 4E-BP1Thr37/45 in murine myotubes during N, PIH, and CH. F. Representative immunoblots and densitometry of ribosomal proteins RPL5, RPL23, and RPL32. Full uncropped blots are provided in Supplementary Figure 2. All immunoblots were performed in 3 biological replicates per group. Exact p values are stated in the figure and in the Statistical Summary Table.
PIH impairs mitochondrial oxidative function in myotubes
Since protein synthesis, one of the most energy demanding processes, is downregulated in PIH we evaluated mitochondrial oxidative function in intact and permeabilized myotubes. Feature extraction with heatmap generation of components of mitochondrial genes derived from MitoCarta 3.0(Rath et al., 2021), glycolysis and oxidative phosphorylation genes from Molecular Signatures Database(Liberzon et al., 2015) with pathway overlay of oxidative phosphorylation genes showed differences in patterns of these changes between PIH and CH compared to normoxic myotubes (Figure 12,A–F). Experimental validation of these data were performed using high sensitivity respirofluorometry in intact and permeabilized myotubes during PIH compared to normoxia (Figure 13,A,B). Hypoxia is instantaneously reversed upon removing from the hypoxic environment, and hence such studies could not be done in the CH model without causing reoxygenation. Mitochondrial oxidative function was lower with PIH compared to normoxic intact, non-permeabilized myotubes (Figure 13,C). Maximum (p=0.001) and ATP-linked respiration (p=0.001) were also significantly lower with PIH compared to normoxia. Responses of individual complexes of the ETC that contribute to mitochondrial oxidative dysfunction were dissected by permeabilizing myotubes using the substrate, uncoupler, inhibitor titration (SUIT) protocol (Figure 13,D). Oxygen consumption was lower in response to complex I substrates in PIH-treated myotubes compared with normoxic controls. Response to succinate, a substrate for complex II, was also significantly lower (p<0.0001) in permeabilized PIH-treated myotubes. Consistent with responses in intact myotubes, maximum and reserve respiratory capacity were lower in permeabilized PIH-treated myotubes. Rotenone-sensitive but not rotenone-insensitive oxygen consumption was lower and complex IV function was unaltered in PIH-treated myotubes. These data show that complexes I, II and III were impaired during PIH.
Figure 12. Mitochondrial and intermediary metabolite regulatory genes.

Feature extracted heat maps and overlay of oxidative phosphorylation pathway with differentially expressed genes (DEGs) from RNA sequencing in differentiated murine C2C12 myotubes treated with PIH (8h/16h), CH, or normoxia (N) for 72 h. A. Mitochondrial genes (MitoCarta3.0). B. Glycolysis genes. C. Oxidative phosphorylation (OxPhos) genes. D-F. Overlay maps of oxidative phosphorylation pathway. Significance for DEGs set at p<0.001.
Figure 13. Mitochondrial oxygen consumption in intact and permeabilized myotubes.

All studies performed in differentiated murine C2C12 myotubes during normoxia (N), prolonged intermittent hypoxia (PIH with 3 cycles of 8h hypoxia/16h normoxia) or chronic hypoxia (CH) over 72 h unless specified. A. Representative tracings of mitochondrial oxygen consumption (“oxygraphs”) in intact myotubes during normoxia and prolonged intermittent hypoxia. B. Representative tracings of mitochondrial oxygen consumption in digitonin permeabilized myotubes in response to substrates, inhibitors and uncoupler. O oligomycin; U uncoupler or FCCP carbonyl cyanide p-(trifluoromethoxy) phenylhydrazone (FCCP); R rotenone; Aa antimycin A; M malate; P pyruvate; Digi digitonin; D ADP; G glutamate; S succinate, TMPD N,N,N′,N′-tetramethyl-p-phenylenediamine; Asc ascorbate; Az azide. C. High sensitivity respirofluorometry-based mitochondrial oxidative responses to inhibitors of components of the ETC in intact myotubes during normoxia and PIH (n=6 per group). D. Mitochondrial oxidative responses to substrates, uncoupler and inhibitors in permeabilized myotubes (n=6 per group). E. Measures of fatty acid oxidation and oxygen consumption were quantified in response to palmitoyl-carnitine. A reduced analogue of co-enzyme Q (duroquinol or DHQ), which is a complex III substrate, was added to assess complex III activity. M malate; P pyruvate; D ADP, S succinate, G glutamate, Rot rotenone, RR reserve respiratory capacity; Max R maximum respiration (n=6 per group). F. Representative immunoblots and densitometry of citrate synthase (CS) and voltage dependent anion channel (VDAC) protein expression. Full uncropped blots are provided in Supplementary Figure 2. All immunoblots were performed in 3 biological replicates per group. *p values represent ANOVA. Exact p values are stated in the figure and in the Statistical Summary Table.
To further dissect the mechanisms of oxidative dysfunction due to PIH, fatty acid oxidation (FAO) was quantified in permeabilized myotubes with palmitoylcarnitine as a substrate (Figure 13,E). Significant reductions (p=0.001) in FAO occurred in PIH when compared to normoxia. These data suggest that PIH-induced impaired mitochondrial oxidative dysfunction was not compensated for by increased FAO. Complex III function in situ was tested by treatment with duroquinol (DHQ), which transfers electrons directly to complex III.
Decreased mitochondrial oxidative function was not due to a reduction in mitochondrial content because the expression of matrix enzyme citrate synthase as well as outer membrane protein VDAC were unaltered in CH and PIH-treated compared to normoxic myotubes (Figure 13,F).
Consistent with our unbiased data and studies with different substrates, we noted significant reductions (p=0.002) in complex III activity in PIH when compared with normoxia. To determine the mechanisms and functional consequences of mitochondrial oxidative dysfunction, ETC supercomplex assembly, individual complex activity, and ATP content were then quantified.
PIH causes reductions in mitochondrial respiratory chain complex activity and cellular ATP content
In addition to the transcriptomic responses of the ETC genes, we noted disassembly of ETC supercomplexes and lower in-gel activity of complexes I, III, IV and V in PIH and CH compared to normoxia. Complex II was reduced with CH but not PIH (Figure 14,A,B). Consistent with the hypoxia-induced defects in ETC complexes and mitochondrial oxidative function, total ATP content in both PIH and CH-treated myotubes was reduced compared to normoxic myotubes (Figure 14,C). Mitochondrial oxidative dysfunction during hypoxia was accompanied by changes in expression of glycolysis genes and lipid metabolism observed on transcriptomics (Figure 2,A–C; Figure 12,B). Impaired ETC component function contributes to generation of free radicals with oxidative stress that was subsequently evaluated.
Figure 14. Electron transport chain supercomplex assembly and component activity during hypoxia.

All studies performed in differentiated murine C2C12 myotubes during normoxia (N), prolonged intermittent hypoxia (PIH with 3 cycles of 8h hypoxia/16h normoxia) or chronic hypoxia (CH) over 72 h. A. Blue native gel electrophoresis of isolated mitochondrial proteins for electron transport chain (ETC) supercomplexes. B. Representative gel images and densitometry of in gel activity for complexes I, II, III, IV, and V. All experiments in n=3 per group. Full uncropped blots are provided in Supplementary Figure 2. C. ATP content in myotubes during normoxia, PIH, and CH. n=9 per group. Exact p values are stated in the figure and in the Statistical Summary Table.
Increased electron leak and free radical generation of mitochondria during hypoxia
Feature extraction of genes related to free radical/reactive oxygen species (ROS) response and antioxidants in our RNAseq data and STRING analyses found significant associations with antioxidant enzymes including superoxide dismutase 1 and peroxiredoxin 2 (Figure 15,A,B). Interestingly, expression of antioxidant genes were variably altered during PIH compared to normoxia or CH. Experimentally, compared to normoxic myotubes, both CH (p<0.0001) and PIH (p<0.0001) resulted in significantly higher total free radical generation while mitochondrial free radicals were higher in CH (p=0.011) but not PIH (p=0.575) (Figure 15,C,D). Generation of free radicals resulted in oxidative stress that was noted by higher 8-OHdG (a measure of oxidative DNA damage), protein carbonylation and lipid peroxidation with PIH and CH compared to normoxia (Figure 15,E–G). Despite lower free radical generation during PIH compared to CH, there were no differences in oxidative modifications of proteins and lipids between PIH and CH that may be related to the differences in antioxidant responses as noted in our transcriptomic analyses. These data suggest that despite lesser free radical generation during PIH compared to CH, the lower antioxidant responses result in similar oxidative stress. Since mitochondrial dysfunction is causally related to perturbations in intermediary metabolites(Martinez-Reyes & Chandel, 2020), we then quantified TCA cycle intermediates during hypoxia.
Figure 15. Mitochondrial free radicals and oxidative modifications in myotubes.

All studies performed in differentiated murine C2C12 myotubes during normoxia (N), prolonged intermittent hypoxia (PIH with 3 cycles of 8h hypoxia/16h normoxia) or chronic hypoxia (CH) over 72 h. A,B. Feature extracted heat maps and STRING network analyses of differentially expressed genes (DEGs) from RNA sequencing in myotubes for free radical (reactive oxygen species; ROS) and antioxidant genes. Significance for DEGs was set at p<0.001. n=3 biological replicates in each group. C. Representative flow cytometry images and percentage fluorescence intensity using the fluorescent probe MitoSOX to quantify mitochondrial free radicals. (n = 3/experimental group). D. Fluorescent intensity of 2’−7’dichlorofluorescein (DCF) as a measure of total cellular free radicals generated (n=9 per group). E. 8-hydroxyguanosine levels (n=3 per group). F. Representative immunoblots and densitometry of cellular carbonylated proteins. G. Concentrations of thiobarbituric acid reactive substances (TBARS) (n=6 per group). All immunoblots were performed in 3 biological replicates per group. Full uncropped blots are provided in Supplementary Figure 2. Exact p values are stated in the figure and in the Statistical Summary Table.
Alteration in TCA cycle intermediates and amino acid concentrations in myotubes during hypoxia
To determine if intermediary metabolites and their regulation of metabolic enzymes during PIH is altered by the periods of reoxygenation, we performed complementary transcriptomic analyses of regulatory molecules and targeted metabolomic analysis of intermediary metabolite concentrations. Significant differences were observed between expression of genes regulating the TCA cycle between PIH and CH (Figure 16,A). Unsupervised analyses showed that the expression of TCA cycle genes during PIH had greater similarity to normoxia than CH (Figure 16,B,C). Compared to normoxia, the transcripts of the majority of TCA cycle enzymes were lower during PIH with even greater reductions with CH. Genes related to the TCA cycle in our RNAseq data and STRING analyses showed significant alterations in succinate synthesis (dihydrolipoamide succinyl transferase, sldt; dihydrolipoamide dehydrogenase, dld; succinyl CoA synthetase components, suclg2), pyruvate dehydrogenase complex and lactate dehydrogenase. Consistently, most of the intermediary metabolite concentrations were lower during hypoxia (PIH and CH) compared to normoxia (Figure 16,D). However, concentrations of pyruvate were lower with CH but were unchanged in PIH compared to normoxic myotubes. Concentrations of other TCA cycle intermediates (citrate, α-ketoglutarate, and fumarate) were lower in PIH and CH compared to normoxic-myotubes (Figure 16,D). Malate was not different, and succinate was increased in PIH compared with normoxic myotubes. Intra and extracellular lactate concentrations were increased at 8h but not at 24h of hypoxia (Figure 17,A–C). At 72h with 3 cycles of PIH, lactate in the medium was increased but not at 72h of CH.
Figure 16. Changes in intermediary metabolites during hypoxia.

All studies performed in differentiated murine C2C12 myotubes during normoxia (N), prolonged intermittent hypoxia (PIH with 3 cycles of 8h hypoxia/16h normoxia) or chronic hypoxia (CH) over 72 h. A. Feature extracted heat map and STRING network analyses of differentially expressed genes (DEGs) in the tricarboxylic acid (TCA) cycle on RNA sequencing in myotubes. B. Unsupervised heatmaps of all DEGs on RNA sequencing in myotubes. Significance for DEGs set at p<0.001. C. Unsupervised feature extracted heatmap of DEGs in the TCA cycle from RNA sequencing in myotubes. Significance for DEGs set at p<0.001. D. Cellular concentrations of TCA cycle intermediates and amino acids in myotubes during normoxia, PIH and CH (measured at 72 h; n=6 biological replicates per group). RNA sequencing done in 3 biological replicates for each group. DEGs for heat map set at p<0.001. *p values represent ANOVA. Exact p values are stated in the figure and in the Statistical Summary Table.
Figure 17. Lactate concentrations and amino acid exchanger expression in myotubes.

Studies performed in differentiated murine C2C12 myotubes during normoxia (N), prolonged intermittent hypoxia (PIH with cycles of 8h hypoxia/16h normoxia) or chronic hypoxia (CH). A. Lactate concentrations in the myotube lysate and culture medium comparing normoxia and 8 hours of hypoxia (n=6 biological replicates per group). B. Lactate concentrations in the myotube lysate and culture medium during normoxia (N), PIH and CH for 24 hours (1 cycle; n=6 per group). C. Lactate concentrations in the myotube lysate and culture medium comparing normoxia (N), PIH and CH for 72 hours (3 cycles; n=6 per group). All data mean±SD from 6 biological replicates. D. Relative expression (fold change) of SLC7A5 mRNA by real-time PCR (n=9 biological replicates per group). *p values represent ANOVA. Exact p values are stated in the figure and in the Statistical Summary Table.
Branched chain amino acids (BCAA) leucine, isoleucine, and valine and other amino acids glutamate, proline and phenylalanine were lower with PIH compared to normoxic controls (Table 1). These are consistent with our data on amino acid sensor, GCN2-dependent increased eIF2α phosphorylation (Figure 10). BCAA transport is mediated by amino acid transporter/exchanger, SLC7A5, whose expression is increased during hypoxia in a HIF2α-dependent manner in neuronal cells(Onishi et al., 2019). In contrast, expression of SLC7A5 mRNA was reduced in both PIH and CH (Figure 17,D) reflecting context specific responses to hypoxic stress.
Table 1. Amino acid levels in myotubes.
| Amino acids | Concentration in nmol/µg of protein | ||
|---|---|---|---|
| Normoxia | PIH | CH | |
| Alanine | 4.03 ±0.57 | 6.79±1.04* | 6.78±1.02a |
| Glycine | 207.76±7.43 | 261.67±8.44*** | 273.61±7.51c |
| Valine | 33.85±3.86 | 25.83±2.76* | 24.47±3.73b |
| Leucine | 33.65±5.12 | 25.79±2.79* | 24.53±4.32a |
| Isoleucine | 49.16±5.54 | 36.43±4.64* | 33.17±3.66c |
| Proline | 24.98±2.53 | 13.40±1.47*** | 12.62±1.93c |
| Serine | 2.68±0.46 | 2.95±0.49 | 2.59±0.27 |
| Methionine | 2.01±0.37 | 1.63±0.11 | 1.35± 0.17b |
| Threonine | 29.32±4.34 | 22.04±2.99* | 19.76±2.40a |
| Phenylalanine | 17.16±2.73 | 13.17±1.30* | 9.93±1.13c 1 |
Values are presented means ± SD (nmol/µg of protein) n=6 treatment/group.
ANOVA with Tukey HSD post-hoc analysis was performed.
N vs PIH
p<0.05
p<0.001
p<0.0001
N vs CH
p<0.05
p<0.001
p<0.0001
PIH vs CH
p<0.05
p<0.001
p<0.0001
Exact p values are included in the Statistical Summary Table.
Hypoxia causes mitochondrial ultrastructural changes
We then determined if these functional alterations in mitochondrial and biochemical changes are accompanied by structural changes. To assess the impact of PIH and CH on the overall mitochondrial network, we performed immunofluorescence staining with MitoTracker orange™. We scored mitochondrial morphology within each cell as either fused, tubular, fragmented, or an intermediate state as previously reported(Akinbiyi et al., 2021). Mitochondrial morphology was predominantly intermediate (47%) and tubular (28%) in normoxia, fragmented (55%) and intermediate (20%) in PIH, or fused (78%) and tubular (11%) in CH (Figure 18,A,B). Depending on the environmental condition, mitochondria form interconnected networks which are regulated by mitochondrial fission and fusion(Bakare et al., 2021). With increased fission, mitochondrial networks can become disrupted (i.e. fragmented morphology) which impacts mitochondrial bioenergetics(Rafelski, 2013). Further dissection of mitochondrial ultrastructure by electron microscopy showed consistent changes in mitochondrial morphology with smaller/rounder mitochondria noted with PIH and longer/thinner mitochondria noted with CH (Figure 19,A). Mitochondrial length, area, and the number and width/thickness of cristae showed that compared to normoxia, mitochondrial length was significantly shorter in PIH (p=0.010) and longer in CH (p<0.0001). Furthermore, compared to normoxic myotubes, mitochondrial area was lowest in PIH myotubes (P<0.0001). The number of cristae per area (number of cristae/μm2) was highest in CH (p<0.0001) with no significant difference between normoxia or PIH (p=0.709). Cristae thickness per area (nm/μm2) was highest in PIH compared to normoxia (p=0.049) with no significant difference between normoxia or CH (p=0.982) (Figure 19,B). We then probed for dynamin-related protein 1 (DRP1), a critical regulator of mitochondrial fission(Liu et al., 2020). Site-dependent phosphorylation of DRP1 has different effects on mitochondrial responses with fission promoted by DRP1Ser616 whereas phosphorylation of DRP1Ser637 inhibits mitochondrial fission(Liu et al., 2020). Expression of phosphorylated DRP1Ser616 was lower with CH (p=0.029) with no significant difference between normoxia and PIH (p=0.966). In contrast, expression of phosphorylated DRP1Ser637 was higher with CH (p<0.0001) with no difference between normoxia or PIH (p=0.478) (Figure 19,C). These findings suggest that mitochondrial fission may be reduced in CH as an adaptive mechanism to hypoxia but not with PIH. We then probed for markers of mitochondrial fusion, which is a coordinated sequential process mediated by OMM-located mitofusin (MFN) 1 or MFN2, and optic atrophy 1 (OPA1)(Liu et al., 2020). Levels of MFN1, MFN2, and OPA were similar in normoxia, PIH and CH (Figure 19,C). Our studies suggest a role for DRP1-mediated decreased fission during CH which was not demonstrated in PIH. We then performed in vivo studies in mice with COPD to establish physiological relevance of our mechanistic data.
Figure 18. Altered mitochondrial network and morphology during hypoxia.

Studies performed in differentiated murine C2C12 myotubes during normoxia (N), prolonged intermittent hypoxia (PIH with 3 cycles of 8h hypoxia/16h normoxia) or chronic hypoxia (CH) over 72 h A. Representative immunofluorescence photomicrographs of myotubes stained with MitoTracker orange®. Scale bar 10 μm. N shows intermediate morphology, PIH shows fragmented morphology, and CH shows fused morphology. B. Mitochondrial morphology was scored within each cell (n=40) per group as either fused, tubular, fragmented, or an intermediate state. All data mean±SD from at least 3 biological replicates.
Figure 19. Perturbed myotube mitochondrial ultrastructure during hypoxia.

All studies performed in differentiated murine C2C12 myotubes during normoxia (N), prolonged intermittent hypoxia (PIH with 3 cycles of 8h hypoxia/16h normoxia) or chronic hypoxia (CH) over 72 h. A. Representative electron microscopy images. B. Mitochondrial length (μm; n=80 per group), mitochondrial area (μm2, n=80 per group), the number of cristae per mitochondrial area (cristae per μm2, n=20 per group), and cristae thickness per mitochondrial area (nm/μm2, n=20 per group) were quantified using ImageJ software. C. Representative immunoblots and densitometry for phosphorylated DRP1Ser616, phosphorylated DRP1Ser637, total Mfn1, Mfn2, and Opa1. Densitometry shows mean±SD from 3 biological replicates per group. Full uncropped blots are provided in Supplementary Figure 2. *p values represent ANOVA. Exact p values are stated in the figure and in the Statistical Summary Table.
Sarcopenic phenotype was recreated in muscle of emphysematous mice
Studies in mice with elastase-induced emphysema showed significant enlargement in airspace size (p<0.0001) which was quantified by measuring the mean linear intercept(Knudsen et al., 2010) and compared to controls (Figure 20,A). Mouse oximetry (n=3 mice pairs) also demonstrated significant reductions in oxygen saturation (p<0.0001) quantified every minute for 5 minutes in elastase mice as compared to PBS mice. Even though total body weight was not different between control and COPD mice, gastrocnemius muscle mass (p<0.0001) and triceps muscle mass (p=0.001) were significantly lower than in controls (Table 2). Protein synthesis measured by puromycin incorporation was significantly lower (p=0.018) in emphysematous mice compared to control (Figure 20,B). Consistent with reduced protein synthesis, mTORC1 signaling was reduced, while phosphorylation of eIF2α was increased in the gastrocnemius muscle of mice with emphysema compared to controls (Figure 20,C). Expression of HIF1α was not altered in our mouse model but we found significant upregulation of HIF2α (p=0.001) (Figure 20,C). Consistent with our observations in myotubes, mitochondrial oxidation was impaired with lower response to complex I substrates (malate, pyruvate, ADP, and glutamate) and succinate, a complex II substrate in permeabilized mouse gastrocnemius muscle. Maximum respiratory capacity in response to uncoupler of oxidative phosphorylation, carbonyl cyanide p-(trifluoromethoxy) phenylhydrazone (FCCP) was also lower in the muscle of emphysematous compared with control mice (Figure 20,D).
Figure 20. Murine model of emphysema with a sarcopenic phenotype reproduces molecular and metabolic perturbations of hypoxia.

All studies performed in 10-week old female C57/Bl6J mice with weekly pulmonary instillation of phosphate buffered saline (PBS) or porcine elastase (to generate emphysema/chronic obstructive pulmonary disease) for 3 weeks and euthanized at 16wk age. A. Representative photomicrographs of hematoxylin-eosin stained lung sections. Mean linear intercept quantified as described in the Methods (n=20 per group). Mouse oximetry measured every minute for 5 minutes and averaged for each mouse (n=6 per mouse). M1 = paired PBS and Elastase mouse (Group 1), M2 = paired PBS and Elastase mouse (Group 2), M3 = paired PBS and Elastase mouse (Group 3). B. Representative immunoblots and densitometry of puromycin incorporation in gastrocnemius skeletal muscle. C. Representative immunoblots and densitometry of phosphorylated eIF2αSer51, phosphorylated P70S6 kinaseThr389, Hif1α and Hif2α in gastrocnemius muscle. All immunoblots were performed in 6 mice per group. For the Hif1α immunoblot, there are two positive controls: CH = chronic hypoxia C2C12 cellular lysate, and Cob = Cobalt treated C2C12 myotube lysate as positive control for HIF expression. D. Mitochondrial respiration in permeabilized gastrocnemius muscle. M malate; P pyruvate; D ADP, S succinate, G glutamate, Rot rotenone, RR reserve respiratory capacity; Max R maximum respiration. Mean ± SD from 6 mice per group. Full uncropped blots are provided in Supplementary Figure 2. Exact p values are stated in the figure and in the Statistical Summary Table.
Table 2. Body weight and muscle weights in the PBS and Intra-tracheal elastase mice.
| Female mice | PBS, n=6 | Intratracheal elastase, n=6 |
|---|---|---|
| INITIAL BW | 19.75±0.48 | 19.48±0.05 |
| FINAL BW | 21.35±1.40 | 20.38±1.92 |
| Δ BW | 1.63±1.17 | 1.36±0.36 |
| Gastroc WT | 0.16±0.03 | 0.08±0.02*** |
| TA WT | 0.04±0.01 | 0.03±0.01 |
| Triceps WT | 0.09±0.01 | 0.05±0.02** |
All studies in 16 week aged female, C57Bl6 mice. BW body weight in gm.; All values are mean±SD. Gastroc = gastrocnemius, TA = tibialis anterior, BW = body weight, WT weight.
Student’s T Test:
p<0.05
p<0.01
p<0.0001.
Exact p values are included in the Statistical Summary Table.
Discussion.
Our untargeted and targeted approaches to dissect the impact of PIH on skeletal muscle demonstrate a persistent sarcopenic phenotype with decreased protein synthesis in myotubes subjected to PIH and CH as compared to normoxia. These responses were mediated through GCN2-dependent phosphorylation of eIF2α. Both PIH and CH resulted in mitochondrial dysfunction with altered expression of components involved in oxidative phosphorylation, ATP content and reduction in critical TCA cycle intermediates. These were accompanied by increased mitochondrial free radical generation and oxidative modification of lipids and proteins. Mitochondrial structural alterations were likely due to decreased fission in CH potentially via DRP1-mediated mechanisms. We also observed a sarcopenic phenotype due to PIH with decreased myotube diameter in hiPSC derived myotubes demonstrating the translational relevance of our findings. Physiological relevance of the sarcopenic phenotype, dysregulated signaling and mitochondrial oxidative dysfunction was established in skeletal muscle from a mouse model of COPD with hypoxia.
Our observations show that despite some similarities in responses to PIH and CH, intermittent reoxygenation (a clinically relevant model for nocturnal hypoxemia in COPD and distinct from OSA(Lacasse et al., 2018)), is not sufficient to completely restore the adverse effects of hypoxia. The acute adaptive phase of hypoxia that occurs within the first 8h is primarily mediated by HIF1α, followed by initiation of chronic adaptive responses mediated by HIF2α(Saxena & Jolly, 2019). HIF1α-mediated effects include reduction in protein synthesis, oxidative phosphorylation, and a shift to glycolysis for energy production(Caron et al., 2009; Slot et al., 2014; Kierans & Taylor, 2021), whereas HIF2α-mediated effects promote long-term adaptive responses including angiogenesis and upregulation of the amino acid exchanger SLC7A5(Hu et al., 2003).. A decrease in HIF1α and an increase in HIF2α expression that occur in the subsequent 24–48h of hypoxia is known as “HIF switch”(Saxena & Jolly, 2019). Since HIF2α-mediated effects require a longer duration of hypoxia, cycles of normoxia and hypoxia stimulate HIF1α-mediated responses without allowing the beneficial adaptive responses of HIF2α to occur(Saxena & Jolly, 2019). Such an adaptive exhaustion contributes to dysregulated skeletal muscle responses during PIH. Our data show that PIH stabilizes HIF1α more so than HIF2α in murine myotubes which is consistent with reports by others that intermittent rather than chronic hypoxia stimulates HIF1α in multiple cell lines(Saxena & Jolly, 2019). Stabilization of HIF1α is an early adaptive response to hypoxia with reduction in energy intense cellular functions(Hu et al., 2003) reflected by lower protein synthesis in both PIH and CH in myotubes.
In our studies, reduced mTORC1 signaling (i.e. phosphorylation of P70s6K and its downstream target mTORC1) was associated with CH but not PIH. We also observed decreased skeletal muscle protein phosphatase 2A (PP2A) activity in PIH and CH. Previous studies have shown that hypoxia inhibits the activity of PP2A via HIF1α-dependent and independent mechanisms(Elgenaidi & Spiers, 2019). Given that our model of PIH demonstrates robust elevations in HIF1α, the observed reductions in PP2A activity may explain the increased phosphorylation of P70s6K and mTORC1 as compared to CH, which adapts to hypoxia predominantly through HIF2α-mediated mechanisms. Future studies are needed to determine the role of HIF2α on PP2A activity in models of chronic hypoxia.
Lower protein synthesis in PIH was accompanied by increased phosphorylation of the translation initiation factor eIF2α. A number of eIF2α kinases have been identified to regulate protein synthesis in skeletal muscle and myotubes(Dasarathy & Hatzoglou, 2018). Hypoxia has been reported to activate the eIF2α kinase, PERK, phosphorylating the α subunit of eIF2 with decreased protein synthesis(Rozpedek et al., 2016). While others have reported that hypoxia activates PERK by phosphorylation as noted by a shift in the electrophoretic mobility(Koumenis et al., 2002), we did not observe such a mobility shift in PERK during PIH or CH which is consistent with a previous study in hypoxic C2C12 myoblasts(Majmundar et al., 2012) supporting context specific responses to hypoxia. We also noted robust increase in the phosphorylation of eIF2α in myotubes which was not demonstrated in MEFs, and may also represent a context specific response to hypoxia. Despite this, our genetic depletion studies show that the amino acid deficiency sensor and eIF2α kinase, GCN2, was responsible for phosphorylation of eIF2α during hypoxia in myotubes and MEFs. Consistently, a number of essential amino acids, including BCAAs, were decreased during PIH. These data suggest a context-dependent integrated stress response (ISR) to hypoxia including PIH and CH. The ISR is a mechanism to respond to stress, in this case extrinsic stress due to hypoxia, as a pro-survival pathway that down-regulates global protein synthesis while up-regulating biosynthesis and autophagic pathways. When GCN2 is activated, it initiates the ISR by phosphorylation of eIF2α which inhibits protein translation, and mediates transcriptional stress response(s) via ATF4. BCAA mixture supplemented with L-leucine reverses GCN2 activation in other chronic diseases like cirrhosis(Tsien et al., 2015), and could be a potential treatment in COPD patients with sarcopenia. Lower BCAAs in myotubes may be due to hypoxia-induced reduction in SLC7A5 in a context-dependent manner because our data are different from previous reports of increased SLC7A5 and BCAA in neuronal cells in a HIF2α-dependent and independent manner(Onishi et al., 2019; Fitzgerald et al., 2021).
Potential mechanisms for mitochondrial oxidative dysfunction in PIH include disassembly of components of the ETC. An intact ETC is required for sequential transfer of electrons down the electrochemical gradient for coupling oxidation with phosphorylation in order for ATP synthesis(Kumar et al., 2019). Physiological transport of electrons results in minimal physiologic leak of electrons and generation of free radicals(Turrens, 2003). However, greater leak of electrons due to hypoxia can result in increased generation of free radicals with oxidative modification of cellular components. We identified defects in multiple components of the ETC by oxygen consumption studies in response to substrates/inhibitors that could be mechanistically explained by mitochondrial supercomplex disassembly and decreased activity of ETC components during hypoxia. Importantly, reoxygenation during PIH does not reverse these abnormalities. Defects in mitochondrial supercomplex assembly decrease the efficiency of the ETC and result in generation of free radicals which cause oxidative modification of cellular proteins and lipids(Novack et al., 2020). Our data is similar to those reported with rapid cycles of hypoxia and normoxia in models of OSA(Xu et al., 2004). Consistent with disassembly of ETC component supercomplexes, ultrastructural studies of mitochondria showed that mitochondria were smaller in PIH and longer in CH compared to normoxia. These findings suggested alterations in mitochondrial fission, which is predominantly mediated by DRP1, with pDRP1Ser616 promoting fission and pDRPSer637 inhibiting fission(Cribbs & Strack, 2007). Previous studies of ischemia-reperfusion have noted that pDRP1Ser616 was upregulated in the early stage of ischemia (after 1 hour) whereas pDRPSer637 was upregulated in the later stage of ischemia (after 4 hours)(Duan et al., 2020). While our model involved different time courses, our findings are consistent with inhibition of DRP1-mediated fission during CH but not PIH with no significant difference in mitochondrial fusion components (MFN1, MFN2, OPA1). Previous studies have noted that elongation of mitochondria can occur due to inhibition of DRP1 alone(Westermann, 2012). Others have reported that HIF1α induces DRP1 expression and stimulates mitochondrial fission(Wan et al., 2014). Given that HIF1α was downregulated in CH, this supports our interpretation that CH inhibits DRP1-mediated fission. Interestingly, the number of cristae were increased with CH while cristae thickness was increased in PIH. Both cristae thickening(Dlasková et al., 2019) as well as increased number of cristae have been noted in response to hypoxia(Perkins et al., 2012). The mechanisms and consequences of these structural alterations during hypoxia need further evaluation.
Mitochondrial oxidative dysfunction cause a leak of electrons with increased free radical generation and oxidative modifications of cellular components. Consistently, increased mitochondrial free radical generation and oxidative modification of cellular components demonstrated that oxidative DNA damage was higher in PIH and CH when compared to normoxia. Interestingly, in addition to being a marker of lipid peroxidation, TBARS have been linked to ferroptosis(Doll et al., 2017), and consistently, the ferroptosis pathway was enriched in our unbiased dataset. Others have reported an association between an OSA-models of intermittent hypoxia and ferroptosis-associated liver injury in rats(Chen et al., 2020a), and both HIF1α and HIF2α regulate genes involved in iron homeostasis(Chen et al., 2020b). Future studies are needed to dissect the role of ferroptosis in PIH and CH and the mechanisms of HIF regulation.
In addition to our functional studies, cellular concentrations of TCA cycle intermediates except succinate and malate were reduced during hypoxia in myotubes. Lower concentrations of intermediary metabolites may be an adaptive response to decreased electron transport and oxidative function or due to accelerated cataplerosis without compensatory anaplerosis that has been reported in hypoxic cardiac myocytes(Des Rosiers et al., 2011). Prolyl hydroxylases require the presence of oxygen and α-ketoglutarate to hydroxylate HIF1α which is then targeted for proteasomal degradation. Therefore, lower α-ketoglutarate could lead to the persistent stabilization of HIF1α despite a restoration of oxygen(Saxena & Jolly, 2019). Additionally, succinate stabilizes HIF1α(Tretter et al., 2016) and is another potential mechanism of stabilization during PIH. Determining the relative contributions of lower αKG and increased succinate in stabilizing HIF1α can help dissect the mechanisms and target potential metabolic perturbations during hypoxia. During hypoxia, glycolysis is the major pathway for generating ATP and the inability to oxidize pyruvate results in an increase in lactate concentrations(Cabrera et al., 1999). While the levels of lactate in our analysis were not different at 72 h, lactate concentrations have been reported to be an unreliable indicator of tissue hypoxia(James et al., 1999). Another possible reason for unaltered lactate levels may be that chronically hypoxic cells utilize glutamine when glucose availability becomes limited.
Succinate accumulation as well as reductions in fumarate were seen in both PIH and CH, which suggest that instead of succinate dehydrogenase converting succinate to fumarate, the reverse reaction is occurring (i.e. fumarate reductase converting fumarate to succinate) as has been reported by others during hypoxia(Chinopoulos, 2013). It has been previously shown that increased succinate concentration causes this reverse reaction which is associated with significant ROS production(Hadrava Vanova et al., 2020). Hypoxia bypasses several steps in the ETC because oxygen is not present as an electron acceptor. When oxygen is limited, electrons are transferred from NADH to complex I and these electrons are then accepted by fumarate to generate succinate(Bisbach et al., 2020). Succinate accumulation due to ischemia/reperfusion is driven primarily by fumarate overflow from purine nucleotide breakdown and the aspartate-malate shuttle. Reperfusion then causes succinate to be re-oxidized by succinate dehydrogenase(Chouchani et al., 2014). We also noted increased levels of aspartate and malate in PIH that suggests a role for these mechanisms in our model. Moreover, purine nucleotide breakdown and the malate-aspartate pathway are upregulated in response to hypoxia as well as ischemia(Cohen et al., 2020). Consistent with these interpretations, our transcriptomic data demonstrated increased expression of succinate dehydrogenase in PIH when compared to CH, suggesting re-oxidation of succinate during PIH. These data lay the foundation for future studies on the contribution of intermediary metabolites to cellular adaptation and potentially, adaptive exhaustion during various stress states including hypoxia.
Our in vivo studies in mice with COPD showed changes similar to those observed with hypoxia(Wang et al., 2019). Although we did not directly measure muscle oxygen concentrations, HIF2α activation is suggestive of tissue hypoxia. The accompanying impaired protein synthesis and mitochondrial oxidative dysfunction show the physiological relevance of our findings in myotubes. However, whether these responses are due to PIH of nocturnal hypoxia or persistent hypoxia, the contribution of adaptive and maladaptive responses by HIF1α or HIF2α, and if these changes and their functional consequences including sarcopenia are reversible are currently not known.
Our C2C12 cell line is a robust in vitro model of skeletal muscle which we then validated with hiPSCs-derived myotubes. While hiPSC myotubes have been utilized in the literature to provide in vitro human translational relevance(Guo et al., 2020), and demonstrate contractile force similar to C2C12 and primary muscle cultures in humans and mice(Vesga-Castro et al., 2022), future studies are needed to further characterize how well these cell lines compare in terms of molecular and functional characteristics.
Our model involves 48 hours of differentiation from myoblasts to myotubes, which has been previously been shown by us to result in differentiation as demonstrated by maximum expression of creatine kinase activity assay, fusion index, and staining for myosin heavy chain(Davuluri et al., 2016a). Others have reported that myosin content and myotube size may continue to increase until day 7 of differentiation(Guigni et al., 2019), and therefore it is possible that exposure to PIH and CH at 48 hours mitigated further growth prior to achieving a steady state. However, extending our study beyond day 5 could cause loss of myotube diameter due to myotube aging which would confound our results and study of hypoxia(Yang et al., 2020).
Our studies show that during PIH, homeostasis is not restored during normoxia and suggests an adaptive exhaustion that recreates a sarcopenic phenotype similar in severity to that found in CH . Additional functional consequences of this adaptive exhaustion include lower protein synthesis, decreased mitochondrial oxidative function by direct effects on components of the ETC, and generation of free radicals. These data show that maintained oxygenation is required to protect cells from recurrent prolonged hypoxia and provide the mechanistic basis for sarcopenia in human patients with COPD with nocturnal hypoxia. Therapeutic strategies targeting nocturnal hypoxia and/or the intermediary metabolites in patients with COPD may prevent cellular adaptive exhaustion with the potential for clinical translation to reverse muscle loss.
Methods.
Ethical Approval.
All experimental protocols and procedures were conducted in strict accordance with the NIH Guidelines for the Care and Use of Laboratory Animals and the Cleveland Clinic Institutional Animal Care and Use Committee (IACUC, protocol#00002175). All steps to minimize pain and suffering were taken throughout the study. For euthanasia, all mice were anesthetized by isoflurane overdose, and once fully sedated underwent cervical dislocation. This method was approved by our IACUC committee. The authors also confirm that they understand the ethical principles under which the journal operates and that their work conforms to the principles and regulations described in the Editorial by Grundy(Grundy, 2015).
All chemicals were obtained from Sigma Aldrich (St. Louis, MO) and antibodies were obtained from Cell Signaling Technology (CST, Danvers, MA) unless specified.
In vitro culture studies.
C2C12 murine myoblasts (ATCC; CRL 1772) were grown to confluence in proliferation medium, Dulbecco’s modified Eagle’s medium (DMEM), containing 10% FBS (fetal bovine serum) followed by differentiation in DMEM with 2% horse serum for 48h(Qiu et al., 2012). Myotubes were then exposed to 1% oxygen for different time points: 4h of hypoxia (1% oxygen) followed by 20h of normoxia (21% oxygen) for 72h in the 4h intermittent hypoxia group, 8h of hypoxia (1% oxygen) followed by 16h of normoxia (21% oxygen) for 72h in the 8h intermittent hypoxia group, 1% oxygen for 72h for the chronic hypoxia group, and room air (21% oxygen) for 72h in the normoxia group. 72h was chosen because cellular adaptation to hypoxia is mediated acutely by HIF1α (where protein levels peak after 4–8h of hypoxia) and subsequently decline, while HIF2α increase after 8h and peaks at 24–48h of hypoxia in CH(Saxena & Jolly, 2019). 1% oxygen in C2C12 myotubes has been shown to recreate a similar desaturation pattern seen in the skeletal muscle of hypoxemic COPD patients(Martin et al., 2017). Hypoxia-treated and normoxic myotubes were harvested at the same time points and cell lysates and protein extraction were carried out using methods previously reported by us(Qiu et al., 2012). All cellular experiments were performed in at least 3 biological replicates.
Mouse embryonic fibroblasts.
GCN2−/− and GCN2+/+ mouse embryonic fibroblasts were cultured to confluence as previously described,(Davuluri et al., 2016b) subjected to normoxia, PIH or CH, and immunoblots were performed as with myotubes.
Human inducible pluripotent stem cells (hiPSCs).
iPSCs were cultured in Cultrex Ò (R & D Systems) coated plates which were grown in mTeSR medium (Stem Cell Technologies, Cambridge, MA). Medium was changed every alternate day until 70% confluence. Cells were then passaged using ACCUTASEÔ (Stem Cell Technologies, Cambridge, MA) for cell dissociation. Myogenic induction of iPSCs were initiated with commercial skeletal muscle induction medium (AMS Biotechnology; Abingdon, UK, Amsbio-SKM01) which was changed every alternate day for 5–7 days to generate myogenic precursor cells (satellite cells). Satellite cells were then cultured in myoblast medium (Amsbio-SKM02) changed every alternate day for 4–5 days in Cultrex coated plates. Medium was then replaced with myotube medium (Amsbio-SKM03) changed every alternate day until experiment was completed. Once myoblasts reached ~90% confluence, myotubes were differentiated for 48 hours prior to being subjected to the 72 hour hypoxia protocol. All cells were cultured on Cultrex coated plates. The iPSC line used in our experiments was generously provided by Dr. Jonathan Smith (cell line number: CW50058EE1).
Animal studies.
Female C57BL/6 mice (Jackson Laboratory, n=6 per group) were housed four per cage in sterile cages with a barrier filter and acclimated for 2 weeks prior to beginning the experiment. The cage and bedding were changed each week. Animals were housed in the Cleveland Clinic biological resource unit at 22°C with relative humidity of 40% and a 12h light/dark cycle. Mice were fed standard mouse chow (Harland−Teklad # 2014) which was irradiated and had access to sterile water at all points. At 10 weeks of age underwent intratracheal (IT) instillations of porcine pancreatic elastase or vehicle alone (saline) once weekly for 3 weeks. Females were chosen because it has previously been shown that female smokers are approximately 50% more likely to develop COPD than men. Women with severe COPD also have a higher risk of hospitalization and death from respiratory failure and comorbidities(Barnes, 2016). Mice were anesthetized with ketamine/xylazine (80mg/kg/10mg/kg) at the time of instillation. Mouse oximetry was monitored noninvasively during this procedure and the procedure was aborted if saturation <80% occurred. This was performed using a MouseOX Murine Plus Oximeter System (Starr Life Sciences Corporation, Oakmont, PA, USA) per the manufacturer’s directions. Depth of anesthesia was assessed by lack of response to a tail pinch. An endotracheal tube was placed (BioLITE), and a Hamilton syringe instilled 50 μl of saline + 4 units of porcine pancreatic elastase (PPE, Elastin #EC134) into the trachea followed by 50 μl of air. Mice were monitored at one hour and four hours following the procedure. Core temperature was maintained within a normal range (37.0 ± 0.5°C) using a heating pad. This procedure was repeated once weekly for 3 weeks, and mice were monitored for an additional 3 weeks. This protocol creates emphysema after IT instillations are completed(Ceelen et al., 2018). Mouse oximetry was then quantified noninvasively in a subset of mice (n=3 per group) to determine if IT instillations cause hypoxia as compared to PBS instillations. Oximetry was measured at every minute for 5 minutes. This was done to prior to euthanasia. Mice were then anesthetized by isoflurane overdose, and once fully sedated underwent euthanasia by cervical dislocation. Lungs were harvested after PBS injection into the right ventricle followed by instillation of optimal cutting temperature (OCT®) fixative into the trachea (to inflate the right lung; the left lung was harvested without fixative). Instillation fixation was carried out with a constant instillation pressure of 20 cm H2O to prevent artefactual airspace enlargement(Knudsen et al., 2007). Lung tissue was then placed onto a cassette, covered with additional OCT, and then slowly dipped into isopentane-chilled in liquid nitrogen. Frozen sections (~10 um) were cut on a cryostat microtome, mounted on Superfrost Plus microscope slides and stored in a −20°C freezer for staining with hematoxylin and eosin. The remaining tissue was flash-frozen in liquid nitrogen and stored at −80°C for subsequent assays. Mean linear intercept was measured as the mean length of straight-line segments (“chords”) on random test lines spanning the air spaces between two sequential intersections of alveolar surface as previously described(Knudsen et al., 2010).
RNA sequencing and downstream bioinformatics analyses
To determine mechanistic insights into metabolic and adaptive alterations to prolonged intermittent hypoxia and chronic hypoxia as compared to normoxia, whole cell RNAseq was extracted from C2C12 myotubes that were exposed to either normoxia, prolonged intermittent hypoxia (8h 1% oxygen / 16h 21% oxygen), or chronic hypoxia (24h 1% oxygen) for 72h using the RNeasy Plus minikit (Qiagen). RNA quality was determined by an Agilent 2100 bioanalyzer (Agilent Technologies) and quantitative PCR (library activity ≥2 nM). RNAseq libraries were generated using the RNeasy Plus minikit (Qiagen) and sequenced on an Illumina HiSEQ400 instrument by Admera Health (South Plainsfield, NJ). Differentially expressed genes were quantified and compared across three different groups using standard data analyses approaches.
Bioinformatics analyses.
Downstream analysis was performed using STAR, HTseq, Cufflink, and Novogene’s wrapped scripts. Alignments were parsed using TopHat, and differential expressions were determined with DESeq2.
Map reads to the reference genome.
Mus musculus genome assembly GRCm38 (mm10) (https://www.ncbi.nlm.nih.gov/grc) and gene model annotation files were downloaded from genome Web site browser (National Center for Biotechnology Information [NCBI]/University of California Santa Cruz/Ensembl) directly. STAR (version 2.5) was used to build reference genome indices, and paired-end clean reads were aligned to the reference genome. A precise mapping result for junction reads was created using the method of maximal mappable prefix with STAR.
Quantification of gene expression level.
HTSeq (version 0.6.1) was used to count read numbers mapped to each gene. The fragments per kilobase of transcript per million mapped read values were calculated for each gene based on the length of the gene and read counts mapped to the gene. This method of calculating fragments per kilobase of transcript per million mapped reads takes into account the effect of sequencing depth and gene length for the read counts at the same time and is the most commonly used method for estimating gene expression levels.
Differential expression analysis.
Differential expression between two conditions/groups (three biological replicates per condition) was performed with DESeq2 (version 2_1.6.3). Log (base 2) expression ratios were calculated for each comparison (i.e. normoxia vs prolonged intermittent hypoxia vs chronic hypoxia). Statistical methods for determining differential expression of digital gene expression by DESeq2 used a model based on the negative binomial distribution. The resulting p values were adjusted using the Benjamini and Hochberg’s approach for controlling the false discovery rate (FDR). All Venn diagrams and heatmaps were created with R (v4.0.2). Venn diagrams were created using the “venn” ( https://CRAN.R-project.org/package=venn), “ggplot2” (https://ggplot2.tidyverse.org), and “ggpolypath” (https://cran.r-project.org/package=ggpolypath) packages to identify unique and common genes in different treatment groups. Rows were scaled. For heatmaps where hierarchical clustering was performed, these were done using hclust (https://www.rdocumentation.org/packages/fastcluster/versions/1.1.25/topics/hclust) using complete-linkage clustering. Dendrograms were plotted with dendextend(Galili, 2015).
Functional enrichment analysis.
Gene interaction tools were used to evaluate pathways associated with our experimental data. Since each pipeline assigns different priorities based on the weights for their algorithms, we utilized multiple applications to determine novel regulatory pathway targets. These databases included the Ingenuity Pathway Analysis (QIAGEN, Inc; https://www.qiagenbioinformatics.com/products/ingenuity-pathwayanalysis), which uses proprietary algorithms, and g:Profiler (https://biit.cs.ut.ee/gprofiler/gost) which integrates the Kyoto Encyclopedia of Genes and Genomes (https://www.kegg.jp - molecular-level information generated by genome sequencing and other high-throughput experimental strategies), GO (http://geneontology.org - comprehensive computational models of biological systems), and TRANSFAC (a database of transcription factors). We then used STRING 10.0 (https://www.string-db.org/) to explore protein–protein interactions and functional relations in DEGs(Szklarczyk et al., 2019).
RNAseq DEG and statistical significance values were uploaded into IPA (Ingenuity Pathway Analysis; QIAGEN, Inc: https://www.qiagenbioinformatics.com/products/ingenuity-pathway-analysis) and canonical pathway enrichment, i.e. pathways with the most significant representation among the molecules in the selected dataset, were identified with Ingenuity Pathway Knowledge Base (IPKB). Networks of upstream regulators and molecules with known interactions were also generated using IPKB. All the molecules that compose each network identified in the IPKB are listed, and the molecules from the gene set that are contained within a network, termed “network eligible molecules,” were quantified.
Analysis by g:Profiler (https://biit.cs.ut.ee/gprofiler/gost) was performed using molecular-level information generated by genome sequencing and other high-throughput experimental strategies(Raudvere et al., 2019). g:Profiler represents a Manhattan plot that illustrates functional enrichment analysis from multiple pathways. The x-axis shows functional terms that are grouped and color-coded by data sources from GO (BP = biological processes; CC = cellular component, MF = molecular function) and from other enrichment pathways including KEGG(Kanehisa & Goto, 2000), REACTOME(Fabregat et al., 2018), TRANSFAC (putative transcription factor binding sites), miRTarBase(Huang et al., 2020), CORUM (protein complexes)(Giurgiu et al., 2019), HP (tissue specificity from human protein atlas)(Thul & Lindskog, 2018), and WP (human phenotype ontolog)(Arighi et al., 2017). The y axis shows adjusted enrichment p-values in negative log10.
Data availability.
All unbiased data have been uploaded to publicly accessible repositories. The RNAseq data have been deposited to GitHub at https://github.com/dasaraslab/Unbiased.
Statistical significance for RNAseq DEG was considered with an FDR <0.05. Canonical pathways were determined to be significant if −log(p value) ≥1.3 for the pathway. Validation data are presented as mean ± SD and an unpaired Student’s t test was used to assess statistical significance. For the canonical pathway enrichment of IPAs, the significance values (p value of overlap with a dataset) are calculated using a right-tailed Fisher’s exact test. The significance indicates whether the percentage of DEG associated with a pathway is present in our datasets/clusters by random chance. For the IPA network analyses, a significance score is given to each network by taking the negative exponent of the right-tailed Fisher’s exact test result. The score measures the likelihood that the “network eligible” molecules that are part of a network are found within the dataset by random chance alone. For g:Profiler functional enrichment analyses, the g:SCS multiple testing correction method was used, applying a significance threshold of 0.05.
Reliability of the measurements between replicates.
The raw values for the biological replicates for unbiased data were used for generating heat maps and all raw values (including those differentially expressed between datasets) have been provided as Supporting Tables. For pathway analyses, fold changes were calculated for each DEG by averaging the control and the two hypoxia groups. For unbiased data analyses, false discovery rates, raw data, log2 fold change, and p values are provided for all data.
Quality control.
Correlation matrices were generated to summarize the correlations between all variables in the dataset (Figure 21). Dispersion estimates were calculated for each gene and plotted using “XBSeq”(Liu et al., 2017). MA plots were generated for the data as a visual representation which plots the differences between measurements using the log ratio (M) and mean average (A) and dispersion of counts were plotted against mean of the normalized counts. Statistical significance versus fold-change were plotted with volcano plots. Variation in the dataset was calculated using principal component analysis (PCA plots).
Figure 21. Quality control measures for RNA-Seq data.

All studies performed in differentiated murine C2C12 myotubes during normoxia (N), prolonged intermittent hypoxia (PIH with 3 cycles of 8h hypoxia/16h normoxia) or chronic hypoxia (CH) over 72 h. A. Correlation plots between PIH vs Normoxia, PIH vs CH, and Normoxia vs CH. B. Dispersion estimates comparing PIH vs Normoxia, CH vs Normoxia, PIH vs CH. Dispersion estimates plot the expected dispersion value of the gene based on the mean expression level and the maximum likelihood estimation (MLE) of the dispersion. C. MA plots comparing M (log ratio) and A (mean average) between PIH vs Normoxia, CH vs Normoxia, and PIH vs CH. D. Volcano plots (-log[p-value] vs. log2 fold change) of genes from RNA sequencing for PIH vs. N, CH vs N, and PIH vs CH. E. Principal component analysis (PCA) plots comparing biologic replicates of PIH vs N, PIH vs CH, and CH versus N.
Sarcopenic phenotype.
The diameter of C2C12 and hiPSC-derived myotubes were quantified as previously described(Rommel et al., 2001; Qiu et al., 2013). In brief, unstained myotubes were imaged using a light microscope with an attached camera (Olympus IX2-UCB, Center Valley, PA) for C2C12 myotubes. For hiPSC myotubes, we imaged with a phased contrast microscope with an attached camera (Keyence BZ-X10, Osaka, Japan). We chose the Keyence BZ-X10 microscope for the hiPSC myotubes due to their overall thinner diameter as compared to the C2C12 myotubes and because this microscope provides distinct contrast between individual myotubes. Ten random fields were captured within each well with 3 biologic replicates used per group. 4 random fields were used for quantification of 80 myotubes per group. 20 myotubes were measured per field and were chosen as long as there were no major branch points. Myotube diameter was manually quantified by an investigator blinded to the experimental group using NIH ImageJ software (imagej.nih.gov/ij/list.html) expressed as a percentage of controls(Davuluri et al., 2016b). Puromycin incorporation was used to measure protein synthesis. In brief, hypoxia-treated or normoxic myotubes were incubated with 1 μM puromycin for 30min followed by immunoblotting with antipuromycin antibody. Densitometry of all the bands of puromycin-incorporated proteins in each lane across the entire molecular weight range (20–150 Kd) were quantified and normalized to total protein loading. Unedited photomicrographs of myotubes are provided in Supplementary Figure 1.
Myotube viability.
Cell viability was determined by trypan blue exclusion and consistently >90% in all experiments. Because trypan blue is limited by subjectivity between multiple shades of blue or blue-gray, we also quantified viability using the resazurin reduction assay (CellTiter-Glo™ assay; Promega, Madison, WI) as previously described(Qiu et al., 2012). Viable cells reduce a redox dye (resazurin) into a fluorescent end-product (resorufin) while nonviable cells do not reduce the dye and fail to generate a fluorescent signal. Briefly, cells were seeded at a density of 10,000 on a clear-bottomed 96-well plate, differentiated, and underwent protocols of normoxia, PIH, and CH for 72 hours. Cells were then lysed, and luminescence was read on a Bio-Rad ChemiDoc XRS+ with the associated Image Lab software (Bio-Rad, Thermo Fisher Scientific).
PP2A activity.
PP2A immunoprecipitates were washed with phosphatase assay buffer and incubated with a PP2A-specific threonine phosphopeptide substrate. Phosphate release and PP2A activity was assessed using a malachite green assay kit (Millipore-Sigma, Burlington, MA)(Davuluri et al., 2021).
Intact cell respiration.
Intact cell respiration was measured in myotubes as previously described by us(Davuluri et al., 2016a). In brief, C2C12 myoblasts were differentiated into myotubes for 48 h and then were treated with either normoxia or 8h/16h model of PIH for 72 h, trypsinized, washed in phosphate buffered saline, centrifuged at 800 g for 2 min, and resuspended (750,000 cells/ml) in DMEM with 2% horse serum. Cell viability was determined prior to mitochondrial function studies by trypan blue exclusion and was consistently over 90% in all experiments.
Mitochondrial OXPHOS in permeabilized myotubes.
Differentiated C2C12 myotubes were permeabilized by digitonin, maintained in mitochondrial respiration medium (MiR05) followed by the addition of complex I substrates (malate, pyruvate and glutamate) and then complex II substrate (succinate). Respiration in response to saturating concentrations of complex I and complex II substrates and ADP were used to determine an intact electron transport system. Oxidation and phosphorylation were uncoupled using a protonophore, carbonyl cyanide p-(trifluoromethoxy) phenylhydrazone (FCCP), in order to measure the maximum oxidation capacity or maximum respiration. Uncoupled complex I oxygen consumption (the rotenone-sensitive rate) and uncoupled complex II oxygen consumption (the rotenone-insensitive rate) were then determined. Uncoupled complex IV oxidation rate was calculated by the difference between the tetramethyl phenylene diamine (TMPD) and ascorbate response and the azide-insensitive oxygen consumption.
Oxygen consumption rates were calculated by recording oxygen concentration and flow rates recorded at 2 s intervals using DatLab2 software by the Oroboros system (Innsbruck, Austria) as previously reported by us(Ye & Hoppel, 2013). All experiments were performed in at least 6 biological replicates after calibration of the oxygen sensors and instrument background corrections. All data were expressed as oxygen consumption in pmol.sec−1.106 cells−1 to allow for comparisons across experiments.
Fatty acid oxidation and complex III activity in permeabilized myotubes
Fatty acid oxidation was measured by quantifying oxygen consumption in response to palmitoyl-carnitine and malate supplementation in normoxia and PIH-treated myotubes. To assess the complex III function, palmitoyl-carnitine and malate were added followed by digitonin to permeabilize the myotubes. Then saturating concentrations of ADP were added. Following this, rotenone was added to block complex I function and a reduced analogue of co-enzyme Q (duroquinol or DHQ), which is a complex III substrate, was added to the chamber. Oxygen consumption was then quantified to determine complex III function as previously described(Kumar et al., 2019).
Mitochondrial supercomplex assembly
To determine if ETC supercomplexes were disrupted, blue native gel electrophoresis was performed as previously described by us(Singh et al., 2021). Mitochondria were isolated and the mitochondrial membrane permeabilized using digitonin (4g/g digitonin to protein ratio) and incubated at 4°C for 20 min. Following centrifugation at 10,000xg for 10 min at 4˚C, the supernatant was collected and mixed with a native gel buffer (5% Coomassie blue G, 500mM a-amino n-caproic acid, 100mM bis-tris pH 7.0). Native gel electrophoresis was performed followed by staining the gel with Coomassie blue and then distained to identify mitochondrial complexes. The gel was incubated in a solution containing 300mM Tris, 100mM Acetic acid and 0.1% SDS for 1h. Transfer was performed in a transfer buffer containing 25mM Tris and 192mM Glycine at 25V overnight at 4˚C.
In gel activity assays
To measure activity of individual complexes, in-gel activity was performed as previously described by us(Singh et al., 2021). For complex I activity, after electrophoresis, the gel was stained overnight with a solution containing 1 mg/ml of NADH and 2.5 mg/ml of Nitroblue tetrazolium chloride (NBT) in 2 mM of Tris HCl. Complex III and IV activity was observed in a 10 ml solution prepared in 50 mM phosphate buffer containing 10 mg of DAB and 20 mg of cytochrome C. Complex II activity was observed by staining the gel in a solution prepared in 5mM Tris HCl containing 20 mM of sodium succinate, 0.5 mM of phenazine methosulphate and 25 mg of NBT. Complex V activity was observed in a solution prepared in 35 mM of Tris HCl with 270 mM glycine, 14 mM of MgSO4, 10 mM of ATP, and 0.2% lead nitrate [Pb(NO3)2]. Reactions for each in gel activity was terminated using a stop solution (10% glacial acetic acid).
Free radical generation
Mitochondrial free radical concentration were measured by flow cytometry as described by us earlier(Davuluri et al., 2016a). At the completion of the standard 72h protocol (for normoxia, PIH, and CH), myotubes were treated with mitochondrial targeted fluorescent dye MitoSOX (Invitrogen, Carlsbad, CA, USA) for 30 min at 37 °C prior to trypsinization and underwent flow cytometry analysis (LSRII from BD Biosciences). Analyses were done using the FlowJo software (FlowJo, LLC, Ashland, OR, USA). Cellular levels of ROS were determined by fluorescent intensity of 2’−7’dichlorofluorescein (DCF).
Thiobarbituric acid reactive substances (TBARS)
Thiobarbituric acid reactive substances (TBARS) were quantified using a fluorometric assay as previously described as a measure of lipid peroxidation(Davuluri et al., 2016a). In brief, 50 μg of protein was boiled in 10 μl of 10% sodium dodecyl sulfate and 100 μl of a color reagent (0.53% thiobarbituric acid in acetic acid in sodium hydroxide). Fluorescence was measured after incubation for 10 min at room temperature (excitation wavelength of 530 nM; emission wavelength of 550 nM).
Carbonylated proteins
Cellular lysates were derivatized with dinitrophenol (DNP) to determine the expression of carbonylated proteins by immunoblot assay for DNP as previously described(Davuluri et al., 2016a).
Oxidative DNA damage
Oxidative DNA damage was quantified using the Oxiselect Oxidative DNA Damage ELISA Kit (Cell Biolabs, Inc., USA), a competitive immunoassay to measure 8-hydroxydeoxyguanosine (8-OHdG) per the manufacturer’s instructions. DNA was extracted using the DNeasy Blood & Tissue kit (Qiagen, Inc.) according to the manufacturer’s instructions. DNA samples were converted to single-stranded DNA after incubating them at 95°C for 5 minutes followed by rapid cooling on ice. Denatured DNA was then digested to nucleosides by incubating with nuclease P1 (10 units; New England Biolabs) in 20 mM of sodium acetate (pH 5.2) for 2 hours at 37°C followed by alkaline phosphatase treatment (20 units) in 100 mM Tris buffer (pH 7.5) for 1 hour at 37°C. The reaction mixture was then centrifuged and supernatant was evaluated by a competitive immunoassay following the manufacturer’s instructions. Absorbance of samples was read against a standard curve. 8-OHdG concentrations were expressed as ng/ml.
Mitochondrial structure studies
MitoTracker orange.
At the completion of the standard 72h protocol (for normoxia, PIH, and CH), cells were washed with PBS twice and incubated with MitoTracker orange probe (Invitrogen) (500 nM) for 30 min at 37°C in a humidified atmosphere. Cells were then washed two more times with PBS, and fixed by 4% paraformaldehyde for 20 min. Nuclei were stained by DAPI. Images were analyzed using an HCX Plan Apo ×63/1.4 NA oil immersion objective on a Leica TCS-SP2 confocal microscope (Leica Microsystems). Cells were imaged through a ×40/1.4 NA oil immersion objective. Images were collected and saved using Leica Confocal software and exported to Microsoft Picture Manager for digital processing. Mitochondrial morphology was assessed by blinded individuals who categorized each cell as predominantly fused, tubular, intermediate, or fragmented(Akinbiyi et al., 2021) for randomized confocal images. The number of cells in each category were divided by the total number of cells imaged (n=40 per each group) to calculate the percentage in each group.
Electron microscopy.
In brief, after the 72h treatment protocol (normoxia, PIH, and CH), and after appropriate washing, cells were fixed in 2.5% glutaraldehyde-4% paraformaldehyde in 0.1 M cacodylate buffer, pH 7.3, for 24 h. This was followed by post-fixation with 1% osmium tetroxide for 1 h. After en bloc staining and ethanol dehydration, samples were embedded with eponate 12 medium. Sections (85 nm) were cut using a diamond knife, followed by double staining using uranyl acetate and lead citrate. Electron microscopy was performed at the Imaging Core at the Lerner Research Institute at the Cleveland Clinic on a Philips CM12 electron microscope (FEI, Hillsboro, OR) operated at 10 Kv as described earlier by us(Qiu et al., 2012). Mitochondrial length (80 per group), mitochondrial area (80 per group), the number of cristae per mitochondrial area (20 per group), and cristae thickness per mitochondrial area (20 per group) were quantified using ImageJ(Schneider et al., 2012). We also quantified the number of mitochondria per 100μm2 (3 per group).
ATP content
Total cellular ATP content in the normoxic or hypoxia-treated C2C12 myotubes was quantified using a bioluminescence assay (Molecular Probes, Eugene, OR, USA) as per manufacturer instructions as previously described(Davuluri et al., 2016a).
Quantification of the TCA cycle metabolites
Myotubes were lysed using cold RIPA buffer, metabolites were extracted using cold ethyl acetate and labeled internal standards were added. Samples were then dried under nitrogen gas stream, derivatized using MTBSTFA with 1% TBDMS (Restek, Bellefonte, PA, USA) and run on an Agilent gas chromatography-mass spectrometry (GC-MS) under electron ionization. Standards for each of the TCA cycle metabolites and were quantified as reported by us(Davuluri et al., 2016a).
Quantitative measurements of amino acids from PIH and CH-treated myotubes
Free amino acids were quantified in differentiated myotubes treated with/without PIH and CH as compared to normoxic controls using gas chromatography-mass spectrometry as previously reported(Singh et al., 2021). Lysates were extracted using RIPA buffer and ~500µg of protein samples were spiked with 4.1 mmol each of the following standards: [D4]-alanine, [D3]-aspartate, [U-13C5]-glutamate, [D2]-glycine, [U-13C6]-isoleucine, [D10]-leucine, [D3]-methionine, [D5]-phenylalanine, [D3]-proline, [D3]-serine, [D2]-threonine, and [D8]-valine. Samples were homogenized in 6% formic acid and after centrifugation, the supernatants were diluted with an equal volume of deionized, HPLC grade water and loaded on a cation exchange column (Dowex AG 50W-8X, 200–400 mesh, H+ form, Sigma-Aldrich, St. Louis, MO). The column was washed with water (5ml) and amino acids were eluted with 4N ammonium hydroxide. The eluate was dried and the residue was derivatized with 80μl of MTBSTFA with 1% TBDMS (Restek, Bellefonte, PA) at 80°C for 4h. Samples were centrifuged at 10,000xg for 10 min and the sample (65µl) was transferred into a GC vial for analysis. The N-silyl derivatives of amino acids were analyzed using GC-MS. Under electron ionization, ions were monitored in scan mode from 50 to 500 m/z and spectra were recorded at an isolation width of 1 m/z and normalized collision energy of 35%. Amino acid concentrations were quantified using the area under the curve (AUC) of the sample and the corresponding AUC of spiked internal standard amino acids as follows: 260(M0) and 264(M+4) for alanine, 418(M0) and 421(M+3) for aspartate, 342 (M0) and 347 (M+5) for glutamate, 246(M0) and 248(M+2) for glycine, 302(M0) and 308(M+6) for isoleucine, 274(M0) and 284(M+10) for leucine, 320(M0) and 323(M+3) for methionine, 336(M0) and 341 (M+5) for phenylalanine, 286(M0) and 289 (M+3) for proline, 390(M0) and 393 (M+3) for serine, 404(M0) and 406(M+2) for threonine, and 288(M0) and 296(M+8) for valine.
Quantitative real-time PCR
Real time PCR for expression of SLC7A5 was performed as described by us with minor modifications(Davuluri et al., 2016b). In brief, relative gene expression was normalized to two references genes (β-actin, α-tubulin), in accordance with the MIQE guidelines (Bustin et al., 2009). RNA sequencing data was evaluated to determine changes in reference genes (β-actin, α-tubulin) and showed only small changes in β-actin and no changes in α-tubulin with either CH or PIH compared to N. To determine experimentally if the mRNA expression of these 2 reference genes remained constant under hypoxic conditions, total RNA was extracted, reverse transcribed and subjected to real time PCR. The CT values generated from serial dilutions were then plotted for N, PIH and CH. Experimentally, no changes were noted between N and PIH with a small change with CH for β-actin and no change in α-tubulin. Two sets of primers were generated for β-actin were tested to determine if the small changes observed during CH were consistent. Data from the primer #1 (product size 200bp) was used since both primer sets yielded similar results and the larger product size allowed for less non-specific amplification. These CT values for 2 reference genes (β-actin, α-tubulin) were then averaged together and used to normalize SLC7A5 expression. The primer sequences included: SLC7A5: forward 5’-GTCTTCGCCACCTACTTGCT-3’ (annealing temperature 60.0, GC content 55%) and reverse 5’-AGGTTGGACGCATCACCTTG-3’ (annealing temperature 60.6, GC content 55%). Expected size: 242 bp. NCBI Reference Sequence: NM_011404.3. β actin primer #1: forward: 5’-ATGCCACAGGATTCCATACC −3’ (annealing temperature 57.3, GC content 50.0%) and reverse 5’-ATCGTGCGTGACATCAAAGA-3’ (annealing temperature 57.9, GC content 45.0%). Expected size: 200 bp. NCBI Reference Sequence: NM_007393.5. β actin primer #2: forward 5’-AGCCACTGTCGAGTCGCGTCC-3’ (annealing temperature 66.9, GC content 66.7%) and reverse 5’-GTCATCCATGGCGAACTGGTGGC-3’ (annealing temperature 66.3, GC content 60.9%). Expected size: 93 bp. NCBI Reference Sequence: NM_007393.5. α tubulin: forward: 5’-CCGCGAAGCAGCAACCAT-3’ (annealing temperature 61.4, GC content 61.1%) and reverse 5’-CCAGGTCTACGAACACTGCC-3’ (annealing temperature 60.4, GC content 60.0%). NCBI Reference Sequence: NM_011653.2. Expected size: 227 bp. Real-time PCR products were separated by gel electrophoresis to confirm specific product presence and size (Supplementary Figure 2).
Immunoblot analysis
Protein extraction and immunoblots were performed using methods previously described(Qiu et al., 2012). C2C12 myotubes were differentiated for 48h and underwent 72h of normoxia or hypoxia protocols followed by protein extraction using RIPA buffer. After quantifying the concentration using a bicinchoninic acid assay, protein samples were denatured on Laemmli buffer and separated by gel electrophoresis as previously described(Davuluri et al., 2016b). Proteins were then electrotransferred onto PVDF membranes (Bio-Rad, Hercules, CA, USA) and incubated with their appropriate primary and secondary antibodies (Cell Signaling Technologies, Danvers, MA, USA). Protein synthesis was determined by antipuromycin antibody (Millipore, at 1:10,000 dilution), phosphorylated mTORC1Ser2448 (CST, at 1:2000 dilution) and total mTORC1 (CST, at 1:10,000 dilution), phosphorylated P70s6KThr389 (CST, at 1:2000 dilution) and total P70S6K (CST, at 1:10,000 dilution), phosphorylated RiboS6Ser240/244 (CST, at 1:2000 dilution) and total RiboS6 protein (CST, at 1:10,000 dilution), and phosphorylated 4E-BP1Thr37/45 (CST, at 1:2000 dilution) and total 4E-BP1 protein (CST, at 1:10,000 dilution). Endoplasmic reticulum (ER) stress was measured by phosphorylation of eIF2αSer51 (CST, at 1:2000 dilution) over total eIF2α (CST, at 1:10,000 dilution), phosphorylation of GCN2Thr899 (Bios, at 1:1000 dilution) over total GCN2 (CST, at 1:10,000 dilution), and also mobility shift of Protein kinase R–like endoplasmic reticulum kinase (PERK) (CST, at 1:2000 dilution) as compared to Thapsigargin (TG), a known ER stress inducer which serves as a positive control. For the positive control, myotubes were differentiated for 48h and treated with Thapsigargin (10mM) for 3h or 6h. HIF1α (CST, at 1:1000 dilution) and HIF2α (R&D, at 1:2000 dilution) were measured in myotubes that were harvested when hypoxic, otherwise all other samples were harvested when normoxic. For a positive control for HIF1α, C2C12 cells were treated with 200 μM of cobalt. Immunoblotting for the expression of the ribosomal proteins RPL5 (CST, at 1:2000 dilution), RPL23 (GeneTex, at 1:2000 dilution), and RPL32 (GeneTex, at 1:200 dilution) were performed. Mitochondrial content was quantified by immunoblots for citrate synthase (CST, at 1:2000 dilution) and voltage dependent anion channel (VDAC) (CST, at 1:2000 dilution) in myotubes. Mitochondrial markers of fission were probed with phosphorylated DRP1Ser616 (CST, at 1:2000 dilution), phosphorylated DRP1Ser637 (CST, at 1:2000 dilution), and total DRP1 (CST, at 1:2000 dilution). Mitochondrial markers of fusion were probed with immunoblots for MFN1 (Proteintech, at 1:2000 dilution), MFN2 (Proteintech, at 1:2000 dilution), and OPA1 (CST, at 1:2000 dilution). Senescence-associated markers including phosphorylation of P53Ser15 (CST, at 1:2000 dilution) over total P53 (CST, at 1:5000 dilution) was performed. Expression of β-actin (Santa Cruz Biotech., at 1:5000 dilution) was used to confirm equal loading of protein for all immunoblot assays. Membranes were then washed in Tris-buffered saline with Tween 20 (TBST) followed by incubation with appropriate secondary antibodies (1:10,000 dilution). All data mean±SD from at least 3 biological replicates. Uncropped and unedited immunoblots are provided in Supplementary Figure 3. Details on measurements of mitochondrial morphology are included in Supplementary Figure 4.
Quantitative assay for β-galactosidase
Fluorometric assay to quantify senescence-associated β-galactosidase activity in myotubes. Myotubes were treated with lysis buffer consisting of 5 mM 3(3-cholamidopropyl)dimethylammonio)-1-propane sulfate, 40 mM citric acid, 40 mM sodium phosphate, 0.5 mM benzamide and 0.25 phenylmethylsulfonyl fluoride. Lysate was vortexed vigorously and centrifuged at 12,000g for 5 min at 4°C. The supernatant was mixed with an equal volume (150 μL) of 2x reaction buffer (40 mM citric acid, 40 mM sodium phosphate, 300 mM sodium chloride, 10 mM β-mercaptoethanol, 4 mM magnesium chloride, 1.7 mM 4-methylumbelliferyl-d-galactopyranoside in water). 50 μL of this reaction mixture was added to 500 μL of 400 mM sodium bicarbonate stop solution. Fluorescence readings were obtained with an excitation at 360 nm and emission at 465 nm on a PerkinElmer plate reader (model 1420–050) and data expressed as RFU/μg protein.
Ex-vivo protein synthesis.
An ex vivo method to measure skeletal muscle protein synthesis was used. Approximately 5 mg of fresh gastrocnemius muscle was incubated in 10 ml of DMEM with 1mM puromycin with oxygen bubbling into the medium continuously. After a precisely documented time of 30 min incubation, muscle tissue was washed in cold PBS, frozen in liquid nitrogen and stored at −80° C for subsequent protein extraction and immunoblotting for quantifying puromycin incorporation.
Statistical analyses
All cellular experimental data were generated from at least three biologically independent experiments. Data were expressed as mean ± standard deviation of the mean, and means were compared using analysis of variance with Tukey HSD post hoc analyses for quantitative data that were normally distributed. Differences were considered statistically significant at a p value < 0.05. All statistical details are included in the Statistical Summary Document.
Supplementary Material
Figure 5. Enriched processes in RNA sequencing from myotubes during prolonged intermittent hypoxia.

RNA sequencing performed in differentiated murine C2C12 myotubes during normoxia (N) and prolonged intermittent hypoxia (PIH with 3 cycles of 8h hypoxia/16h normoxia). Pathways enriched in: A, B. Differentially expressed genes (DEGs) with decreased or increased expression in PIH vs. N using GO (gene ontology):BP (biological process), GO:CC (cellular component), GO:MF (molecular function), Kyoto Encyclopedia of Genes and Genomes (KEGG) and REACTOME (database focused on biologic processes, intermediary metabolism, signal transduction of cell cycle). All experiments were done in n=3 biological replicates. Significance for DEGs was set at p<0.05 (Student’s t-test with Benjamini-Hotchberg correction).
Figure 6. Enriched processes in RNA sequencing from myotubes during chronic hypoxia.

RNA sequencing performed in differentiated murine C2C12 myotubes during normoxia (N) and chronic hypoxia (CH) over 72 h. Pathways enriched in: A, B. Differentially expressed genes (DEGs) with decreased or increased expression in CH vs. N using GO (gene ontology):BP (biological process), GO:CC (cellular component), GO:MF (molecular function), Kyoto Encyclopedia of Genes and Genomes (KEGG) and REACTOME (database focused on biologic processes, intermediary metabolism, signal transduction of cell cycle). All experiments were done in n=3 biological replicates. Significance for DEGs was set at p<0.05 (Student’s t-test with Benjamini-Hotchberg correction).
Key points.
Sarcopenia or skeletal muscle loss is one of the most frequent complications that contributes to mortality and morbidity in patients with chronic obstructive pulmonary disease (COPD).
Unlike chronic hypoxia, prolonged intermittent hypoxia is a frequent, underappreciated and clinically relevant model of hypoxia in patients with COPD.
We developed a novel, in vitro myotube model of prolonged intermittent hypoxia with molecular and metabolic perturbations, mitochondrial oxidative dysfunction and consequent sarcopenic phenotype.
In vivo studies in skeletal muscle from a mouse model of COPD shared responses with our myotube model establishing pathophysiological relevance of our studies.
These data lay the foundation for translational studies in human COPD to target prolonged, nocturnal hypoxemia to prevent sarcopenia in these patients.
Supported in part by:
NIH RO1 GM119174; RO1 DK113196; P50 AA024333; RO1 AA021890; 3U01AA026976 - 03S1; UO1 AA 026976; R56HL141744;UO1 DK061732; 5U01DK062470-17S2; R21 AR 071046; Howard and Helen Trevey Endowment; (SD); K12 HL141952 (AA) and the American College of Gastroenterology Clinical Research Award and NIH KO8 AAAA028794 (NW).
Abbreviations:
- OSA
obstructive sleep apnea
- COPD
chronic obstructive pulmonary disease
- HIF
hypoxia-inducible factor
- ETC
electron transport chain
- PIH
prolonged intermittent hypoxia
- CH
chronic hypoxia
- ROS
reactive oxygen species
- TCA
tricarboxylic acid cycle
Biography

Amy Attaway MD is a physician scientist who seeks to study the mechanisms of sarcopenia, or skeletal muscle loss, due to COPD (chronic obstructive pulmonary disease). Using in vitro models of skeletal muscle in addition to human and mouse samples, her goal is to further characterize the molecular mechanisms that cause sarcopenia in COPD with a focus on dysregulated HIF1α signaling due to prolonged intermittent hypoxia. She studies these mechanisms in the laboratory of Dr. Dasarathy, a leader in the field of muscle loss in chronic disease.
Footnotes
Competing interests. All authors disclose that they have no competing interests in accordance with journal policy.
No other conflicts of interest
Data Availability Statement.
The data generated and analyzed in this study are available from the corresponding author on request. All data (n>30) is included as supplementary data or deposited in an on-line repository (https://github.com/dasaraslab/Unbiased).
References.
- Abramov AY, Scorziello A & Duchen MR. (2007). Three Distinct Mechanisms Generate Oxygen Free Radicals in Neurons and Contribute to Cell Death during Anoxia and Reoxygenation. The Journal of Neuroscience 27, 1129–1138. [DOI] [PMC free article] [PubMed] [Google Scholar]
- Akinbiyi EO, Abramowitz LK, Bauer BL, Stoll MSK, Hoppel CL, Hsiao CP, Hanover JA & Mears JA. (2021). Blocked O-GlcNAc cycling alters mitochondrial morphology, function, and mass. Sci Rep 11, 22106. [DOI] [PMC free article] [PubMed] [Google Scholar]
- Arighi CN, Drabkin H, Christie KR, Ross KE & Natale DA. (2017). Tutorial on Protein Ontology Resources. Methods Mol Biol 1558, 57–78. [DOI] [PMC free article] [PubMed] [Google Scholar]
- Bakare AB, Daniel J, Stabach J, Rojas A, Bell A, Henry B & Iyer S. (2021). Quantifying Mitochondrial Dynamics in Patient Fibroblasts with Multiple Developmental Defects and Mitochondrial Disorders. International Journal of Molecular Sciences 22, 6263. [DOI] [PMC free article] [PubMed] [Google Scholar]
- Barnes PJ. (2016). Sex Differences in Chronic Obstructive Pulmonary Disease Mechanisms. Am J Respir Crit Care Med 193, 813–814. [DOI] [PubMed] [Google Scholar]
- Bartoszewski R, Moszyńska A, Serocki M, Cabaj A, Polten A, Ochocka R, Dell’Italia L, Bartoszewska S, Króliczewski J, Dąbrowski M & Collawn JF. (2019). Primary endothelial cell-specific regulation of hypoxia-inducible factor (HIF)-1 and HIF-2 and their target gene expression profiles during hypoxia. Faseb j 33, 7929–7941. [DOI] [PMC free article] [PubMed] [Google Scholar]
- Bisbach CM, Hass DT, Robbings BM, Rountree AM, Sadilek M, Sweet IR & Hurley JB. (2020). Succinate Can Shuttle Reducing Power from the Hypoxic Retina to the O(2)-Rich Pigment Epithelium. Cell Rep 31, 107606. [DOI] [PMC free article] [PubMed] [Google Scholar]
- Bustin SA, Benes V, Garson JA, Hellemans J, Huggett J, Kubista M, Mueller R, Nolan T, Pfaffl MW, Shipley GL, Vandesompele J & Wittwer CT. (2009). The MIQE guidelines: minimum information for publication of quantitative real-time PCR experiments. Clin Chem 55, 611–622. [DOI] [PubMed] [Google Scholar]
- Cabrera ME, Saidel GM & Kalhan SC. (1999). A model analysis of lactate accumulation during muscle ischemia. J Crit Care 14, 151–163. [DOI] [PubMed] [Google Scholar]
- Caron MA, Thériault ME, Paré ME, Maltais F & Debigaré R. (2009). Hypoxia alters contractile protein homeostasis in L6 myotubes. FEBS Lett 583, 1528–1534. [DOI] [PubMed] [Google Scholar]
- Ceelen JJM, Schols AMWJ, Kneppers AEM, Rosenbrand RPHA, Drożdż MM, van Hoof SJ, de Theije CC, Kelders MCJM, Verhaegen F & Langen RCJ. (2018). Altered protein turnover signaling and myogenesis during impaired recovery of inflammation-induced muscle atrophy in emphysematous mice. Scientific Reports 8, 10761. [DOI] [PMC free article] [PubMed] [Google Scholar]
- Chaouat A, Weitzenblum E, Kessler R, Charpentier C, Ehrhart M, Levi-Valensi P, Zielinski J, Delaunois L, Cornudella R & Moutinho dos Santos J. (1997). Sleep-related O2 desaturation and daytime pulmonary haemodynamics in COPD patients with mild hypoxaemia. Eur Respir J 10, 1730–1735. [DOI] [PubMed] [Google Scholar]
- Chaouat A, Weitzenblum E, Kessler R, Charpentier C, Enrhart M, Schott R, Levi-Valensi P, Zielinski J, Delaunois L, Cornudella R & Moutinho dos Santos J. (1999). A randomized trial of nocturnal oxygen therapy in chronic obstructive pulmonary disease patients. Eur Respir J 14, 1002–1008. [DOI] [PubMed] [Google Scholar]
- Chen LD, Wu RH, Huang YZ, Chen MX, Zeng AM, Zhuo GF, Xu FS, Liao R & Lin QC. (2020a). The role of ferroptosis in chronic intermittent hypoxia-induced liver injury in rats. Sleep Breath 24, 1767–1773. [DOI] [PubMed] [Google Scholar]
- Chen X, Yu C, Kang R & Tang D. (2020b). Iron Metabolism in Ferroptosis. Frontiers in Cell and Developmental Biology 8. [DOI] [PMC free article] [PubMed] [Google Scholar]
- Chinopoulos C. (2013). Which way does the citric acid cycle turn during hypoxia? The critical role of alpha-ketoglutarate dehydrogenase complex. J Neurosci Res 91, 1030–1043. [DOI] [PubMed] [Google Scholar]
- Chouchani ET, Pell VR, Gaude E, Aksentijević D, Sundier SY, Robb EL, Logan A, Nadtochiy SM, Ord ENJ, Smith AC, Eyassu F, Shirley R, Hu CH, Dare AJ, James AM, Rogatti S, Hartley RC, Eaton S, Costa ASH, Brookes PS, Davidson SM, Duchen MR, Saeb-Parsy K, Shattock MJ, Robinson AJ, Work LM, Frezza C, Krieg T & Murphy MP. (2014). Ischaemic accumulation of succinate controls reperfusion injury through mitochondrial ROS. Nature 515, 431–435. [DOI] [PMC free article] [PubMed] [Google Scholar]
- Clanton TL & Klawitter PF. (2001). Invited review: Adaptive responses of skeletal muscle to intermittent hypoxia: the known and the unknown. J Appl Physiol (1985) 90, 2476–2487. [DOI] [PubMed] [Google Scholar]
- Cohen EB, Geck RC & Toker A. (2020). Metabolic pathway alterations in microvascular endothelial cells in response to hypoxia. PLoS One 15, e0232072. [DOI] [PMC free article] [PubMed] [Google Scholar]
- Costa-Mattioli M & Walter P. (2020). The integrated stress response: From mechanism to disease. Science 368. [DOI] [PMC free article] [PubMed] [Google Scholar]
- Cribbs JT & Strack S. (2007). Reversible phosphorylation of Drp1 by cyclic AMP-dependent protein kinase and calcineurin regulates mitochondrial fission and cell death. EMBO Rep 8, 939–944. [DOI] [PMC free article] [PubMed] [Google Scholar]
- Dasarathy S & Hatzoglou M. (2018). Hyperammonemia and proteostasis in cirrhosis. Current opinion in clinical nutrition and metabolic care 21, 30. [DOI] [PMC free article] [PubMed] [Google Scholar]
- Davuluri G, Allawy A, Thapaliya S, Rennison JH, Singh D, Kumar A, Sandlers Y, Van Wagoner DR, Flask CA, Hoppel C, Kasumov T & Dasarathy S. (2016a). Hyperammonaemia-induced skeletal muscle mitochondrial dysfunction results in cataplerosis and oxidative stress. Journal of Physiology 594, 7341–7360. [DOI] [PMC free article] [PubMed] [Google Scholar]
- Davuluri G, Krokowski D, Guan B-J, Kumar A, Thapaliya S, Singh D, Hatzoglou M & Dasarathy S. (2016b). Metabolic adaptation of skeletal muscle to hyperammonemia drives the beneficial effects of l-leucine in cirrhosis. Journal of hepatology 65, 929–937. [DOI] [PMC free article] [PubMed] [Google Scholar]
- Davuluri G, Welch N, Sekar J, Gangadhariah M, Alsabbagh Alchirazi K, Mohan ML, Kumar A, Kant S, Thapaliya S, Stine M, McMullen MR, McCullough RL, Stark GR, Nagy LE, Naga Prasad SV & Dasarathy S. (2021). Activated Protein Phosphatase 2A Disrupts Nutrient Sensing Balance Between Mechanistic Target of Rapamycin Complex 1 and Adenosine Monophosphate-Activated Protein Kinase, Causing Sarcopenia in Alcohol-Associated Liver Disease. Hepatology 73, 1892–1908. [DOI] [PMC free article] [PubMed] [Google Scholar]
- Des Rosiers C, Labarthe F, Lloyd SG & Chatham JC. (2011). Cardiac anaplerosis in health and disease: food for thought. Cardiovasc Res 90, 210–219. [DOI] [PMC free article] [PubMed] [Google Scholar]
- Dewan NA, Nieto FJ & Somers VK. (2015). Intermittent hypoxemia and OSA: implications for comorbidities. Chest 147, 266–274. [DOI] [PMC free article] [PubMed] [Google Scholar]
- Dlasková A, Špaček T, Engstová H, Špačková J, Schröfel A, Holendová B, Smolková K, Plecitá-Hlavatá L & Ježek P. (2019). Mitochondrial cristae narrowing upon higher 2-oxoglutarate load. Biochim Biophys Acta Bioenerg 1860, 659–678. [DOI] [PubMed] [Google Scholar]
- Doll S, Proneth B, Tyurina YY, Panzilius E, Kobayashi S, Ingold I, Irmler M, Beckers J, Aichler M, Walch A, Prokisch H, Trumbach D, Mao G, Qu F, Bayir H, Fullekrug J, Scheel CH, Wurst W, Schick JA, Kagan VE, Angeli JP & Conrad M. (2017). ACSL4 dictates ferroptosis sensitivity by shaping cellular lipid composition. Nat Chem Biol 13, 91–98. [DOI] [PMC free article] [PubMed] [Google Scholar]
- Duan C, Kuang L, Xiang X, Zhang J, Zhu Y, Wu Y, Yan Q, Liu L & Li T. (2020). Drp1 regulates mitochondrial dysfunction and dysregulated metabolism in ischemic injury via Clec16a-, BAX-, and GSH- pathways. Cell Death Dis 11, 251. [DOI] [PMC free article] [PubMed] [Google Scholar]
- Elgenaidi IS & Spiers JP. (2019). Hypoxia modulates protein phosphatase 2A through HIF-1α dependent and independent mechanisms in human aortic smooth muscle cells and ventricular cardiomyocytes. Br J Pharmacol 176, 1745–1763. [DOI] [PMC free article] [PubMed] [Google Scholar]
- Fabregat A, Jupe S, Matthews L, Sidiropoulos K, Gillespie M, Garapati P, Haw R, Jassal B, Korninger F, May B, Milacic M, Roca CD, Rothfels K, Sevilla C, Shamovsky V, Shorser S, Varusai T, Viteri G, Weiser J, Wu G, Stein L, Hermjakob H & D’Eustachio P. (2018). The Reactome Pathway Knowledgebase. Nucleic Acids Res 46, D649–D655. [DOI] [PMC free article] [PubMed] [Google Scholar]
- Fähling M. (2009). Surviving hypoxia by modulation of mRNA translation rate. J Cell Mol Med 13, 2770–2779. [DOI] [PMC free article] [PubMed] [Google Scholar]
- Favier FB, Britto FA, Freyssenet DG, Bigard XA & Benoit H. (2015). HIF-1-driven skeletal muscle adaptations to chronic hypoxia: molecular insights into muscle physiology. Cell Mol Life Sci 72, 4681–4696. [DOI] [PMC free article] [PubMed] [Google Scholar]
- Fitzgerald E, Roberts J, Tennant DA, Boardman JP & Drake AJ. (2021). Metabolic adaptations to hypoxia in the neonatal mouse forebrain can occur independently of the transporters SLC7A5 and SLC3A2. Sci Rep 11, 9092. [DOI] [PMC free article] [PubMed] [Google Scholar]
- Fletcher EC, Donner CF, Midgren B, Zielinski J, Levi-Valensi P, Braghiroli A, Rida Z & Miller CC. (1992a). Survival in COPD patients with a daytime PaO2 greater than 60 mm Hg with and without nocturnal oxyhemoglobin desaturation. Chest 101, 649–655. [DOI] [PubMed] [Google Scholar]
- Fletcher EC, Luckett RA, Goodnight-White S, Miller CC, Qian W & Costarangos-Galarza C. (1992b). A double-blind trial of nocturnal supplemental oxygen for sleep desaturation in patients with chronic obstructive pulmonary disease and a daytime PaO2 above 60 mm Hg. Am Rev Respir Dis 145, 1070–1076. [DOI] [PubMed] [Google Scholar]
- Fletcher EC, Miller J, Divine GW, Fletcher JG & Miller T. (1987). Nocturnal Oxyhemoglobin Desaturation in COPD Patients with Arterial Oxygen Tensions Above 60 mm Hg. CHEST 92, 604–608. [DOI] [PubMed] [Google Scholar]
- Galili T. (2015). dendextend: an R package for visualizing, adjusting and comparing trees of hierarchical clustering. Bioinformatics 31, 3718–3720. [DOI] [PMC free article] [PubMed] [Google Scholar]
- Gingras AC, Gygi SP, Raught B, Polakiewicz RD, Abraham RT, Hoekstra MF, Aebersold R & Sonenberg N. (1999). Regulation of 4E-BP1 phosphorylation: a novel two-step mechanism. Genes Dev 13, 1422–1437. [DOI] [PMC free article] [PubMed] [Google Scholar]
- Giurgiu M, Reinhard J, Brauner B, Dunger-Kaltenbach I, Fobo G, Frishman G, Montrone C & Ruepp A. (2019). CORUM: the comprehensive resource of mammalian protein complexes-2019. Nucleic Acids Res 47, D559–D563. [DOI] [PMC free article] [PubMed] [Google Scholar]
- Grundy D. (2015). Principles and standards for reporting animal experiments in The Journal of Physiology and Experimental Physiology. J Physiol 593, 2547–2549. [DOI] [PMC free article] [PubMed] [Google Scholar]
- Guigni BA, Fix DK, Bivona JJ 3rd, Palmer BM, Carson JA & Toth MJ. (2019). Electrical stimulation prevents doxorubicin-induced atrophy and mitochondrial loss in cultured myotubes. Am J Physiol Cell Physiol 317, C1213–c1228. [DOI] [PMC free article] [PubMed] [Google Scholar]
- Guo X, Badu-Mensah A, Thomas MC, McAleer CW & Hickman JJ. (2020). Characterization of Functional Human Skeletal Myotubes and Neuromuscular Junction Derived-From the Same Induced Pluripotent Stem Cell Source. Bioengineering (Basel) 7. [DOI] [PMC free article] [PubMed] [Google Scholar]
- Hadrava Vanova K, Kraus M, Neuzil J & Rohlena J. (2020). Mitochondrial complex II and reactive oxygen species in disease and therapy. Redox Rep 25, 26–32. [DOI] [PMC free article] [PubMed] [Google Scholar]
- Hu CJ, Wang LY, Chodosh LA, Keith B & Simon MC. (2003). Differential roles of hypoxia-inducible factor 1alpha (HIF-1alpha) and HIF-2alpha in hypoxic gene regulation. Mol Cell Biol 23, 9361–9374. [DOI] [PMC free article] [PubMed] [Google Scholar]
- Huang HY, Lin YC, Li J, Huang KY, Shrestha S, Hong HC, Tang Y, Chen YG, Jin CN, Yu Y, Xu JT, Li YM, Cai XX, Zhou ZY, Chen XH, Pei YY, Hu L, Su JJ, Cui SD, Wang F, Xie YY, Ding SY, Luo MF, Chou CH, Chang NW, Chen KW, Cheng YH, Wan XH, Hsu WL, Lee TY, Wei FX & Huang HD. (2020). miRTarBase 2020: updates to the experimentally validated microRNA-target interaction database. Nucleic Acids Res 48, D148–D154. [DOI] [PMC free article] [PubMed] [Google Scholar]
- James JH, Luchette FA, McCarter FD & Fischer JE. (1999). Lactate is an unreliable indicator of tissue hypoxia in injury or sepsis. Lancet 354, 505–508. [DOI] [PubMed] [Google Scholar]
- Kanehisa M & Goto S. (2000). KEGG: kyoto encyclopedia of genes and genomes. Nucleic Acids Res 28, 27–30. [DOI] [PMC free article] [PubMed] [Google Scholar]
- Keith B, Johnson RS & Simon MC. (2011). HIF1α and HIF2α: sibling rivalry in hypoxic tumour growth and progression. Nat Rev Cancer 12, 9–22. [DOI] [PMC free article] [PubMed] [Google Scholar]
- Kierans SJ & Taylor CT. (2021). Regulation of glycolysis by the hypoxia-inducible factor (HIF): implications for cellular physiology. J Physiol 599, 23–37. [DOI] [PubMed] [Google Scholar]
- Knudsen L, Ochs M, Mackay R, Townsend P, Deb R, Mühlfeld C, Richter J, Gilbert F, Hawgood S, Reid K & Clark H. (2007). Truncated recombinant human SP-D attenuates emphysema and type II cell changes in SP-D deficient mice. Respir Res 8, 70. [DOI] [PMC free article] [PubMed] [Google Scholar]
- Knudsen L, Weibel ER, Gundersen HJ, Weinstein FV & Ochs M. (2010). Assessment of air space size characteristics by intercept (chord) measurement: an accurate and efficient stereological approach. J Appl Physiol (1985) 108, 412–421. [DOI] [PubMed] [Google Scholar]
- Koumenis C, Naczki C, Koritzinsky M, Rastani S, Diehl A, Sonenberg N, Koromilas A & Wouters BG. (2002). Regulation of Protein Synthesis by Hypoxia via Activation of the Endoplasmic Reticulum Kinase PERK and Phosphorylation of the Translation Initiation Factor eIF2α. Molecular and Cellular Biology 22, 7405–7416. [DOI] [PMC free article] [PubMed] [Google Scholar]
- Kumar A, Davuluri G, Welch N, Kim A, Gangadhariah M, Allawy A, Priyadarshini A, McMullen MR, Sandlers Y, Willard B, Hoppel CL, Nagy LE & Dasarathy S. (2019). Oxidative stress mediates ethanol-induced skeletal muscle mitochondrial dysfunction and dysregulated protein synthesis and autophagy. Free Radical Biology and Medicine 145, 284–299. [DOI] [PMC free article] [PubMed] [Google Scholar]
- Lacasse Y, Sériès F, Corbeil F, Baltzan M, Paradis B, Simão P, Abad Fernández A, Esteban C, Guimarães M, Bourbeau J, Aaron SD, Bernard S & Maltais F. (2020). Randomized Trial of Nocturnal Oxygen in Chronic Obstructive Pulmonary Disease. New England Journal of Medicine 383, 1129–1138. [DOI] [PubMed] [Google Scholar]
- Lacasse Y, Tan AM, Maltais F & Krishnan JA. (2018). Home Oxygen in Chronic Obstructive Pulmonary Disease. Am J Respir Crit Care Med 197, 1254–1264. [DOI] [PubMed] [Google Scholar]
- Liberzon A, Birger C, Thorvaldsdottir H, Ghandi M, Mesirov JP & Tamayo P. (2015). The Molecular Signatures Database (MSigDB) hallmark gene set collection. Cell Syst 1, 417–425. [DOI] [PMC free article] [PubMed] [Google Scholar]
- Liu L, Cash TP, Jones RG, Keith B, Thompson CB & Simon MC. (2006). Hypoxia-induced energy stress regulates mRNA translation and cell growth. Mol Cell 21, 521–531. [DOI] [PMC free article] [PubMed] [Google Scholar]
- Liu Y, Wu P, Zhou J, Johnson-Pais TL, Lai Z, Chowdhury WH, Rodriguez R & Chen Y. (2017). XBSeq2: a fast and accurate quantification of differential expression and differential polyadenylation. BMC Bioinformatics 18, 384. [DOI] [PMC free article] [PubMed] [Google Scholar]
- Liu YJ, McIntyre RL, Janssens GE & Houtkooper RH. (2020). Mitochondrial fission and fusion: A dynamic role in aging and potential target for age-related disease. Mechanisms of Ageing and Development 186, 111212. [DOI] [PubMed] [Google Scholar]
- Majmundar AJ, Skuli N, Mesquita RC, Kim MN, Yodh AG, Nguyen-McCarty M & Simon MC. (2012). O(2) regulates skeletal muscle progenitor differentiation through phosphatidylinositol 3-kinase/AKT signaling. Mol Cell Biol 32, 36–49. [DOI] [PMC free article] [PubMed] [Google Scholar]
- Marin Trigo JM, Marin-Oto M, de Torres JP, Cabrera C, Solanes I, Martinez C, Toledo N, Peces-Barba G, Amado C, Vigil L & Casanova C. (2017). Nocturnal hypoxaemia in COPD. Prevalence and clinical characteristics. European Respiratory Journal 50, PA3640. [Google Scholar]
- Martin NRW, Aguilar-Agon K, Robinson GP, Player DJ, Turner MC, Myers SD & Lewis MP. (2017). Hypoxia Impairs Muscle Function and Reduces Myotube Size in Tissue Engineered Skeletal Muscle. Journal of Cellular Biochemistry 118, 2599–2605. [DOI] [PMC free article] [PubMed] [Google Scholar]
- Martinez-Reyes I & Chandel NS. (2020). Mitochondrial TCA cycle metabolites control physiology and disease. Nat Commun 11, 102. [DOI] [PMC free article] [PubMed] [Google Scholar]
- Mueller Pde T, Gomes MD, Viegas CA & Neder JA. (2008). Systemic effects of nocturnal hypoxemia in patients with chronic obstructive pulmonary disease without obstructive sleep apnea syndrome. J Bras Pneumol 34, 567–574. [DOI] [PubMed] [Google Scholar]
- Nakao A, Yoshihama M & Kenmochi N. (2004). RPG: the Ribosomal Protein Gene database. Nucleic Acids Res 32, D168–170. [DOI] [PMC free article] [PubMed] [Google Scholar]
- Neubauer JA. (2001). Invited review: Physiological and pathophysiological responses to intermittent hypoxia. J Appl Physiol (1985) 90, 1593–1599. [DOI] [PubMed] [Google Scholar]
- Nikonorova IA, Mirek ET, Signore CC, Goudie MP, Wek RC & Anthony TG. (2018). Time-resolved analysis of amino acid stress identifies eIF2 phosphorylation as necessary to inhibit mTORC1 activity in liver. J Biol Chem 293, 5005–5015. [DOI] [PMC free article] [PubMed] [Google Scholar]
- Noh BK, Lee JK, Jun HJ, Lee JH, Jia Y, Hoang MH, Kim JW, Park KH & Lee SJ. (2011). Restoration of autophagy by puerarin in ethanol-treated hepatocytes via the activation of AMP-activated protein kinase. Biochem Biophys Res Commun 414, 361–366. [DOI] [PubMed] [Google Scholar]
- Novack GV, Galeano P, Castaño EM & Morelli L. (2020). Mitochondrial Supercomplexes: Physiological Organization and Dysregulation in Age-Related Neurodegenerative Disorders. Front Endocrinol (Lausanne) 11, 600. [DOI] [PMC free article] [PubMed] [Google Scholar]
- Okur HK, Pelin Z, Yuksel M & Yosunkaya S. (2013). Lipid peroxidation and paraoxonase activity in nocturnal cyclic and sustained intermittent hypoxia. Sleep Breath 17, 365–371. [DOI] [PubMed] [Google Scholar]
- Okura K, Kawagoshi A, Iwakura M, Sugawara K, Takahashi H, Kashiwagura T, Homma M, Satake M & Shioya T. (2017). Contractile capability of the diaphragm assessed by ultrasonography predicts nocturnal oxygen saturation in COPD. Respirology 22, 301–306. [DOI] [PubMed] [Google Scholar]
- Onishi Y, Hiraiwa M, Kamada H, Iezaki T, Yamada T, Kaneda K & Hinoi E. (2019). Hypoxia affects Slc7a5 expression through HIF-2α in differentiated neuronal cells. FEBS Open Bio 9, 241–247. [DOI] [PMC free article] [PubMed] [Google Scholar]
- Perkins G, Hsiao YH, Yin S, Tjong J, Tran MT, Lau J, Xue J, Liu S, Ellisman MH & Zhou D. (2012). Ultrastructural modifications in the mitochondria of hypoxia-adapted Drosophila melanogaster. PLoS One 7, e45344. [DOI] [PMC free article] [PubMed] [Google Scholar]
- Qiu J, Thapaliya S, Runkana A, Yang Y, Tsien C, Mohan ML, Narayanan A, Eghtesad B, Mozdziak PE, McDonald C, Stark GR, Welle S, Naga Prasad SV & Dasarathy S. (2013). Hyperammonemia in cirrhosis induces transcriptional regulation of myostatin by an NF-kappaB-mediated mechanism. Proc Natl Acad Sci U S A 110, 18162–18167. [DOI] [PMC free article] [PubMed] [Google Scholar]
- Qiu J, Tsien C, Thapalaya S, Narayanan A, Weihl CC, Ching JK, Eghtesad B, Singh K, Fu X, Dubyak G, McDonald C, Almasan A, Hazen SL, Naga Prasad SV & Dasarathy S. (2012). Hyperammonemia-mediated autophagy in skeletal muscle contributes to sarcopenia of cirrhosis. Am J Physiol Endocrinol Metab 303, E983–993. [DOI] [PMC free article] [PubMed] [Google Scholar]
- Rafelski SM. (2013). Mitochondrial network morphology: building an integrative, geometrical view. BMC Biology 11, 71. [DOI] [PMC free article] [PubMed] [Google Scholar]
- Rahar B, Chawla S, Pandey S, Bhatt AN & Saxena S. (2018). Sphingosine-1-phosphate pretreatment amends hypoxia-induced metabolic dysfunction and impairment of myogenic potential in differentiating C2C12 myoblasts by stimulating viability, calcium homeostasis and energy generation. J Physiol Sci 68, 137–151. [DOI] [PMC free article] [PubMed] [Google Scholar]
- Rath S, Sharma R, Gupta R, Ast T, Chan C, Durham TJ, Goodman RP, Grabarek Z, Haas ME, Hung WHW, Joshi PR, Jourdain AA, Kim SH, Kotrys AV, Lam SS, McCoy JG, Meisel JD, Miranda M, Panda A, Patgiri A, Rogers R, Sadre S, Shah H, Skinner OS, To TL, Walker MA, Wang H, Ward PS, Wengrod J, Yuan CC, Calvo SE & Mootha VK. (2021). MitoCarta3.0: an updated mitochondrial proteome now with sub-organelle localization and pathway annotations. Nucleic Acids Res 49, D1541–D1547. [DOI] [PMC free article] [PubMed] [Google Scholar]
- Raudvere U, Kolberg L, Kuzmin I, Arak T, Adler P, Peterson H & Vilo J. (2019). g:Profiler: a web server for functional enrichment analysis and conversions of gene lists (2019 update). Nucleic Acids Res 47, W191–W198. [DOI] [PMC free article] [PubMed] [Google Scholar]
- Rommel C, Bodine SC, Clarke BA, Rossman R, Nunez L, Stitt TN, Yancopoulos GD & Glass DJ. (2001). Mediation of IGF-1-induced skeletal myotube hypertrophy by PI(3)K/Akt/mTOR and PI(3)K/Akt/GSK3 pathways. Nature Cell Biology 3, 1009–1013. [DOI] [PubMed] [Google Scholar]
- Rozpedek W, Pytel D, Mucha B, Leszczynska H, Diehl JA & Majsterek I. (2016). The Role of the PERK/eIF2α/ATF4/CHOP Signaling Pathway in Tumor Progression During Endoplasmic Reticulum Stress. Curr Mol Med 16, 533–544. [DOI] [PMC free article] [PubMed] [Google Scholar]
- Saxena K & Jolly MK. (2019). Acute vs. Chronic vs. Cyclic Hypoxia: Their Differential Dynamics, Molecular Mechanisms, and Effects on Tumor Progression. Biomolecules 9. [DOI] [PMC free article] [PubMed] [Google Scholar]
- Schneider CA, Rasband WS & Eliceiri KW. (2012). NIH Image to ImageJ: 25 years of image analysis. Nat Methods 9, 671–675. [DOI] [PMC free article] [PubMed] [Google Scholar]
- Semenza GL. (2012). Hypoxia-inducible factors in physiology and medicine. Cell 148, 399–408. [DOI] [PMC free article] [PubMed] [Google Scholar]
- Singh SS, Kumar A, Welch N, Sekar J, Mishra S, Bellar A, Gangadhariah M, Attaway A, Al Khafaji H, Wu X, Pathak V, Agrawal V, McMullen MR, Hornberger TA, Nagy LE, Davuluri G & Dasarathy S. (2021). Multiomics-Identified Intervention to Restore Ethanol-Induced Dysregulated Proteostasis and Secondary Sarcopenia in Alcoholic Liver Disease. Cell Physiol Biochem 55, 91–116. [DOI] [PMC free article] [PubMed] [Google Scholar]
- Slot IG, Schols AM, Vosse BA, Kelders MC & Gosker HR. (2014). Hypoxia differentially regulates muscle oxidative fiber type and metabolism in a HIF-1α-dependent manner. Cell Signal 26, 1837–1845. [DOI] [PubMed] [Google Scholar]
- Szklarczyk D, Gable AL, Lyon D, Junge A, Wyder S, Huerta-Cepas J, Simonovic M, Doncheva NT, Morris JH, Bork P, Jensen LJ & Mering CV. (2019). STRING v11: protein-protein association networks with increased coverage, supporting functional discovery in genome-wide experimental datasets. Nucleic Acids Res 47, D607–D613. [DOI] [PMC free article] [PubMed] [Google Scholar]
- Thomas LW & Ashcroft M. (2019). Exploring the molecular interface between hypoxia-inducible factor signalling and mitochondria. Cell Mol Life Sci 76, 1759–1777. [DOI] [PMC free article] [PubMed] [Google Scholar]
- Thul PJ & Lindskog C. (2018). The human protein atlas: A spatial map of the human proteome. Protein Sci 27, 233–244. [DOI] [PMC free article] [PubMed] [Google Scholar]
- Tretter L, Patocs A & Chinopoulos C. (2016). Succinate, an intermediate in metabolism, signal transduction, ROS, hypoxia, and tumorigenesis. Biochim Biophys Acta 1857, 1086–1101. [DOI] [PubMed] [Google Scholar]
- Tsien C, Davuluri G, Singh D, Allawy A, Ten Have GA, Thapaliya S, Schulze JM, Barnes D, McCullough AJ, Engelen MP, Deutz NE & Dasarathy S. (2015). Metabolic and molecular responses to leucine-enriched branched chain amino acid supplementation in the skeletal muscle of alcoholic cirrhosis. Hepatology 61, 2018–2029. [DOI] [PMC free article] [PubMed] [Google Scholar]
- Turrens JF. (2003). Mitochondrial formation of reactive oxygen species. J Physiol 552, 335–344. [DOI] [PMC free article] [PubMed] [Google Scholar]
- Vesga-Castro C, Aldazabal J, Vallejo-Illarramendi A & Paredes J. (2022). Contractile force assessment methods for in vitro skeletal muscle tissues. Elife 11. [DOI] [PMC free article] [PubMed] [Google Scholar]
- Wan YY, Zhang JF, Yang ZJ, Jiang LP, Wei YF, Lai QN, Wang JB, Xin HB & Han XJ. (2014). Involvement of Drp1 in hypoxia-induced migration of human glioblastoma U251 cells. Oncol Rep 32, 619–626. [DOI] [PubMed] [Google Scholar]
- Wang Y, Bai C, Ruan Y, Liu M, Chu Q, Qiu L, Yang C & Li B. (2019). Coordinative metabolism of glutamine carbon and nitrogen in proliferating cancer cells under hypoxia. Nat Commun 10, 201. [DOI] [PMC free article] [PubMed] [Google Scholar]
- Westermann B. (2012). Bioenergetic role of mitochondrial fusion and fission. Biochimica et Biophysica Acta (BBA) - Bioenergetics 1817, 1833–1838. [DOI] [PubMed] [Google Scholar]
- Wolff NC, Vega-Rubin-de-Celis S, Xie XJ, Castrillon DH, Kabbani W & Brugarolas J. (2011). Cell-type-dependent regulation of mTORC1 by REDD1 and the tumor suppressors TSC1/TSC2 and LKB1 in response to hypoxia. Mol Cell Biol 31, 1870–1884. [DOI] [PMC free article] [PubMed] [Google Scholar]
- Xu W, Chi L, Row BW, Xu R, Ke Y, Xu B, Luo C, Kheirandish L, Gozal D & Liu R. (2004). Increased oxidative stress is associated with chronic intermittent hypoxia-mediated brain cortical neuronal cell apoptosis in a mouse model of sleep apnea. Neuroscience 126, 313–323. [DOI] [PubMed] [Google Scholar]
- Yang CP, Yang WS, Wong YH, Wang KH, Teng YC, Chang MH, Liao KH, Nian FS, Chao CC, Tsai JW, Hwang WL, Lin MW, Tzeng TY, Wang PN, Campbell M, Chen LK, Tsai TF, Chang PC & Kung HJ. (2020). Muscle atrophy-related myotube-derived exosomal microRNA in neuronal dysfunction: Targeting both coding and long noncoding RNAs. Aging Cell 19, e13107. [DOI] [PMC free article] [PubMed] [Google Scholar]
- Ye F & Hoppel CL. (2013). Measuring oxidative phosphorylation in human skin fibroblasts. Analytical biochemistry 437, 52–58. [DOI] [PubMed] [Google Scholar]
- Yun Z, Lin Q & Giaccia AJ. (2005). Adaptive myogenesis under hypoxia. Mol Cell Biol 25, 3040–3055. [DOI] [PMC free article] [PubMed] [Google Scholar]
Associated Data
This section collects any data citations, data availability statements, or supplementary materials included in this article.
Supplementary Materials
Data Availability Statement
All unbiased data have been uploaded to publicly accessible repositories. The RNAseq data have been deposited to GitHub at https://github.com/dasaraslab/Unbiased.
Statistical significance for RNAseq DEG was considered with an FDR <0.05. Canonical pathways were determined to be significant if −log(p value) ≥1.3 for the pathway. Validation data are presented as mean ± SD and an unpaired Student’s t test was used to assess statistical significance. For the canonical pathway enrichment of IPAs, the significance values (p value of overlap with a dataset) are calculated using a right-tailed Fisher’s exact test. The significance indicates whether the percentage of DEG associated with a pathway is present in our datasets/clusters by random chance. For the IPA network analyses, a significance score is given to each network by taking the negative exponent of the right-tailed Fisher’s exact test result. The score measures the likelihood that the “network eligible” molecules that are part of a network are found within the dataset by random chance alone. For g:Profiler functional enrichment analyses, the g:SCS multiple testing correction method was used, applying a significance threshold of 0.05.
The data generated and analyzed in this study are available from the corresponding author on request. All data (n>30) is included as supplementary data or deposited in an on-line repository (https://github.com/dasaraslab/Unbiased).