Abstract
Background
Long-term studies of chronic obstructive pulmonary disease (COPD) can evaluate emphysema progression. Adjustment for differences in equipment and scanning protocols of individual CT examinations have not been studied extensively.
Purpose
To evaluate emphysema progression in current and former smokers in the COPDGene cohort over three imaging points obtained at 5-year intervals accounting for individual CT parameters.
Materials and Methods
Current and former cigarette smokers enrolled between 2008 and 2011 from the COPDGene study were prospectively followed for 10 years between 2008 and 2020. Extent of emphysema as adjusted lung density (ALD) from quantitative CT was measured at baseline and at 5- and 10-year follow-up. Linear mixed models adjusted for CT technical characteristics were constructed to evaluate emphysema progression. Mean annual changes in ALD over consecutive 5-year study periods were estimated by smoking status and baseline emphysema.
Results
Of 8431 participants at baseline (mean age, 60 years ± 9 [SD]; 3905 female participants), 4913 were at 5-year follow-up and 1544 participants were at 10-year follow-up. There were 4134 (49%) participants who were current smokers, and 4449 (53%) participants had more than trace emphysema at baseline. Current smokers with more than trace emphysema showed the largest decline in ALD, with mean annual decreases of 1.4 g/L (95% CI: 1.2, 1.5) in the first 5 years and 0.9 g/L (95% CI: 0.7, 1.2) in the second 5 years. Accounting for CT noise, field of view, and scanner model improved model fit for estimation of emphysema progression (P < .001 by likelihood ratio test).
Conclusion
Evaluation at CT of emphysema progression in the COPDGene study showed that, during the span of 10 years, participants with pre-existing emphysema who continued smoking had the largest decline in ALD. Adjusting for CT equipment and protocol factors improved these longitudinal estimates.
Clinical trial registration no. NCT00608764
© RSNA, 2023
Supplemental material is available for this article.
See the editorial by Parraga and Kirby in this issue.
Summary
Accounting for individual CT parameters, 10-year emphysema progression in the COPDGene study showed that participants with pre-existing emphysema who continued smoking had the largest decline in adjusted lung density.
Key Results
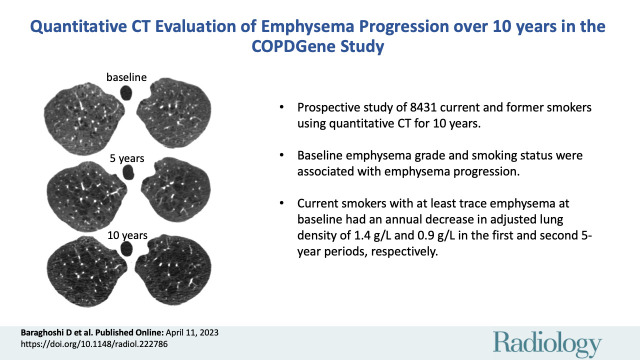
■ A prospective study of 8431 current and former smokers who underwent quantitative CT evaluation for up to 10 years showed that baseline emphysema grade and smoking status were associated with emphysema progression.
■ Current smokers with more than trace emphysema at baseline had an annual decrease in adjusted lung density of 1.4 g/L and 0.9 g/L in the first and second 5-year periods, respectively.
■ Accounting for CT noise, field of view, and scanner model improved model fit for estimating emphysema progression.
Introduction
Chronic obstructive pulmonary disease (COPD) is a chronic inflammatory lung disease that causes progressive airflow obstruction. It is the fourth most common cause of death in the United States (1) with an almost threefold increase over the last few decades.
The following three distinct morphologic components of COPD can be quantified at CT: airway wall dimensions, small airway obstruction, and emphysema (2). The quantitative extent of emphysema is associated with increased frequency of COPD exacerbation, increased risk of lung cancer, and increased likelihood of progressive airflow obstruction over time (3,4). Additionally, a previous study (5) showed that emphysema progression measured by lung density is associated with higher risk of mortality. Quantitative metrics of emphysema at CT include the percent of low attenuation areas with CT attenuation −950 HU or less, lung density at the 15th percentile of the CT histogram, and volume-adjusted lung density (ALD) at the 15th percentile. In longitudinal studies, ALD has provided the most robust metric of emphysema, and this is also supported by the Lung Density Biomarker Committee of the Quantitative Imaging Biomarkers Alliance (5–9). However, longitudinal assessment of lung density and ALD is challenging because of variation introduced by differences in CT technical characteristics and patient factors such as inconsistency in level of inspiration at scanning (6,10). These issues are challenging in long-term studies in which changes in imaging equipment and scanning protocol become inevitable. Previous longitudinal studies of emphysema have adjusted for lung volume, scanner manufacturer, and scanner model (7,11). However, adjustment for characteristics of individual CT examinations such as noise magnitude and field of view (which controls pixel size) have not been studied extensively to mitigate variations in quantitative CT and improve the fit of statistical models for assessing progression. Moreover, to our knowledge, progression of emphysema for 10 years has not been studied.
Therefore, the purpose of our analysis was to evaluate emphysema progression in current and former smokers in the cohort at three imaging points obtained at 5-year intervals accounting for individual CT parameters.
Materials and Methods
The Study
The Study is a prospective multicenter study focused on the investigation of the genetic epidemiologic structure of COPD (ClinicalTrials.gov: NCT00608764) (12). Between 2008 and 2011, 10 198 cigarette smokers with and without COPD were enrolled at 21 centers across the United States. Health Insurance Portability and Accountability Act–compliant institutional review board approval was obtained at all clinical centers, and written informed consent was obtained. The participants underwent baseline evaluation (phase 1), including chest CT (12), and 5697 participants returned for 5-year follow-up (phase 2) between 2013 and 2017 (11). A 10-year follow-up (phase 3) examination was performed in 2284 participants between 2018 and 2020.
Study Sample
Participants were excluded if they were in the never-smoker cohort, diagnosed with interstitial lung disease and/or bronchiectasis, or changed smoking status during follow-up. Participants with a change in smoking status were excluded from this analysis because smoking cessation is associated with decreased lung attenuation, which could be misinterpreted as increased emphysema (13,14). Observations following changes in the lungs that would affect quantification (eg, lobectomy, transplant, and lung parenchymal opacities) were excluded. See Appendix S1 for details of follow-up patterns in selected participants.
CT Protocol
Inspiratory axial CT acquisition included a 0.5-mm section interval, 0.625–0.75-mm section thickness, and no intravenous contrast material. Complete scanner-specific (Siemens, Philips, and GE Healthcare) protocol details for phase 1 and phase 2 were published previously (3). The mean effective radiation dose for phase 1 and 2 was 6.5 mSv ± 1 (SD), referred to as the full-dose protocol. For phase 3, the reduced radiation dose protocol was designed using dose modulation similar to the protocol recommended by Quantitative Imaging Biomarkers Alliance (8,15). Mean effective radiation dose for phase 3 was 1.5 mSv ± 0.7. To assess the effects of the reduced-dose protocol on quantitative CT metrics, informed consent was obtained from 1508 participants from phase 2 to undergo scanning with the reduced-dose protocol in addition to the full-dose protocol (Appendix S2).
Quantitative CT
Lung and lobe segmentations on full-dose and reduced-dose CT scans were performed using software (LungQ v1.0.0; Thirona). Histogram analysis was used to compute the 15th percentile of lung voxel intensity and percentage of lung voxels with attenuation less than −950 HU. The ratio of observed lung volume from CT to expected lung volume was used to adjust for variable lung volume (15,16). Expected lung volume was calculated using the equation from the Multi-Ethnic Study of Atherosclerosis lung study (17). The primary outcome for this analysis was volume-ALD, computed as previously described (11). Participants were dichotomized by baseline emphysema grade (absent or trace vs more than trace emphysema), scored using a validated deep learning method (9,18,19).
Increased CT image noise can lead to an apparent reduction in lung density at quantitative CT (15). An estimate of CT noise magnitude was calculated using an image processing method based on subtraction of adjacent axial sections (20,21) (Appendix S3).
Statistical Analysis
Progression of emphysema was estimated by fitting ALD measures using linear mixed-effects models. All available data, including up to four observations per participant (phase 1, phase 2 full dose, phase 2 reduced dose, and phase 3), were used in model fitting. An unstructured covariance matrix was used to account for correlation between repeated measures within participants. Random intercepts were included for study center and scanner model and allowed for changes in both variables within participants over time. All models included terms for study phase, smoking status, baseline deep learning emphysema grade, ethnicity (self-reported), sex (self-reported), age (baseline or time-varying), visit height, body mass index, and an indicator for full versus reduced radiation dose. Ethnicity was included in models to adjust for potential genetic differences relating to emphysema progression. Interaction terms were included to estimate change in mean ALD over time by smoking status and/or deep learning emphysema grade. CT noise, field of view (Appendix S4), section thickness, interaction terms between CT variables, and polynomial terms (up to cubic) for CT noise and body mass index were systematically entered into the model to find the best model fit. Models were compared by using the Akaike information criterion and likelihood ratio test.
An alternative modeling approach used phase 1 and 2 full-dose measurements and phase 3 reduced-dose measurements calibrated to the full-dose scale. Sensitivity analyses included fitting models with baseline visual emphysema (absent or trace vs more than trace) or baseline percentage of low attenuation area less than −950 HU (<5% vs ≥5%) instead of baseline deep learning emphysema. The impact of loss to follow-up and missing data on progression estimates was evaluated using multiple imputation and random slope models. Additional details regarding the models are in Appendix S5–S8. Comparisons in CT characteristics between full-dose and reduced-dose examinations were performed using paired t tests. Analysis was performed using software (SAS version 9.4; SAS Institute) and statistical significance was indicated by an α level of .05.
Results
Participant Characteristics
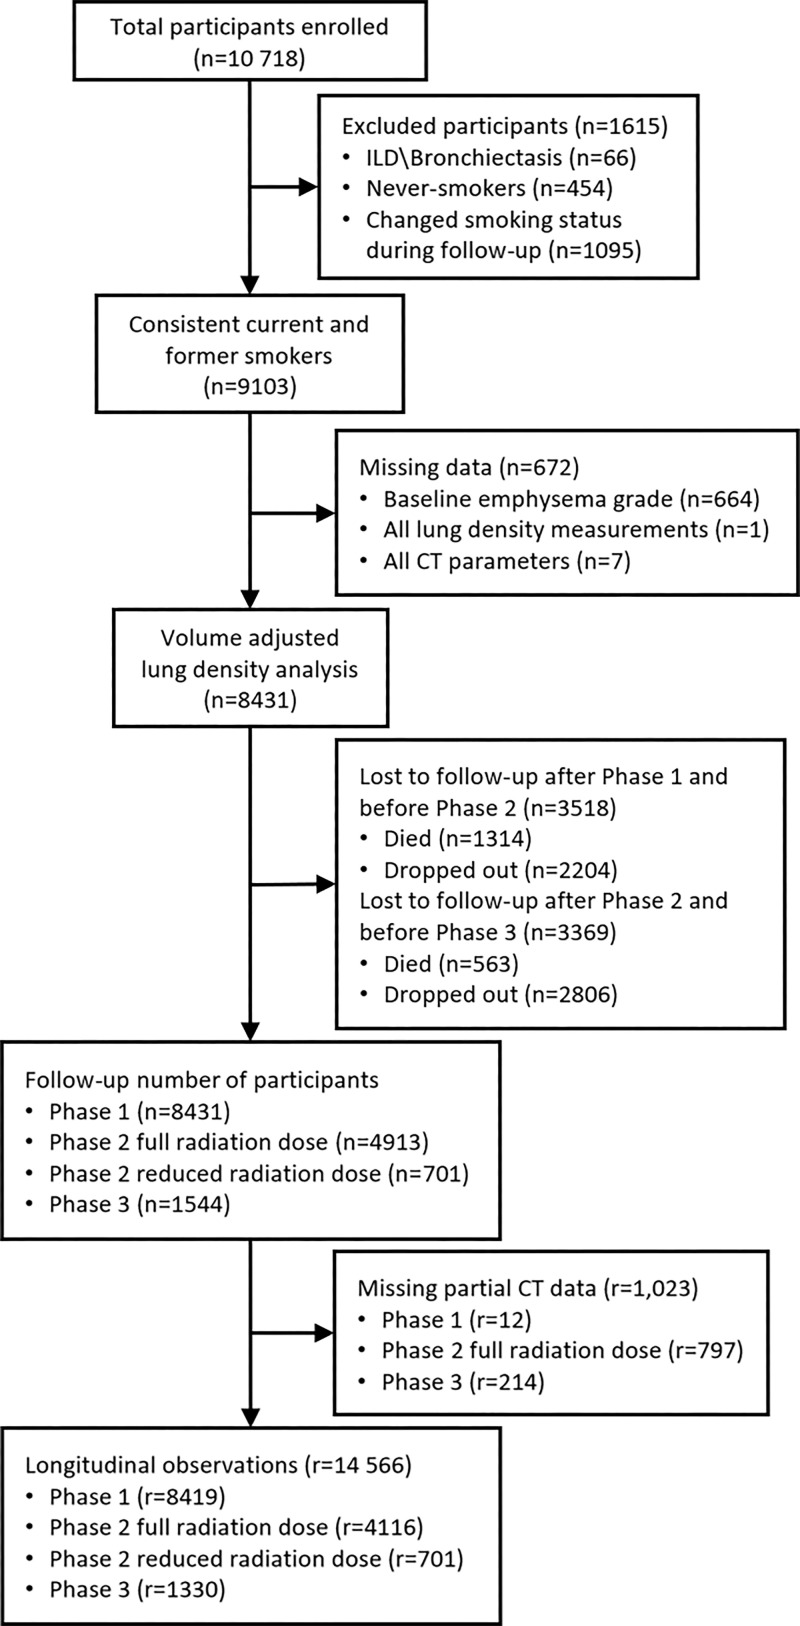
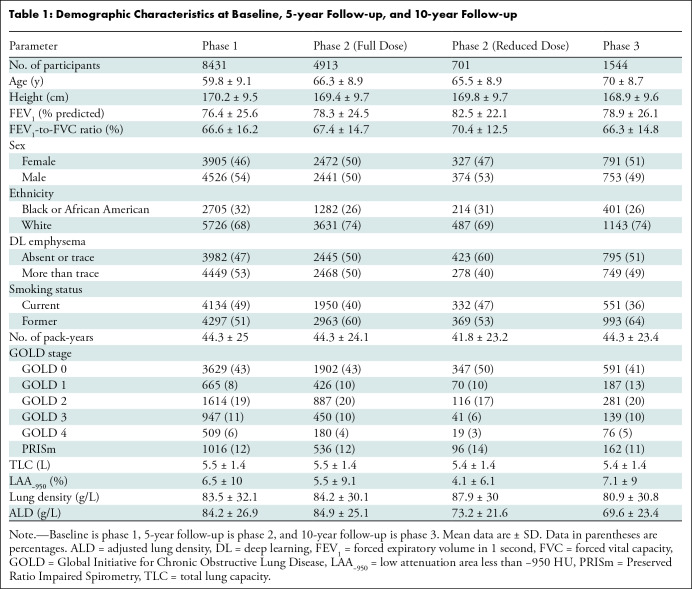
The study sample consisted of 8431 participants (mean age, 60 years ± 9; 3905 female participants; 5726 White participants). Of the 10 718 original participants enrolled, 1615 were excluded because they were never-smokers, they had a change in smoking status, or interstitial lung disease and/or bronchiectasis diagnoses. There were 672 participants who had missing baseline emphysema grades or missing complete CT data (Fig 1). Table 1 shows demographic and clinical characteristics at baseline (phase 1), 5-year follow-up (phase 2), and 10-year follow-up (phase 3). Phase 2 characteristics were stratified by all participants observed at phase 2 (full radiation dose) and participants who had an additional reduced radiation dose scan at phase 2. Approximately half of participants (4134 participants) were current smokers; the proportion of current smokers decreased at follow-up (40% at 5 years and 36% at 10 years). Table S1 shows longitudinal observation patterns by smoking status and emphysema grade. Participants with only one follow-up visit were mostly current smokers or had more than trace emphysema at baseline.
Figure 1:
Flowchart shows participant selection. ILD = interstitial lung disease, r = number of longitudinal observations or records, n = number of unique participants.
Table 1:
Demographic Characteristics at Baseline, 5-year Follow-up, and 10-year Follow-up
CT Metrics
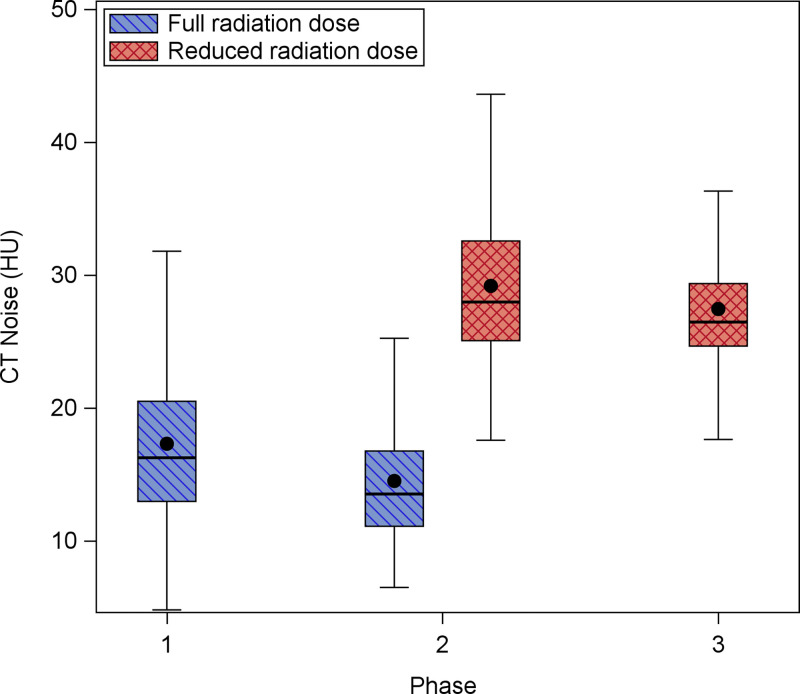
The stochastic noise magnitude within each volumetric CT series was calculated for each participant at all observed phases. Figure 2 shows the distribution of CT noise (in Hounsfield units) by phase and radiation dose. Overall, the CT noise was highest on reduced-dose scans. Table S2 shows several CT metrics for the subset of participants who underwent both a full-dose and reduced-dose examination at 5-year follow-up. CT noise was significantly higher on reduced-dose scans compared with full-dose scans (mean difference, 14.6 HU ± 3.9; P = .004).
Figure 2:
Box and whisker plot shows distribution of CT noise by phase and radiation dose. CT noise decreased slightly between baseline (phase 1) and 5-year follow-up (phase 2) but increased in the reduced-dose scans in phase 2 and 10-year follow-up (phase 3). Comparison of reduced-dose scans also shows that noise decreased from phase 2 to phase 3.
Progression Models
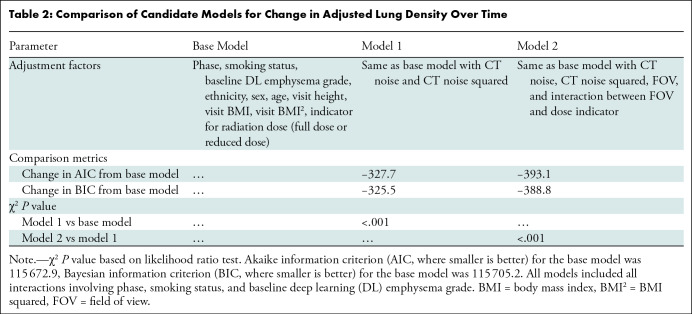
Table 2 shows comparisons of model fit for candidate ALD models. Comparison of the base model and model 1 showed that inclusion of CT noise improved model fit (−327.7 reduction in Akaike information criterion; P < .001 by likelihood ratio test). Additionally, inclusion of field of view and a field of view by radiation dose interaction term improved model fit when comparing model 2 with model 1 (−65.4 reduction in Akaike information criterion; P < .001 by likelihood ratio test). Annualized rates of emphysema progression for successive 5-year intervals, stratified by smoking status and deep learning emphysema severity, are shown in Table 3 for model 2. We obtained annual progression estimates from three additional models (base model, model 1, and calibration model), which are shown in Table S3. The four modeling approaches yielded comparable mean emphysema progression estimates. Results in Tables 3 and S3 were based on models that used baseline age. Consequently, estimates of progression involved changes over time that included both aging and disease progression. Unless otherwise noted, results are presented for model 2 because it was assessed to have the best fit.
Table 2:
Comparison of Candidate Models for Change in Adjusted Lung Density Over Time
Table 3:
Annual Changes in Adjusted Lung Density for Each Study Period
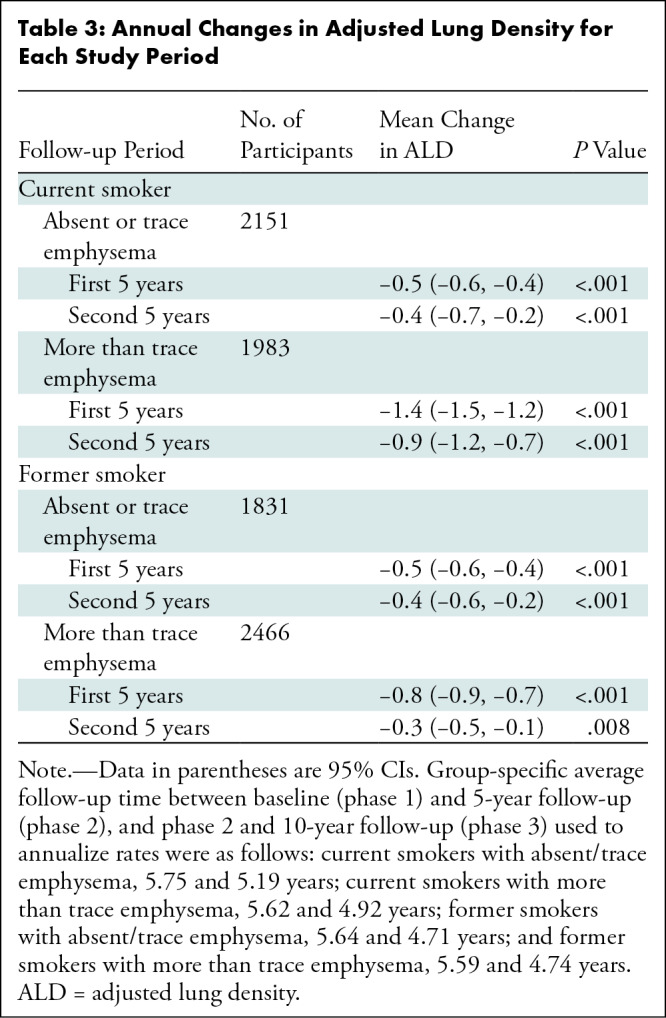
The largest change in ALD was observed in current smokers with more than a trace emphysema at baseline (Table 3). Within this group, average annual decreases of 1.4 g/L (95% CI: 1.2, 1.5) and 0.9 g/L (95% CI: 0.7, 1.2) were observed during the first and second 5-year follow-up periods, respectively. Among former smokers with more than trace emphysema at baseline, these respective declines were 0.8 g/L (95% CI: 0.7, 0.9) and 0.3 g/L (95% CI: 0.1, 0.5). For participants with absent or trace emphysema at baseline, the average annual decline in ALD was 0.5 g/L in the first 5 years (95% CI: 0.4, 0.6 [for both smoking groups]) and 0.4 g/L in the second 5 years for both current (95% CI: 0.2, 0.7) and former smokers (95% CI: 0.2, 0.6).
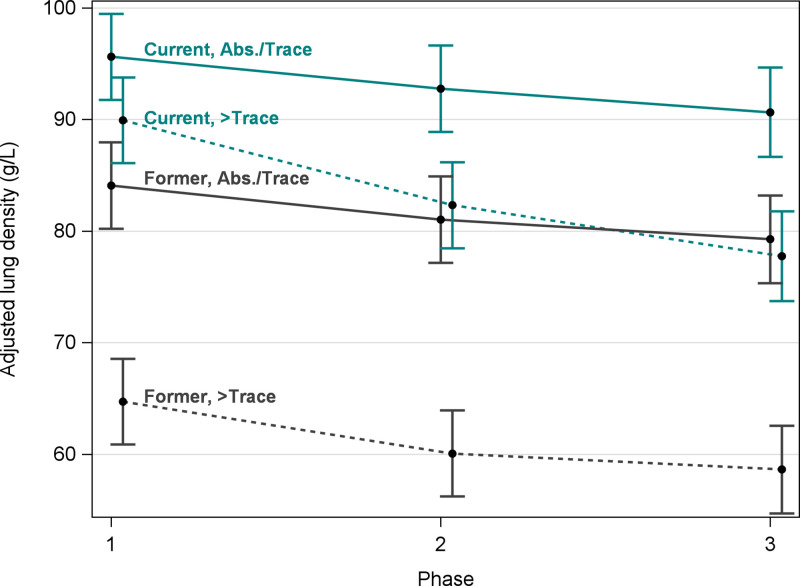
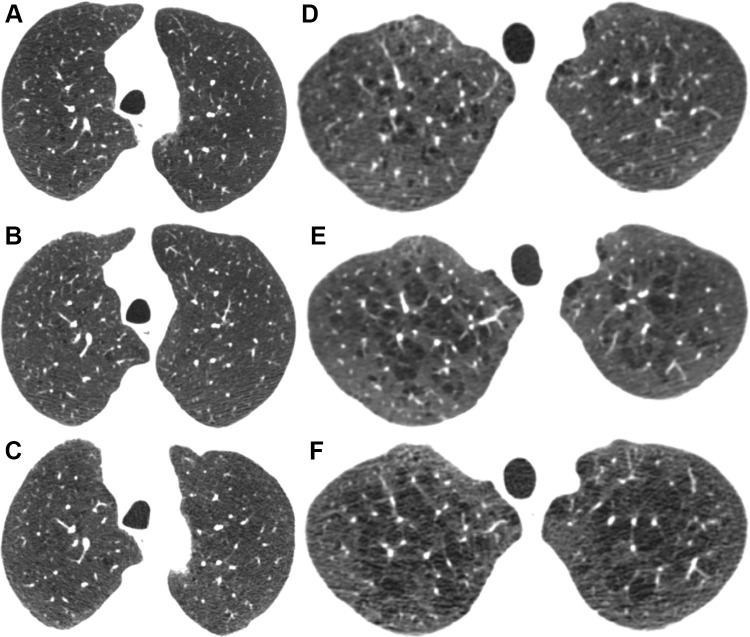
Figure 3 shows estimated mean ALD at each visit by smoking and baseline emphysema status. Although current smokers with more than trace emphysema at baseline had the largest 5-year decreases in ALD, former smokers with more than trace emphysema at baseline had the lowest average ALD at all three phases (64.7 g/L at baseline; 95% CI: 60.9, 68.6). Figure 4A–4C shows nonprogression of emphysema during 10 years for a former smoker with trace emphysema. Figures 4D–4F show progression of emphysema during 10 years for a current smoker with more than trace emphysema.
Figure 3:
Graph shows mean and 95% CIs of volume-adjusted lung density (ALD) at each baseline (phase 1), 5-year follow-up (phase 2), and 10-year follow-up (phase 3) by smoking status and deep learning emphysema status at baseline. Means were estimated from a linear mixed model (model 2; see Statistical Analysis and Progression Models sections for details). Teal lines represent current smokers and dark gray lines represent former smokers. Solid lines represent absent (Abs.) or trace deep learning emphysema and dashed lines represent more than trace emphysema at baseline. Volume-ALD was higher in current smokers than in former smokers. Current and former smokers with absent or trace emphysema had only a slight decline in ALD during 10 years. Current smokers had the largest rate of decline in emphysema.
Figure 4:
Axial CT sections at each follow-up visit show (A–C) nonprogression for a former smoker with trace emphysema and (D–F) progression for a current smoker with more than trace emphysema. (A–C) Images in a male former smoker who was 62 years old at baseline. (A) Baseline CT scan shows trace emphysema. CT scans obtained at (B) 5 and (C) 10 years show no significant change. (D–F) Images in a male current smoker who was 48 years old at baseline. (D) Baseline CT scan shows mild centrilobular emphysema. CT scans obtained at (E) 5 and (F) 10 years show increasing size and number of emphysematous spaces.
Table S4 shows progression estimates for models that include time-varying age rather than baseline age. These estimates are lower in magnitude because the use of time-varying age removes effects from between-subject age differences. The motivation for this approach was to separate aging effects from disease progression effects, although it is only approximate because the phase predictor is not a precise measurement of time since disease onset (Appendix S6). The yearly decline in estimates in Table S4 was, on average, about 0.3 g/L less than those shown in Table 3. Table S5 shows progression estimates stratified by baseline visual emphysema grade and baseline percentage of low attenuation area less than −950 HU. Estimates were comparable across all three baseline emphysema groups; however, group numbers were more balanced when using deep learning or visual emphysema versus percentage of low attenuation area less than −950 HU.
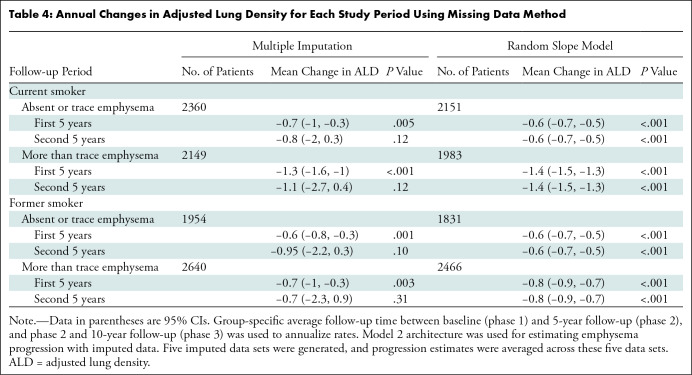
Missing ALD, CT noise, field of view, baseline emphysema grade, height, and body mass index were imputed using multiple imputation techniques. Imputed data were then used to estimate emphysema progression by refitting the final linear mixed model (model 2). Additionally, emphysema progression was estimated with models by using continuous time and random slopes for time. Progression estimates from models derived from imputed data or models by using random slopes for time yielded more emphysema progression in the second 5-year study period (Table 4) relative to models that fit observed data. In particular, the multiple imputation approach yielded estimates that were fairly consistent between the two 5-year intervals (Appendix S8).
Table 4:
Annual Changes in Adjusted Lung Density for Each Study Period Using Missing Data Method
Discussion
In our investigation of emphysema progression within the smoking cohort, emphysema was modeled using volume-adjusted lung density (ALD) based on quantitative CT at three points spanning 10 years (baseline, or phase 1; 5-year follow-up, or phase 2; and 10-year follow-up, or phase 3). Including image-related parameters in the model improved longitudinal estimates of emphysema progression (Akaike information criterion difference, −393.1; P < .001 by likelihood ratio test). Change in CT scanning protocol at phase 3 was addressed with methods leveraging ALD measurements in participants who underwent a full-dose and a reduced-dose examination at phase 2. Former smokers with more than trace emphysema had the lowest baseline ALD (64.7 g/L; 95% CI: 60.9, 68.6), whereas current smokers with more than trace emphysema had the largest annual change in ALD (first 5 years, −1.4 g/L [95% CI: −1.5, −1.2]; second 5 years, −0.9 g/L [95% CI: −1.2, −0.7]).
Previous studies (13,22,23) have shown that current smokers had higher ALD than former smokers, which is attributed to increased inflammatory cells in the lungs of current smokers. Former smokers with emphysema had the lowest average ALD at all three phases, probably because those with moderate or severe emphysema were more likely to quit smoking before follow-up began. However, the trajectory of lung density loss in former smokers was generally less than in current smokers. Wille et al (24) showed that emphysema progression during a 5-year span could be identified visually at chest CT in continued smokers but not in former smokers. This difference in the rate of emphysema progression provides further support for smoking cessation even in individuals with established emphysema.
The decline of ALD for currents smokers with emphysema was comparable to the annual decline of 1.13 g/L found in the Evaluation of COPD Longitudinally to Identify Predictive Surrogate Endpoints (known as ECLIPSE) study of former smokers with COPD, studied for 3 years (7). A previous study (11) evaluating 4268 smokers between phase 1 and phase 2 of showed the 5-year decline in ALD was 1.7 g/L in smokers without COPD and 5.3 g/L in smokers with COPD. A subsequent study (9) showed that ALD decline was minimal in participants without visible emphysema at baseline and the amount of decline increased with increasing severity of visual emphysema. Our 10-year follow-up study extends this finding. Therefore, it is important to stratify the long-term change in ALD by presence of emphysema at baseline. Moreover, because current smokers progressed faster than former smokers, stratification by smoking status is also important (7).
For emphysema progression because of aging versus because of disease, model estimates suggest that approximately 1–2 g/L in ALD was lost every 5 years because of aging whereas the excess decrease in ALD was because of disease. This result is supported by the work of Shaker et al (25), who reported declines of 0.33 g/L per year (1.65 g/L for 5 years) in a reference group of former-smoker male participants without airflow obstruction. Hoffman et al (17) reported similar changes for former smokers and never-smokers for another emphysema metric.
The strengths of our study include the large multicenter study sample, 10-year follow-up, deep learning to stratify on baseline emphysema, stratification for smoking status, and inclusion of image noise and field of view in models. Relative to previous work (11), our study extends progression estimates to 10 years and highlights the importance of adjusting for CT technical characteristics.
Our study had limitations. First, the absence of other studies with similar length of follow-up made validation difficult. However, a variety of modeling techniques was used yielding similar results, which increased confidence in the presented results. A second limitation, loss to follow-up, may have influenced progression estimates in the second 5 years, which may partially explain the decrease in progression rate during the second 5 years for some groups. Models built using imputed data or random slopes for time indicated more progression in the second 5 years relative to models using observed data. In particular, the models that were fit using imputed data showed relatively equal rates of progression in the first and second 5-year intervals, and the random slopes model showed a similar magnitude of progression.
Chronic obstructive pulmonary disease (COPD) is a complex disease; comprehensive quantitative CT evaluation requires consideration of metrics of airway wall thickening and air trapping. However, our study focused solely on progression of emphysema, a clinically important phenotype. Future work includes examination of other quantitative measures and ongoing changes in scanner technology that may require further adjustment in models. Additionally, future follow-up in this cohort may help to determine the effects of death and dropout on later emphysema progression estimates. Because of increased mortality risk for participants with emphysema- and airway-predominant COPD, future work will examine emphysema progression in the context of varying COPD subtypes (26,27). In conclusion, within the smoker cohort, emphysema progression as adjusted lung density based on 10 years of quantitative CT data was greatest in current smokers who had more than trace emphysema at baseline. Furthermore, modeling techniques that include image-related parameters such as CT noise and field of view improved longitudinal estimates of emphysema progression.
Study supported by the National Institutes of Health (NHLBI U01 HL089897, U01 HL089856). The COPDGene study (NCT00608764) is supported by the COPD Foundation through contributions made to an industry advisory committee composed of AstraZeneca, Bayer Pharmaceuticals, Boehringer-Ingelheim, Genentech, GlaxoSmithKline, Novartis, Pfizer, and Sunovion. G.V.S.F. supported by the National Institutes of Health (NHLBI K25HL143278, R21HL156229).
Data sharing: Data generated or analyzed during the study are available from the corresponding author by request.
Disclosures of conflicts of interest: D.B. No relevant relationships. M.S. No relevant relationships. S.M.H. Grant from Boehringer Ingelheim to institution; consulting fees paid to author from Imidex, Lyra Therapeutics; patent pending for systems and methods for classifying severity of COPD. R.S.J.E. Grants or contracts from Boehringer Ingelheim, Lung Biotechnology, Insmed; royalties or licenses from Imbio; consulting fees from Leuko Labs; payment for lectures from Chiesi; three patents pending regarding lung cancer risk assessment with machine learning; leadership or fiduciary role in M+Vision Foundation; stock or stock options in Quantitative Imaging Solutions. G.V.S.F. No relevant relationships. J.P.C. Employed by Thirona; stock in Thirona. R.L. Employed by Thirona. E.K.S. Institutional grant support from Bayer. J.D.C. Chairman of the Board of Directors for the COPD Foundation. D.A.L. Patent pending regarding classification of severity of COPD.
Abbreviation:
- ALD
- adjusted lung density
- COPD
- chronic obstructive pulmonary disease
References
- 1. Heron MP ; National Center for Health Statistics (U.S.) ; Division of Vital Statistics. Deaths: leading causes for 2018 . Natl Vital Stat RepX 2021. ; 70 ( 4 ). [PubMed] [Google Scholar]
- 2. Lynch DA , Austin JH , Hogg JC , et al . CT-Definable Subtypes of Chronic Obstructive Pulmonary Disease: A Statement of the Fleischner Society . Radiology 2015. ; 277 ( 1 ): 192 – 205 . [DOI] [PMC free article] [PubMed] [Google Scholar]
- 3. Han MK , Kazerooni EA , Lynch DA , et al . Chronic obstructive pulmonary disease exacerbations in the study: associated radiologic phenotypes . Radiology 2011. ; 261 ( 1 ): 274 – 282 . [DOI] [PMC free article] [PubMed] [Google Scholar]
- 4. Yang X , Wisselink HJ , Vliegenthart R , et al . Association between Chest CT-defined Emphysema and Lung Cancer: A Systematic Review and Meta-Analysis . Radiology 2022. ; 304 ( 2 ): 322 – 330 . [DOI] [PubMed] [Google Scholar]
- 5. Ash SY , San José Estépar R , Fain SB , et al . Relationship between Emphysema Progression at CT and Mortality in Ever-Smokers: Results from the and ECLIPSE Cohorts . Radiology 2021. ; 299 ( 1 ): 222 – 231 . [DOI] [PMC free article] [PubMed] [Google Scholar]
- 6. Shaker SB , Dirksen A , Laursen LC , Skovgaard LT , Holstein-Rathlou NH . Volume adjustment of lung density by computed tomography scans in patients with emphysema . Acta Radiol 2004. ; 45 ( 4 ): 417 – 423 . [DOI] [PubMed] [Google Scholar]
- 7. Coxson HO , Dirksen A , Edwards LD , et al . The presence and progression of emphysema in COPD as determined by CT scanning and biomarker expression: a prospective analysis from the ECLIPSE study . Lancet Respir Med 2013. ; 1 ( 2 ): 129 – 136 . [DOI] [PubMed] [Google Scholar]
- 8. Quantitative Imaging Biomarkers Alliance . QIBA Profile: Computed Tomography: Lung Densitometry . https://qibawiki.rsna.org/images/e/e4/QIBA_CT_Lung_Density_Profile_090319-clean.pdf. Accessed July 19, 2022.
- 9. El Kaddouri B , Strand MJ , Baraghoshi D , et al . Fleischner Society Visual Emphysema CT Patterns Help Predict Progression of Emphysema in Current and Former Smokers: Results from the Study . Radiology 2021. ; 298 ( 2 ): 441 – 449 . [DOI] [PMC free article] [PubMed] [Google Scholar]
- 10. Coxson HO . Sources of variation in quantitative computed tomography of the lung . J Thorac Imaging 2013. ; 28 ( 5 ): 272 – 279 . [DOI] [PMC free article] [PubMed] [Google Scholar]
- 11. Pompe E , Strand M , van Rikxoort EM , et al . Five-year Progression of Emphysema and Air Trapping at CT in Smokers with and Those without Chronic Obstructive Pulmonary Disease: Results from the Study . Radiology 2020. ; 295 ( 1 ): 218 – 226 . [DOI] [PMC free article] [PubMed] [Google Scholar]
- 12. Regan EA , Hokanson JE , Murphy JR , et al . Genetic epidemiology of COPD () study design . COPD 2010. ; 7 ( 1 ): 32 – 43 . [DOI] [PMC free article] [PubMed] [Google Scholar]
- 13. Shaker SB , Stavngaard T , Laursen LC , Stoel BC , Dirksen A . Rapid fall in lung density following smoking cessation in COPD . COPD 2011. ; 8 ( 1 ): 2 – 7 . [DOI] [PubMed] [Google Scholar]
- 14. Jobst BJ , Weinheimer O , Trauth M , et al . Effect of smoking cessation on quantitative computed tomography in smokers at risk in a lung cancer screening population . Eur Radiol 2018. ; 28 ( 2 ): 807 – 815 . [DOI] [PubMed] [Google Scholar]
- 15. Hatt CR , Oh AS , Obuchowski NA , Charbonnier JP , Lynch DA , Humphries SM . Comparison of CT Lung Density Measurements between Standard Full-Dose and Reduced-Dose Protocols . Radiol Cardiothorac Imaging 2021. ; 3 ( 2 ): e200503 . [DOI] [PMC free article] [PubMed] [Google Scholar]
- 16. Stoel BC , Putter H , Bakker ME , et al . Volume correction in computed tomography densitometry for follow-up studies on pulmonary emphysema . Proc Am Thorac Soc 2008. ; 5 ( 9 ): 919 – 924 . [DOI] [PubMed] [Google Scholar]
- 17. Hoffman EA , Ahmed FS , Baumhauer H , et al . Variation in the percent of emphysema-like lung in a healthy, nonsmoking multiethnic sample. The MESA lung study . Ann Am Thorac Soc 2014. ; 11 ( 6 ): 898 – 907 . [DOI] [PMC free article] [PubMed] [Google Scholar]
- 18. Humphries SM , Notary AM , Centeno JP , et al . Deep Learning Enables Automatic Classification of Emphysema Pattern at CT . Radiology 2020. ; 294 ( 2 ): 434 – 444 . [DOI] [PMC free article] [PubMed] [Google Scholar]
- 19. Oh AS , Baraghoshi D , Lynch DA , et al . Emphysema Progression at CT by Deep Learning Predicts Functional Impairment and Mortality: Results from the Study . Radiology 2022. ; 304 ( 3 ): 672 – 679 . [DOI] [PMC free article] [PubMed] [Google Scholar]
- 20. Tian X , Samei E . Accurate assessment and prediction of noise in clinical CT images . Med Phys 2016. ; 43 ( 1 ): 475 – 482 . [DOI] [PubMed] [Google Scholar]
- 21. Bhatt SP , Bodduluri S , Dransfield MT , et al . Acute Exacerbations Are Associated with Progression of Emphysema . Ann Am Thorac Soc 2022. ; 19 ( 12 ): 2108 – 2111 . [DOI] [PMC free article] [PubMed] [Google Scholar]
- 22. Zach JA , Williams A , Jou SS , et al . Current Smoking Status Is Associated With Lower Quantitative CT Measures of Emphysema and Gas Trapping . J Thorac Imaging 2016. ; 31 ( 1 ): 29 – 36 . [DOI] [PMC free article] [PubMed] [Google Scholar]
- 23. Ashraf H , Lo P , Shaker SB , et al . Short-term effect of changes in smoking behaviour on emphysema quantification by CT . Thorax 2011. ; 66 ( 1 ): 55 – 60 . [DOI] [PubMed] [Google Scholar]
- 24. Wille MM , Thomsen LH , Dirksen A , Petersen J , Pedersen JH , Shaker SB . Emphysema progression is visually detectable in low-dose CT in continuous but not in former smokers . Eur Radiol 2014. ; 24 ( 11 ): 2692 – 2699 . [DOI] [PubMed] [Google Scholar]
- 25. Shaker SB , Dirksen A , Lo P , Skovgaard LT , de Bruijne M , Pedersen JH . Factors influencing the decline in lung density in a Danish lung cancer screening cohort . Eur Respir J 2012. ; 40 ( 5 ): 1142 – 1148 . [DOI] [PubMed] [Google Scholar]
- 26. Young KA , Regan EA , Han MK , et al . Subtypes of COPD Have Unique Distributions and Differential Risk of Mortality . Chronic Obstr Pulm Dis (Miami) 2019. ; 6 ( 5 ): 400 – 413 . [DOI] [PMC free article] [PubMed] [Google Scholar]
- 27. Young KA , Strand M , Ragland MF , et al . Pulmonary Subtypes Exhibit Differential Global Initiative for Chronic Obstructive Lung Disease Spirometry Stage Progression: The ® Study . Chronic Obstr Pulm Dis (Miami) 2019. ; 6 ( 5 ): 414 – 429 . [DOI] [PMC free article] [PubMed] [Google Scholar]


