

Abstract
The assessment of bone age is important for evaluating child development, optimizing the treatment for endocrine diseases, etc. And the well-known Tanner-Whitehouse (TW) clinical method improves the quantitative description of skeletal development based on setting up a series of distinguishable stages for each bone individually. However, the assessment is affected by rater variability, which makes the assessment result not reliable enough in clinical practice. The main goal of this work is to achieve a reliable and accurate skeletal maturity determination by proposing an automated bone age assessment method called PEARLS, which is based on the TW3-RUS system (analysis of the radius, ulna, phalanges, and metacarpal bones). The proposed method comprises the point estimation of anchor (PEA) module for accurately localizing specific bones, the ranking learning (RL) module for producing a continuous stage representation of each bone by encoding the ordinal relationship between stage labels into the learning process, and the scoring (S) module for outputting the bone age directly based on two standard transform curves. The development of each module in PEARLS is based on different datasets. Finally, corresponding results are presented to evaluate the system performance in localizing specific bones, determining the skeletal maturity stage, and assessing the bone age. The mean average precision of point estimation is 86.29%, the average stage determination precision is 97.33% overall bones, and the average bone age assessment accuracy is 96.8% within 1 year for the female and male cohorts.
Supplementary Information
The online version contains supplementary material available at 10.1007/s10278-023-00794-0.
Keywords: Computer-aided diagnosis, Bone age assessment, Deep learning, Point estimation, Ordinal regression
Introduction
Bone age is used to assess the progress of each child’s skeletal maturity from the hand X-ray image, which is important in considering each child’s mental and physical performance, predicting the final adult state, optimizing patient-specific treatments, and so on [1–4]. With the increasing need for bone age assessment, specialized clinicians have insufficient time to fulfill this repetitive task with a high standard. In addition, manually assessing bone age introduces random errors when different clinicians are involved. Therefore, there is a growing interest in developing automated methods to assist clinicians with precise and reliable bone age assessment [5–8].
In the well-known TW3 clinical method, all considered specific bones in the TW3-RUS system are shown in Fig. 1. In the manual assessment progress, the skeletal maturity marker for each specific bone is first compared to the standard atlases to obtain the skeletal maturity level, which is represented as the stage (A, B, …). Then the stage-to-score table (Table S1, S2) transforms stages of all specific bones into a score, and the score-to-bone-age table (Table S3, S4) finally transforms the aggregate score into the bone age. Above two transform tables are determined by the modern development reference curves and vary on the child’s sex and ethnicity. In clinical practice, recognizing subtle differences between each specific bone and standard atlases is the most time-consuming process. In addition, the complexity of the TW3 method leads to the quality of assessment being unstable, especially when implementing repetitive assessments and different clinicians are involved. The main goal of our work is to alleviate such negative factors in clinical practice by proposing an automated bone age assessment method based on the TW3-RUS system. The main challenges of developing this pattern recognition method are accurately localizing those specific bones which contain skeletal maturity biomarkers and achieving maturity-stage-specific feature analysis with high quality [9–14].
Fig. 1.
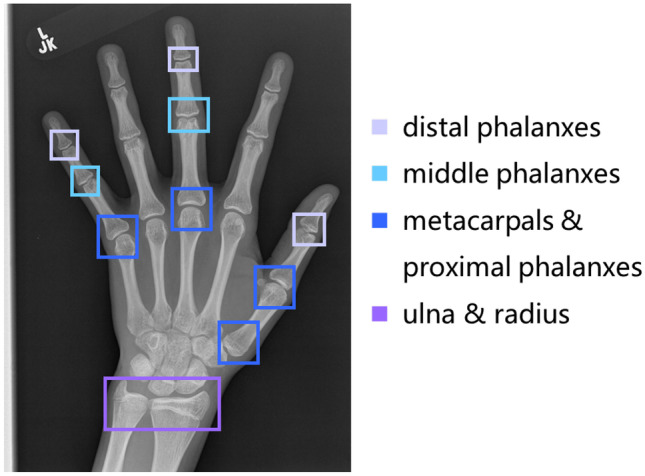
Thirteen specific bones in the TW3-RUS systems. Different types of bones are annotated in different colors
In previous works, bone age assessment methods can be divided into two ways: (1) morphology-based methods. In addition to bone age prediction, predicting the skeletal maturity stage is also considered in this type of method, which is important for clinicians to assess the predictive quality of the model. [15] design a radius and ulna TW3 bone age assessment system, which can be understood as a multi-stage recognition method. The input image only contains the radius and ulna bones. Both an adaptive clustering segmentation algorithm and diverse feature selection mathematical criteria are applied to produce more task-specific attributes. Then the stage determination is achieved by a generalized softmax perceptron neural network with the posterior probability model selection algorithm. In [16], the active appearance model is used to reconstruct bone border, and the bone age prediction is based on shape, intensity, and texture attributes which are from the principal component analysis. In the above methods, the prediction of skeletal maturity is an extremely essential step that affects the model performance directly, and the bone age is subsequently obtained based on the stage-to-score table and the score-to-bone-age table. (2) The second is deep learning-based methods. In [17], modeling the relationship between hand X-ray image and bone age is regarded as a regression problem, and the transformation function is the convolutional neural network (CNN). Additionally, a spatial transform network is added into the network to learn useful spatial transform for inputs. [18] implement an ensemble model, consisting of two different CNN models and classical regressor algorithms with features derived from Canny edge detection, to achieve automated bone age assessment. However, in the above methods, the enhancement methods cannot provide enough fine-grained information to help the model recognize the subtle difference. In [19], the assessment system is modeled by a classification CNN. To filter out noise from the background and perform image standardization, a complicated preprocessing pipeline is built, which consists of an image segmentation model and enhancement operations. In [20], hand detection and hand pose estimation is implemented based on the key point and bounding box annotations. The enhanced image, the key-point heatmap, and the gender information are fed into the CNN model to predict bone age. In [21], a similar pipeline is designed based on the mask and key-point annotations. These three image enhancement pipelines indeed pay attention to regions that contain skeletal maturity biomarkers, and it leads to a better result. However, in addition to bone age results, stage determination is also important for clinicians to assess the predictive quality of the model. And only a few of the above methods pay attention to this. Additionally, to determine the skeletal maturity stage of each specific bone, the solution of existing systems is developing a classification-based algorithm by regarding the maturity stage as a category label. The classification methods fail to consider the ordinal relationship between the labels and lack the supervision of prediction consistency among each stage label.
Based on the workflow of the TW3-RUS system and the limitations of existing research, this work introduces an approach named PEARLS, which consists of three parts: the point estimation of anchor (PEA) module for generating discriminative regions of interest (ROIs), the ranking learning stage (RL) module for determining the skeletal maturity stage of each bone with considering the ordinal relationship between stage labels, and the scoring (S) module for outputting the bone age based on two transform tables.
The main contributions are as follows:
Considering the ordinal relationship between stages, we develop an ordinal regression model for stage determination to achieve an accurate assessment and guarantee the supervision of prediction consistency among each stage label.
Based on the prediction consistency, we regard the probability of each stage as a description degree, i.e., different stages describe the input instance in different importance, and then we present a continuous stage representation.
In the testing phase, the mean average precision of point estimation is 86.29%, the average stage determination precision is 97.33% overall bones, and the average bone age assessment accuracy is 96.8% within 1 year for the female and male cohorts.
Method
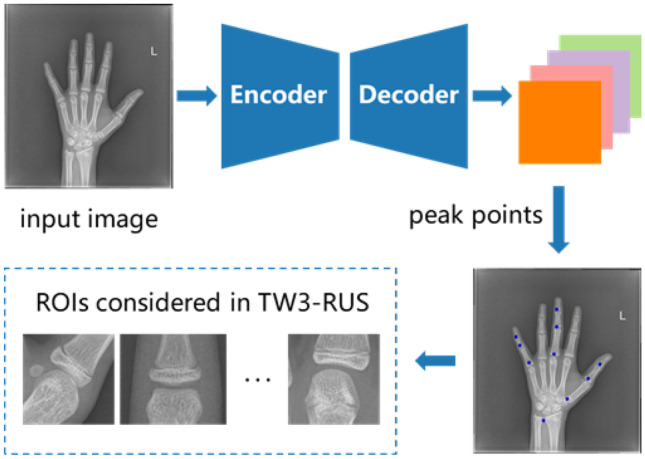
The main goal of this work is to achieve a reliable and accurate skeletal maturity determination by proposing an automated bone age assessment method called PEARLS, which is based on the TW3-RUS system. The overview of the architecture of the proposed PERLS is shown in Fig. 2, and we will give a brief introduction to these modules.
Fig. 2.

The architecture of the proposed PEARLS method
PEA Module
We first model the detection of discriminative regions by estimating their center points. This step can be regarded as a regression model, and the optimization consists of pixel-wise logistic regression on key-point heatmaps and L1 loss for predicting offset values of all center points. Subsequently, the location information of bones is determined based on the predictive center points and is finetuned by the offset values. And the size of ROIs is from an adaptive strategy mainly based on the size of the hand-wrist region and the entire image. Finally, we obtain ROIs containing all specific bones considered in the TW3-RUS system. In this way, we reduce the interference from the diverse scales and poses of the hand and achieve localization accurately.
RL Module
For each bone in the TW3-RUS system, we develop an individual model to determine its skeletal maturity stage. Notably, it is nonnegligible to encode the intrinsic ordinal relationship between the ground truth labels into the learning process. When formalizing the stage determination as regression, the ground truth is regarded as a continuous variable. However, as the rates of skeletal development in different stages are not uniform, applying a regression model is not reasonable. And formalizing the stage determination as classification is unable to model the relationship between different stage labels. In this work, we apply the threshold-based ordinal regression method to consider the relationship between stage labels and assign the patterns to ordered stages. In practice, the model belonging to each specific bone applies the convolutional neural network-based (CNN-based) model as the backbone and the following fully connected layer outputs a logit value as a latent continuous variable. When the model projects the patterns into a real line, a set of fixed or learnable thresholds is used to divide the real line into several intervals, and each of them indicates one of the ordered stages. From the view of the label distribution, the final predictive stage is a continuous stage representation.
S Module
With known transform curves that have been determined by authorities, once we obtain the skeletal maturity stages of all specific bones, we derive the bone age directly.
Now we describe each module of PEARLS in detail.
Point Estimation for Anchoring Module
As shown in the example in Fig. 3, this module aims to produce 10 ROIs containing 13 bones considered in the TW3-RUS system. Therefore, some bones share the same ROI: radius and ulna, metacarpal 5 and phalanx proximal 5, and metacarpal 3 and phalanx proximal 3.
From image to points
Fig. 3.
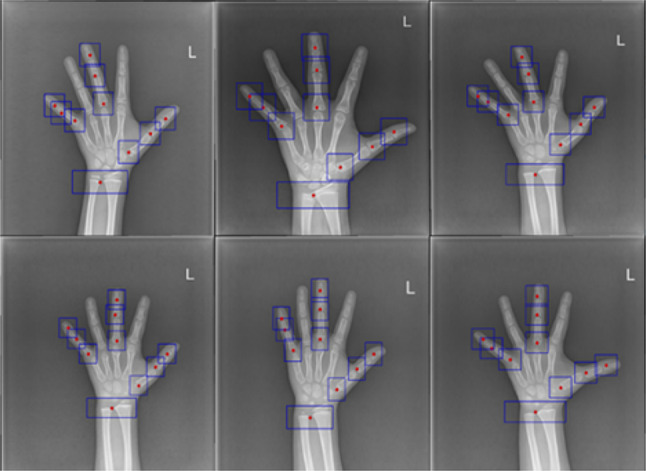
Locating 10 ROIs containing 13 bones considered in the TW3-RUS system
We first regard detecting discriminative regions as estimating their center points. This step can be regarded as a regression model, and the optimization consists of pixel-wise logistic regression on key-point heatmaps and L1 loss for the joint offset of all key points. We will introduce this step by the following four key components: input space, output space, hypothesis space, and loss function. The input space is a set of hand X-ray images which is denoted as . Depending on our application, the expected output space is composed of position coordinates. To facilitate the learning process and improve the model robustness, we encode coordinates into heatmaps, and the output space is denoted as . And each element value in Yi represents the probability that the current position is a center point. C is the number of center points (C = 10), and r is the output down-sampling stride (r = 4). Let (h*, w*) be the ground truth center point of the c th region and be the ground truth heatmap. In Yi*, each element is calculated by the Gaussian kernel as follows:
| 1 |
The heatmap loss function is a pixel-level logistic regression with the format of the focal loss:
| 2 |
where α is for adjusting the influence of difficult and simple samples, γ is for alleviating the imbalance between positive and negative samples, C is the number of center points in the input image, and N is the number of input images.
In the above process, the spatial resolution of the output feature map becomes 1/r of the original input image, which means that a pixel on the output feature map corresponds to the r × r region of the original image, and it will introduce a considerable error. Therefore, we add an extra head to predict the offset value for each class center point and apply the L1 loss to achieve supervision. And the offset loss function is described as:
| 3 |
where h` = g(h*/r) and w` = g(w*/r) and g is the FLOOR operation. Only the position (h`, w`) in each class feature map is supervised. Finally, the total loss function of this step is denoted as:
| 4 |
For the hypothesis space, we choose the fully convolutional encoder-decoder network [22, 23].
-
2.
From points to regions
In the inference phase, we first implement a 5 × 5 max pooling operation on the output feature map to achieve NMS efficiently and then extract the peak point of each single-channel heatmap as the center point. We denote the integer coordinate of the peak point on the cth heatmap as (xi, yi), i = 1, 2, …, C, and the predictive offset of two axes as Ti (xi, yi) = (σxi, σyi). Thus, the finetuned bounding box on the cth heatmap is determined as follows: \
| 5 |
and
| 6 |
where sxi and syi are hyperparameters for adjusting the size. For the bounding box of the ulna and radius region, sxi = 4 and syi = 11. For other bounding boxes, sxi = syi = 15. Finally, we implement scaling transformation on the locations of bounding boxes based on the size of the original image extracting the ROIs on the original image. And some bones share the same ROIs: ulna and radius, metacarpals, and proximal phalanxes. The above workflow is demonstrated in Fig. 4
Fig. 4.
The workflow of the PEA module
Rank Learning Module
Cumulative link model
In this module, we develop an individual model to determine the skeletal maturity stage for each bone in the TW3-RUS system. Because of the intrinsic ordinal relationship between the stage labels, prediction consistency should be guaranteed to improve the predictive robustness. Directly applying classification models will regard ordinal stages as independent classes, and applying regression models will ignore the non-stationary property between inputs which easily leads to an over-fitting problem. Thus, the main goal of this module is to determine the skeletal maturity stages by encoding the intrinsic ordinal relationship into the learning process.
Let the regions of specific bones obtained from the input X-ray image be {x1, x2, …, x13}, and we develop an individual model to determine the skeletal maturity stage for each type of bone. All sub-models have the same machine learning framework, and we will introduce one of them in detail. The input is the j th bone xj, and the corresponding hypothesis space is denoted as fj, which is implemented by the MobileNetV2 [24]. The ground truth is a discrete set {y1, y2, …, ym}, which denotes skeletal maturity stages.
Primarily, our expectation is a consistent statistical model with specific correlations, where the probabilities between neighboring stages need to be more highly correlated than the correlations between distant stages. To simplify the description, we only detail the process for one class ROI. Suppose there are K ordered stages, and we use a set of thresholds θ1, …, θK-1, with a property that θ1 < θ2 < … < θK-1, as cut points to divide the real number line into K intervals. Let x be the input ROI, f be the scoring function, y* be the output logit (a single value), and y be the determined stage. The value of y only depends on the interval into which y* falls:
| 7 |
And we also define θ0 = − and θK = + . Given these suppositions, the conditional distribution of y is calculated as:
| 8 |
where Φ denotes the cumulative distribution function which is given by the logistic function in practice. In this way, we convert the real number logit from the model into probabilities belonging to K stages. Thus, for a single training sample (x, y), the negative log-likelihood is applied as the loss function:
| 9 |
and
| 10 |
The workflow of one of the specific bones in this module is shown in Fig. 5.
-
2.
Three-point representation of stage
Fig. 5.

The workflow of the RL module
In this part, we present a continuous stage representation based on the description degree of each stage. We visualize the predictive probabilities belonging to each stage in Fig. 6. The probability of the determined stage is the highest in the distribution, and the probabilities of other stages decrease along with the increase in the distance from the determined stage. Additionally, the probability of each stage can also be regarded as a description degree, i.e., different stages describe the input instance in different importance. Specifically, the determined stage has a leading position in the description and stages closer to the determined stage contribute more [25].
Fig. 6.

The predictive distribution of some instances
As the rich distribution information from the produce prediction, the continuous stage representation is calculated as below:
| 11 |
where pmax is the highest description degree and c is the corresponding stage and p1 and p2 are the description degrees of stage c + 1 and c − 1, respectively.
When transferring the stage into the skeletal maturity score, we apply this continuous stage representation rather than the stage with the highest description degree.
Experiments
Data Acquisition
The development of each module in PEARLS is based on different datasets, and the detail is followed.
RSNA Public Dataset for PE Module
This dataset contains 14,236 X-ray images in total and key-point annotations provided by [26]. There are 17 annotated key points in the original annotation files, and we only utilize 10 of them which belong to 13 specific bones in the TW3-RUS system. The official dataset split is used for bone age assessment. In this work, as shown in Fig. 7, we randomly re-split the dataset into the training set, evaluating set, and testing set according to the ratio of 8:1:1.
Fig. 7.
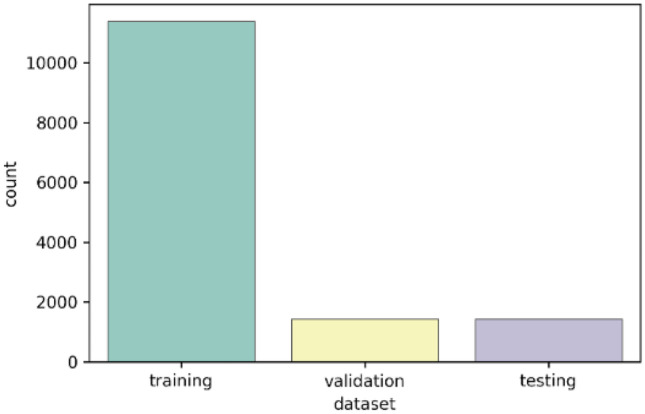
The splitting of the RSNA dataset
A dataset composed of 2374 clinical radiographs of the non-dominant hand from the Department of Pediatrics, Zhangzhou Affiliated Hospital of Fujian Medical University, obtained for bone age assessment, was used to develop the model. We split the dataset into private dataset 1 and private dataset 2 (details as follows). All images were drawn from the picture archive and communication systems of the hospital. The institutional review board approved this retrospective study.
Private Dataset 1 for RL Module
This dataset contains 1200 X-ray images with skeletal maturity stage labels and bone age labels, which are annotated according to the TW3-RUS system. All ground truth annotations are determined by three pediatricians. In detail, the three pediatricians involved in the labeling consisted of one senior pediatrician and two junior pediatricians. After the training and guidance of senior physicians, the two junior pediatricians independently label all the images, and when the assessment results are consistent, results are regarded as the ground truth. If the result is inconsistent, the senior pediatrician will re-assess the image independently, and the result is regarded as the ground truth. We split the dataset into the training set and evaluating set according to the ratio of 8:2. The distribution of the whole dataset is shown in Fig. 8: range 0 is 4 years to 6 years, range 1 is 6 years to 12 years, and range 2 is 12 years to 18 years.
Fig. 8.
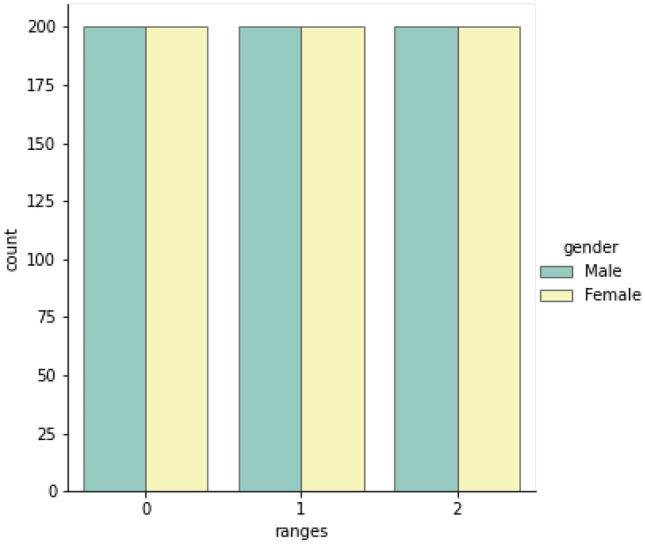
The distribution of the private dataset 1 on different age ranges and genders
Private Dataset 1 for S Module
Based on the gender and ethnicity in the dataset, we first determine the stage-to-score table and score-to-bone-age table, which are published by the authority. Then, we separate the dataset according to gender (female/male = 1:1) and split each dataset into the training set and evaluation set according to 8:2.
Private Dataset 2
This dataset contains 1174 X-ray images only with bone age labels and is only for testing bone age determination. The ground truth labels are based on two separate estimation results. Two separate estimation results of each image are composed of the clinical radiology report and a second review by one pediatrician. The ground truth bone age is the average of these two separate estimates.
We separate the dataset according to gender and measure the accuracy of bone age assessment respectively (female/male = 564:610) (Fig. 9).
Fig. 9.

The distribution of the private dataset 2 on different age ranges and genders
Samples in each dataset are shown in Fig. 10, and detailed data distribution is shown in Table 1.
Fig. 10.

Examples in each dataset. Samples in the first row are from the RSNA dataset, samples in the middle row are from private dataset 1, and samples in the third row are from private dataset 2
Table 1.
Performance of the point estimation on the testing split of the RSNA dataset
| Input size | mAP (%) | AP@50 (%) | AP@75 (%) |
|---|---|---|---|
| 448 | 83.45 | 97.39 | 94.66 |
| 512 | 86.29 | 98.11 | 95.79 |
Implementation Details
PEA module
The point estimation module aims to produce C center points corresponding to areas considered in the TW3-RUS method (C = 10), and then all ROIs are determined based on the produced center points (providing location information) and the ratio of the hand-wrist region to the entire image (providing size information).
We choose the pre-trained ResNet18 as the encoder, a standard residual network with three up-convolutional residual networks as the decoder, and convolution layers as heads. The channels of the three up-sampling layers are 256, 128, and 64, respectively. The resolution of the input image is 512 × 512; the strides to the input image in the encoder are 4, 8, 16, and 32, respectively; and the strides to the input image in the decoder are 32, 16, 8, and 4, respectively. The data augmentation policy consists of random flip, cropping, and random rotation (between − 30 and 30 degrees). The batch size is 32 (on 2 GPUs) for 120 epochs, and the optimizer is SGD with a momentum of 0.9 and a weight decay of 1e-4. The initial learning rate is 2e-4 and drops 10 × per 30 epochs.
-
2.
RL module
We develop 13 independent models to determine the skeletal maturity stage for specific bones in the TW3-RUS system, and each model has the same training setting. In the training phase, the input resolution is fixed at 224 × 224. The data augmentation policy consists of random flip, random cropping (padding set to 16), random rotation (between − 30 and 30 degrees), and random equalization (probability of the image being equalized is 0.2). The batch size is 32 (on 2 GPUs) for 90 epochs, and the optimizer is Adam with a weight decay of 1e-4. The initial learning rate is 1e-3 and drops 10 × per 30 epochs.
Results
Error Analysis for Point Estimation
On the evaluation set from the RSNA dataset, we first calculate the object key-point similarity (OKS) on each sample:
| 12 |
and
| 13 |
(xi,yi) denotes the ith class ground truth location, and (xi’,yi’) denotes the corresponding detection point location. S indicates the scale factor, and wm and hm are the margins of detection points. Especially, σi denotes the normalization factor of the ith point, and it is derived from the standard deviation of (di/S) on the RSNA evaluation dataset. Once we obtain the OKS value of each sample, the error analysis is performed by average precision (AP) and mean average precision (mAP):
| 14 |
and
| 15 |
The results in Table 1 illustrate that the PE module has a satisfactory performance. In consideration of the noise from the uneven image quality and diverse hand pose in the RSNA dataset, the PE module is quite accurate and robust.
Accuracy for Stage Determination
Examples of stage determination are shown in the Fig. 11. On the evaluation split of Private dataset 1, we calculate the cumulative score to analyze each model belonging to each specific bone:
| 16 |
where Δ indicates the absolute error between the predicted stage and the ground truth, N(Δ = s) denotes the number of samples that satisfy this condition, and N is the number of all samples. In Table 2, we set s = 0 and display cumulative scores of each specific bone. The average percentage of correct prediction is 98%. We also used the Kappa-test to evaluate the consistency between fixed and trainable cut points. In Fig. 12, we set s=0, 1 and display cumulative scores with fixed cut points on different bones.
Fig. 11.
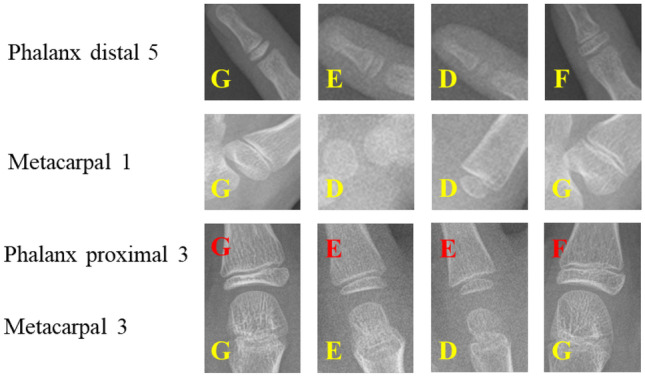
Examples of stage determination
Table 2.
Measuring the percentage of different stage prediction errors
| Bone | Fixed | Learnable | Kappa |
|---|---|---|---|
| s = 0 (%) | s = 0 (%) | ||
| Radius | 98.3 | 95.4 | 0.82 |
| Ulna | 98.8 | 97.7 | 0.83 |
| Metacarpal 1 | 97.1 | 92.4 | 0.81 |
| Metacarpal 3 | 96.0 | 95.5 | 0.84 |
| Metacarpal 5 | 98.0 | 96.3 | 0.79 |
| Phalanx proximal 1 | 95.2 | 92.6 | 0.79 |
| Phalanx proximal 3 | 96.8 | 98.1 | 0.85 |
| Phalanx proximal 5 | 97.8 | 96.6 | 0.81 |
| Phalanx middle 3 | 98.9 | 92.2 | 0.86 |
| Phalanx middle 5 | 99.3 | 90.1 | 0.75 |
| Phalanx distal 1 | 97.0 | 92.4 | 0.80 |
| Phalanx distal 3 | 93.2 | 85.2 | 0.76 |
| Phalanx distal 5 | 99.0 | 87.6 | 0.68 |
| Average | 97.33 | 93.24 |
Fig. 12.

The cumulative scores with fixed cut points on different bones, when s=0 and s=1
Distribution of the Prediction in Stage Determination
In this section, we check the predictive consistency [27] in Fig. 13. For example, when requiring the classification of patterns into K ordered classes, the output result y should meet a monotonically decreasing tendency of cumulative probabilities:
| 17 |
Fig. 13.

Visualizing the predictive consistency
Above results can be seen as reflections of encoding the intrinsic ordinal relationship of labels into the learning process.
Accuracy of Bone Age Assessment
We first apply the mean absolute error (MAE) to measure the performance of bone age assessment and then express the accuracy as the percentage of samples whose absolute error is within 1 year. The results are shown in Table 3 (range 0 is 4 years to 6 years, range 1 is 6 years to 12 years, and range 2 is 12 years to 18 years). As shown in Table 4, there is no significant difference in MAE between manual assessment and that of model (P < 0.05 is statistically significant). In Fig. 14, we show the distributions of the absolute error in different ranges, which are stable between different age ranges. We also show the strong linear relationship between the predictive bone age and the ground truth in Fig. 15. In Fig. 16, we show the joint distribution of the actual age and the deviation, and the deviation is the error between prediction and ground truth. The stable and satisfied accuracy in different age ranges illustrates the performance of the proposed method, as shown in Fig. 17. And bone age assessment examples are shown in Fig. 18.
Table 3.
MAE and accuracy in different ranges on the test dataset (Private 2)
| Age range (year) | MAE (year) | Absolute error within 1 year (%) | ||
|---|---|---|---|---|
| F | M | F | M | |
| 4–6 | 0.46 | 0.41 | 95.62 | 98.95 |
| 6–12 | 0.47 | 0.47 | 94.62 | 94.87 |
| 12–18 | 0.44 | 0.47 | 98.19 | 98.55 |
| Average | 0.46 | 0.45 | 96.14 | 97.46 |
Table 4.
MAE differences in human estimation and model evaluation
| MAE (year) | P value (paired t test) | |||
|---|---|---|---|---|
| F | M | F | M | |
| Model | 0.46 | 0.45 | – | – |
| Estimation 1 | 0.51 | 0.49 | 0.27 | 0.30 |
| Estimation 2 | 0.48 | 0.48 | 0.35 | 0.32 |
Fig. 14.

The distributions of the absolute error in different ranges (female left, male right)
Fig. 15.

The relationship between predictions and ground truths (female left, male right)
Fig. 16.

The joint distribution of actual ages and deviations (female left, male right)
Fig. 17.

The accuracy in different age ranges (female left, male right)
Fig. 18.

Bone age assessment examples
A List of Existing Representative Methods
We list existing representative methods for automated bone age assessment and indicate the scales of corresponding databases. All methods are shown in Table 5. Both the evaluation metrics and the more large-scale testing dataset validate the generalization performance of the proposed method. Additionally, because the training and evaluating (Private 1) dataset and the testing (Private 2) dataset are from different sources, therefore, the distributions of pixel gray values between them are quite different.
Table 5.
Summary of existing representative methods
Conclusion
We achieve a reliable and accurate skeletal maturity determination by proposing an automated bone age assessment method called PEARLS, which is based on the TW3-RUS system (analysis of the radius, ulna, phalanges, and metacarpal bones). The proposed method comprises the PEA module for accurately localizing specific bones, the RL module for producing a continuous stage representation of each bone by encoding the ordinal relationship between stage labels into the learning process, and the S module for outputting the bone age directly based on two standard transform curves. Corresponding results are presented to evaluate the system’s performance in localizing specific bones, determining the skeletal maturity stage, and predicting bone age. The mean average precision of point estimation is 86.29%, the average stage determination precision is 97.33% overall bones, and the average bone age assessment accuracy is 96.8% within 1 year for the female and male cohorts. We also illustrate the characteristics of ordinal regression-based stage determination from views of the description degree and the predictive consistency. Through comparison with existing representative methods, we validate that the proposed method has outstanding accuracy and good generalization ability. However, the dataset contains fewer ethnicities, and the size is small, so the developed method remains to be improved. Based on the retrospective data, we evaluated the performance of the established method, and we plan to apply the model to predict the development level and optimize the treatment, so that the proposed method will have a greater clinical significance.
Supplementary Information
Below is the link to the electronic supplementary material.
Funding
This work was supported in part by the National Natural Science Foundation of China (62003284) and National Science and The Presidential Research Foundation of Xiamen University (NO. 20720210089).
Availability of Data and Material
The dataset employed in this paper is private, and it is not available for now.
Code Availability
All code was implemented in Python. Both the code and scripts to reproduce the experiments of this paper will be available soon.
Declarations
Competing Interests
The authors declare no competing interests.
Footnotes
Publisher's Note
Springer Nature remains neutral with regard to jurisdictional claims in published maps and institutional affiliations.
References
- 1.R. T. Loder, F. A. Farley, J. A. Herring, M. A. Schork, and Y. Shyr, "BONE-AGE DETERMINATION IN CHILDREN WITH LEGG-CALVE-PERTHES DISEASE - A COMPARISON OF 2 METHODS," Journal of Pediatric Orthopaedics, vol. 15, no. 1, pp. 90–94, Jan-Feb 1995, 10.1097/01241398-199501000-00019. [DOI] [PubMed]
- 2.FK Ontell M Ivanovic AS Ablin TW Barlow Bone age in children of diverse ethnicity American Journal of Roentgenology 167 6 1395 1398 10.2214/ajr.167.6.8956565 [DOI] [PubMed]
- 3.J. Iwamoto, T. Takeda, S. Ichimura, Y. Tsukimura, and Y. Toyama, "Age-related changes in cortical bone in men: metacarpal bone mass measurement study," Journal of orthopaedic science : official journal of the Japanese Orthopaedic Association, vol. 5, no. 1, pp. 4–9, 2000 2000, 10.1007/s007760050002. [DOI] [PubMed]
- 4.Tan K-J, Moe MM, Vaithinathan R, Wong H-K. Curve Progression in Idiopathic Scoliosis Follow-up Study to Skeletal Maturity. Spine. 2009;34(7):697–700. doi: 10.1097/BRS.0b013e31819c9431. [DOI] [PubMed] [Google Scholar]
- 5.K. C. Young and G. Chang, "A study on the Growth, Skeletal Maturity of Children with Obesity," Journal of Korean Medicine for Obesity Research, vol. 12, no. 1, p. 9–19, 2012 2012. [Online].
- 6.Jeon JY, Kim C-S, Kim J-S, Choi S-H. Correlation and Correspondence between Skeletal Maturation Indicators in Hand-Wrist and Cervical Vertebra Analyses and Skeletal Maturity Score in Korean Adolescents. Children (Basel, Switzerland) 2021;8(10):2021. doi: 10.3390/children8100910. [DOI] [PMC free article] [PubMed] [Google Scholar]
- 7.Lee BD, Lee MS. Automated Bone Age Assessment Using Artificial Intelligence: The Future of Bone Age Assessment. Korean Journal of Radiology. 2021;22(5):792–800. doi: 10.3348/kjr.2020.0941. [DOI] [PMC free article] [PubMed] [Google Scholar]
- 8.Furdock RJ, Sanders JO, Cooperman DR, Liu RW. Using Skeletal Maturity in Pediatric Orthopaedics: A Primer. Journal of Pediatric Orthopaedics. 2022;42(7):E793–E800. doi: 10.1097/bpo.0000000000002107. [DOI] [PubMed] [Google Scholar]
- 9.Bertaina C, Stasiowska B, Benso A, Vannelli S. Is TW3 height prediction more accurate than TW2? Preliminary data. Hormone Research. 2007;67(5):220–223. doi: 10.1159/000097439. [DOI] [PubMed] [Google Scholar]
- 10.S.-Y. Zhang et al., "Standards of TW3 skeletal maturity for Chinese children," Annals of Human Biology, vol. 35, no. 3, pp. 349–354, May-Jun 2008, 10.1080/03014460801953781. [DOI] [PubMed]
- 11.Y.-P. Cui, M.-T. Zhang, and X.-L. Wang, "Characteristics of R bone age, C bone age, and T bone age in children with different causes of short stature based on Tanner and Whitehouse skeletal age assessment system 2," Zhongguo dang dai er ke za zhi = Chinese journal of contemporary pediatrics, vol. 17, no. 5, pp. 464–8, 2015-May 2015. [PubMed]
- 12.Malina RM, et al. Tanner-Whitehouse Skeletal Ages in Male Youth Soccer Players: TW2 or TW3? Sports Medicine. 2018;48(4):991–1008. doi: 10.1007/s40279-017-0799-7. [DOI] [PubMed] [Google Scholar]
- 13.Z. Bian, Y. Guo, X. M. Lyu, Z. Yang, and J. P. Y. Cheung, "Relationship between hand and wrist bone age assessment methods," Medicine, vol. 99, no. 39, Sep 2020, Art no. e22392, 10.1097/md.0000000000022392. [DOI] [PMC free article] [PubMed]
- 14.Furdock RJ, Huang LF, Sanders JO, Cooperman DR, Liu RW. Systematic Isolation of Key Parameters for Estimating Skeletal Maturity on Anteroposterior Wrist Radiographs. Journal of Bone and Joint Surgery-American. 2022;104(6):530–536. doi: 10.2106/jbjs.21.00819. [DOI] [PubMed] [Google Scholar]
- 15.Tristan-Vega A, Arribas JI. A radius and ulna TW3 bone age assessment system. Ieee Transactions on Biomedical Engineering. 2008;55(5):1463–1476. doi: 10.1109/tbme.2008.918554. [DOI] [PubMed] [Google Scholar]
- 16.H. H. Thodberg, S. kreiborg, A. Juul, K. D. Pedersen, “The BoneXpert Method for Automated Determination of Skeletal Maturity,” IEEE TRANSACTIONS ON MEDICAL IMAGING, vol. 28, no. 1, pp. 52–66, Jan. 2009. [DOI] [PubMed]
- 17.Spampinato C, Palazzo S, Giordano D, Aldinucci M, Leonardi R. Deep learning for automated skeletal bone age assessment in X-ray images. Medical Image Analysis. 2017;36:41–51. doi: 10.1016/j.media.2016.10.010. [DOI] [PubMed] [Google Scholar]
- 18.A. Wibisono et al., "Deep Learning and Classic Machine Learning Approach for Automatic Bone Age Assessment," in 4th Asia-Pacific Conference on Intelligent Robot Systems (ACIRS), Nagoya, JAPAN, Jul 13–15 2019, 2019, pp. 235–240.
- 19.Lee H, et al. Fully Automated Deep Learning System for Bone Age Assessment. Journal of Digital Imaging. 2017;30(4):427–441. doi: 10.1007/s10278-017-9955-8. [DOI] [PMC free article] [PubMed] [Google Scholar]
- 20.M. Escobar, C. Gonzalez, F. Torres, L. Daza, G. Triana, and P. Arbelaez, "Hand Pose Estimation for Pediatric Bone Age Assessment," in 10th International Workshop on Machine Learning in Medical Imaging (MLMI) / 22nd International Conference on Medical Image Computing and Computer-Assisted Intervention (MICCAI), Shenzhen, PEOPLES R CHINA, Oct 13–17 2019, vol. 11769, in Lecture Notes in Computer Science, 2019, pp. 531–539, 10.1007/978-3-030-32226-7_59.
- 21.V. I. Iglovikov, A. Rakhlin, A. A. Kalinin, and A. A. Shvets, "Paediatric Bone Age Assessment Using Deep Convolutional Neural Networks," in 4th International Workshop on Deep Learning in Medical Image Analysis (DLMIA) / 8th International Workshop on Multimodal Learning for Clinical Decision Support (ML-CDS), Granada, SPAIN, Sep 20 2018, vol. 11045, in Lecture Notes in Computer Science, 2018, pp. 300–308, 10.1007/978-3-030-00889-5_34.
- 22.K. M. He, X. Y. Zhang, S. Q. Ren, J. Sun, and Ieee, "Deep Residual Learning for Image Recognition," in 2016 IEEE Conference on Computer Vision and Pattern Recognition (CVPR), Seattle, WA, Jun 27–30 2016, in IEEE Conference on Computer Vision and Pattern Recognition, 2016, pp. 770–778, 10.1109/cvpr.2016.90. [Online]. Available: <Go to ISI>://WOS:000400012300083
- 23.Shelhamer E, Long J, Darrell T. Fully Convolutional Networks for Semantic Segmentation. Ieee Transactions on Pattern Analysis and Machine Intelligence. 2017;39(4):640–651. doi: 10.1109/tpami.2016.2572683. [DOI] [PubMed] [Google Scholar]
- 24.M. Sandler, A. Howard, M. L. Zhu, A. Zhmoginov, L. C. Chen, and Ieee, "MobileNetV2: Inverted Residuals and Linear Bottlenecks," in 31st IEEE/CVF Conference on Computer Vision and Pattern Recognition (CVPR), Salt Lake City, UT, Jun 18–23 2018, in IEEE Conference on Computer Vision and Pattern Recognition, 2018, pp. 4510–4520, doi: 10.1109/cvpr.2018.00474. [Online]. Available: <Go to ISI>://WOS:000457843604069
- 25.Geng X, Yin C, Zhou ZH. Facial Age Estimation by Learning from Label Distributions. Ieee Transactions on Pattern Analysis and Machine Intelligence. 2013;35(10):2401–2412. doi: 10.1109/tpami.2013.51. [DOI] [PubMed] [Google Scholar]
- 26.Siegel EL. What Can We Learn from the RSNA Pediatric Bone Age Machine Learning Challenge? Radiology. 2019;290(2):504–505. doi: 10.1148/radiol.2018182657. [DOI] [PubMed] [Google Scholar]
- 27.Cao WZ, Mirjalili V, Raschka S. Rank consistent ordinal regression for neural networks with application to age estimation. Pattern Recognition Letters, Article. 2020;140:325–331. doi: 10.1016/j.patrec.2020.11.008. [DOI] [Google Scholar]
- 28.Y. Zhang et al., "SMANet: multi-region ensemble of convolutional neural network model for skeletal maturity assessment," Quantitative Imaging in Medicine and Surgery, vol. 12, no. 7, pp. 3556-+, Jul 2022, 10.21037/qims-21-115 [DOI] [PMC free article] [PubMed]
Associated Data
This section collects any data citations, data availability statements, or supplementary materials included in this article.
Supplementary Materials
Data Availability Statement
The dataset employed in this paper is private, and it is not available for now.
All code was implemented in Python. Both the code and scripts to reproduce the experiments of this paper will be available soon.