Abstract
Staff dose management in fluoroscopically guided interventional procedures is a continuing problem. The scattered radiation display system (SDS), which our group has developed, provides in-room visual feedback of scatter dose to staff members during fluoroscopically guided interventional (FGI) procedures as well as extra-procedure staff and resident training. There have been a number of virtual safety training systems developed that provide detailed feedback for staff, but utilize expensive graphics processing units (GPUs) and dosimeter systems, or interaction with the x-ray system in a manner which entails additional radiation exposure and is not compatible with the As Low as Reasonably Achievable paradigm. The SDS, on the other hand, incorporates a library of look-up-table (LUT) room scatter distributions determined using the EGSnrc Monte Carlo software, which facilitates accurate and rapid system update without the need for GPUs. Real-time display of these distributions is provided for feedback to staff during a procedure. After a procedure is completed, machine parameter and staff position log files are stored, retaining all of the exposure and geometric information for future review. A graphic user interface (GUI) in Unity3D enables procedure playback and interactive virtual-reality (VR) staff and resident training with virtual control of exposure conditions using an Oculus headset and controller. Improved staff and resident awareness using this system should lead to increased safety and reduced occupational dose.
Supplementary Information
The online version contains supplementary material available at 10.1007/s10278-023-00790-4.
Keywords: Fluoroscopy, Occupational dose, Virtual reality, Monte Carlo
Introduction
Minimally invasive fluoroscopic procedures may lead to long exposure times, on the order of tens of minutes [1]. Such procedures require focused care by the interventional staff members so as to not exceed deterministic thresholds for skin effects for the patient while also maintaining sufficient image quality for effective medical care. Since staff are in the procedure room during the procedure, radiation safety of personnel is a concern. While improvements in radiation awareness have been made over the past two decades, studies still indicate that radiation workers may overuse high dose-rate techniques, and may neglect protective attire and dosimeters for their own protection [2, 3].
A number of groups are developing personnel safety systems using augmented reality (AR) and virtual reality (VR) to assist staff members and residents in their understanding of dose received, and how to avoid occupying high-scatter-dose regions in the room and the use of high dose-rate techniques [4, 5]. A consensus is that on-the-fly Monte Carlo (MC) methods provide a robust and patient-specific modeling approach in these systems. However, Monte Carlo simulations are computationally costly, and thus need to rely upon expensive graphics processing units (GPUs). As such, to obtain reasonable temporal performance, these groups are sacrificing Monte Carlo accuracy through decreased photon histories while driving up system cost. Even using deterministic methods (non-MC) with probability density functions and transport mechanisms and simple modeling considerations, 1 million photon histories are needed for near real-time performance on high-end computer hardware [4]. Further, neither the AR nor VR based approaches offer reasonable solutions for integrating both real-time feedback and extra-procedure training. One particular approach has been to utilize Bluetooth-connected ion chamber dosimeters for capturing time-stamps and to relate to snap-shots of scatter distributions and the color-camera feed acquired by the “real-time” adapted training system [4]. However, these Bluetooth systems are expensive and this approach to real-time performance is not reasonable using expensive GPUs and lower photon counts, and does not provide a detailed method for reviewing past procedures. Lastly, an AR system for training is not feasible if it relies on trainees operating the x-ray equipment, resulting in ionizing radiation production and trainee exposure, an approach which is not compatible with the As Low as Reasonably Achievable paradigm.
Due to positive feedback in a survey from interventionalists, our group has primarily focused on the development of a real-time staff dose monitoring software, called the Scattered Radiation Display System (SDS) [6]. This system is designed to supplement the patient Dose Tracking System (DTS) we developed by providing intraprocedural feedback of spatial distributions of scatter as well as dose-rate values [7, 8]. As opposed to other groups’ approaches, we have dedicated much time to considerations for staff localization during procedures in order to provide an intuitive, and meaningful dose feedback model [9, 10]
To maintain real-time feedback, our group has avoided expensive GPUs via the development of a pre-calculated room scatter dose matrix library. EGSnrc MC simulations are used for generating these matrices with a large number of photon histories (1 billion) that facilitates MC error under 10%. Given that the SDS can be interfaced with any imaging system which utilizes an application programming interface (API), or controller area network (CAN), log files of the parameters of every exposure during a procedure can be conveniently acquired for post-procedure review. Alternatively, with additional development, such review can be done with a system like the SDS using radiation dose structure report (RDSR) DICOM files, allowing for compatibility with most interventional systems. As such, we have a system which can function post-procedure on a wide variety of computers at a low cost while still providing highly accurate dose distributions.
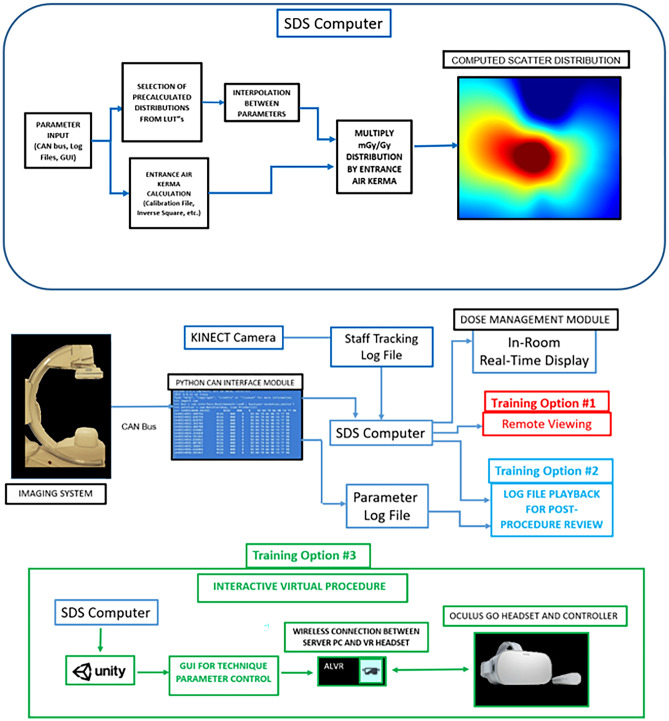
While real-time feedback may prove to be useful for staff dose reduction, each staff member’s attention and primary focus is on patient care and we have thus designed our intraprocedural system to be minimalistic where the user will only need to interface with the software prior (i.e., selecting the patient graphic, selecting the number of staff members to track, and the distribution height to observe) to a procedure. The interventionalist and staff may not always be aware of the effect on the scatter dose of technique selection, gantry geometry, and relative staff position in the room and we have thus re-designed the intraprocedural software for virtual reality training. This training component features various options. Most notably is a replay function which allows for staff and residents to re-evaluate procedures they were involved with. This new software package provides interactive evaluation of scatter distributions with selective dose-rate readout that should contribute to an improvement in dose awareness and safety during FGI procedures. Figure 1 highlights the workflow and functionality of our system.
Fig. 1.
(above) Technical parameters for dose calculations are input into the SDS computer from either a CAN bus, log file, or user input in the software GUI. An LUT and multi-linear interpolation are used to select a normalized scatter distribution corresponding to the input parameter. Patient or table entrance air kerma is also calculated and used to derive the current distribution of scatter dose rate. (below) The SDS can be characterized by two separate modules. First, an intraprocedural module (dose-management module) is available to the user for both in-room, real-time feedback during procedures as well as intraprocedural training (Training Option #1). In Training Option #1, a resident or staff member observing a procedure can view a remote workstation in the control room for an understanding of changes in scatter. During a procedure, machine information is stored in a log file, and a second log file stores tracked positional information for each individual staff member in the room using a Kinect V2 camera. These log files can then be employed for later use by the SDS VR Training Module for procedure replay and analysis (Training Option #2). In Training Option #3, a VR headset can be used to interface with the 3D virtual world where procedures can be simulated, or where interaction with parameters is desired in post -procedure replay as in (Training Option #2)
Materials and Methods
3D Modeling
An effective staff dose monitoring system requires accurate modeling of the interventional suite. Given that we seek to overcome limitations of prior applications as related to cost and accuracy, our model can be broken up into two separate spaces: (1) Monte Carlo simulations of scatter distributions and (2) virtual representation for visual feedback.
Our Monte Carlo simulations utilize voxelized phantoms representing the patient, and a patient table model. To model the patient’s attenuation and scattering characteristics, we currently employ the Zubal anthropomorphic phantom, which was generated using CT scans of an average-sized adult male [11]. Below the phantom is our catheterization table model, which consists of two 4-mm-thick slabs of PMMA and one 4-mm-thick layer of carbon graphite. These thicknesses were determined empirically by comparing simulations of table attenuation to measured values for the catheterization table in our lab (Toshiba Infinix-i Biplane suite) at different tube voltages and field sizes. Figure 2 shows a sagittal section of the voxelized phantom we used for generating scatter distributions. To condense the material list in the simulation, we consolidate materials. That is, the skull and skeletal bone are given the same density and index in the EGS MC phantom file; thus, we remove skull from the material list when simulating projections outside of the head region. Additionally, we consolidate various soft tissues. As an example, for chest projections, the lung material becomes more important, whereas the head contributes less to the scatter distribution. As such, we include the lung material in these projections while equating the density and material index of the brain to skin. For waist level distributions, the scatter detection plane is placed directly above the phantom. To compute distributions at any other height, we place an air gap between the detection plane and phantom surface where the air gap can be adjusted as needed. A detection plane thickness of 4 mm is utilized and a density equivalent to that of soft tissue. The entire 3D model is then embedded in an air medium.
Fig. 2.
A sagittal cross-section of the Zubal phantom used for MC simulations. The detection plane is seen just above the top surface of the Zubal phantom, and the catheterization table is seen just below. A color mapping is applied to highlight the various structures in the phantom, where the closer to red the color is, the denser the material; the darkest blue is dry air, and orange is skeletal bone
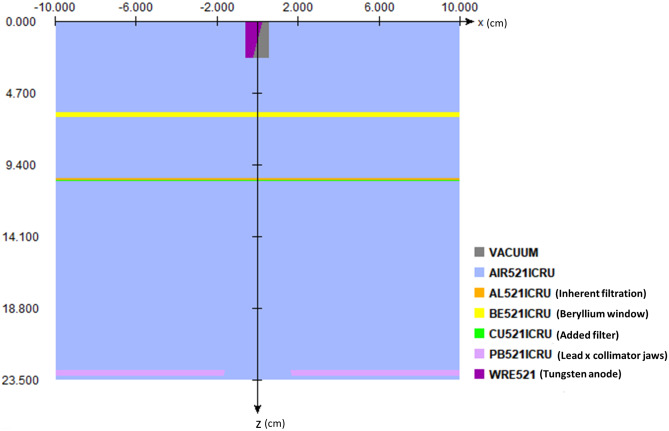
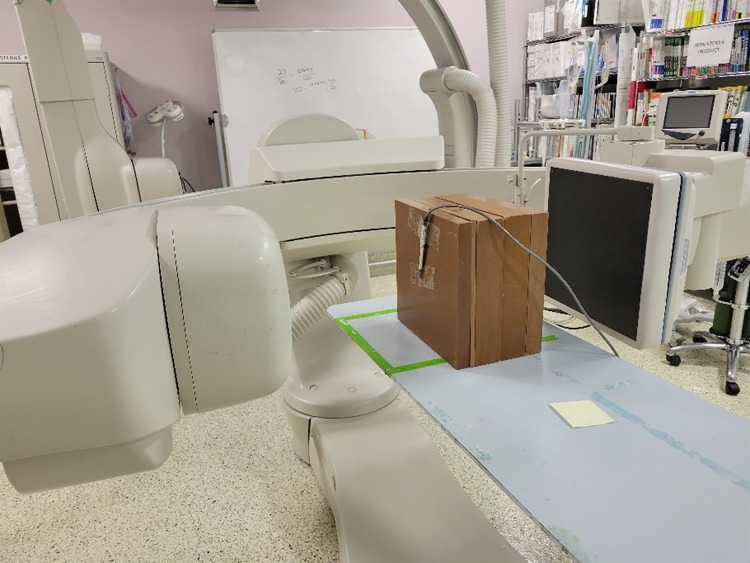
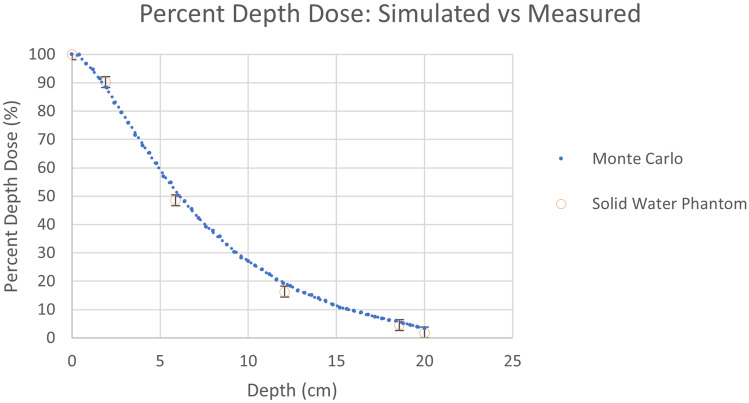
The beam characteristics of the Toshiba (Canon) Infinix-i are modeled using BEAMnrc simulations. Within the accelerator model, we include a tungsten anode and cathode, 3-mm-thick Beryllium window, 1.2-mm Al equivalent inherent filtration, lead collimators, and added filters as component modules as shown in Fig. 3. The final spectrum is stored in a phase space file, which is then used in conjunction with the set up described previously for modeling patient scatter. To validate the beam spectrum, we used a phase space file corresponding to 80 kVp, 0.2 mm of added Cu, and a 20- × 20-cm field size at isocenter, and compared the spectrum to that obtained with SpekCalc. Percent depth dose (PDD) curves were computed using the BEAMnrc phase space file embedded in a DOSxyznrc simulation with a 30- × 30- × 20-cm water phantom. Thirty billion photon histories are used for generating low statistical error. The computed PDD curve was then compared to a PDD curve empirically measured with a 30- × 30- × 20-cm solid water phantom and 0.6-cc (Farmer type) ionization chamber using the setup shown in Fig. 4.
Fig. 3.
Diagram generated by EGSnrc illustrating the x–z cross-section of our x-ray tube model in BEAMnrc. The x-axis points along the anode–cathode direction, whereas the z-axis points along the central axis of the generated beam. We model the tungsten anode with a 12-degree anode angle, a Beryllium window with a thickness of 3 mm, 1.2 mmAl equivalent of inherent filtration, 5-mm-thick collimator jaws (x-pair shown), and a layer of added filtration (0.5 mm Cu shown). [Note: the pair of y collimator jaws is not shown in this profile]
Fig. 4.
The setup we used for empirically measuring a percent depth dose curve at 80 kVp, 0.2 mm Cu added filter, 2 mAs, and 10 s exposure time. A Toshiba Infinix-i gantry was oriented in a lateral configuration to avoid table attenuation. A 0.6-cc Farmer Type ion chamber (shown in the image on the phantom surface) was placed in the beam at various depths of the phantom with the build-up cap removed. The sensitive volume of the chamber was placed on the central axis of the beam on the phantom surface as shown to measure the entrance dose, and was inserted in a slot in one of the slabs to measure dose at various depths in a 30- × 30- × 20-cm solid water phantom. This setup was repeated in a DOSXYZnrc simulation for comparison
To visually represent the clinical environment, without resorting to computationally expensive simulations, we have generated simple patient models, as well as models of the C-arm and patient table. The patient models were created using the MakeHuman software for a wide variety of height-weight combinations in order to visually match the actual patient’s height and weight within a particular range. In the current work, a database of scatter distributions (discussed in “Real-Time Feedback and Scatter Dose Algorithm”) was developed using the Zubal phantom, which represents an average patient size. In the clinical system, an extended database with the NCI computational phantoms will be used to pair with a patient graphic based on height and weight. While the morphology of the graphics may not perfectly match that of the real patient, errors associated with inverse square law corrections to entrance skin exposure have been shown to be minimal [12]. As such, we make iterative inverse square law corrections to the entrance air kerma (discussed in “Real-Time Feedback and Scatter Dose Algorithm”) for scatter dose estimates within a reasonable margin of error.
For graphic representation, the C-arm was modeled using a Microsoft Kinect V2 depth sensing camera in addition to the fusion algorithm with the Microsoft Kinect SDK. This algorithm generates a 3D reconstruction of the environment, where the output is a stereolithographic (STL) mesh. This approach is rather convenient in that we can quickly, and accurately, capture the morphology of the x-ray machine being modeled in our clinical system. All of our 3D models are stored in wavefront object files, which are then included in a Unity3D project. This 3D environment is utilized in the display for both real-time intraprocedural feedback and staff member VR training.
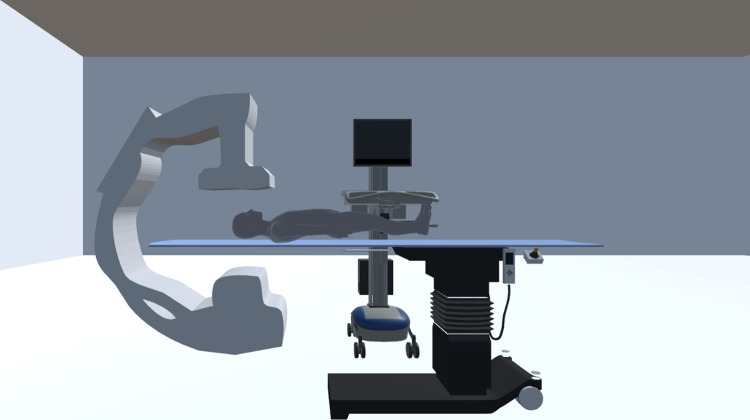
Finally, within the training component of our system, we provide a 3D model representative of a fluoroscopic image display. This is employed to provide a simple projection reference during training sessions. Figure 5 shows our detailed virtual world in the Unity3D display.
Fig. 5.
Model of the fluoroscopic interventional room with (1) a mesh of a frontal C-Arm, which was captured using the Microsoft Kinect Fusion Algorithm; (2) various patient models; (3) a table model; and (4) a model of a diagnostic image display for presenting the trainee with a projection reference (only in the training module, which is discussed in "Virtual-Reality Display")
Real-Time Feedback and Scatter Dose Algorithm
Real-time feedback with our system is accomplished by reading in digitized machine parameters from the angiography system. We acquire hexadecimal data packets representing changes in technique parameters and geometric parameters through interfacing with a controller area network (CAN) bus. These hexadecimal signals are read in directly to the SDS and then stored by the system for later use. A list of example parameters is shown in Table 1.
Table 1.
An example list of machine parameters available from the Toshiba Infinix-i Biplane angiography system. Each of the parameters listed are given for the two imaging chains in a biplane system
| Example machine parameters | |||
|---|---|---|---|
| Geometric parameters | Collimator, filter, and MAG mode settings | Table geometry and technique parameters | Exposure mode settings |
| Geometric change (Boolean) | Vertical collimator blade pair spacing | Table geometry change (Boolean) | State of device |
| Source-to-object distance | Horizontal collimator blade pair spacing | Lateral table position | Exposure mode |
| Cranial-caudal angle | Compensation filter geometric change (Boolean) | Longitudinal table position | Imaging mode |
| RAO-LAO angle | Filter 1 Translation | Table height | Spot fluoroscopy state |
| C-Arm arm rotation | Filter 1 Rotation | Table rotation | |
| C-arm translation | Filter 2 Translation | Table longitudinal tilt | |
| Source-to-image distance | Filter 2 Rotation | Table cradle tilt | |
| Collimator rotation | Filter 3 Translation | Tube voltage | |
| Flat panel detector rotation | Filter 3 Rotation | Pulse width | |
| C-arm column rotation | Electronic magnification mode | Tube current | |
| Beam filter | |||
Once read into the system, the parameters known to alter the spatial shape of the scatter distribution are employed for selection of a preloaded Monte Carlo generated matrix using a look-up-table (LUT). Given the discrete nature of our matrix library, individual CAN bus values may lie in a range between those used for creating the library. In those cases, multi-linear interpolation is employed for deriving an interpolated scatter matrix. The scatter library is normalized to the patient entrance air kerma and thus the displayed scatter distribution matrix is scaled using the entrance air kerma calculated with a tube output calibration file, and multiplicative factors such as tube current and the inverse square law correction to the patient entrance surface. The tube current is modified by the duty cycle whenever pulsed fluoroscopy and digital angiography is utilized.
The inverse square law (ISL) correction is needed for changes in patient entrance location from calibration conditions (designated at the interventional reference point) during the course of a procedure. To compute the ISL factor, we first define the source location in the 3D coordinate system within Matlab’s OpenGL renderer. Once a patient graphic is selected in the SDS, all of the mesh vertices are loaded in. Hence, an array of vertex coordinates is accessible. From this array, we then compute the Euclidean distance between each vertex and the source. This generates a vector of the same length as the patient graphic vertex array, from which we compute the minimum to define the source-to-skin distance (SSD) along the central ray.
We then scale this value by the source-to-isocenter distance in the coordinate system we define in the SDS, where isocenter is congruent to the origin. Empirically, the source-to-isocenter distance is known, so we then scale the aforementioned ratio by this value to acquire the SSD in units of centimeters. From this, it is straightforward to compute the starting from the interventional reference point for the imaging system of interest. In our work, we consider a fixed C-arm in a Toshiba Infinix-I Biplane system, so this interventional reference point is approximately 55 cm from the source.
A scalar unit conversion factor is then included for yielding units of mGy/h in the elements of the final distribution matrix, which is then displayed in the 3D virtual environment. To maintain a simple display for real-time feedback in interventional procedures, we only render a top-down view of the interventional room in Unity3D. As demonstrated by a survey of interventionalists at our facility, this top-down view is sufficient, intuitive, and helpful [13].
The steps in deriving the current scatter distribution matrix, which is presented on-screen in the intraprocedural and training components of the SDS, are given by:
| 1 |
where the left-hand-side is the final (current) scatter distribution in units of and, on the right-hand-side, the first term is a matrix derived through multi-linear interpolation between matrices stored in our LUT, the second term is a tube output calibration factor measured at the interventional reference point (IRP) and has units of as a function of tube voltage and beam filter, the third term is the tube current in units of which accounts for duty cycle, the fourth term is an inverse square law correction factor (ISL) to account for entrance skin location differences with respect to the IRP, and the last term accounts for unit conversions.
The top-down view, intraprocedural component of our software is designed for staff dose management during procedures. As such, we refer to this module of our software as the Dose Management Software. Within our program is a main menu which is presented for offering the trainee two options: (1) the Dose Management Module which has been discussed up to this point and (2) the virtual-reality (VR) training module which is discussed in the next section.
Virtual-Reality Display
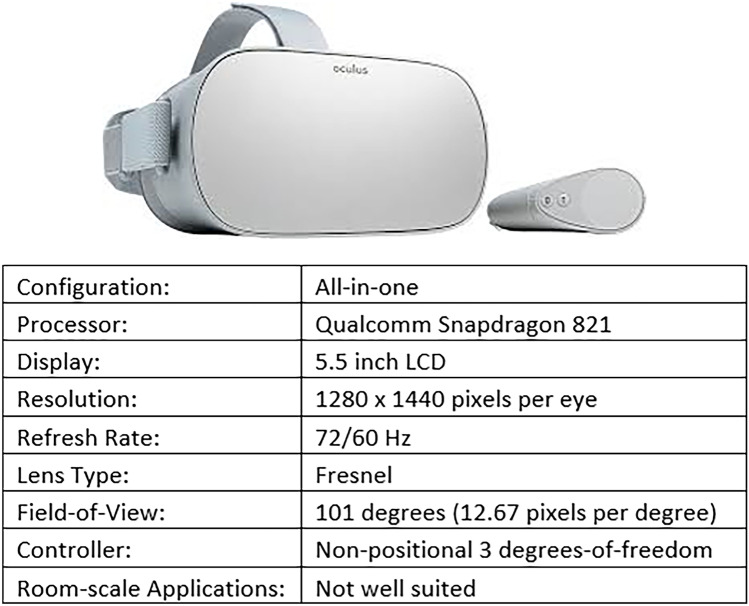
For training purposes, we present the entire 3D environment in Unity3D to the current trainee. To accomplish VR rendering, we use the Oculus Go headset, which is cost effective and offers a high-resolution, stereoscopic display. It hosts an all-in-one configuration, meaning that it contains its own processor. This allows the user to develop applications which can run natively on the Oculus Go, and utilize the Oculus Go as a mobile device. The device is thus particularly well-equipped for a variety of training settings when a workstation is not available. Figure 6 shows the Oculus Go headset and controller as well as its specifications.
Fig. 6.
The Oculus Go VR headset and controller consists of an all-in-one configuration (built-in processor) at a modest cost. The 5.5-inch LCD screen incorporates a moderate 1440p resolution with a variable refresh rate of 60 or 72 Hz allowing for real-time feedback. The Fresnel lens design in this headset provides an improvement with respect to its more expensive counterpart (Oculus Rift). While the all-in-one configuration limits computational performance, with effective development and optimization, it can provide a means for training anywhere
The Oculus Go does not come equipped to interface with a desktop version of Unity3D out of the box. To work around this issue, we installed “air light virtual reality” (ALVR) on both a workstation and the Oculus Go. ALVR establishes a client–server connection, which then facilitates wireless interfacing. SteamVR was then also implemented for establishing a means for connecting to open applications in the desktop workspace. ALVR also hosts a simple user interface which monitors the client–server connection, but also provides widgets for tweaking the Oculus Go VR controller mapping.
Evaluation of System Accuracy
The accuracy of our Monte Carlo simulations was evaluated at a height above the floor of 126 cm, which corresponds approximately to waist level for the average human. Using a 450 × 450 × 76 voxel environment in DOSXYZnrc, we embedded a 30- × 30- × 20-cm water block in place of the Zubal phantom for generating distributions in our LUT. Simulations were run at 80 kVp, 20- × 20-cm square field, and 0.2-mm Cu added filter. Nine-billion photon histories were used to ensure high accuracy. Scatter distributions were calculated from these simulations at the following gantry orientations: AP, 5 CRA, 5 CAU, 10 CRA, 10 CAU, 15 CRA, 15 CAU, 10 LAO, 10 RAO, 20 LAO, 20 RAO, 30 LAO, and 30 RAO (with the number preceding the orientation in degrees). Scatter dose was calculated at a typical interventionalist’s location (50 cm transverse from the table centerline and 54 cm from the isocenter towards the “groin” location) for cardiac procedures.
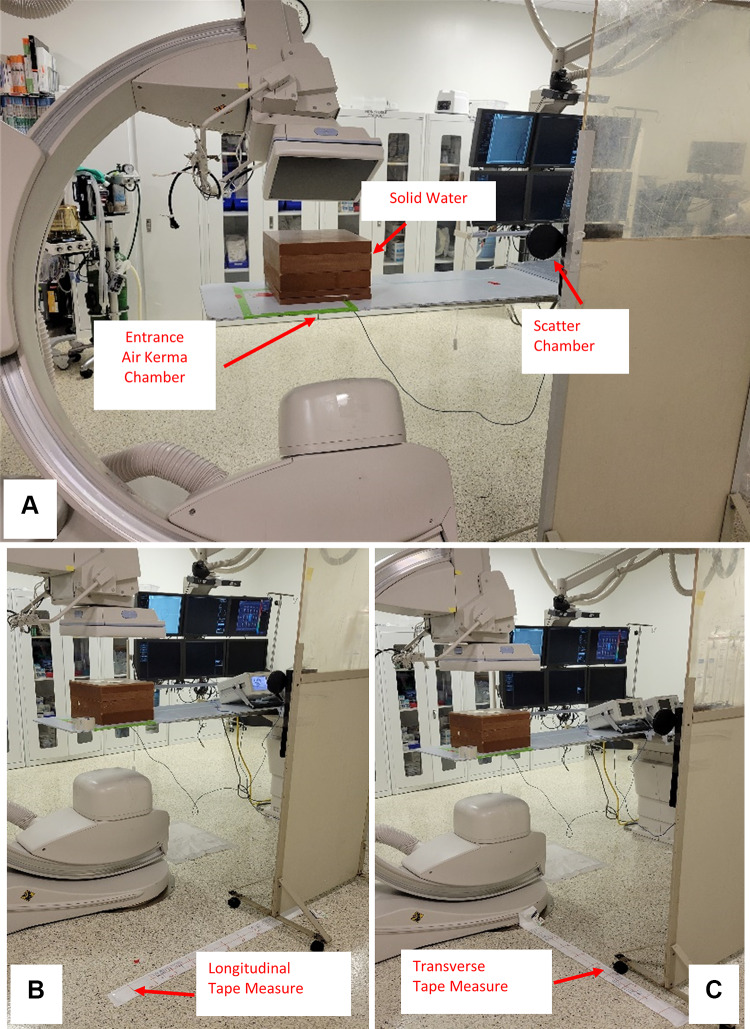
Empirical measurements were acquired as shown in Fig. 7A with a 30- × 30- × 20-cm solid water phantom centered on the gantry isocenter using the same set-up as the MC calculations. A 75-cc (PTW TN34060, Freiburg Germany) ionization chamber was placed at a height of 126 cm, and at the same interventionalist location as used for the MC calculations. A second ionization chamber with a 6-cc sensitive volume (PTW TN34069, Freiburg Germany) was placed at the entrance location of the table with the diagnostic focus facing towards the x-ray tube to measure entrance air kerma. Using 80 kVp, 0.2-mm Cu added filter, 50 mA, 15 pulses per second, 5 ms pulse width, and 10 s exposure times, the above-mentioned gantry angles were used for acquiring measurements of scatter (mGy) normalized to table entrance air kerma (Gy). Similarly, normalized values were acquired in the Monte Carlo simulations.
Fig. 7.
A The set-up used for acquiring scatter measurements with a 30- × 30- × 20-cm solid water block at various gantry angles is shown here. A 75-cc ion chamber is fixed to a moveable lead shield for support, and a 6-cc ion chamber is placed underneath the table for measuring the table entrance exposure. B The same set-up is repeated with fixed gantry orientation (AP), whereas the chamber is moved at 10 cm intervals along a line which is 80 cm from the phantom centerline and parallel to the longitudinal axis of the catheterization table. C The setup used for measuring scatter dose with no shift along the longitudinal axis of the table, while the chamber is moved in a transverse direction at 10 cm intervals
Additional simulations and measurements were made with the phantom described above, but with the gantry fixed in an AP projection configuration, while the location of dose measurement was translated in a direction parallel to the table along a line 80 cm from the phantom centerline in 10 cm increments (Fig. 7B). Measurements were also made in a direction transverse to the table at the position of the isocenter in increments of 10 cm (Fig. 7C). The measurements at 80 kVp, 0.2 mm Cu were compared directly to Monte Carlo simulations; similar measurements were also made at 120 kVp, 0.5 mm Cu, 50 mA, 15 pulses per second, 5 ms pulse width, and 10 s exposure times, but were compared to values extrapolated from the 80 kVp data as described in Eq. 1.
Real-Time Performance Evaluation
To quantify real-time performance of the Dose Management Module, we modeled the information transfer rate of our sysWORXX CAN interface using the Python CAN interface module. The sysWORXX interface is capable of transmitting information in the range of 10 kbps to 1 Mbps. Typically used baud rates are around 125 kbps, and facilitate 128 bits per CAN data frame. An additional 3 bits are included per data frame to account for inter-frame size, thus the sysWORXX interface transfers information at a rate of around 954 frames per second (FPS). CAN bus data from a cardiac procedure were logged using IRB approval and utilized for simulating CAN bus traffic in our virtual CAN. Latency during geometric update, dose computation, staff tracking (see "Human Body Tracking and Recognition"), and object shadowing (see “Object Shadowing”) were all evaluated using a built-in timer function and an AMD APU. We evaluated the base level performance (excluding object shadowing) of the Training Module during a procedure playback using Unity3D’s FPS tracker. The VR Training Module is more computationally demanding and was thus run on a more capable PC with an AMD Ryzen 7 2700 × CPU.
Human Body Tracking and Recognition
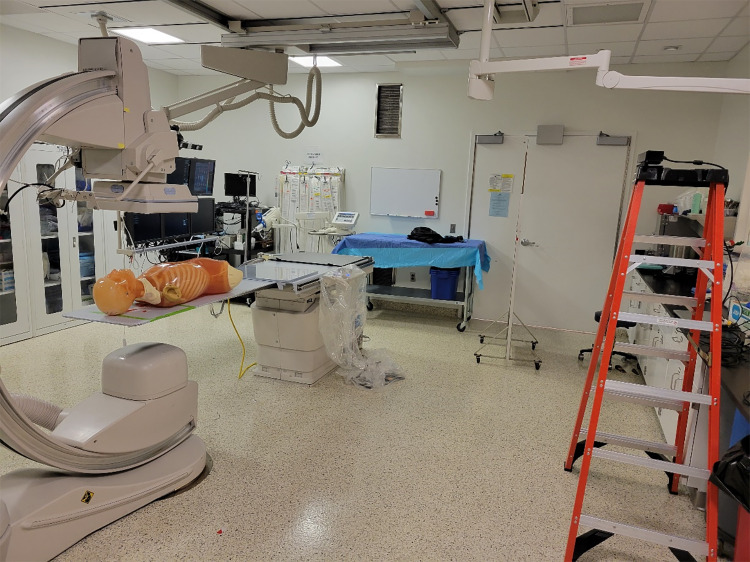
To provide individualized feedback of occupational dose in the SDS DM, our group has worked on methods for interfacing with a Microsoft Kinect V2 RGB-D camera [10]. The time-of-flight depth sensing camera built into the Microsoft Kinect V2 provides a precise and rapid (up to 30 FPS) feedback of human body feature locations. Along with human body tracking, our group has proposed a method for human recognition which utilizes deep learning [14]. Such an approach would not only provide positional information for all staff members involved with an FGI procedure, but would be capable of offering detailed individualized dose reports post-procedure, as well as save positional data in log files, which will be discussed in “SDS Validation”. In this work, we situated a Kinect V2 camera on a support structure and performed a simulated procedure to then save a positional log file for one of the individuals involved. The set-up used for the procedure is shown below in Fig. 8. After the positional log file was stored, it was utilized for demonstration of procedure replay in the SDS TM.
Fig. 8.
The set-up used for the simulated procedure. A Kyoto-Kagaku anthropomorphic phantom was placed on the catheterization table to simulate a cardiac interventional procedure. The Kinect V2 camera is shown to the right in this image, and is fixed to the top of the ladder. This camera was used to record the procedure, as well as the coordinates of one individual’s waist
Object Shadowing
Along with human body tracking and recognition, we have also investigated methods for implementing the tracking of additional objects in the room, such as the ceiling mounted shield [9]. These objects, along with the various staff members involved with the procedure, can attenuate scattered radiation leading to regions of low scatter dose rate and we have developed methods for modeling these shadow regions [9]. The current work accounts for the object shadowing algorithm when evaluating real-time performance.
Results
Scatter Display System
Dose Management Module
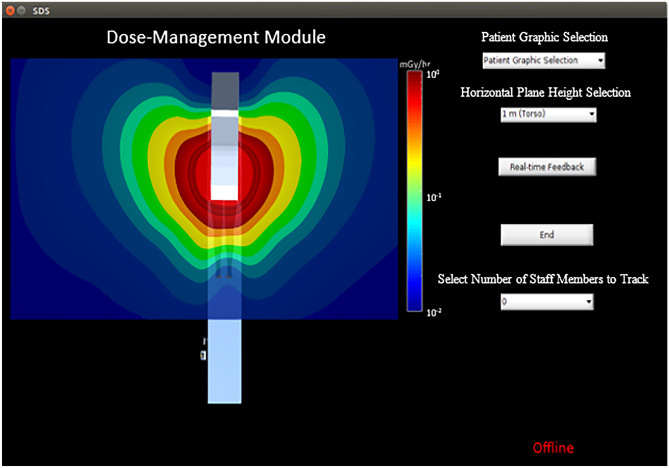
Once the SDS is initiated, a main menu appears, which prompts the user to select either the real-time module, or the VR training module. Selection of the real-time module opens a graphic user interface (GUI) for manipulating the various features in the Dose Management Module as seen in Fig. 9. This GUI is displayed on a monitor in the interventional room and, alternatively, on a monitor viewable from outside of the room for residents/staff not involved with the current procedure.
Fig. 9.
The Dose-Management Module GUI. Within this interface is a top-down presentation of the virtual world in Unity3D discussed previously as well as a color-coded scatter distribution at a height of 1 m above the floor. Various options in this interface include (1) patient graphic selection, (2) horizontal plane height selection, (3) initialization of real-time feedback, (4) ending real-time feedback, and (5) selecting the number of staff members to track. The interface also presents a message indicating whether or not the system is online (i.e., connected to the CAN). [Note: the horizontal planes available correspond to average eye, collar-bone, and waist level heights]
The GUI hosts a variety of features and options. The 3D environment is rendered in Unity3D, while a top-down view is maintained for display in the GUI window. A color-coded distribution at waist height is presented as the default. Additionally, a logarithmic colorscale is provided which displays the range of dose-rate values in units of . The first option selected is the patient graphic using a drop-down menu with height and weight displayed next to each model to facilitate ease of matching to the patient. Secondly, the user can select from various preset planes of scatter corresponding to approximate heights for the waist, collar, and eye lens. Third, prior to initialization of the software, it must be connected to the angiography system’s CAN and at the bottom right of the GUI is a notification indicating whether or not the software is connected and receiving signal traffic. The fourth function is the selection of the number of individuals in the room to track during a procedure.
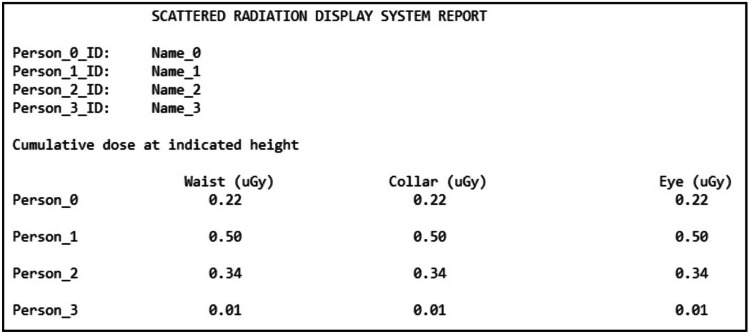
Once the number of tracked individuals is selected, depth sensing cameras fixed to the ceiling initiate capture of views of the interventional suite. This provides the system with 3D coordinates of landmark body features (i.e., waist, neck, head) in order to automatically update staff member position indicators on-screen, as well as the doses at the waist, collar, and eye levels. Individualized dose tracking is accomplished using a human recognition method we developed and can provide the staff with a post-procedural report as shown in Fig. 10, containing cumulative dose for feedback immediately after an FGI procedure is completed.
Fig. 10.
A template SDS dose report in which the dose at the waist, collar, and eye levels are provided after a procedure for each of the staff members involved
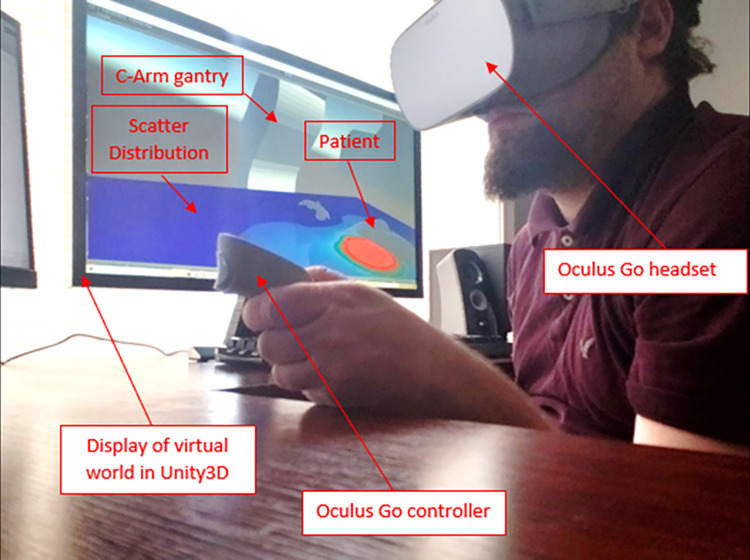
VR Training Module
If the VR training module is selected from the SDS main menu, the trainee dons the Oculus Go headset (see Fig. 11). The user is then drawn into a waiting room as the virtual world is rendered in the Unity3D engine. Once in the virtual environment, the trainee has the ability to move around the room and interact with a variety of menus. The first menu offers the trainee the option of simulating a procedure (Customized Training) or replaying a procedure from log files containing digitized machine parameter information and staff member positional information stored using our human recognition and body tracking techniques.
Fig. 11.
Image of user interfacing with the SDS Training Module. The Oculus Go headset is donned after which the trainee is immersed in a 3D virtual world
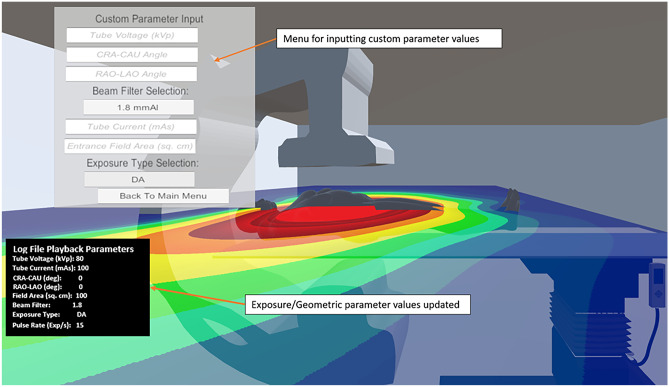
As seen in Fig. 12, the Customized Training option yields a menu in which the trainee can adjust tube voltage, tube current, pulse width, exposure type (pulsed fluoro, continuous fluoro, digital angiography, or digital subtraction angiography), entrance field area, and gantry angle. Within this menu, tube voltage, CRA-CAU angle, RAO-LAO angle, tube current, and entrance field area have been incorporated as input fields, thus requiring numerical input via a separate menu by the user. Beam filter and exposure type selections are incorporated as dropdown menus, thus clicking on the associated boxes makes the other options visible. This customization can allow for staff members to learn the effect of parameter change on the scatter distribution and to plan for procedures with an enhanced understanding of scatter dose they may receive.
Fig. 12.
Screenshot of the SDS Training Module displaying the menu used for customizing various technique and geometric parameters. The parameter selection menu is toggled and not continually overlaid on the display. Also, this example does not include the fluoroscopic image display. See Video 1 for a complete representation of our system
If a trainee who had been involved with a procedure has the desire to review it, the Procedure Replay option is available from the main SDS Training menu. Once this option is selected, a file explorer is available which contains a list of directories corresponding to various procedures which the trainee can select. Within each directory are two files. One file contains machine parameter information, while the other contains staff member positional information. Whichever is selected, both corresponding files get read into the training system.
After the files for a procedure of interest are fed into the software, a new menu is available for selecting a staff member ID of interest. The staff member positional log file, an example of which is depicted in Fig. 13, stores coordinates at torso level within the frame of the virtual world. These coordinates are derived through a linear transformation algorithm we have developed for converting from depth sensing camera derived coordinates. An assigned ID value is used to keep track of each individual’s coordinates over the course of the procedure. The timestamps in the staff member positional log file correspond to the framerate of the depth sensing camera. In our work, we use a Microsoft Kinect V2 depth camera, which has a framerate of 30 frames-per-second.
Fig. 13.
An example staff member positional log file with timestamps on the left. The names of staff members (IDs) are stored in the second line. As staff members are identified using our human recognition technique, coordinates transformed into the virtual world frame are stored at intervals corresponding to the framerate of the Kinect camera (30 FPS). After a procedure, a file storing this information can be read in for procedure replay. The three coordinates for the waist level of the staff member with ID #3 are shown in the above figure, as an example. Following are the sets of three coordinates for staff members #1 and #2
Once the staff member ID is selected, a replay head’s up display (HUD) becomes available. The replay HUD facilitates play, pause, rewind, fast-forward, and stop. During the course of playback, the trainee can pause to adjust parameters during a high dose rate event, rewind to re-approach an event of concern, fast-forward to an event of concern, or stop to play back another procedure altogether. In supplemental information Video 1, we highlight all of the training module’s functions discussed above during the playback of a neuro-interventional procedure. The machine parameter log file used for playback was acquired under IRB approval, whereas the staff member positional log file was developed for demonstration purposes only and does not represent data acquired during an actual clinical procedure. To demonstrate the efficacy of positional log file acquisition, Video 2 presents the depth feed and color feed from a Kinect V2 during a simulated procedure. This video also presents a top-down view of the virtual interventional room in Unity3D with a marker representing the leftmost staff member’s location during the aforementioned procedure (a single individual was tracked for demonstration). From this procedure, positional log files were acquired and selected in the training module for replay of the procedure. While there is a slight mismatch in the scaling and synchronization of the videos, it is qualitatively clear that we are effectively relaying the same positional information from a procedure during a training session. The scaling of the staff member positions in the training module is defined by first aligning the gantry isocenter with the origin of the virtual world and then mathematically defining the x-ray source location. The source-to-isocenter distance in the training module is then known and can be related to the source-to-isocenter distance for the Toshiba Infinix-I system we are modeling. This then yields a scaling factor which relates real-world distances in units of centimeters to the unit distance used in the training module. Similarly, the height represented by a patient graphic is compared to the known source-to-isocenter distance, and this scaling factor is utilized for all patient graphics to properly represent the relative patient size in the training module. Finally, the average length, width, and thickness of the catheterization table were measured for the one used in a Toshiba Infinix-I system and then compared to the source-to-isocenter distance for determining the scaling factor in the training module for proper representation of the table size. A similar method is used when reading information from positional log files. However, the depth camera utilizes the closest body surface for estimating the distance to an individual. Hence, there may be an unavoidable offset in the translated position. The synchronization issue in the demo video was not due to system limitations but to human error in matching the playback speed of the Kinect V2 feed recording and that from the training module.
Video 1
Click here for a video demonstration of the SDS Training Module.
An additional function we include in our VR training module is a fluoroscopic image display. The fluoroscopic image display was developed using a 3D model of a diagnostic monitor, and a dataset of simulated fluoroscopic images of the head. The Zubal computational head phantom was imported into the Astra toolbox in Python for acquiring projection images at a variety of RAO-LAO and CRA-CAU gantry angles assuming cone beam geometry. Video 2 provides examples of such simulated projection images.
Video 2
Click here for a video demonstration of positional log file acquisition and use in the training module. The color feed of the Kinect 2 cameras is shown at the top left, the depth feed is displayed at the top right using a color scale, and the demonstration of reading in the leftmost staff member’s position is at the bottom. [Note 1: upon playback the depth feed will not appear given that the videos were staggered during initialization. Note 2: there is a slight non-synchronization during the playback, which the reader should keep in mind during the visual comparison].
SDS Validation
Phase Space File Spectrum Matching
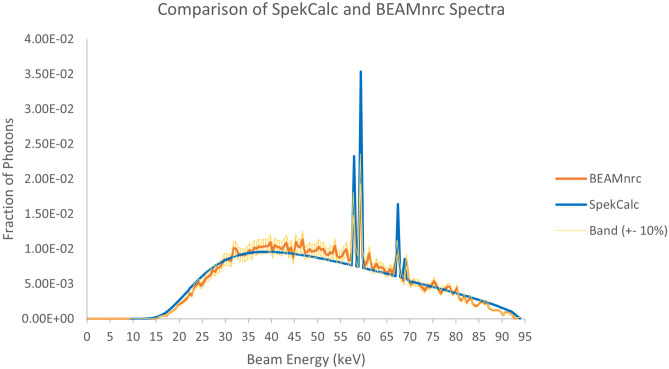
The first set of results in Fig. 14 shows the comparison between the BEAMnrc generated phase space file discussed in the Materials and Methods section to SpekCalc using 0.5 keV energy bins. We can see from the plots a very high degree of overlap, such that the data points agree within about 10%. In Fig. 15, we can see that the Monte Carlo generated PDD curve compares very well with the empirical PDD curve, where both agree within the experimental error of approximately 2%, indicating that our beam simulation matches the tube in the Toshiba Infinix-i Biplane machine.
Fig. 14.
Comparison of SpekCalc and BEAMnrc generated beam spectra. A band of ± 10% was overlayed about the BEAMnrc data, demonstrating that nearly all points in both spectra agree within this range
Fig. 15.
Results comparing the empirical and simulated percent depth dose curves. Vertical error bars of about 2% are presented on the phantom data points, indicating that the simulated results are in close agreement with our measurements
Evaluation of Scatter Dose Accuracy
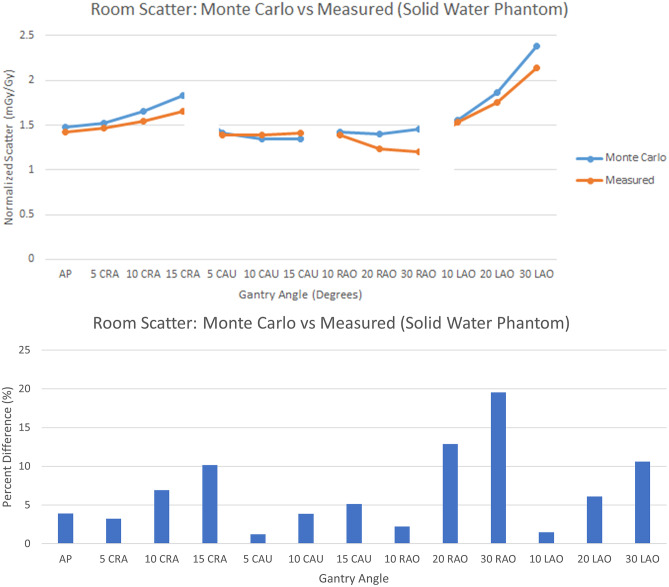
The results in Fig. 16 present the comparison of room scatter for Monte Carlo with the 30- × 30- × 20-cm water phantom and the empirical setup using solid water with a fixed measurement location and various gantry angles. We observe very good agreement with an average percent different of around 7% with values ranging from around 1% up to around 20%. The uncertainty generally increases with increasing CRA/CAU and RAO/LAO angle. This may be due to the difference in the simulation and measurement detector areas; for the simulation, the dose is determined for a 4-mm voxel, while the measurement is averaged over the area of the 91-mm diameter ionization chamber. Nonuniformities of the scatter field, particularly at the corners of the block phantom, can result in larger differences between the averaged and “point” determinations. The large volume ionization chamber is needed because of the low scatter air kerma rates, while the MC results do not suffer from the same uncertainty issues since large photon histories were utilized.
Fig. 16.
(top) Comparison between the Monte Carlo and measured normalized scatter (mGy/Gy) at the waist level and the typical position of an interventionalist on the right side of the table with a 30- × 30- × 20-cm solid-water phantom. (bottom) Percent difference between the Monte Carlo and measured normalized scatter (mGy/Gy) values
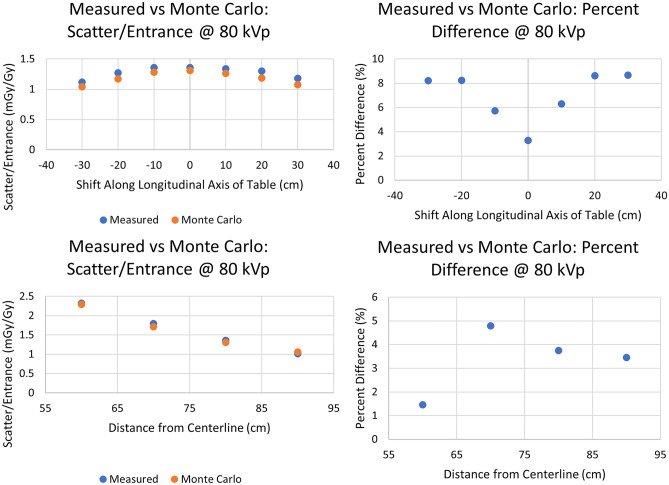
The results in Fig. 17 present the comparison of room scatter for Monte Carlo with the 30- × 30- × 20-cm3 water phantom and the empirical setup using solid water by fixing the gantry configuration to AP and translating the ion chamber longitudinally or transversely as shown in Fig. 7B and C, respectively. We observe good agreement, with a percent difference in the range of 1.5% up to 8.8%. In this second comparison, for which we varied the distance from phantom centerline, we observe well defined symmetry in the percent difference with respect to the phantom’s center as one would expect from the homogeneity and symmetry of the phantoms used. One can expect this given that the scatter field is symmetric and, as such, the error increases symmetrically due to the symmetrical decrease in scatter intensity.
Fig. 17.
(Top) Comparison of Monte Carlo and empirical measurements after translating the detector location in a longitudinal direction parallel to the table by 10 cm intervals from the isocenter along a line 80 cm from the phantom centerline as in Fig. 7B. (Bottom) Comparison of Monte Carlo and empirical measurements after translating the detector location by 10 cm intervals along a line transverse to the catheterization table (0 cm shift along the longitudinal axis from isocenter) as in Fig. 7C. For both cases, the graphs on the left give the actual dose values while the graphs on the right give the absolute percent difference between measured and MC calculated dose values
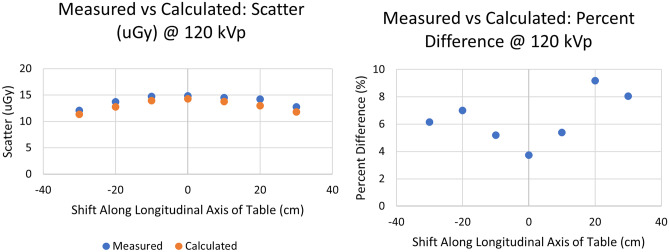
Finally, Fig. 18 presents the comparison of scatter measurements to those derived with our dose algorithm using extrapolation. For both the measured and calculated results, the technique parameters discussed in “Evaluation of System Accuracy” were utilized. Good agreement is again seen with an average percent difference in the range of 3.8% up to 9.2%. Here, we observe a similar trend in the deviation of measured and calculated results which can be attributed to the symmetry of the phantoms used.
Fig. 18.
Comparison of values calculated by extrapolation to 120 kVp and empirical measurements at 120 kVp after translating the detector location in a direction parallel to the table by 10 cm intervals relative to the isocenter along a line 80 cm from the phantom centerline as in Fig. 7B. The graph on the left gives the actual dose values while the graph on the right gives the percent difference between measured and MC calculated dose values
Real-Time Performance Evaluation
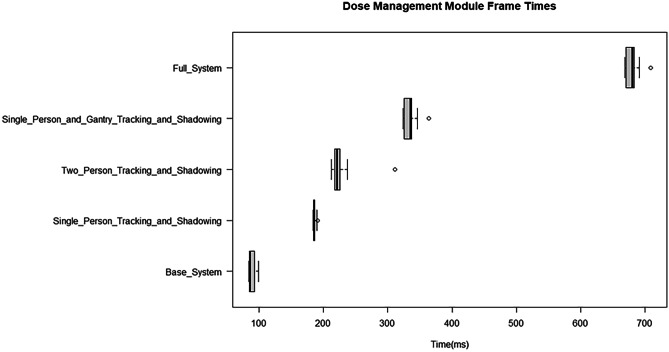
The boxplots shown in Fig. 19 present an assessment of the Dose Management Module real-time performance. For the base system, where only geometric update of the virtual world and dose computation were included, the median latency was around 85 ms. With the inclusion of body tracking, as well as shadowing, for a single individual, it was observed that the system latency increased to around 180 ms. With tracking and shadowing for two individuals, the latency increased further to 215 ms. With tracking and shadowing for a single individual and the gantry, the latency increased again to 340 ms. With tracking and shadowing of a single individual, the gantry, and ceiling mounted shield the latency increased yet again to 580 ms. Finally, using the full system, with tracking and shadowing for 4 individuals and other objects (staff and gantry) the latency was around 680 ms.
Fig. 19.
Results for Dose Management Module frame update times. With the base system, the latency is around 85 ms, whereas the full system functions with a latency of around 680 ms
In the Training Module, Unity3D’s built-in FPS tracker indicates that the median latency during exposure events is around 179 ms with a range of approximately 67 ms to 515 ms. The intermittent framerate dips occur during computationally demanding moments of the procedure when the scatter distribution grid mesh vertices get updated. During portions of a procedure when the distribution is not getting updated, the frame times are maintained around 25 ms on average, and 11 ms on average when a procedure is being replayed.
Discussion
We have been developing a comprehensive tool for the purpose of managing occupational dose during FGI procedures as well as training staff members on how they may reduce this dose. Our software is unique in that it is able to incorporate machine parameter log files and staff member positional log files for detailed procedure replay. This software is the first to integrate such detail for procedure analysis while also displaying highly accurate Monte Carlo derived scatter distributions (around 7% to 15% agreement with measurements for typical projections). Others have relied upon on-the-fly MC simulations requiring high-end GPUs, whereas we are able to maintain high accuracy without the concern of significant real-time degradation by using pre-loaded look-up-tables of scatter distributions; we are investigating methods for predicting scatter distributions with a deep neural network to reduce the need for multiple LUTs.
In the real-time analysis of the Dose Management Module, tracking and shadowing for a single individual were considered. Tracking multiple staff members will lead to a larger computational demand. However, our system was tested on a low-end computer with an AMD APU; since our code is fully vectorized, we expect a great performance increase as it is ported to an improved CPU or a GPU. Regardless, we were still able to achieve real-time feedback for our system with various features included and near real-time feedback for our full system.
Our results indicate that real-time performance can be maintained in the Training Module during simulated procedures when exposure events are initiated by the trainee. During procedure playback in the Training Module, the intermittent framerate drops may lend themselves to difficult interfacing if there are many exposure events in a row. In this paper, we are reporting on the system performance on a CPU and, hence, the frame times reported indicate the need for moving graphics handling and computation to a GPU as well as further code optimization. It should also be noted that the requirements for the Training Module performance are greater than that for the Dose Management Module. As such, future developments for the Training Module are focused, in part, on increasing the framerate to at least 30 FPS to reduce frame stuttering through investigating parallelization or GPU acceleration.
We are beginning to model automatic exposure rate control in the Training Module to improve how well our system emulates actual system performance during simulated procedures. While the current system displays a single horizontal-plane scatter distribution, we are investigating incorporation of multi-planar three-dimensional data for future updates. Finally, future work will be focused on employing a NCI database which includes a variety of adult male, adult female, and pediatric anthropomorphic computational phantoms to improve both the Dose Management and Training Modules so that our results are not only reflective of an average-sized male, as is the case for the Zubal phantom..
Conclusion
A comprehensive software system capable of real-time occupational dose feedback and post-procedural training can improve radiation safety and dose management. With a real-time feedback module, staff members can be made readily aware of concerning dose levels and their distribution during the course of procedures. With the VR training module, procedures can either be simulated or replayed, facilitating an understanding of how geometric and technique parameters can be optimized to improve staff safety.
Supplementary Information
Below is the link to the electronic supplementary material.
Funding
The authors received research support from Canon (Toshiba) Medical Systems Inc. The dose tracking system (DTS) software is licensed to Canon Medical Systems by the Office of Science, Technology Transfer, and Economic Outreach of the University at Buffalo. This work was partially supported by NIH Grant No. 1R01EB030092 and used the resources of the Center for Computational Research (CCR) of the University at Buffalo.
Declarations
Conflict of Interest
The authors declare no competing interests.
Footnotes
Publisher's Note
Springer Nature remains neutral with regard to jurisdictional claims in published maps and institutional affiliations.
References
- 1.Mahesh, M. (2001, July 1). The AAPM/RSNA physics tutorial for residents: fluoroscopy: patient radiation exposure issues. Radiographics (vol. 21, num. 4). [DOI] [PubMed]
- 2.Simeonov G, Mundigl S, Janssens A. Radiation protection of medical staff in the latest draft of the revised Euratom Basic Safety Standards directive. Radiation measurements. 2011;46(11):1197–1199. doi: 10.1016/j.radmeas.2011.05.028. [DOI] [Google Scholar]
- 3.Sánchez, R. M., Vano, E., Fernández, J. M., Rosales, F., Sotil, J., Carrera, F., ... & Verdú, J. F. (2012). Staff doses in interventional radiology: a national survey. Journal of vascular and interventional, 23(11), 1496–1501. [DOI] [PubMed]
- 4.Rodas, N. L. (2018). Context-aware radiation protection for the hybrid operating room (Doctoral dissertation, Université de Strasbourg).
- 5.Bott, O. J., Teistler, M., Duwenkamp, C., Wagner, M., Marschollek, M., Plischke, M., ... & Dresing, K. (2008). VirtX–evaluation of a computer-based training system for mobile C-arm systems in trauma and orthopedic surgery. Methods of information in medicine, 47(03), 270–278. [DOI] [PubMed]
- 6.Troville, J., Kilian-Meneghin, J., Guo, C., Rudin, S., & Bednarek, D. R. (2019, March). Development of a real-time scattered radiation display for staff dose reduction during fluoroscopic interventional procedures. In Medical Imaging 2019: Physics of Medical Imaging (Vol. 10948, p. 109482H). International Society for Optics and Photonics.
- 7.Troville, J., Rudin, S., & Bednarek, D. R. (2021, February). Estimating Compton scatter distributions with a regressional neural network for use in a real-time staff dose management system for fluoroscopic procedures. In Medical Imaging 2021: Physics of Medical Imaging (Vol. 11595, p. 115950M). International Society for Optics and Photonics. [DOI] [PMC free article] [PubMed]
- 8.Bednarek, D. R., Barbarits, J., Rana, V. K., Nagaraja, S. P., Josan, M. S., & Rudin, S. (2011, March). Verification of the performance accuracy of a real-time skin-dose tracking system for interventional fluoroscopic procedures. In Medical Imaging 2011: Physics of Medical Imaging (Vol. 7961, p. 796127). International Society for Optics and Photonics. [DOI] [PMC free article] [PubMed]
- 9.Troville, J., Guo, C., Rudin, S., & Bednarek, D. R. (2020, March). Methods for object tracking and shadowing in a top-down view virtual reality scattered radiation display system (SDS) for fluoroscopically-guided procedures. In Medical Imaging 2020: Physics of Medical Imaging (Vol. 11312, p. 113123C). International Society for Optics and Photonics.
- 10.Troville, J., Guo, C., Rudin, S., & Bednarek, D. R. (2020, March). Considerations for accurate inclusion of staff member body tracking in a top-down view virtual reality display of a scattered radiation dose map during fluoroscopic interventional procedures. In Medical Imaging 2020: Physics of Medical Imaging (Vol. 11312, p. 113123D). International Society for Optics and Photonics.
- 11.Zubal IG, Harrell CR, Smith EO, Rattner Z, Gindi G, Hoffer PB. Computerized three-dimensional segmented human anatomy. Medical physics. 1994;21(2):299–302. doi: 10.1118/1.597290. [DOI] [PubMed] [Google Scholar]
- 12.Kuhls-Gilcrist, A. (2018). A paradigm shift in patient dose monitoring. Retrieved from https://us.medical.canon/download/vl-wp-dts-2017
- 13.Kilian-Meneghin, J., Xiong, Z., Guo, C., Rudin, S., & Bednarek, D. R. (2018, March). Evaluation of methods of displaying the real-time scattered radiation distribution during fluoroscopically guided interventions for staff dose reduction. In Medical Imaging 2018: Physics of Medical Imaging (Vol. 10573, p. 1057366). International Society for Optics and Photonics. [DOI] [PMC free article] [PubMed]
- 14.Troville, J., Dhonde, R. S., Rudin, S., & Bednarek, D. R. (2021, February). Using a convolutional neural network for human recognition in a staff dose management software for fluoroscopic interventional procedures. In Medical Imaging 2021: Physics of Medical Imaging (Vol. 11595, p. 115954E). International Society for Optics and Photonics. [DOI] [PMC free article] [PubMed]
Associated Data
This section collects any data citations, data availability statements, or supplementary materials included in this article.


