

Abstract
Objective:
Indeterminate pulmonary nodules (IPNs) represent a significant diagnostic burden in healthcare. We aimed to compare a combination clinical prediction model (Mayo Clinic model), fungal (histoplasmosis serology), imaging (computed tomography (CT) radiomics), and cancer (hsCYFRA 21–1) biomarker approach to a validated prediction model in diagnosing lung cancer.
Methods:
A prospective specimen collection, retrospective blinded evaluation study was performed in three independent cohorts with 6–30mm IPNs (n=281). Serum histoplasmosis IgG and IgM antibodies and hsCYFRA 21–1 levels were measured and a validated CT radiomic score was calculated. Multivariable logistic regression models were estimated with Mayo Clinic model variables, histoplasmosis antibody levels, CT radiomic score, and hsCYFRA 21–1. Diagnostic performance of the combination model was compared to that of the Mayo Clinic model. Bias-corrected clinical net reclassification index (cNRI) was used to estimate the clinical utility of a combination biomarker approach.
Results:
A total of 281 patients were included (111 from a histoplasmosis endemic region). The combination biomarker model including the Mayo Clinic model score, histoplasmosis antibody levels, radiomics, and hsCYFRA 21–1 level demonstrated improved diagnostic accuracy for IPNs compared to the Mayo Clinic model alone with an AUC of 0.80 (0.76,0.84) versus 0.72 (0.66,0.78).
This combination model was able to correctly reclassify intermediate risk IPNs into low- or high-risk category (cNRI benign=0.11 and cNRI malignant=0.16).
Conclusions:
The addition of cancer, fungal and imaging biomarkers improves the diagnostic accuracy for IPNs. Integrating a combination biomarker approach into the diagnostic algorithm of IPNs may decrease unnecessary invasive testing of benign nodules and reduce time to diagnosis for cancer.
Keywords: biomarker, pulmonary, nodule, cancer
Introduction:
With the recent expansion of lung cancer screening, indeterminate pulmonary nodules (IPNs) are identified in clinical practice with increasing frequency1. IPNs often require costly and invasive testing to obtain a diagnosis, representing a significant patient and financial burden in healthcare. As early-stage lung cancer can be treated with surgical resection, swift diagnosis of malignant nodules may allow patients a higher chance of cure. However, this must be balanced with a need to limit invasive testing in benign nodules2,3.
Current management of IPNs relies on clinical judgement or a validated lung cancer prediction model, such as the Mayo Clinic model, to stratify nodules based on the pre-test probability of malignancy4,5. Further workup is dictated by this stratification into low, intermediate, or high probability groups. While low and high probability IPNs have more definitive management strategies with imaging surveillance or surgical biopsy/resection, respectively, intermediate probability nodules pose a greater diagnostic challenge with varied recommendations and outcomes6,7,8.
The growing number of IPNs identified through computed tomography (CT) imaging motivates the need for non-invasive biomarkers to assist in the evaluation of these nodules. Various blood-based biomarkers have been investigated as potential non-invasive lung cancer diagnostic tools, however none have reached clinical utility at this time. Cytokeratin fraction-21 (CYFRA 21–1), a fragment of cytokeratin 19, has demonstrated early promise as a potential lung cancer tumor marker with prior studies indicating an association between CYFRA 21–1 and tumor burden9. Higher CYFRA 21–1 levels have been associated with worse prognosis and shorter overall survival time in both medically and surgically treated lung cancers9–11.
Imaging biomarkers have also been explored as non-invasive lung cancer diagnostic tools. Quantitative imaging analysis, or radiomics, extracts features from CT scans in order to build prediction models for evaluating pulmonary nodules12. Our radiomic prediction model was developed using the ten most informative imaging features related to nodule size, shape, and texture13. Radiomics has been shown to improve lung cancer prediction accuracy13–15.
IPN diagnosis can be especially difficult in regions endemic for pulmonary fungal diseases such as histoplasmosis. Histoplasmosis infection can manifest as lung granulomas which often mimic cancer on imaging16. In fact, the rate of positive lung screening results in these endemic regions can be triple the rate in non-endemic regions17. Our group recently validated the enzyme immunoassay (EIA) for histoplasma immunoglobulin G (IgG) and immunoglobulin M (IgM) for diagnosing benign IPNs in regions endemic for histoplasmosis with a positive predictive value of 100% when both IgM and IgG were positive using the test’s standard result levels for acute histoplasmosis18.
In this study, we aimed to improve the diagnosis and classification of IPNs by combining clinical prediction factors (Mayo Clinic model), fungal biomarkers (histoplasmosis EIA), an imaging biomarker (radiomics), and a cancer biomarker (hsCYFRA 21–1) to predict the presence of lung cancer. We hypothesized that a combination biomarker approach would improve the diagnostic accuracy of IPN evaluation and risk reclassification compared to a widely used clinical prediction model (Mayo Clinic).
Patients and Methods:
Serum samples and clinical information were obtained from patients with newly detected 6–30 mm IPNs for this prospective specimen collection, retrospective blinded evaluation study19. Incidentally discovered and lung cancer screening detected IPNs from three cohorts (supplement, Figure S1) were utilized. The first cohort included patients from Vanderbilt University Medical Center and the Tennessee Valley VA Healthcare System in Nashville, Tennessee (VUMC, n=111) consented for research between 2003 and 2017. The VUMC cohort had a mix of incidentally discovered and screening detected nodules. The second cohort contained patients with IPNs from the University of Pittsburgh Medical Center’s lung screening program (UPMC, n=71) consented for research between 2006 to 2015. The third cohort was derived from the Detection of Early Cancer Among Military Personnel consortium (DECAMP, n=99) which includes patients with screening and incidentally discovered nodules from 12 Veterans Affairs sites. The DECAMP participants were made available as a case-control cohort consented for research between 2013 to 201720.
Patients who were included in this study had an IPN between 6–30 mm in largest axial diameter, were 40–90 years old at time of enrollment, had prospectively collected treatment-naive serum and CT scans (with slice thickness ≤ 3 mm), and had a definitive cancer or no-cancer diagnosis. In patients with multiple IPNs, the nodule of greatest clinical concern was selected for analysis. For malignant nodules, diagnosis was biopsy-proven. Benign nodules were diagnosed through biopsy, at least two-year longitudinal imaging follow-up showing no signs of growth (extended past three years for subsolid or suspicious nodules), or benign evidence on radiology (e.g., nodule shrinking or benign calcification pattern on CT). Patients with non-solid nodules were excluded, as were known metastatic or benign disease at time of enrollment, lung cancer diagnosis within two years prior to enrollment, histology showing non-lung primary malignancy, or > 90 days between CT and serum collection (> 120 days in the VUMC cohort if medical record confirmed no treatment was received during this time). Patients with missing histoplasmosis EIA, radiomic score, hsCYFRA 21–1 result, or missing definitive IPN diagnosis were also excluded. This study was approved by the VUMC IRB #030763 (12/21/2021) and 000616 (2/8/2022). All patients were consented to have biological specimens and clinical data used for future research.
Biomarkers
Frozen serum samples were shipped to MiraVista Diagnostics (Indianapolis, IN) for histoplasmosis serologic testing. Serum samples were tested for histoplasma IgG and IgM antibodies by enzyme immunoassay (EIA). The methodology for serologic testing has been described elsewhere16,18,21. Technicians performing serologic testing were blinded to all clinical data. Turnaround time for testing is typically 3 to 5 days.
Serum samples were tested for hsCYFRA 21–1 levels using the compensated interferometric reader (CIR) in a blinded fashion. The methodology for hsCYFRA 21–1 testing has been previously reported22. Results for hsCYFRA 21–1 are usually available in one week.
In order to obtain radiomic risk scores, IPNs were segmented to extract quantitative features from CT scans using the HealthMyne picture archiving and communication system (Madison, WI). Radiomic segmentation typically takes about one hour. Radiomic scores were derived from regression shrinkage and subset selection by the LASSO method. Our radiomic risk model includes the 10 most informative quantitative imaging features related to nodule size, shape, and texture. The methodology for radiomic score development is described in further detail elsewhere13.
Mayo Clinic scores were obtained for each patient included in the study. The Mayo Clinic Model is a validated logistic regression lung cancer prediction model, commonly used to predict the probability of IPN malignancy23. This prediction model includes age, smoking history (ever/never), history of extra-thoracic cancer ≥ 5 years prior, nodule diameter, location, and spiculation. Smoking history was defined as having smoked at least 100 cigarettes.
Statistical Analysis
Patient demographics and nodule characteristics were summarized using descriptive statistics. Analyses were performed using Stata version 16 (College Station, TX) and R version 3.6.3. P values <0.05 were considered statistically significant.
Prediction Modeling
Multivariable logistic regression models were developed to predict the presence of lung cancer. The binary outcome for each model was cancer versus benign disease. Predictor variables included Mayo Clinic score, histoplasmosis IgG EIA level, histoplasmosis IgM EIA level, radiomic score, and hsCYFRA 21–1 level. All predictor variables were continuous and modeled as flexible forms using restricted cubic splines with three knots to allow for nonlinearity.
A binary interaction term, representing whether the sample was collected in a region endemic or non-endemic for histoplasmosis, was added to each predictor variable except the Mayo Clinic score. This term was used to account for varying degrees of fungal prevalence in the different study cohorts and allow for differential effects of the various biomarkers to be represented. The prediction models were estimated and assessed in the combined dataset (n=281), and subsequently assessed in the endemic (VUMC, n=111) and non-endemic (UPMC and DECAMP, n=170) subgroups. Areas under the ROC curve (AUCs) of the prediction models were compared using the Delong method. A bootstrapping approach was used to internally validate the models and provide optimism-corrected assessments of AUCs24,25.
Confidence intervals for sensitivity, specificity, positive predictive value (PPV), and negative predictive value (NPV) were calculated using a Wald Binomial proportion approach.
Reclassification
The bias-corrected clinical net reclassification index (cNRI) was calculated to determine reclassification of IPNs out of the intermediate-risk category using the combination biomarker approach. Reclassification was estimated using the combination biomarker predictions (Mayo Clinic score, histoplasmosis EIA, radiomics, hsCYFRA 21–1) compared to the baseline Mayo Clinic model prediction. All three cohorts were pooled together, and IPNs separated according to malignant (n=158) or benign (n=123) diagnosis. Nodules were grouped into low-, intermediate-, or high-risk categories using decision thresholds of 10% and 70% (<10% indicating low risk, 10–70% intermediate risk, and >70% high risk) per British Thoracic Society guidelines26. The bias-corrected cNRI was then calculated for malignancy and benign disease separately to explore the clinical utility of a prediction model27.
Clinical Utility and Management
Clinical management using a combination biomarker approach versus Mayo Clinic model prediction alone was investigated through electronic healthcare record (EHR) review. Our aim was to assess how patients that otherwise would have been classified as intermediate risk with the standard Mayo Clinic model would be managed if moved into risk categories with clear follow-up or treatment procedures (i.e., low or high risk). This assessment was conducted for the VUMC cohort only (n=111), as study investigators did not have access to the EHR for other cohorts. Hypothetical management using the combination biomarker approach was based on the assumption that any patient who was “ruled out” for cancer with the new model (i.e., intermediate risk according to the traditional Mayo Clinic assessment, but low risk according to the combination biomarker model) would undergo follow-up CT scans only, and any patient “ruled in” as having cancer (i.e., intermediate risk according to Mayo, but high risk according to combination biomarker model) would go directly to surgery or biopsy and have a confirmed cancer diagnosis at 30 days. Median time to diagnosis (time from nodule discovery to ascertainment of diagnosis) was calculated for the Mayo Clinic intermediate probability nodules ultimately diagnosed as malignant. Median time to diagnosis was then calculated for the same group which had been reclassified using the combination biomarker model. If the combination model correctly reclassified a malignant nodule into the high risk category, time to diagnosis was set to 30 days based on the previous assumption. In order to assess clinical management of benign nodules according to the combination model, one invasive procedure (bronchoscopy, endobronchial ultrasound and navigational bronchoscopy) was subtracted for each patient correctly reclassified as low risk who had an invasive procedure. One invasive procedure was added for each patient incorrectly reclassified as high risk who didn’t already have an invasive procedure.
Results
Study Population
Our study population included 111 patients from a histoplasmosis-endemic region (VUMC), and 170 patients from non-endemic regions (UPMC and DECAMP) (Table 1). Historical histoplasmosis prevalence was >90% in the VUMC cohort and <10% in the UPMC and DECAMP cohorts28. Cancer prevalence was higher in the histoplasmosis-endemic cohort at 75% (83/111) compared to 44% (75/170) in the non-endemic cohort. Characteristics of each site can be found in the supplement (Table S1).
Table 1.
Histoplasmosis-endemic and non-endemic study cohort characteristics
| Endemic (VUMC1, n=111) | Non-endemic (UPMC2 and DECAMP3, n=170) | |||
|---|---|---|---|---|
| Characteristic | Benign | Cancer | Benign | Cancer |
| Count, No. (%) | 28 (25) | 83 (75) | 95 (56) | 75 (44) |
| Age, median (IQR4), y | 64 (53–71) | 71 (65–75) | 68 (62–72) | 68 (63–76) |
| Current or Former Smoker, No. (%) | 24 (86) | 78 (94) | 95 (100) | 75 (100) |
| Previous Cancer, No. (%) | 6 (21) | 34 (41) | 17 (18) | 16 (21) |
| Located in Upper Lobe, No. (%) | 18 (64) | 51 (61) | 47 (49) | 41 (55) |
| Size, median (IQR4), mm | 16 (12–22) | 20 (15–23) | 11 (8–14) | 17 (13–21) |
| Spiculated, No. (%) | 9 (32) | 31 (37) | 27 (28) | 26 (35) |
| Gender (Male), No. (%) | 13 (46) | 48 (58) | 67 (71) | 53 (71) |
| Mayo Model Risk | ||||
| Risk score, median (IQR4) | 41 (17–65) | 64 (38–80) | 26 (14–47) | 44 (31–67) |
| Cancer Histology, No. (%) | ||||
| Adenocarcinoma | 49 (59) | 39 (52) | ||
| Squamous Cell | 17 (20) | 15 (20) | ||
| Small Cell | 11 (13) | 5 (7) | ||
| Large Cell | - | 5 (7) | ||
| Carcinoid | 2 (2) | 1 (1) | ||
| NSCLC | 1 (1) | 6 (8) | ||
| Other5 | 3 (4) | 4 (5) | ||
Vanderbilt University Medical Center
University of Pittsburgh Medical Center
Detection of Early Lung Cancer Among Military Personnel
IQR: interquartile range
Other: adenosquamous, adenomatous hyperplasia, neuroendocrine, mucoepidermoid, schwannoma, adenocarcinoma and squamous cell carcinoma simultaneous primary, mixed large cell/small cell neuroendocrine
Prediction Model Performance in Combined Study Population
The following results are presented in Table 2 and Figure 1. The apparent AUC for Mayo Clinic model alone in the combined population (n=281) was 0.73 (95% confidence interval, (0.67, 0.79)). When histoplasmosis IgM and IgG were added to the model, the AUC increased to 0.80 (0.74, 0.85) compared to Mayo Clinic model (p<0.01). Likewise, when radiomics was added to Mayo Clinic model, the AUC increased to 0.81 (0.76, 0.86) (p<0.01). The addition of hsCYFRA 21–1 to Mayo Clinic model also improved diagnostic accuracy with an AUC of 0.84 (0.79, 0.88) (p<0.01). When all predictor variables were combined (Mayo Clinic score, histoplasmosis IgM and IgG, radiomics, hsCYFRA 21–1), the model exhibited the greatest diagnostic performance with an apparent AUC of 0.89 (0.85, 0.92) (p<0.01). The combination biomarker model demonstrated a sensitivity of 68% (60%–75%), specificity of 89% (84%–95%), positive predictive value of 89% (84%–95%), and negative predictive value of 69% (61%–76%) based on Youden’s index.
Table 2.
Initial lung cancer prediction model diagnostic characteristics in endemic, non-endemic, and combined study cohorts
| Combined (n=281) | Endemic1 (n=111) | Non-endemic2 (n=170) | ||||
|---|---|---|---|---|---|---|
| AUC (95% CI) | p-value* | AUC (95% CI) | p-value* | AUC (95% CI) | p-value* | |
| Mayo | 0.73 (0.67, 0.79) | 0.70 (0.58, 0.81) | 0.70 (0.62, 0.78) | |||
| Mayo and Histoplasmosis | 0.80 (0.74, 0.85) | <0.01 | 0.78 (0.67, 0.89) | 0.10 | 0.71 (0.63, 0.79) | 0.40 |
| Mayo and Radiomics | 0.81 (0.76, 0.86) | <0.01 | 0.73 (0.62, 0.85) | 0.35 | 0.80 (0.74, 0.87) | <0.01 |
| Mayo and hsCYFRA 21–1 | 0.84 (0.79, 0.88) | <0.01 | 0.84 (0.76, 0.93) | <0.01 | 0.80 (0.73, 0.86) | <0.01 |
| Combination biomarker model3 | 0.89 (0.85, 0.92) | <0.01 | 0.91 (0.85, 0.96) | <0.01 | 0.85 (0.80, 0.91) | <0.01 |
AUC, Area under the receiver-operating characteristics curve
95% CI, 95% confidence interval
Endemic for Histoplasmosis
Not endemic for Histoplasmosis
Combination biomarker model including Mayo score, histoplasmosis IgG EIA, histoplasmosis IgM EIA, radiomic score, and hsCYFRA 21–1
For model vs. Mayo, Delong method
Figure 1. Receiver Operating Characteristics Curve Comparing Lung Cancer Prediction Models Among Combined (1a), Histoplasmosis-Endemic (1b), and Non-Endemic Cohorts (1c).
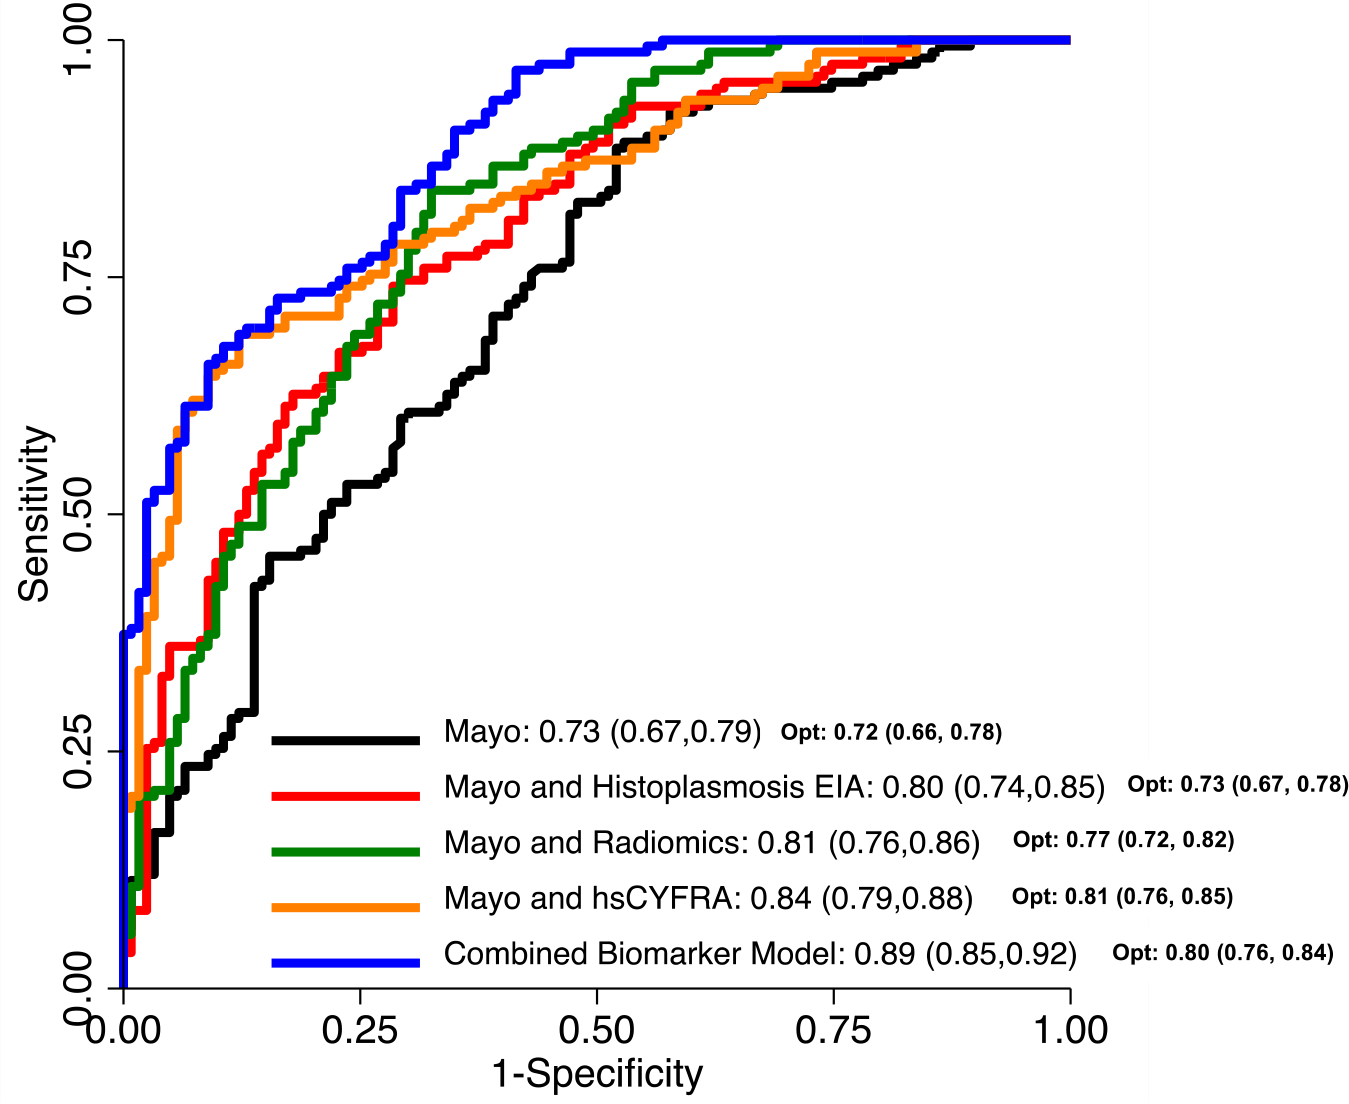


Figure 1a displays AUCs and optimism-corrected AUCs (opt) for lung cancer prediction models among the combined cohort (n=281). The combination biomarker model including Mayo, Histoplasmosis EIA, radiomics, and hsCYFRA 21–1 exhibits the greatest AUC. Figure 1b displays AUCs and optimism-corrected AUCs (opt) for lung cancer prediction models among the Histoplasmosis-endemic cohort (VUMC, n=111). The combination biomarker model including Mayo, Histoplasmosis EIA, radiomics, and hsCYFRA 21–1 exhibits the greatest AUC. Figure 1c displays AUCs and optimism-corrected AUCs (opt) for lung cancer prediction models among the non-endemic cohort (UPMC and DECAMP, n=170). The combination biomarker model including Mayo, Histoplasmosis EIA, radiomics, and hsCYFRA 21–1 exhibits the greatest AUC.
Figure 1a. Area under the receiver operating characteristics curves (AUCs) and optimism-corrected AUCs (opt) for lung cancer prediction models in the combined dataset (VUMC/UPMC/DECAMP, n=281)
Figure 1b. Area under the receiver operating characteristics curves (AUCs) and optimism-corrected AUCs (opt) for lung cancer prediction models in the endemic cohort (VUMC, n=111)
Figure 1c. Area under the receiver operating characteristics curves (AUCs) and optimism-corrected AUCs (opt) for lung cancer prediction models in the non-endemic cohorts (UPMC/DECAMP, n=170)
Prediction Model Performance in Histoplasmosis-Endemic Cohort
Within the histoplasmosis-endemic cohort (VUMC, n=111), the Mayo Clinic model demonstrated an apparent AUC of 0.70 (0.58, 0.81). When histoplasmosis IgM and IgG were added to the Mayo Clinic model, there was an improvement in diagnostic accuracy with an AUC of 0.78 (0.67, 0.89) (p=0.10). When radiomics was added, there was no significant improvement in model performance with an AUC of 0.73 (0.62, 0.85) (p=0.35). The addition of hsCYFRA 21–1 to the Mayo Clinic model displayed a greater increase in AUC to 0.84 (0.76, 0.93 (p<0.01). When all biomarkers were combined with the Mayo Clinic model, the prediction model demonstrated the best diagnostic accuracy with an AUC of 0.91 (0.85, 0.96) (p<0.01).
Prediction Model Performance in Non-Endemic Cohort
Within the non-endemic cohort (UPMC and DECAMP, n=170), the Mayo Clinic model had an apparent AUC of 0.70 (0.62, 0.78). When histoplasmosis IgM and IgG were added to the Mayo Clinic model, there was no significant change in model performance with an AUC of 0.71 (0.63, 0.79) (p=0.40). When radiomics was added to the model, the AUC increased to 0.80 (0.74, 0.87) (p<0.01). The addition of hsCYFRA 21–1 also resulted in an AUC increase to 0.80 (0.73, 0.86) (p<0.01). The addition of all biomarkers to the Mayo Clinic model resulted in the greatest improvement of diagnostic accuracy with an AUC of 0.85 (0.80, 0.91) (p<0.01).
Internal Validation
Each model was internally validated in the combined population (n=281), as well as the endemic and non-endemic cohorts. Bootstrap optimism corrected AUCs are provided in Table 3. In the combined population, the model performance as described by the AUC was overestimated to varying degrees. The Mayo Clinic model alone had minimal optimism (estimated AUC optimism at 0.006), while the other models were optimistic to varying degrees (estimated model optimism ranging from 0.03 to 0.087). The optimism in the AUC was negligible when assessed within the endemic and non-endemic cohorts separately (estimated optimism at 0.01 or less).
Table 3.
Enhanced bootstrap optimism corrected model diagnostic characteristics in endemic, non-endemic, and combined cohorts
| Combined (n=281) | Endemic1 (n=111) | Non-endemic2 (n=170) | ||||
|---|---|---|---|---|---|---|
| AUC (95% CI) | Opt. | AUC (95% CI) | Opt. | AUC (95% CI) | Opt. | |
| Mayo | 0.72 (0.66, 0.78) | 0.01 | 0.69 (0.57, 0.81) | <0.01 | 0.70 (0.62, 0.78) | <0.01 |
| Mayo and Histoplasmosis | 0.73 (0.67, 0.78) | 0.07 | 0.77 (0.66, 0.88) | 0.01 | 0.71 (0.64, 0.79) | <0.01 |
| Mayo and Radiomics | 0.77 (0.72, 0.82) | 0.04 | 0.73 (0.62, 0.85) | <0.01 | 0.80 (0.74, 0.87) | <0.01 |
| Mayo and hsCYFRA 21–1 | 0.81 (0.76, 0.85) | 0.03 | 0.85 (0.76, 0.93) | <0.01 | 0.80 (0.73, 0.86) | <0.01 |
| Combination biomarker model3 | 0.80 (0.76, 0.84) | 0.09 | 0.90 (0.85, 0.96) | <0.01 | 0.85 (0.80, 0.91) | <0.01 |
AUC, Area under the receiver-operating characteristics curve
95% CI, 95% confidence interval
Opt., AUC optimism estimated by enhanced bootstrapping with 500 bootstrap samples
Endemic for Histoplasmosis
Not endemic for Histoplasmosis
Combination biomarker model including Mayo score, histoplasmosis IgG EIA, histoplasmosis IgM EIA, radiomic score, and hsCYFRA 21–1
Reclassification
The combination biomarker model (Mayo Clinic score, histoplasmosis IgM and IgG, radiomics, hsCYFRA 21–1) showed improved reclassification of intermediate risk IPNs among benign and malignant nodules in all three cohorts with cNRIs of 0.11 and 0.16, respectively. There were no malignant nodules incorrectly reclassified as low risk (false negatives) using the combination biomarker model. Of the benign nodules which were categorized as intermediate risk according to the Mayo Clinic model, 7 were incorrectly reclassified as high risk (false positives) using the combination model.
Importantly, while not included in the mathematical cNRI equation, there were 5 benign nodules which would be classified as high risk according to the Mayo Clinic model and correctly classified as low risk using the combination model. Likewise, there was one malignant nodule categorized as low risk using the Mayo Clinic model and correctly classified as high risk with the combination model (Figure 2, Video 1).
Figure 2. Risk Reclassification for Malignant and Benign Nodules Using the Combination Biomarker Model (CBM).

Reclassification of malignant and benign IPNs by the CBM (x-axis: Mayo score, y-axis: CBM score). Vertical and horizontal lines represent 10% and 70% risk thresholds (<10% low, >70% high). Green boxes represent IPNs correctly reclassified as high risk for cancer (true positives) or low risk for benign (true negatives) using the CBM. Red boxes represent IPNs incorrectly reclassified as low risk for cancer (false negatives) or high risk for benign (false positives) using the CBM.
CBM, combination biomarker model (Mayo, Histoplasmosis IgM and IgG, radiomics, hsCYFRA 21–1)
Video 1. Description of nodule risk reclassification using a combination biomarker approach.
Clinical Utility and Management
Within the VUMC cohort a total of 18 invasive procedures were performed on patients with benign nodules in the Mayo Clinic-calculated intermediate probability group. When the combination biomarker model was applied, four nodules were correctly reclassified as low probability (three of these patients already had invasive procedures performed) and four were incorrectly reclassified as high risk (three already had invasive procedures). After subtracting the invasive procedures from patients who were correctly reclassified (3), and adding an invasive procedure for the one patient incorrectly reclassified as high risk with no invasive procedure yet, there was a total of 16 invasive procedures that would have been performed using the combination biomarker model (reduction of 2).
There were 49 patients in the VUMC cohort with malignant nodules categorized as intermediate risk prior to applying the combination biomarker model. The median time to diagnosis in this group was 49.5 days (IQR 21–79.5). When the combination biomarker model was applied, 40 patients were correctly reclassified as high risk with a median time to diagnosis of 30 days (IQR 30–30). This represented a reduced time to diagnosis of 19.5 days, or an 800 day potential reduction in time to diagnosis for all 40 patients.
Discussion
Non-invasive biomarkers are needed to improve the evaluation, risk stratification, and management of IPNs. We have demonstrated an improvement in the diagnostic accuracy of IPNs with a combination biomarker approach including clinical factors (Mayo Clinic model), fungal biomarkers (histoplasmosis IgG and IgM), an imaging biomarker (radiomics), and a cancer biomarker (hsCYFRA 21–1) compared to the current standard of risk estimation (Mayo Clinic model).
Furthermore, our study has highlighted the added value of accounting for population differences in a prediction model. The models investigated included an interaction term indicating the presence of endemic histoplasmosis in the region in which the patient was evaluated. As these models were estimated in a population containing patients from multiple geographic regions, this additional term allowed for differential effects of the predictor variables to be expressed.
Importantly it was the combination of all biomarkers that maximized the diagnostic accuracy of IPNs in both endemic and non-endemic regions, which enhances the generalizability of this model.
Of note, we did not include FDG-PET data in this study. While many patients will undergo PET scan for further evaluation, our group has previously found the specificity of FDG-PET in histoplasmosis-endemic regions to be significantly reduced29. Comparing the combined model to FDG-PET plus Mayo Clinic with the Herder model in endemic and non-endemic settings is a future endeavor.
In this study we investigated how a combination biomarker model would have performed in patients who were classified as intermediate risk according to the Mayo Clinic model. We demonstrated this model’s ability to correctly reclassify both benign and malignant nodules out of the Mayo Clinic model-determined intermediate probability category. This combination model has significant potential to serve as a clinically meaningful rule-in and rule-out test for cancer. Our study population included five patients with both histoplasmosis IgM and IgG positivity. Each of these patients had benign disease. Of these five patients, four were classified as intermediate risk and one as high risk based according to the Mayo Clinic model. When the combination model was applied, each of these five patients were correctly reclassified as low risk. This illustrates the combination biomarker model’s ability to avoid potentially unnecessary invasive procedures in these cases.
Regarding patients with malignant IPNs who were correctly reclassified as high risk using a combination model, we have demonstrated a potential reduction in time to diagnosis for cancer and avoidance of stage shift that can accompany delayed diagnosis. These findings were consistent with our clinical management analysis which demonstrated a reduction of two invasive procedures among Mayo Clinic model-intermediate benign nodules, and a reduction in time to diagnosis of 19.5 days among Mayo Clinic model-intermediate malignant nodules.
Although the combination biomarker model demonstrated a sensitivity of 68% and a specificity of 89%, an assessment of the entire risk score distribution revealed the combination approach is more likely to overestimate the risk of malignancy in benign nodules than underestimate the risk of malignancy in malignant nodules. Figure 2 highlights the distribution of risk scores for patients with malignant and benign nodules. The combination model did not produce any predicted risks below the lower threshold (0.1) for malignant nodules, while it did produce a number of predicted risks above the upper threshold (0.7) for benign nodules.
This study has several strengths including the addition of cancer, imaging, and fungal biomarkers into a single lung cancer prediction model. While previous work has investigated a combined biomarker model including hsCYFRA 21–1 and radiomics, the addition of histoplasmosis antibodies is a novel approach which has the potential for significant impact in endemic geographic regions. Furthermore, while the clinical utility of CYFRA 21–1 has been limited by low analytic sensitivity of the standard sensitivity assay traditionally performed by ELISA or electrochemiluminescence techniques, our group’s high sensitivity CYFRA 21–1 assay (hsCYFRA 21–1) utilizing Compensated Interferometric Reader (CIR) technology with pg/mL sensitivity, significantly improved the discriminatory power of the assay13. Finally, our study population included patients from both lung screening programs and nodule clinics, increasing generalizability.
There are several limitations of this study as well. The apparent AUC, which is calculated in the same sample of patients used to fit the prediction models, is often an overestimation of the ability of the model to discriminate between cancerous and benign IPNs. While the models were internally validated to account for this optimism, they require additional external validation. Furthermore, the optimism of the models likely tempers our conclusions to some degree. There are currently no validated methods for testing statistical differences between optimism-corrected AUCs from correlated predictions. It is important to note however, that the Delong, Delong, and Clarke-Pearson p-values and 95% confidence intervals used in this study do not invert in the same way as other traditional tests. That is, the confidence intervals for two AUCs can overlap but still result in a p-value less than 0.05. Therefore, while the improvements in model performance may be attenuated when corrected for optimism, an overlapping confidence interval does not necessarily indicate insignificance.
The majority of patients in our study came from tertiary care referral centers which could contribute to population or selection bias. Most of these patients were considered high risk and our endemic cohort contained a high prevalence of several lung cancer risk factors including smoking history, history of malignancy, and upper lobe nodules. The inclusion of this higher risk population likely limits the generalizability of our findings. Despite the inclusion of patients from multiple settings (i.e., screening programs and nodule clinics), the prevalence of cancer seen in our study cohorts may not fully represent the prevalence in the general population. Furthermore, although the DECAMP cohort contains a mix of screening and incidentally discovered nodules, these patients were made available as a case-control cohort, which likely further impacts our results. Therefore, the generalizability of our results may still remain limited to higher risk IPN cohorts. Endemic histoplasmosis was defined by historic prevalence and may not reflect modern mobile populations nor did we consider other endemic mycotic lung disease, which we leave for future investigation. Additionally, future work should focus on optimizing radiomics in histoplasmosis-endemic regions. Finally, having evidence of histoplasmosis exposure does not rule out cancer; co-occurrence is possible, although exceedingly rare.
In order for biomarkers to be used in clinical practice, various phases of development must occur. These phases include discovery, analytical validation, clinical validation, and clinical utility30. The next step before widespread clinical implementation of a combination biomarker model will be a prospective study to determine clinical utility. This trial, which is currently in the planning phase, would also help investigate the cost of a combination model. A combined biomarker approach would serve to provide the clinician with complete and accurate information in order to use clinical judgement in determining next steps related to IPN management. These next steps would likely be in accordance with guideline-based care.
In conclusion, the utilization of a combination biomarker model including clinical factors (Mayo Clinic model), fungal biomarkers (Histoplasmosis IgG and IgM), an imaging biomarker (radiomics), and a cancer biomarker (hsCYFRA 21–1) may improve the evaluation, risk stratification, and subsequent management of IPNs. While further work and validation is required, integrating a combination biomarker approach into the current diagnostic algorithm of IPNs could lead to a decrease in the number of invasive procedures performed for benign nodules and reduction in time to diagnosis for cancer.
Supplementary Material
Supplemental Figure S1. Study population cohort flow diagrams
Supplemental Table S1. Individual study cohort characteristics
Supplemental Figure S2. Calibration curves for each prediction model in combined dataset (apparent and bias-corrected via Bootstrap (B=500))
Supplemental Table S2. IPN classification numbers according to the Mayo Model
Supplemental Table S3. IPN classification numbers according to the Full Combined Model
Supplemental Table S4. IPN Risk Reclassification for Benign Nodules
Supplemental Table S5. IPN Risk Reclassification for Malignant Nodules
Figure 3. Graphical abstract demonstrating improved diagnostic accuracy of IPNs with a combination clinical risk factor plus imaging, cancer, and fungal biomarker approach.

Central picture:
Combination biomarker model AUCs for lung cancer prediction in patients with IPNs (n=281)
Central message:
Cancer, fungal and imaging biomarkers added to a standard clinical prediction model (Mayo Clinic model) improve diagnostic accuracy and clinical management of indeterminate pulmonary nodules.
Perspective statement:
Indeterminate pulmonary nodules (IPNs) often require costly and invasive testing to obtain a diagnosis, representing a significant patient and financial burden in healthcare, especially in regions endemic for pulmonary fungal disease such as histoplasmosis. We demonstrated greater diagnostic accuracy of IPNs using a combination biomarker approach including cancer, fungal and imaging biomarkers.
Funding:
This work is supported by U01CA152662 (Grogan and Deppen) and T32CA106183–18 (Marmor).
Abbreviations:
- IPN
indeterminate pulmonary nodule
- CT
computed tomography
- cNRI
clinical net reclassification index
- hsCYFRA 21–1
high sensitivity cytokeratin fraction 21
- EIA
enzyme immunoassay
- IgG
immunoglobulin G
- IgM
immunoglobulin M
- VUMC
Vanderbilt University Medical Center
- UPMC
University of Pittsburgh Medical Center
- DECAMP
Detection of Early Lung Cancer Among Military Personnel
- AUC
area under the receiver operating characteristics curve
- EHR
electronic healthcare record
- IQR
interquartile range
Footnotes
IRB Approval: This study was approved by the VUMC IRB #030763 (12/21/2021) and 000616 (2/8/2022) and separate IRB’s from participating sites.
Informed consent: All patients were consented to have biological specimens and clinical data used for future research.
References
- 1.Gould MK, Tang T, Liu ILA, et al. Recent Trends in the Identification of Incidental Pulmonary Nodules. Am J Respir Crit Care Med. 2015;192(10):1208–1214. doi: 10.1164/rccm.201505-0990OC [DOI] [PubMed] [Google Scholar]
- 2.Verdial FC, Madtes DK, Cheng GS, et al. Multidisciplinary Team-Based Management of Incidentally Detected Lung Nodules. Chest. 2020;157(4):985–993. doi: 10.1016/j.chest.2019.11.032 [DOI] [PMC free article] [PubMed] [Google Scholar]
- 3.Sung H, Ferlay J, Siegel RL, et al. Global Cancer Statistics 2020: GLOBOCAN Estimates of Incidence and Mortality Worldwide for 36 Cancers in 185 Countries. CA Cancer J Clin. 2021;71(3):209–249. doi: 10.3322/caac.21660 [DOI] [PubMed] [Google Scholar]
- 4.Choi HK, Ghobrial M, Mazzone PJ. Models to Estimate the Probability of Malignancy in Patients with Pulmonary Nodules. Ann Am Thorac Soc. 2018;15(10):1117–1126. doi: 10.1513/AnnalsATS.201803-173CME [DOI] [PubMed] [Google Scholar]
- 5.Tanner NT, Porter A, Gould MK, Li XJ, Vachani A, Silvestri GA. Physician Assessment of Pretest Probability of Malignancy and Adherence With Guidelines for Pulmonary Nodule Evaluation. Chest. 2017;152(2):263–270. doi: 10.1016/j.chest.2017.01.018 [DOI] [PMC free article] [PubMed] [Google Scholar]
- 6.Network, N.C.C. Non-Small Cell Lung Cancer. NCCN Clinical Practice Guidelines in Oncology, 2021. Version 4.2021.
- 7.Gould MK, Donington J, Lynch WR, et al. Evaluation of individuals with pulmonary nodules: when is it lung cancer? Diagnosis and management of lung cancer, 3rd ed: American College of Chest Physicians evidence-based clinical practice guidelines. Chest. 2013;143(5 Suppl):e93S–e120S. doi: 10.1378/chest.12-2351 [DOI] [PMC free article] [PubMed] [Google Scholar]
- 8.Massion PP, Walker RC. Indeterminate pulmonary nodules: risk for having or for developing lung cancer? Cancer Prev Res (Phila). 2014;7(12):1173–1178. doi: 10.1158/1940-6207.CAPR-14-0364 [DOI] [PMC free article] [PubMed] [Google Scholar]
- 9.Kanaji N, Kadota K, Tadokoro A, et al. Serum CYFRA 21–1 but not Vimentin is Associated with Poor Prognosis in Advanced Lung Cancer Patients. Open Respir Med J. 2019;13:31–37. doi: 10.2174/1874306401913010031 [DOI] [PMC free article] [PubMed] [Google Scholar]
- 10.Szturmowicz M, Rudziński P, Kacprzak A, et al. Prognostic value of serum C-reactive protein (CRP) and cytokeratin 19 fragments (Cyfra 21–1) but not carcinoembryonic antigen (CEA) in surgically treated patients with non-small cell lung cancer. Pneumonol Alergol Pol. 2014;82(5):422–429. doi: 10.5603/PiAP.2014.0055 [DOI] [PubMed] [Google Scholar]
- 11.Shirasu H, Ono A, Omae K, et al. CYFRA 21–1 predicts the efficacy of nivolumab in patients with advanced lung adenocarcinoma. Tumour Biol. 2018;40(2):101042831876042. doi: 10.1177/1010428318760420 [DOI] [PubMed] [Google Scholar]
- 12.Paez R, Kammer MN, Massion P. Risk stratification of indeterminate pulmonary nodules. Current Opinion in Pulmonary Medicine. 2021;27(4):240–248. doi: 10.1097/MCP.0000000000000780 [DOI] [PubMed] [Google Scholar]
- 13.Kammer MN, Lakhani DA, Balar AB, et al. Integrated Biomarkers for the Management of Indeterminate Pulmonary Nodules. Am J Respir Crit Care Med. Published online August 31, 2021. doi: 10.1164/rccm.202012-4438OC [DOI] [PMC free article] [PubMed] [Google Scholar]
- 14.Maldonado F, Varghese C, Rajagopalan S, et al. Validation of the BRODERS classifier (Benign versus aggRessive nODule Evaluation using Radiomic Stratification), a novel HRCT-based radiomic classifier for indeterminate pulmonary nodules. Eur Respir J. 2021;57(4):2002485. doi: 10.1183/13993003.02485-2020 [DOI] [PMC free article] [PubMed] [Google Scholar]
- 15.Massion PP, Antic S, Ather S, et al. Assessing the Accuracy of a Deep Learning Method to Risk Stratify Indeterminate Pulmonary Nodules. Am J Respir Crit Care Med. 2020;202(2):241–249. doi: 10.1164/rccm.201903-0505OC [DOI] [PMC free article] [PubMed] [Google Scholar]
- 16.Deppen SA, Massion PP, Blume J, et al. Accuracy of a Novel Histoplasmosis Enzyme Immunoassay to Evaluate Suspicious Lung Nodules. Cancer Epidemiol Biomarkers Prev. 2019;28(2):321–326. doi: 10.1158/1055-9965.EPI-18-0169 [DOI] [PMC free article] [PubMed] [Google Scholar]
- 17.Starnes SL, Reed MF, Meyer CA, et al. Can lung cancer screening by computed tomography be effective in areas with endemic histoplasmosis? J Thorac Cardiovasc Surg. 2011;141(3):688–693. doi: 10.1016/j.jtcvs.2010.08.045 [DOI] [PubMed] [Google Scholar]
- 18.Shipe ME, Deppen SA, Sullivan S, et al. Validation of Histoplasmosis Enzyme Immunoassay to Evaluate Suspicious Lung Nodules. Ann Thorac Surg. 2021;111(2):416–420. doi: 10.1016/j.athoracsur.2020.05.101 [DOI] [PMC free article] [PubMed] [Google Scholar]
- 19.Pepe MS, Feng Z, Janes H, Bossuyt PM, Potter JD. Pivotal evaluation of the accuracy of a biomarker used for classification or prediction: standards for study design. J Natl Cancer Inst. 2008;100(20):1432–1438. doi: 10.1093/jnci/djn326 [DOI] [PMC free article] [PubMed] [Google Scholar]
- 20.Billatos E, Duan F, Moses E, et al. Detection of early lung cancer among military personnel (DECAMP) consortium: study protocols. BMC Pulm Med. 2019;19(1):59. doi: 10.1186/s12890-019-0825-7 [DOI] [PMC free article] [PubMed] [Google Scholar]
- 21.Richer SM, Smedema ML, Durkin MM, et al. Improved Diagnosis of Acute Pulmonary Histoplasmosis by Combining Antigen and Antibody Detection. Clin Infect Dis. 2016;62(7):896–902. doi: 10.1093/cid/ciw007 [DOI] [PMC free article] [PubMed] [Google Scholar]
- 22.Kammer MN, Kussrow AK, Webster RL, et al. Compensated Interferometry Measures of CYFRA 21–1 Improve Diagnosis of Lung Cancer. ACS Comb Sci. 2019;21(6):465–472. doi: 10.1021/acscombsci.9b00022 [DOI] [PubMed] [Google Scholar]
- 23.Swensen SJ, Silverstein MD, Ilstrup DM, Schleck CD, Edell ES. The probability of malignancy in solitary pulmonary nodules. Application to small radiologically indeterminate nodules. Arch Intern Med. 1997;157(8):849–855. [PubMed] [Google Scholar]
- 24.Efron B Estimating the Error Rate of a Prediction Rule: Improvement on Cross-Validation. Journal of the American Statistical Association. 1983;78(382):316–331. doi: 10.1080/01621459.1983.10477973 [DOI] [Google Scholar]
- 25.Harrell FE. Regression Modeling Strategies: With Applications to Linear Models, Logistic Regression, and Survival Analysis.
- 26.Baldwin DR, Callister MEJ, Guideline Development Group. The British Thoracic Society guidelines on the investigation and management of pulmonary nodules. Thorax. 2015;70(8):794–798. doi: 10.1136/thoraxjnl-2015-207221 [DOI] [PubMed] [Google Scholar]
- 27.Paynter NP, Cook NR. Adding tests to risk based guidelines: evaluating improvements in prediction for an intermediate risk group. BMJ. Published online September 7, 2016:i4450. doi: 10.1136/bmj.i4450 [DOI] [PMC free article] [PubMed] [Google Scholar]
- 28.Edwards LB, Acquaviva FA, Livesay VT, Cross FW, Palmer CE. An atlas of sensitivity to tuberculin, PPD-B, and histoplasmin in the United States. Am Rev Respir Dis. 1969;99(4):Suppl:1–132. [PubMed] [Google Scholar]
- 29.Grogan EL, Deppen SA, Ballman KV, et al. Accuracy of fluorodeoxyglucose-positron emission tomography within the clinical practice of the American College of Surgeons Oncology Group Z4031 trial to diagnose clinical stage I non-small cell lung cancer. Ann Thorac Surg. 2014;97(4):1142–1148. doi: 10.1016/j.athoracsur.2013.12.043 [DOI] [PMC free article] [PubMed] [Google Scholar]
- 30.Mazzone PJ, Sears CR, Arenberg DA, et al. Evaluating Molecular Biomarkers for the Early Detection of Lung Cancer: When Is a Biomarker Ready for Clinical Use? An Official American Thoracic Society Policy Statement. Am J Respir Crit Care Med. 2017;196(7):e15–e29. doi: 10.1164/rccm.201708-1678ST [DOI] [PMC free article] [PubMed] [Google Scholar]
Associated Data
This section collects any data citations, data availability statements, or supplementary materials included in this article.
Supplementary Materials
Supplemental Figure S1. Study population cohort flow diagrams
Supplemental Table S1. Individual study cohort characteristics
Supplemental Figure S2. Calibration curves for each prediction model in combined dataset (apparent and bias-corrected via Bootstrap (B=500))
Supplemental Table S2. IPN classification numbers according to the Mayo Model
Supplemental Table S3. IPN classification numbers according to the Full Combined Model
Supplemental Table S4. IPN Risk Reclassification for Benign Nodules
Supplemental Table S5. IPN Risk Reclassification for Malignant Nodules