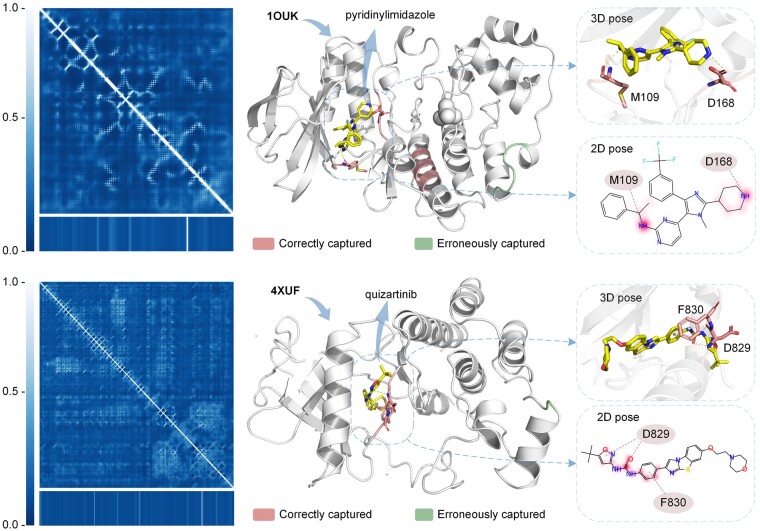
Figure 3.
Visualization of attention weights for DP pairs. The upper part represents the MAP kinase p38 alpha and its binding ligand pyridinylimidazole inhibitor (PDB ID: 1OUK), and the lower part represents the protein FMS-like tyrosine kinase 3 protein and its binding ligand quizartinib inhibitor (PDB ID: 4XUF). In the figure, the left is the contact map, where the bottom is the corresponding attention value. On the right are the crystal structure, 2D pose, and 3D pose of the protein and its ligand-bound state. In the crystal structure, the top 20 residues of the attention weight are highlighted in red and cyan, with red indicating the correct region captured by the model and cyan indicating the wrong region. 3D pose and 2D pose show confirmed interactions and interacted residues. The 2D pose also shows the attention weights of the drug highlighted in red, with shades of color representing the magnitude of the weights.

