

Abstract
Numerous imaging modules are utilized to study changes that occur during cellular processes. Besides qualitative (immunohistochemical) or semiquantitative (Western blot) approaches, direct quantitation method(s) for detecting and analyzing signal intensities for disease(s) biomarkers are lacking. Thus, there is a need to develop method(s) to quantitate specific signals and eliminate noise during live tissue imaging. An increase in reactive oxygen species (ROS) such as superoxide (O2•-) radicals results in oxidative damage of biomolecules, which leads to oxidative stress. This can be detected by dihydroethidium staining in live tissue(s), which does not rely on fixation and helps prevent stress on tissues. However, the signal-to-noise ratio is reduced in live tissue staining. We employ the Drosophila eye model of Alzheimer's disease as a proof of concept to quantitate ROS in live tissue by adapting an unbiased method. The method presented here has a potential application for other live tissue fluorescent images.
Keywords: Alzheimer's disease, automated quantitation, confocal microscopy, dihydroethidium, Drosophila, ImageJ, live cell imaging, neurodegeneration, oxidative stress, reactive oxygen species
METHOD SUMMARY
We present an imaging method and quantification strategy to assess oxidative stress using a fluorescent probe for quantitation of superoxide (O2•-), that is, reactive oxygen species during live cell imaging in the Drosophila eye model of Alzheimer's disease. We attempted to reduce noise in signal during live cell imaging by employing an unbiased automated quantitation strategy. Here, we employed the Fiji/ ImageJ method to perform an unbiased quantitation.
Fluorescent imaging is an important microscopy tool that helps to study several important questions in cell biology. Many new applications are being developed to address challenges pertaining to the specificity and sensitivity (i.e., reduced signal-to-noise ratio) of new techniques. Specifically, fluorescent dyes and stains are repurposed to improve existing techniques and assays. Nonetheless, many such assays cannot provide quantitative data because of reduced signal-to-noise ratio. Generally, immunohistochemistry (IHC) involves fixing the tissue, followed by blocking the tissue to prevent nonspecific signals. However, in the case of live cell/tissue imaging, the fluorescent probe used requires neither fixing nor blocking of the tissue. However, this results in an increase in the background noise.
ROS is a term used for an array of derivatives of molecular oxygen that serve as a reliable biomarkers for oxidative stress [1]. ROS are metabolic by-products that are normally produced during cellular respiration. Chemically, ROS comprise reactive O2 molecules that include superoxide (O2•-), hydrogen peroxide (H2O2) molecules, hydroxyl radical (HO•) and hydroxyl ion (OH-). Under normal conditions, there is a balance between ROS levels and antioxidant(s) such as catalase and superoxide dismutase that neutralize ROS. Disruption of this equilibrium in several pathological scenarios leads to increased ROS levels that cause damage to biomolecules and often lead to cell death due to increased oxidative stress. ROS is randomly generated in tissues and exhibits low signal-to-noise ratio during live cell imaging. Although ROS detection has been used as a qualitative assay, the quantitation of signals suffers consistency challenges due to increased noise. Therefore, it is difficult to quantitate precisely and in an unbiased manner.
Increased oxidative stress due to higher levels of ROS during mitochondrial and/or electron transport chain dysfunction have emerged as some of the main contributors of aging and diseases [2–4]. This dysfunction caused by increased ROS levels has been observed in neurodegenerative diseases including Alzheimer's disease (AD) [4–7]. Excessive ROS production in neurodegenerative diseases may be due to aberrant activation of signaling pathways that results in progressive neuronal death [6–10]. We have previously shown that the evolutionarily conserved Hippo pathway, known for growth regulation [11], is activated in AD and other neurodegenerative disorders [12–14]. In addition, Hippo signaling acts synergistically with another evolutionarily conserved c-Jun-amino-terminal-(NH2)-kinase (JNK) signaling pathway and triggers cell death [12,13]. Oxidative stress also induces the MST1-FOXO signaling pathway and thereby results in neuronal cell death [15]. Increased ROS levels lead to damage and oxidative modification of biomolecules in tissue and are associated with AD pathology [16]. Therefore, it is important to study ROS levels during oxidative stress in neurodegenerative diseases such as AD.
Studying levels of ROS generated is challenging due to its transient nature and high reactivity [17]. Several studies have used fluorescent dyes and chemiluminescent probes which interact with ROS in live cells or tissues [18,19]. One such fluorescent dye, dihydroethidium (DHE), is readily permeable in live cells or tissues and normally exhibits blue fluorescence in the cytosol until it gets oxidized. In the presence of cellular O2•-, DHE is oxidized to form 2-hydroxyethidium (2-OH-E+; excitation 500–530/emission 590–620 nm) and intercalates to nucleic acid to emit a red fluorescent signal [20,21]. Thus, DHE staining helps assess ROS levels present in cells by using O2•- as a surrogate marker. As shown previously, DHE assay detects even minimal ROS in wild-type control, Canton-S, and alternatively, shows higher ROS levels in the positive control [22,23]. However, the stability of DHE derived fluorescent intensity is transient [24]. Furthermore, DHE also exhibits nonspecific oxidation by other sources of ROS to form ethidium (E+; excitation 480/emission 576 nm), but the wavelength is different and can be distinguished.
Even with such qualitative assays, generation of ROS that triggers oxidative stress is not easy to quantitate because it is highly unstable and requires live cell imaging. In live cell imaging, the samples are neither fixed nor blocked, which results in higher background noise compared with fixed tissues. Harsher treatment(s) or stress during tissue dissection is also a concern that could increase stress-induced ROS in tissues and may contribute to inaccurate results. DHE partially helps to overcome this challenge as it is readily permeable in cells and tissues and is highly sensitive to superoxide anions. Even though efforts have been made to improve methods to study such signals, better quantitation methods for studying such signals in stained tissues are needed. Furthermore, differences in methods across labs, inconsistent handling of samples, nonuniform binding of dye, among other issues, lead to inaccurate and irreproducible results. Other techniques such as semiquantitative traditional/quantitative Western blots can only study levels of protein expression that cannot be performed spatially in real time [25]. Use of dye-based assays to detect ROS are highly popular but relatively qualitative. Therefore, the best option is to use an unbiased automated quantitation approach.
Here, we present quantitation of DHE staining signals by adapting a Fiji/ImageJ method. We have used the Drosophila melanogaster (aka the fruit fly) eye as a model to study and quantitate ROS, a salient feature of neurodegeneration. Our data is a proof of concept that can be employed to any live imaging signals upon standardization of thresholds. D. melanogaster has served as an established, versatile model organism to study human neurodegenerative diseases [13,14,26,27]. This organism's faster reproduction rate, inexpensive cost to rear and genetic conservation makes it useful to study human disease(s) [26–28]. This report discusses DHE staining in live tissue, ROS (O2•-) detection and automated quantitation using Fiji/ImageJ method [29] to detect and compare ROS levels in the Drosophila eye model of AD.
Materials & methods
Stocks
All the fly stocks used in this study are listed in Flybase [30]. The stocks used were: GMR-hid; GMR-Gal4 (a gift from Dr Chun-Hong Chen), GMR-Gal4 [31], UAS-Aβ42 [32,33], GMR-Gal4>UAS-Aβ42 (GMR>Aβ42) [34] UAS-hpo [35] and UAS-hpoRNAi [36]. Canton-S was used as a wild-type control in the study.
Genetic crosses
We employed Gal4/UAS system for targeted misexpression of the gene(s) of interest [37]. Glass Multiple Repeat (GMR) Gal4 driver was used to misexpress human amyloid beta 42 transgene (UAS- Aβ42) in the differentiating retinal neurons (hereafter GMR>Aβ42) with 100% penetrance of phenotype [5,31,33]. We utilized ROS levels as a biomarker for stress in the dying neurons. Furthermore, we modulate levels of hippo (hpo), a genetic modifier of GMR>Aβ42 mediated neurodegeneration in Drosophila eye model of Alzheimer's disease [13], by using UAS-hpo and UAS-hpoRNAi. We used the Canton-S and GMR-hid; GMR-Gal4 stocks as negative and positive controls, respectively. All these cultures were maintained at 18, 25 and 29°C to facilitate different levels of transgene expression [38,39].
DHE staining
The eye-antennal imaginal discs were dissected from the wandering third instar larva [10] in fresh cold 1× Schneider's Drosophila medium (Gibco, cat. no. 21720024, Thermo Fisher Scientific, MA, USA), which is commonly used for the imaginal disc growth and culture of Drosophila S2 cells. It maintains physiological pH and reduces stress on tissues. The samples were incubated in DHE (Life Technologies cat. no. D11347, CA, USA) dye solution (1:300 in 1× phosphate-buffered saline [PBS]) [22] for 5 min and washed thoroughly three times with cold 1× PBS. The eye discs were then dissected and separated from the mouth hooks. The eye discs were imaged immediately on a Laser Scanning Confocal microscope (Olympus Fluoview 3000, Shinjuku-ku, Tokyo, Japan) to keep the structure, function and physiological state of the tissue intact. It is important to note that rearing of stocks at the same temperature, using freshly prepared chemicals or reagents, consistent timing for processing tissues, quick mounting, and so forth can minimize batch-to-batch variation in the results. We have listed some of the frequently faced issues and their potential solutions in Table 1 (stock solutions: DHE solution: 1 mg of DHE in 660 μl of DMSO 5 mM; 10× PBS: NaCl: 80 g, KCl: 2 g, Na2HPO4: 6.1 g, KH2PO4: 2 g, dissolved in 1 l of water, pH 7.4).
Table 1. . Summary of potential challenges in dihydroethidium protocol and troubleshooting methods: problems and possible solutions.
| Stages | Problem(s) | Probable reasons | Troubleshooting |
|---|---|---|---|
| Dissection | More ROS production in negative control | Harsh handling of the tissue or injury could lead to aberrant ROS production | Dissection should be done carefully without damaging the tissue |
| Mounting | Air bubble in the tissue | i. Mount the tissue carefully without any air bubble, push the air bubble aside ii. Put the coverslip gently first by making 45° angle and then by gently placing it over the tissue |
|
| Imaging | Tissue gets disintegrated | This is a live staining with no tissue fixation. Therefore, any damage or disintegration of tissue can be due to improper chemical or longer incubation | i. 1× phosphate-buffered saline should be freshly prepared ii. Mounting should be done quickly |
| Imaging | Faint or high signal | It could be due to incorrect DHE concentration. Alternatively, the confocal imaging settings may require optimization | i. Optimize the dilution of the DHE dye ii. Change the gain or high-voltage settings during imaging |
DHE: Dihydroethidium; ROS: Reactive oxygen species.
Image analysis
Imaging was conducted by using fluorescent settings in laser scanning confocal microscope [40]. The parameters such as layouts, objective lens (20×), aspect ratio, scanning speed, focus, color look-up table (LUT), high-voltage (HV), gain, offset, intensities of all the lasers and photomultiplier tube (PMT) detectors were optimized and set to avoid excessive or weak signal. The Hi–Lo feature in the software was used to assess the intensity saturation of the lasers hitting the sample. The Fiji/ImageJ freeware software was used for automated quantitation [29]. It involves the image visualization in grayscale, selection of the region of interest (ROI) using the polygon tool, filtering the background noise and using the interactive watershed algorithm to perform segmentation and to identify each signal as an ROI. It was followed by particle analysis to get the specific parameters such as area, integrated density and the number of puncta. For automated quantitation, we optimized the settings and found that the following settings were ideal across all experimental groups used in the study. These settings include seed dynamics: 30; intensity threshold: 35; peak flooding: 50; and no splitting. For manual quantitation, three independent blinded counts were performed and analyzed. All quantitation and analysis were performed with five eye imaginal discs for each genotype analyzed. Statistical analysis was performed using Student's t-test in Microsoft Excel, and graphs were plotted using GraphPad Prism [41–43]. Statistical significance in each graph is shown by p-value: ***p < 0.001; **p < 0.01; *p < 0.05. Magnification of all eye imaginal discs is 20×.
Results & discussion
A salient feature of neurodegenerative diseases like AD is increased oxidative stress in response to increased ROS generation due to Aβ42 plaques accumulation, which in turn triggers neuronal cell death. This increased oxidative stress due to increased ROS levels results in modification of biomolecules and other compounds in tissue, and is associated with AD pathology [16]. Therefore, detection of ROS can serve as a reliable marker for neurodegeneration. However, ROS generation occurs dynamically and therefore can be detected in live tissue(s). Thus, if ROS can be detected and quantitated precisely, it can serve as a biomarker for qualitative as well as quantitative detection of neurodegeneration in live cells /tissues. Therefore, fluorescent probes to detect ROS can serve as an excellent tool.
The DHE staining involves the use of DHE as a fluorescent probe to detect ROS in live tissue. We used this assay to detect Aβ42-mediated neurodegeneration in retinal neurons using the Drosophila eye model [7,33]. We wanted to develop a reliable method to quantitate ROS using live cell imaging in developing Drosophila eye imaginal disc. The adult compound eye of Drosophila develops from an eye-antennal imaginal disc housed inside the larva [26,38,44,45]. The DHE staining detects ROS and is observed as distinct fluorescent puncta in biological tissues. Generally, there is no established or validated method to quantitate puncta apart from manual counting. To achieve unbiased and consistent quantitation from such expression-based imaging studies using a fluorochrome, we have used the Fiji/ ImageJ software and a semiautomated quantitation method [29]. Using interactive H-watershed segmentation via Fiji/ ImageJ is a relatively faster approach to accurately analyze more datasets compared with other quantitation methods.
We first established the ideal settings for imaging (described in the ‘Materials & methods' section), which should be consistent and reproducible for all the experimental groups. We found that any change(s) in these settings for image acquisition from one batch to another could result in dramatic changes in ROS quantitation as shown in Figure 1. Thus, it is crucial to have consistency in ROS quantitation in all the experimental conditions. To optimize the signal intensity during imaging, we used the HiLo feature on the confocal microscopy to identify signal saturation (Figure 2A). We used three exposure settings (HV, photomultiplier tube voltage setting) to understand how these settings affect imaging and quantitation of ROS puncta. Low exposure (low HV setting), high exposure (high HV setting, highly saturated signal: red saturation in image) and optimal exposure (optimal signal by using ideal HV setting such that there was no saturation) were the three settings used (Figure 1A–C). For sensitivity comparison of the three levels of HV, we used the GMR-hid; GMR-Gal4 genotype that serves as a positive control for ROS [22]. As shown previously, misexpression of hid in GMR-hid; GMR-Gal4 genotype initiates the apoptotic process and subsequently activates JNK signaling via dronc activation. The study clearly reports that hid induced apoptosis triggers ROS generation in tissues and is detectable for up to 24 h after apoptosis induction [22]. Therefore, we used GMR-hid; GMR-Gal4, as a positive control, to optimize the quantitation and imaging settings. As expected, we observed an increasing trend in the number of puncta (Figure 1D), integrated density (Figure 1E) and area (Figure 1F) across low, optimal and high voltage groups. The number of ROS puncta in low and high groups were significantly lower and higher, respectively, than the ones in the optimum setting (Figure 1D). In low exposure, weaker signals were lost and thus showed lower puncta number and intensity compared with the actual signal. In higher exposure, the signals got saturated and led to the merging of puncta that were closer to each other. This not only contributed to higher average area and intensity but also to significantly higher number of puncta due to additional artifacts. Moreover, if the ROS levels were higher in any genotype, we observed that puncta appeared merged, and they become indistinct which potentially made analyses inaccurate. For integrated density and area, average of all signals for each disc was used to plot the graph, and it showed a nonsignificant increase in signals across groups (Figure 1E & F). Because ROS are observed as random puncta, it is suitable to quantitate the number and not the area or integrated density. Therefore, for any image with distinct puncta or aggregates, quantitation using numbers is more reliable. Hence optimizing the HV setting and ideal saturation is an important step during imaging and a prerequisite for accurate quantitation (Figure 1).
Figure 1. . Ideal imaging conditions are required to quantify reactive oxygen species.
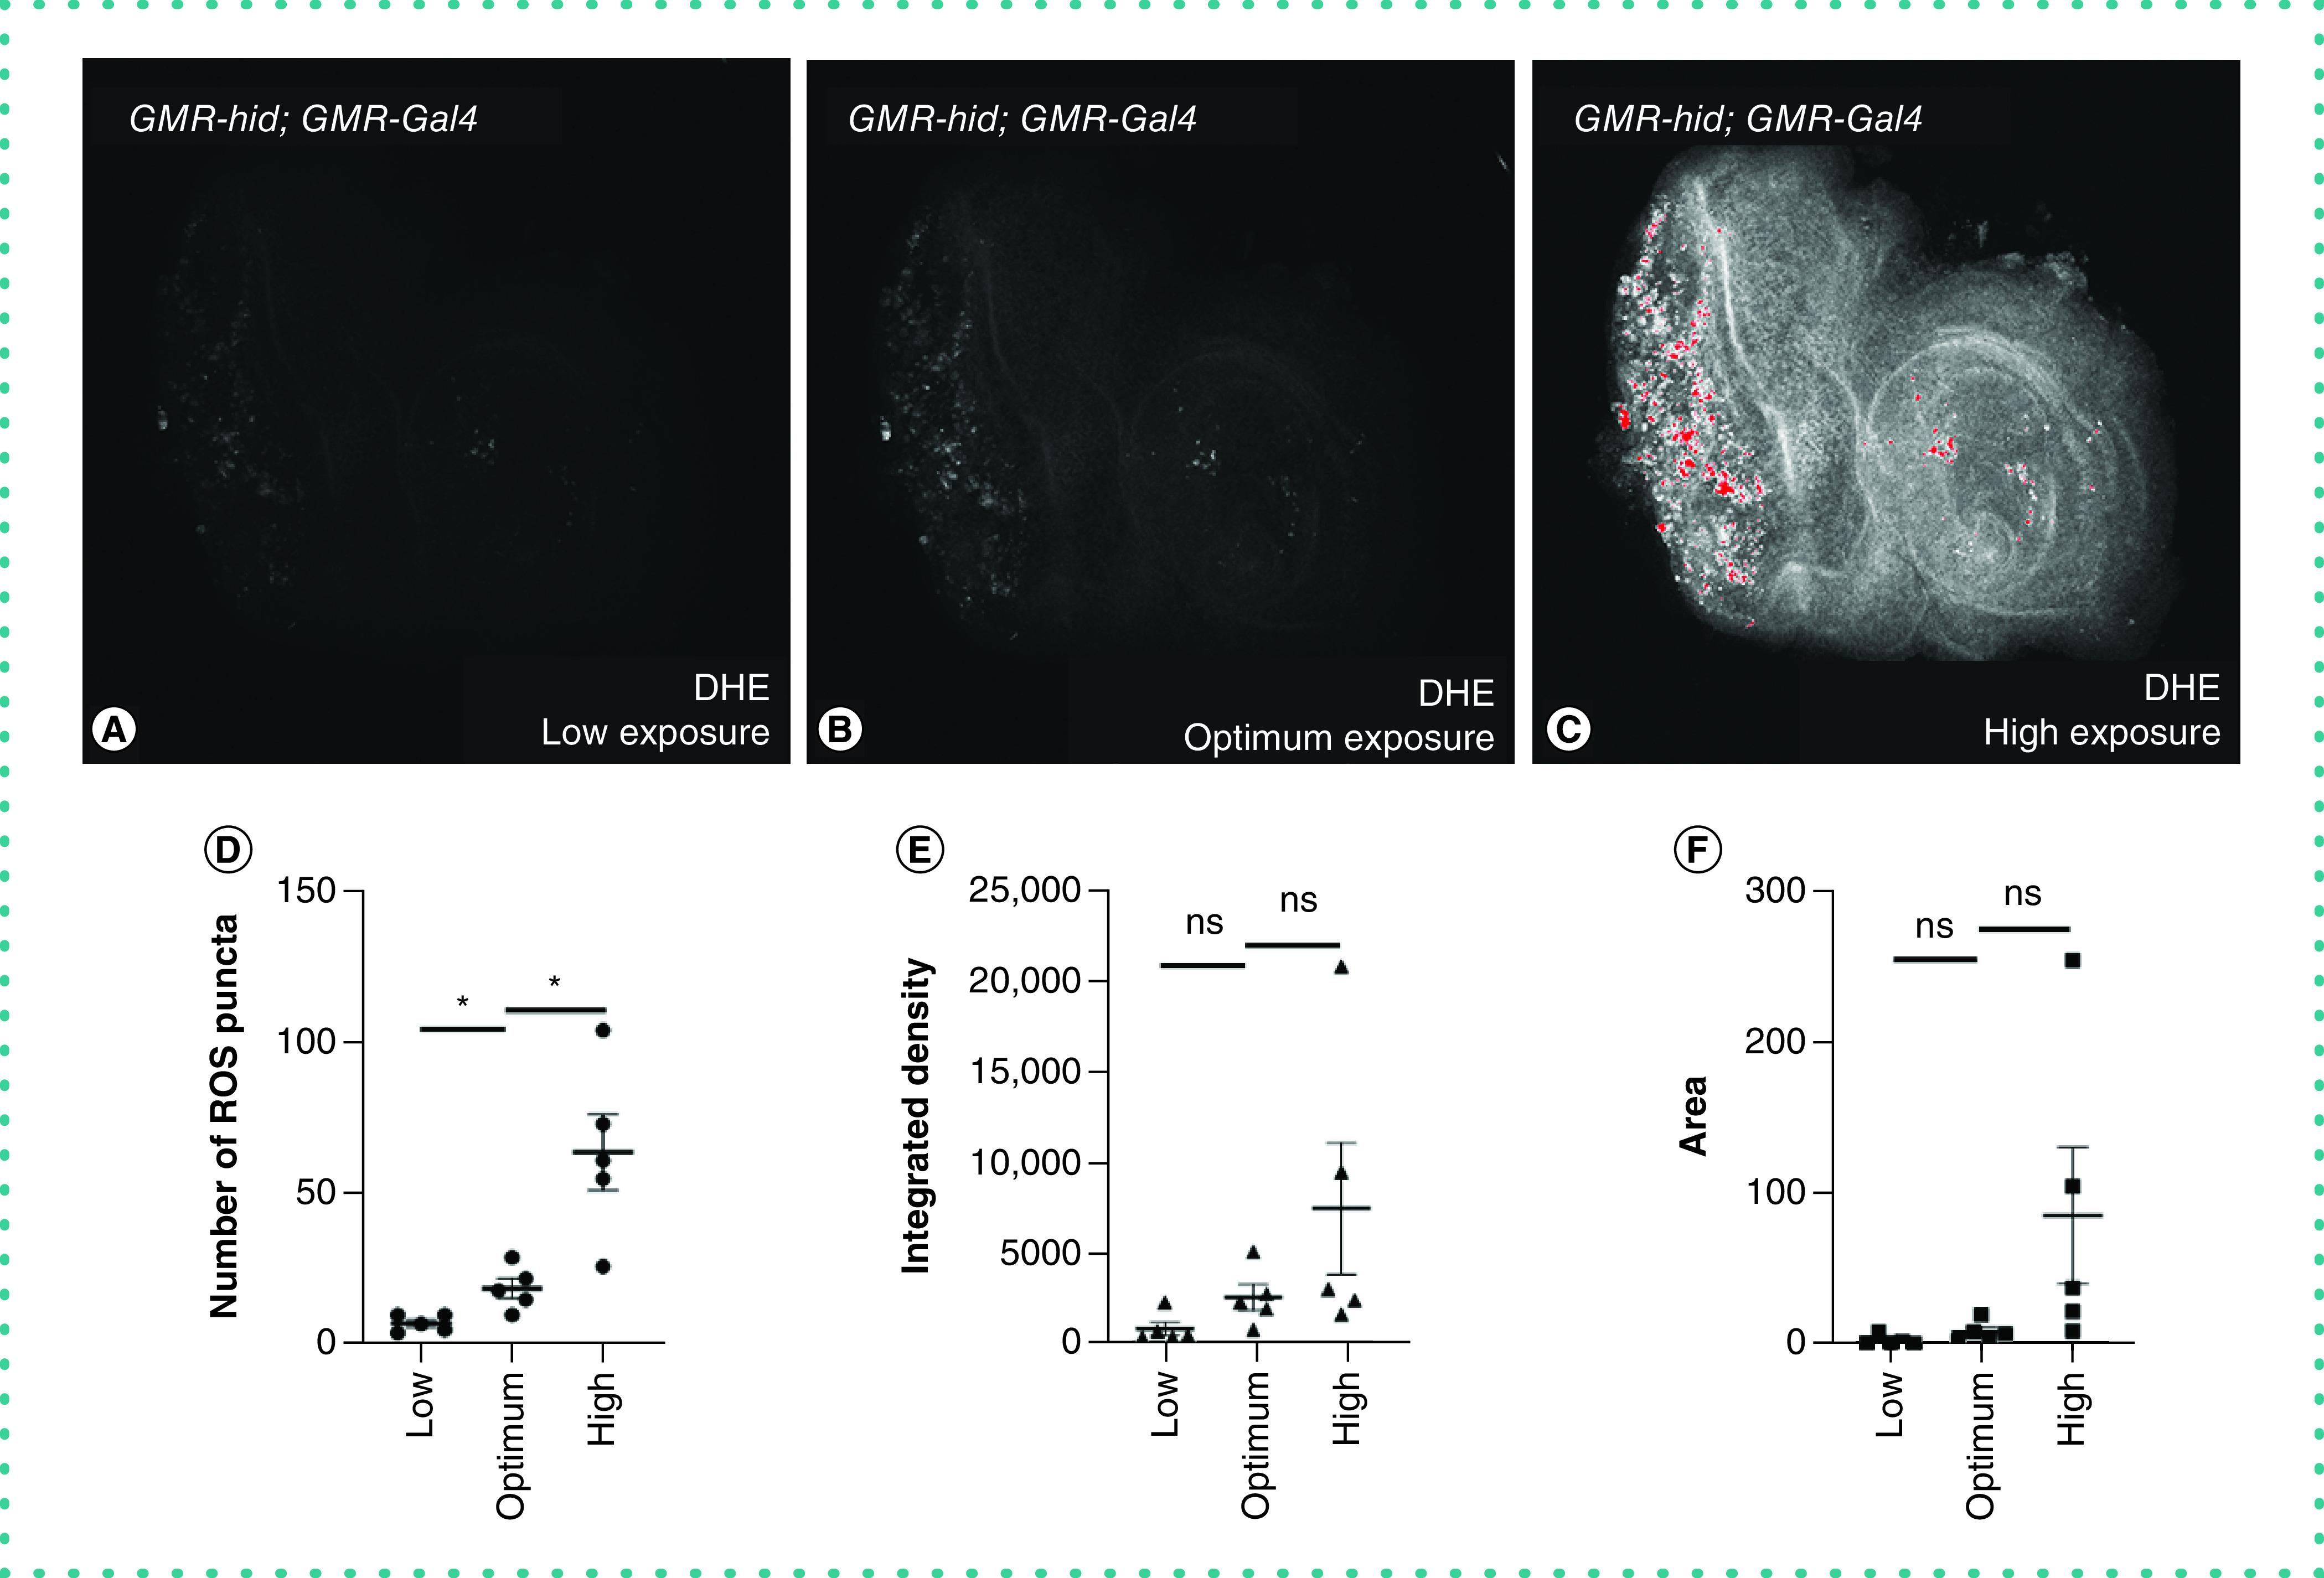
DHE, a fluorescent probe, is used to detect the ROS produced inside the cell. (A–C) The third instar larval eye-antennal imaginal discs from GMR-hid; GMR-Gal4 larvae (n = 5) were stained with DHE (grayscale) and imaged under laser scanning confocal microscopy (Olympus Fluoview 3000) at (A) low, (B) optimal and (C) high exposure (high HV setting, highly saturated signal: red saturation in image) conditions as per saturation levels. Note that the ROS are randomly distributed in the eye and are present as distinct puncta. (D–F) Scatter plots of data from five discs for low, optimal and high settings (represented mean ± standard error of the mean). These graphs represent (D) number of ROS puncta, (E) integrated density and (F) area across the settings. The p-values were calculated in a set of five (n = 5) using Student's t-test. Magnification of all eye-antennal imaginal discs is 20×.
Statistical significance in each graph is shown by ***p < 0.001; **p < 0.01; *p < 0.05 and ns.
DHE: Dihydroethidium; ns: Nonsignificant; ROS: Reactive oxygen species.
Figure 2. . Workflow diagram of key steps in automated quantitation for live cell imaging to observe reactive oxygen species using DHE staining.
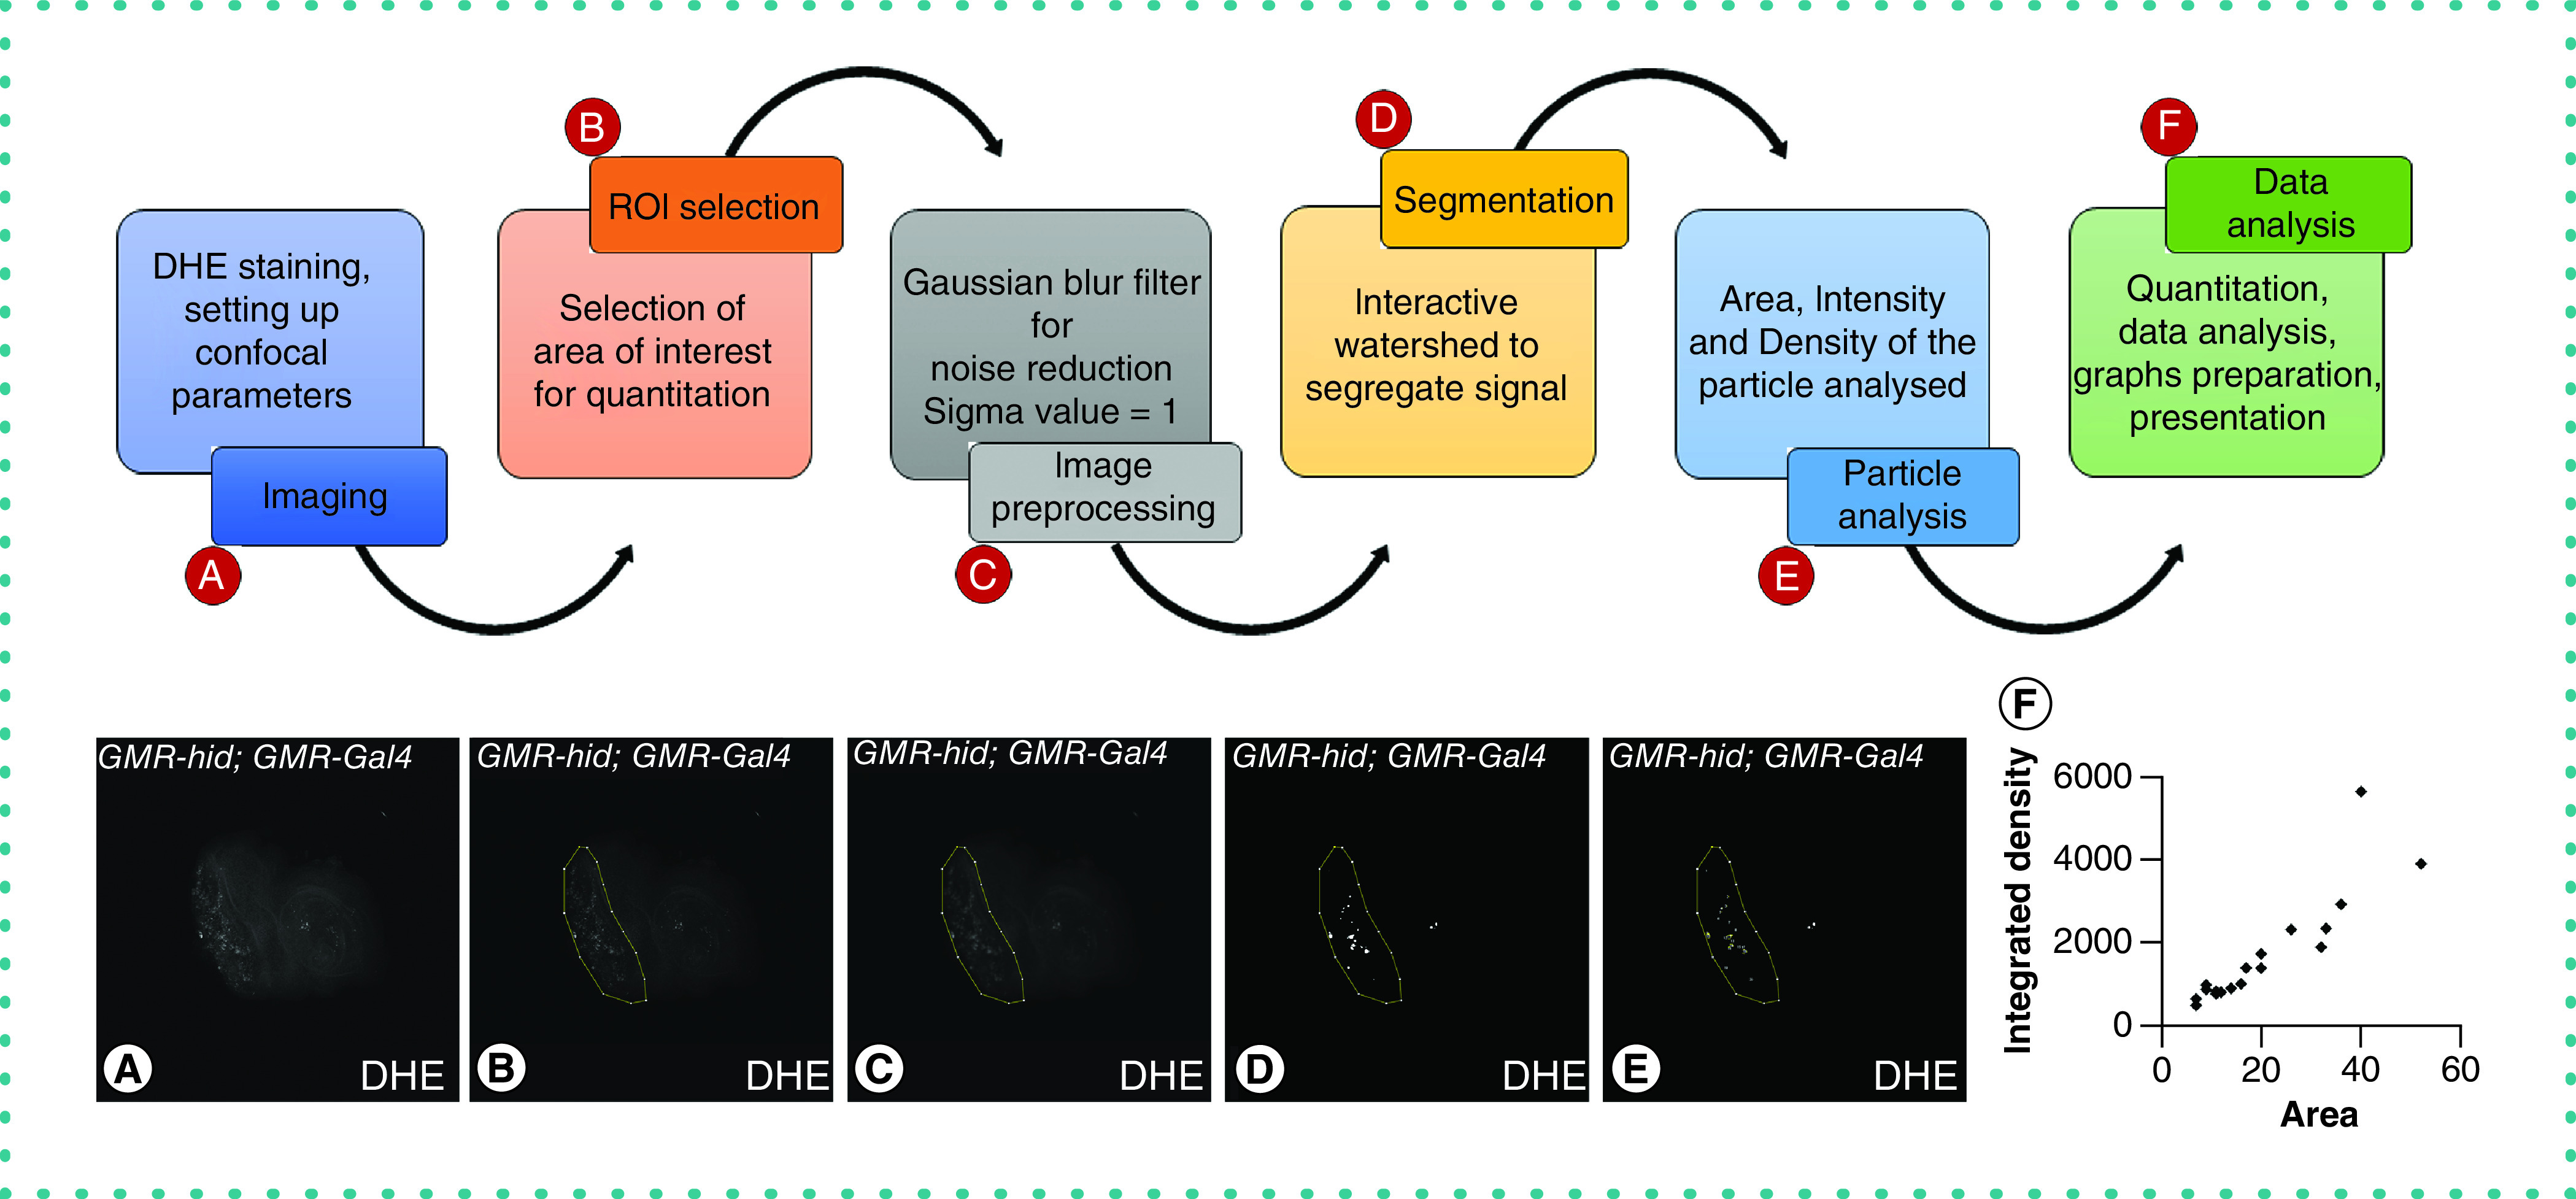
(A–F) Image shows summary of steps for unbiased quantitation in Fiji/ Image-J. It shows how the final ROIs are selected and analyzed using watershed and particle analysis. (A) The workflow and analysis of one representative image. The tissue samples are first dissected and subjected to DHE staining (grayscale) and are imaged under laser scanning confocal microscopy. (B) The live tissue images are then subjected to automated quantitation using Fiji/ImageJ software where the first step is selection of ROI. (C) The image is then processed using appropriate filter to reduce background noise. (D) The processed image is subjected to H-interactive watershed algorithms to segment each ROS signal for further analysis. (E) The parameters to quantitate are set, and all segments are subjected to analysis to obtain results. (F) The data are analyzed, interpreted and subjected to further statistical analysis and representation. Graphical representation in the form of scatter plot depicts the area (x-axis) against their respective intensities (y-axis).
DHE: Dihydroethidium; ROI: Region of interest.
Using the representative images for all genotypes, we optimized the quantitation parameters to be used across experimental groups. Following the methods described earlier [29], we adapted them to quantitate ROS in live tissue images. Because our aim was to reduce noise and quantitate ROS accurately, after selecting the ROI (Figure 2B), we used filters to smoothen signals (Figure 2C) and H-interactive watershed for segmentation (Figure 2D). Among the several filters such as mean, median, Gaussian blur, maxima and minima, for example, we found that the Gaussian blur was most suitable for our analyses. The Gaussian blur is a low pass filter based on a Gaussian matrix that is used to perform smoothening of the image [46]. For any out-of-image pixels, the Gaussian matrix is generated with higher weightage to nearest edge and corner pixels than the noncorner pixels. For selecting pixels to be considered, the radius value corresponding to the standard deviation, or sigma (σ), is entered in the software. A lower sigma radius corresponds to smaller filter size that reduces noise seen as small nonspecific staining in the background, whereas a larger sigma radius corresponds to larger filter size that takes into consideration a higher percentage of pixels; thus, blurs to smoothen larger structures and reduces its intensity too. The mean/median filter calculates the mean/median values of all surrounding pixels. However, using a mean filter in an image with more nonspecific background noise will introduce additional artifacts by spreading out the mean of some random extreme values. Alternatively, the median filter eliminates extreme pixel values, leading to erroneous removal of smaller or uneven signals. Because we aimed to simply reduce nonspecific background and avoid losing smaller ROS puncta, we only used the Gaussian blur.
Next, we used the interactive H-watershed for segmentation to identify and segregate each signal distinctly [47]. Watershed reconstructs each image as an uneven 3D surface with heights and depths based on the maxima (white or pixel value = 255) and minima (black or pixel value = 0) in the image. To generate these values, the H-maxima, intensity threshold and peak flooding (Figure 2D) need to be optimized. We individually changed each of these three settings to optimize the parameters for quantitation. The H-maxima (seed dynamics) value subtracts the selected value from all the individual pixels. The resultant maxima are then recognized as local maxima and are segmented accordingly. We observed that a higher setting resulted in fewer local maxima, leading to the loss of signals and information. The next parameter, intensity threshold, represents the minimum pixel value beyond which the signals are detected. Although lower thresholds tend to detect more signals, they also include noise with high intensity and possibly show merged structures. In contrast, slightly higher thresholds help in reducing noise and clearly demarcate ROS puncta. We optimized these parameters in all experimental groups to avoid biased quantitation. Lastly, peak flooding is the percentage height of flooding allowed in each peak during image processing. Lower peak flooding helped avoid nonspecific signals and thus eliminated noise during quantitation. Therefore, proper selection of all these parameters is crucial to identify specific signals and not noise. Every particle in the preprocessed image was assigned a number, and intensity was calculated by particle analysis (Figure 2E). This method eliminates the chances of manual error, biological variation, and other concerns. A stepwise method was depicted schematically using a representative GMR-hid; GMR-Gal4 eye disc to show the steps of automated quantitation (Figure 2A–F). These results were then analyzed in Microsoft Excel and plotted using GraphPad prism (Figure 2F). The scatter plot shows the area of each particle on the x-axis against their respective intensities on y-axis. The intensity of each particle is varied and ranges from 506 to 5632 (Figure 2F).
We further wanted to assess whether we could use this method to study changes in ROS levels in the Drosophila eye model of AD (GMR>Aβ42). To do so, we employed this unbiased quantitation method to measure the ROS levels in AD. The GMR>Aβ42 flies show elevated ROS signals. During stress-induced apoptosis, there is ROS generation leads to head involution defective (hid) induced caspase activation and cell death [22]. Moreover, higher ROS levels increase oxidative stress, which results in Hippo pathway activation and triggers neuronal cell death, as seen in neurodegenerative diseases [48]. Earlier we have shown that hippo (hpo) is a genetic modifier of Aβ42-mediated neurodegeneration [13]. Gain-of-function of hpo in GMR>Aβ42 background enhances Aβ42-mediated neurodegeneration, whereas loss of function of hpo in GMR>Aβ42 background rescues the Aβ42 phenotype [13]. To investigate changes in ROS levels in the Drosophila eye model AD, we modulated hippo (hpo), a genetic modifier of Aβ42-mediated neurodegeneration. GMR-hid; GMR-Gal4 (Figure 3B) serves as a positive control with high ROS production [22], whereas Canton-S (Figure 3A) serves as a negative control that has a minimal amount of ROS production [23].
Figure 3. . Quantitation of reactive oxygen species production between controls and experimental treatments in the fly model of Alzheimer's disease.
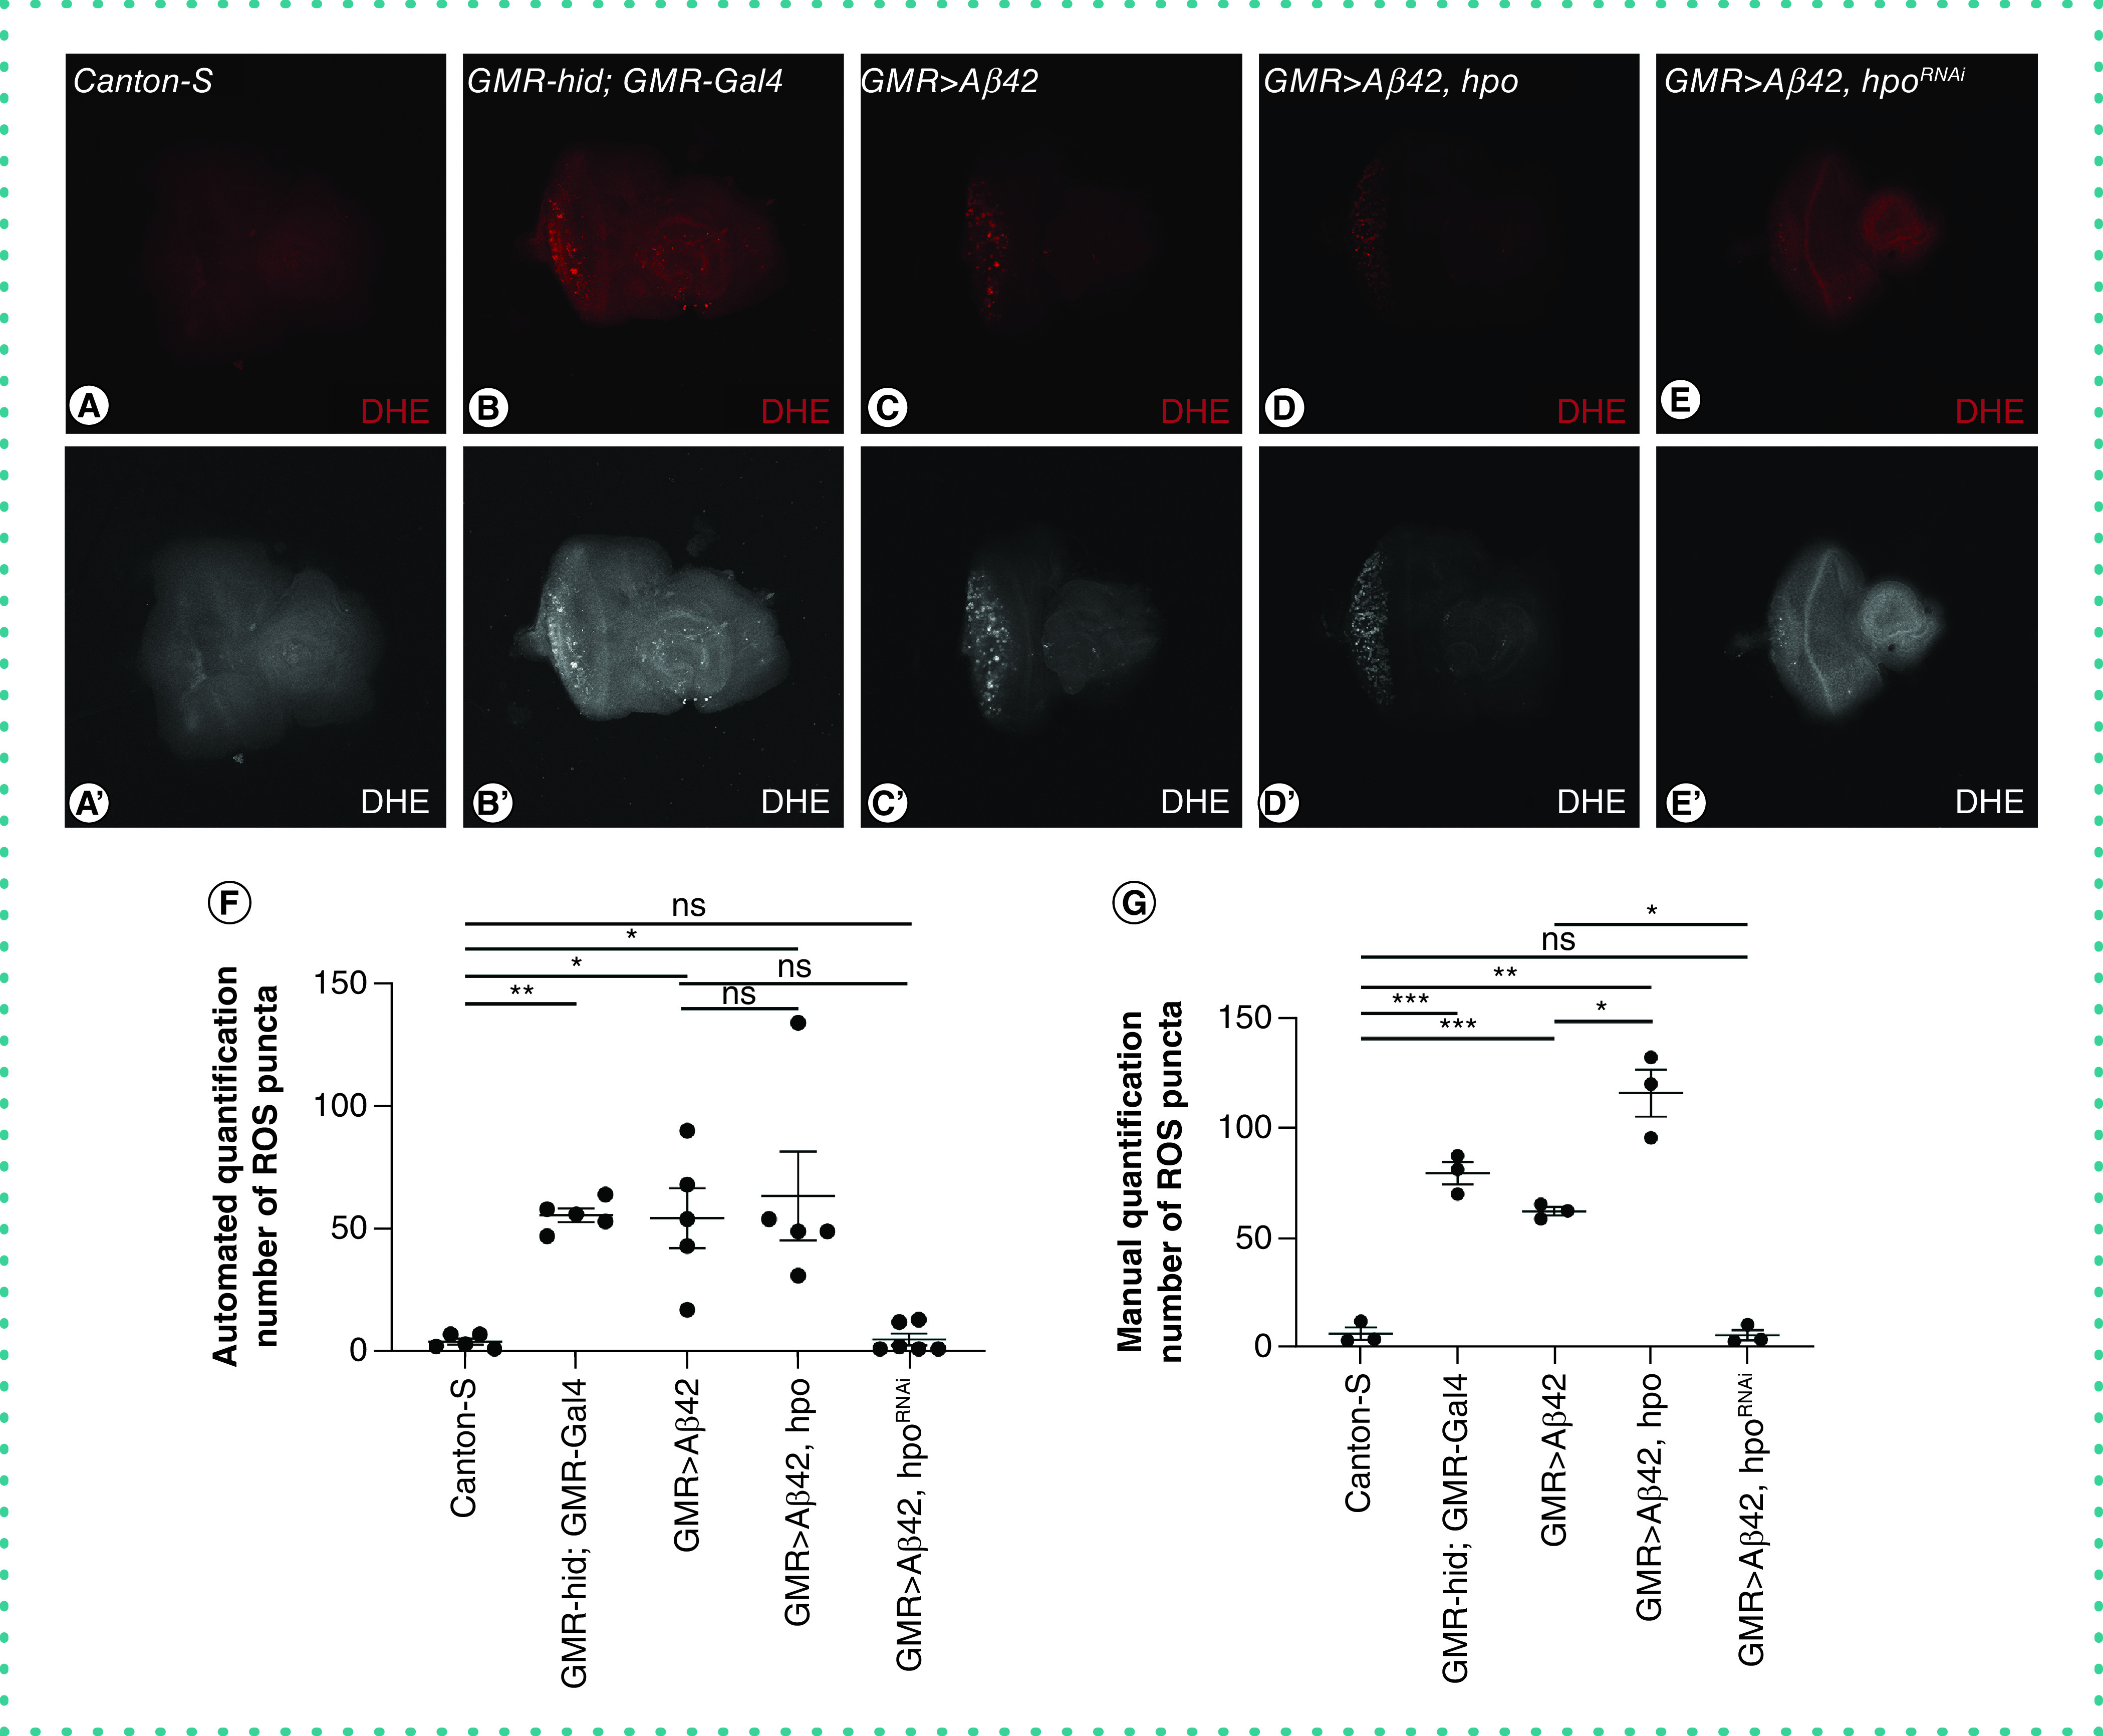
Panel shows the third instar larval eye-antennal imaginal discs of (A) wild-type Canton-S, (B) GMR-hid; GMR-Gal4, (C) GMR>Aβ42, (D) GMR>Aβ42+hpo and (E) GMR>Aβ42+hpoRNAi were stained with DHE (red) and imaged under laser scanning confocal microscopy (Olympus Fluoview 3000) according to the optimal settings as per saturation levels. Note that the ROS are randomly distributed in the eye and are present as distinct puncta. (A′, B′, C′, D′ & E′) Eye-antennal imaginal disc showing grayscale for DHE staining. (F) Scatter plot shows automated quantitation of the average number of ROS signals from five discs for each genotype (n = 5) (represented mean ± standard error of the mean). (G) Scatter plot shows average manual quantitation of ROS signals from five discs of each genotype. Manual quantitation was performed by three people independently. The p-value was calculated using Student's t-test. Magnification of all the images is 20×.
Statistical significance in each graph is shown by p-value: ***p < 0.001; **p < 0.01; *p < 0.05.
DHE: Dihydroethidium; ns: Nonsignificant; ROS: Reactive oxygen species.
As discussed previously, analyzing the ROS signals in live cell images with background noise is a challenge. To compare the efficacy of either methods, we quantitated ROS puncta manually as well as by the H-Interactive Watershed algorithm. We tabulated our results from automated and manual quantitation (Table 2). Automated quantitation showed that misexpression of UAS-hid in the GMR domain of the eye (GMR-hid; GMR-Gal4) (Figure 3B), resulted in dramatic increase in ROS in the eye imaginal disc as compared to the wild-type control, Canton-S (Figure 3A). Similarly, misexpression of UAS-Aβ42 in the GMR domain of the eye using GMR-Gal4 resulted in an increase in ROS production in the eye imaginal disc (Figure 3C). GMR>Aβ42+hpo (Figure 3D) shows increased ROS puncta compared with GMR>Aβ42; however GMR>Aβ42+hpoRNAi (Figure 3E) shows dramatic decrease in ROS levels compared with GMR>Aβ42. The ROS signals in GMR>Aβ42+hpoRNAi were almost similar to wildtype and were nonsignificant. In contrast, blinded manual quantitation of the number of ROS puncta was performed independently by three individuals and found variation in counting (Figure 3G). Hence, automated quantitation provides more precise unbiased results compared with manual counting of the ROS puncta.
Table 2. . Comparison of manual and automated quantitation to demonstrate the lower variability and higher consistency with automated quantification.
| Genotype | Number of ROS puncta | |||
|---|---|---|---|---|
| Automated quantification | Manual: analyst 1 | Manual: analyst 2 | Manual: analyst 3 | |
| Canton-S | 7 | 0 | 2 | 1 |
| 7 | 14 | 6 | 6 | |
| 1 | 12 | 5 | 5 | |
| 2 | 25 | 7 | 5 | |
| 3 | 10 | 0 | 0 | |
| GMR-hid; GMR-Gal4 | 64 | 84 | 77 | 78 |
| 47 | 56 | 38 | 30 | |
| 58 | 105 | 69 | 77 | |
| 56 | 90 | 97 | 137 | |
| 53 | 102 | 69 | 84 | |
| GMR>Aβ42 | 43 | 73 | 58 | 62 |
| 90 | 78 | 111 | 110 | |
| 17 | 49 | 41 | 46 | |
| 68 | 41 | 50 | 53 | |
| 54 | 53 | 52 | 56 | |
| GMR>Aβ42+hpo | 49 | 99 | 116 | 134 |
| 134 | 107 | 173 | 192 | |
| 54 | 110 | 159 | 188 | |
| 49 | 85 | 82 | 78 | |
| 31 | 77 | 70 | 69 | |
| GMR>Aβ42+hpoRNAi | 12 | 12 | 1 | 5 |
| 13 | 11 | 13 | 12 | |
| 1 | 28 | 4 | 6 | |
| 1 | 13 | 0 | 0 | |
| 1 | 0 | 0 | 0 | |
| 2 | 0 | 0 | 0 | |
Observing and quantitating ROS production in real time has many challenges. Several recent reports have shown DHE as a more reliable dye to mark ROS qualitatively. We observe batch-to-batch variation in ROS levels in biological tissues stained with DHE due to lower signal-to-noise ratio in live tissue staining. To avoid further bias with manual quantitation of signal, we have applied an unbiased quantitation method based on Gaussian filter and Interactive Watershed plugin in Fiji/ImageJ. We show that optimal imaging parameters are imperative to get accurate results, and higher settings could lead to introduction of several artifacts. We have adapted the previously described quantitation method to quantitate ROS in live tissue images of AD fly model [29]. Using the Drosophila eye model of AD, a background with higher level ROS generation with respect to the wildtype control, we show greater precision and less variation in ROS quantitation using our method. Furthermore, when using hpo, a genetic modifier of Aβ42 that can modulate ROS levels during its gain of function and loss of function, we observed significant quantitative differences in ROS levels compared with Aβ42 only background. In gain of function, more ROS generation was observed compared with Aβ42 only, whereas in hpo loss of function, less ROS generation was observed compared with Aβ42 only background. This suggests that this method is highly accurate and sensitive in detecting the changes in level of ROS. This method can preferentially quantitate signals uniformly in all experimental groups without any bias because they are processed similarly with the same parameters.
Broadly speaking, this method of quantitation can be used in any live tissue or cell images to quantitate fluorescent signals and thus eliminate manual bias. It can be used for any fluorescent dye-based staining and other fluorochrome tagged fusion protein(s) localization using real-time imaging. The insights obtained from this study can be implemented to reduce noise in other assays such as cell death (TUNEL, acridine orange), cell proliferation (BrdU, phospho histone H3) and reporter assays (GFP, lacZ etc.) that show puncta-like signals. In the future, there is a scope to modify and apply such freeware algorithms to study spatiotemporal gene expression in live and fixed tissues.
Executive summary.
Fluorescent dye-based method was used to detect cellular superoxide (O2•−) as a marker for reactive oxygen species (ROS) in the Drosophila melanogaster model of Alzheimer's disease (AD).
We compared manual and automated quantitation to check which method is more reliable and reproducible.
We have used genetic controls that serve as positive controls to optimize imaging parameters and to reduce bias.
With automated quantitation, it was clear that quantitation of ROS intensity and area are not as informative as quantitating the numbers of cells.
With this method, we were able to quantitate and see an evident increase in ROS generation in a Drosophila eye model of neurodegeneration.
Furthermore, modulation of Hippo pathway, a genetic modifier of Aβ42-mediated neurodegeneration, resulted in the change in levels of ROS generation, which can be quantitated by using Fiji/ImageJ.
We documented high quantitative variations in data by manual counting approach. However, the automated quantitation ensured data integrity when the same parameters were used.
This automated quantitation method can be used to study ROS generation in fluorescent images of other live cells and tissues.
Acknowledgments
The authors thank Bloomington Drosophila Stock Center (BDSC) for the Drosophila strains as well as A Singh and members of the Singh lab for providing comments on the manuscript.
Footnotes
Authors contributions
P Deshpande, N Gogia and AV Chimata performed the experiments. P Deshpande, N Gogia and AV Chimata and A Singh were involved in developing the concept, design, analysis, manuscript writing and editing and figures preparation.
Financial & competing interests disclosure
Authors are supported by the University of Dayton Graduate program in biology. This work is supported by NIH1R15GM124654-01 from the NIH, Schuellein Chair Endowment Fund and start-up support from the University of Dayton to A Singh. The authors have no other relevant affiliations or financial involvement with any organization or entity with a financial interest in or financial conflict with the subject matter or materials discussed in the manuscript apart from those disclosed.
No writing assistance was utilized in the production of this manuscript.
Open access
This work is licensed under the Attribution-NonCommercial-NoDerivatives 4.0 Unported License. To view a copy of this license, visit http://creativecommons.org/licenses/by-nc-nd/4.0/
References
- 1.Sies H, Jones DP. Reactive oxygen species (ROS) as pleiotropic physiological signalling agents. Nat. Rev. Mol. Cell Biol. 21(7), 363–383 (2020). [DOI] [PubMed] [Google Scholar]
- 2.Liguori I, Russo G, Curcio F et al. Oxidative stress, aging, and diseases. Clin. Interv. Aging 13, 757–772 (2018). [DOI] [PMC free article] [PubMed] [Google Scholar]
- 3.Fang C, Gu L, Smerin D et al. The interrelation between reactive oxygen species and autophagy in neurological disorders. Oxid. Med. Cell Longev. 2017, 8495160 (2017). [DOI] [PMC free article] [PubMed] [Google Scholar]
- 4.Manoharan S, Guillemin GJ, Abiramasundari RS et al. The role of reactive oxygen species in the pathogenesis of Alzheimer's disease, Parkinson's disease, and Huntington's disease: a mini review. Oxid. Med. Cell Longev. 2016, 8590578 (2016). [DOI] [PMC free article] [PubMed] [Google Scholar]
- 5.Sarkar A, Gogia N, Glenn N et al. A soy protein Lunasin can ameliorate amyloid-beta 42 mediated neurodegeneration in Drosophila eye. Sci. Rep. 8(1), 13545 (2018). [DOI] [PMC free article] [PubMed] [Google Scholar]
- 6.Sarkar A, Irwin M, Singh A et al. Alzheimer's disease: the silver tsunami of the 21(st) century. Neural Regen. Res. 11(5), 693–697 (2016). [DOI] [PMC free article] [PubMed] [Google Scholar]
- 7.Yeates CJ, Sarkar A, Kango-Singh M, Singh A. Unravelling Alzhiemer's disease using Drosophila. In: Insights into Human Neurodegeneration: Lessons Learnt from Drosophila. Mutsuddi M, Mukherjee A (Eds). Springer, Singapore, 251–277 (2019). [Google Scholar]
- 8.Huang WJ, Zhang X, Chen WW. Role of oxidative stress in Alzheimer's disease. Biomed. Rep. 4(5), 519–522 (2016). [DOI] [PMC free article] [PubMed] [Google Scholar]
- 9.Schulz JB, Beal MF. Mitochondrial dysfunction in movement disorders. Curr. Opin. Neurol. 7(4), 333–339 (1994). [DOI] [PubMed] [Google Scholar]
- 10.Singh A, Kango-Singh M, Sun YH. Eye suppression, a novel function of teashirt, requires Wingless signaling. Development 129(18), 4271–4280 (2002). [DOI] [PubMed] [Google Scholar]
- 11.Kango-Singh M, Singh A. Regulation of organ size: Insights from the Drosophila Hippo signaling pathway. Dev. Dyn. 238(7), 1627–1637 (2009). [DOI] [PubMed] [Google Scholar]
- 12.Gogia N, Chimata AV, Deshpande P et al. Hippo signaling: bridging the gap between cancer and neurodegenerative disorders. Neural Regen. Res. 16(4), 643–652 (2021). [DOI] [PMC free article] [PubMed] [Google Scholar]
- 13.Irwin M, Tare M, Singh A et al. A positive feedback loop of Hippo- and c-Jun-amino-terminal kinase signaling pathways regulates amyloid-beta-mediated neurodegeneration. Front. Cell Dev. Biol. 8, 117 (2020). [DOI] [PMC free article] [PubMed] [Google Scholar]
- 14.Gogia N, Sarkar A, Mehta AS et al. Inactivation of Hippo and cJun-N-terminal kinase (JNK) signaling mitigate FUS mediated neurodegeneration in vivo. Neurobiol. Dis. 140, 104837 (2020). [DOI] [PMC free article] [PubMed] [Google Scholar]
- 15.Xiao L, Chen D, Hu P et al. The c-Abl-MST1 signaling pathway mediates oxidative stress-induced neuronal cell death. J. Neuroscience 31(26), 9611–9619 (2011). [DOI] [PMC free article] [PubMed] [Google Scholar]
- 16.Cioffi F, Adam RHI, Broersen K. Molecular mechanisms and genetics of oxidative stress in Alzheimer's disease. J. Alzheimers Dis. 72(4), 981–1017 (2019). [DOI] [PMC free article] [PubMed] [Google Scholar]
- 17.Kalyanaraman B, Darley-Usmar V, Davies KJ et al. Measuring reactive oxygen and nitrogen species with fluorescent probes: challenges and limitations. Free Radic. Biol. Med. 52(1), 1–6 (2012). [DOI] [PMC free article] [PubMed] [Google Scholar]
- 18.Bedouhene S, Moulti-Mati F, Hurtado-Nedelec M et al. Luminol-amplified chemiluminescence detects mainly superoxide anion produced by human neutrophils. Am. J. Blood Res. 7(4), 41–48 (2017). [PMC free article] [PubMed] [Google Scholar]
- 19.Wu L, Sedgwick AC, Sun X et al. Reaction-based fluorescent probes for the detection and imaging of reactive oxygen, nitrogen, and sulfur species. Acc. Chem. Res. 52(9), 2582–2597 (2019). [DOI] [PMC free article] [PubMed] [Google Scholar]
- 20.Zhao H, Joseph J, Fales HM et al. Detection and characterization of the product of hydroethidine and intracellular superoxide by HPLC and limitations of fluorescence. Proc. Natl. Acad. Sci. U S A 102(16), 5727–5732 (2005). [DOI] [PMC free article] [PubMed] [Google Scholar]
- 21.Robinson KM, Janes MS, Pehar M et al. Selective fluorescent imaging of superoxide in vivo using ethidium-based probes. Proc. Natl. Acad. Sci. U S A 103(41), 15038–15043 (2006). [DOI] [PMC free article] [PubMed] [Google Scholar]
- 22.Fogarty CE, Diwanji N, Lindblad JL et al. Extracellular reactive oxygen species drive apoptosis-induced proliferation via Drosophila macrophages. Curr. Biol. 26(5), 575–584 (2016). [DOI] [PMC free article] [PubMed] [Google Scholar]
- 23.Sanz A, Fernández-Ayala DJ, Stefanatos RK, Jacobs HT. Mitochondrial ROS production correlates with, but does not directly regulate lifespan in Drosophila. Aging (Albany NY) 2(4), 200–223 (2010). [DOI] [PMC free article] [PubMed] [Google Scholar]
- 24.Wang Q, Zou MH. Measurement of reactive oxygen species (ROS) and mitochondrial ROS in AMPK knockout mice blood vessels. Methods Mol. Biol. 1732, 507–517 (2018). [DOI] [PMC free article] [PubMed] [Google Scholar]
- 25.Gogia N, Sarkar A, Singh A. An undergraduate cell biology lab: Western Blotting to detect proteins from Drosophila eye. Dros. Inf. Serv. 100, 218–225 (2017). [Google Scholar]
- 26.Singh A, Irvine KD. Drosophila as a model for understanding development and disease. Dev. Dyn. 241(1), 1–2 (2012). [DOI] [PubMed] [Google Scholar]
- 27.Singh A. Neurodegeneration – a means to an end. J. Cell Sci. Ther. 3(3), 10000e10107 (2012). [Google Scholar]
- 28.Bier E. Drosophila, the golden bug, emerges as a tool for human genetics. Nat. Rev. Genet. 6(1), 9–23 (2005). [DOI] [PubMed] [Google Scholar]
- 29.Brazill JM, Zhu Y, Li C, Zhai RG. Quantitative cell biology of neurodegeneration in Drosophila through unbiased analysis of fluorescently tagged proteins using ImageJ. J. Vis. Exp. (138), (2018). [DOI] [PMC free article] [PubMed] [Google Scholar]
- 30.Larkin A, Marygold SJ, Antonazzo G et al. FlyBase: updates to the Drosophila melanogaster knowledge base. Nucleic Acids Res. 49(D1), D899–D907 (2021). [DOI] [PMC free article] [PubMed] [Google Scholar]
- 31.Moses K, Rubin GM. Glass encodes a site-specific DNA-binding protein that is regulated in response to positional signals in the developing Drosophila eye. Genes Dev. 5(4), 583–593 (1991). [DOI] [PubMed] [Google Scholar]
- 32.Casas-Tinto S, Zhang Y, Sanchez-Garcia J et al. The ER stress factor XBP1s prevents amyloid-beta neurotoxicity. Hum. Mol. Genet. 20(11), 2144–2160 (2011). [DOI] [PMC free article] [PubMed] [Google Scholar]
- 33.Tare M, Modi RM, Nainaparampil J et al. Activation of JNK signaling mediates amyloid-ß-dependent cell death. PLoS One 6(9), e24361 (2011). [DOI] [PMC free article] [PubMed] [Google Scholar]
- 34.Cutler T, Sarkar A, Moran M et al. Drosophila eye model to study neuroprotective role of CREB binding protein (CBP) in Alzheimer's disease. PLoS One 10(9), e0137691 (2015). [DOI] [PMC free article] [PubMed] [Google Scholar]
- 35.Udan RS, Kango-Singh M, Nolo R et al. Hippo promotes proliferation arrest and apoptosis in the Salvador/Warts pathway. Nat. Cell Biol. 5(10), 914–920 (2003). [DOI] [PubMed] [Google Scholar]
- 36.Pantalacci S, Tapon N, Léopold P. The Salvador partner Hippo promotes apoptosis and cell-cycle exit in Drosophila. Nat. Cell Biol. 5(10), 921–927 (2003). [DOI] [PubMed] [Google Scholar]
- 37.Brand AH, Perrimon N. Targeted gene expression as a means of altering cell fates and generating dominant phenotypes. Development 118(2), 401–415 (1993). [DOI] [PubMed] [Google Scholar]
- 38.Singh A, Choi K-W. Initial state of the Drosophila eye before dorsoventral specification is equivalent to ventral. Development 130(25), 6351 (2003). [DOI] [PubMed] [Google Scholar]
- 39.Singh A, Shi X, Choi K-W. Lobe and Serrate are required for cell survival during early eye development in Drosophila. Development 133(23), 4771 (2006). [DOI] [PubMed] [Google Scholar]
- 40.Singh A, Gopinathan KP. Confocal microscopy: a powerful technique for biological research. Curr. Sci. 74(10), 841–851 (1998). [Google Scholar]
- 41.Raj A, Chimata AV, Singh A. Motif 1 binding protein suppresses wingless to promote eye fate in Drosophila. Sci. Rep. 10(1), 17221 (2020). [DOI] [PMC free article] [PubMed] [Google Scholar]
- 42.Yeates CJ, Sarkar A, Deshpande P et al. A two-clone approach to study signaling interactions among neuronal cells in a pre-clinical Alzheimer's disease model. iScience 23(12), 101823 (2020). [DOI] [PMC free article] [PubMed] [Google Scholar]
- 43.Tare M, Sarkar A, Bedi S et al. Cullin-4 regulates Wingless and JNK signaling-mediated cell death in the Drosophila eye. Cell Death Dis. 7(12), e2566 (2016). [DOI] [PMC free article] [PubMed] [Google Scholar]
- 44.Gogia N, Puli OR, Raj A, Singh A. Generation of third dimension: axial patterning in the developing Drosophila eye. In: Molecular Genetics of Axial Patterning, Growth and Disease in the Drosophila Eye. Singh A, Kango-Singh M (Eds). Springer, NY, USA, 53–95 (2020). [Google Scholar]
- 45.Sarkar A, Gogia N, Farley K et al. Characterization of a morphogenetic furrow specific Gal4 driver in the developing Drosophila eye. PLoS One 13(4), e0196365 (2018). [DOI] [PMC free article] [PubMed] [Google Scholar]
- 46.Schmid M. Accurate Gaussian blur. (Eds). (2008) https://imagej.nih.gov/ij/plugins/gaussian-blur.html
- 47.Vincent L, Soille P. Watersheds in digital spaces – an efficient algorithm based on immersion simulations. T. Pattern Anal. 13(6), 583–598 (1991). [Google Scholar]
- 48.Qin F, Tian J, Zhou D, Chen L. Mst1 and Mst2 kinases: regulations and diseases. Cell Biosci. 3(1), 31 (2013). [DOI] [PMC free article] [PubMed] [Google Scholar]