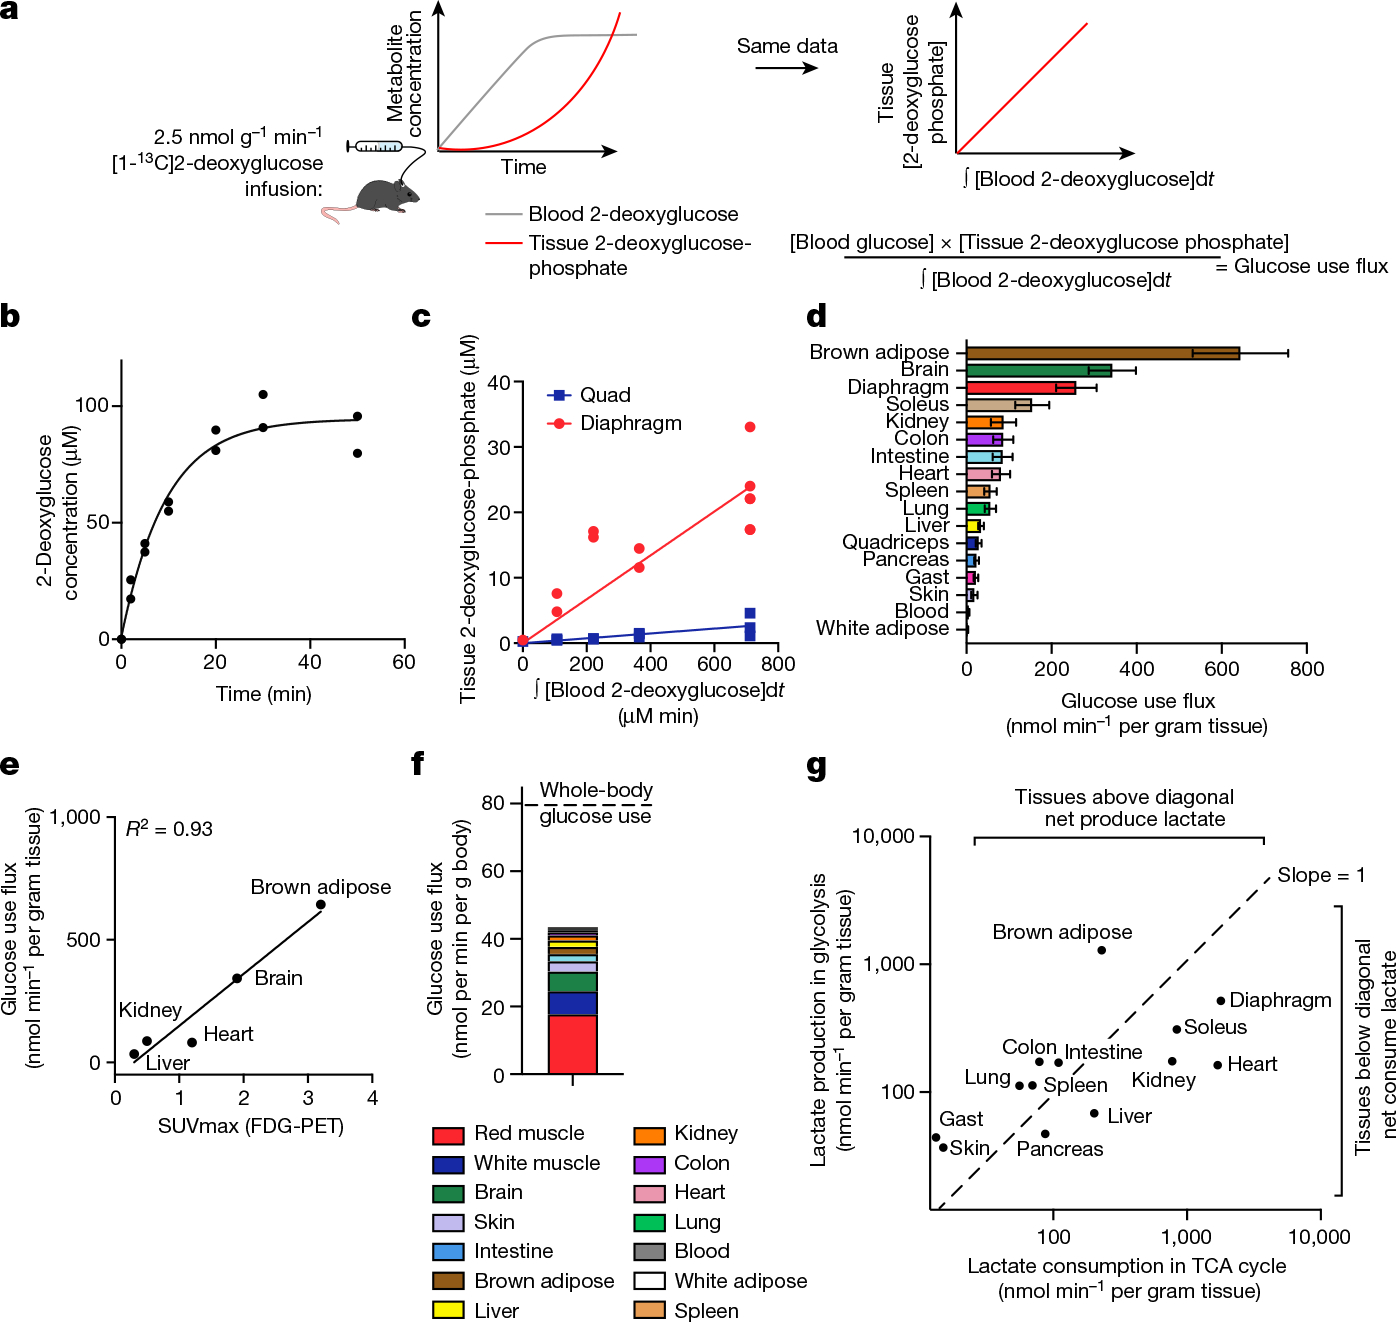
Fig. 2 |. Kinetic 2-deoxyglucose infusion quantifies glucose use flux in vivo.

a, Schematic of [1-13C]2-deoxyglucose infusion. b, The concentration of [1-13C]2-deoxyglucose in arterial blood during infusion. n = 2 mice, 7 timepoints each. c, The concentration of diaphragm and quadriceps muscle [1-13C]2-deoxyglucose phosphate versus the integral of blood [1-13C]2-deoxglucose with respect to time during [1-13C]2-deoxyglucose infusion. n = 12 mice (quadriceps) and n = 13 (diaphragm). d, Tissue glucose use flux. n = 4 mice (colon and blood), n = 9 (gastrocnemius (gast), intestine, lung, pancreas, skin, spleen, white adipose), n = 12 (kidney, liver, quadriceps) and n = 13 (brain, brown adipose, diaphragm, heart, soleus). Data are values determined by linear fit ± s.d. e, The correlation between absolute glucose use measured by [1-13C]2-deoxyglucose infusion and relative glucose use measured using FDG-PET28. f, The calculated glucose use by each tissue at the whole-body level. The dotted line shows the whole-body glucose turnover rate measured by [U-13C]glucose infusion. g, The production and consumption of lactate by tissues, calculated from glucose use flux and from TCA flux multiplied by lactate contribution to TCA cycle, respectively.
