Graphical Abstract
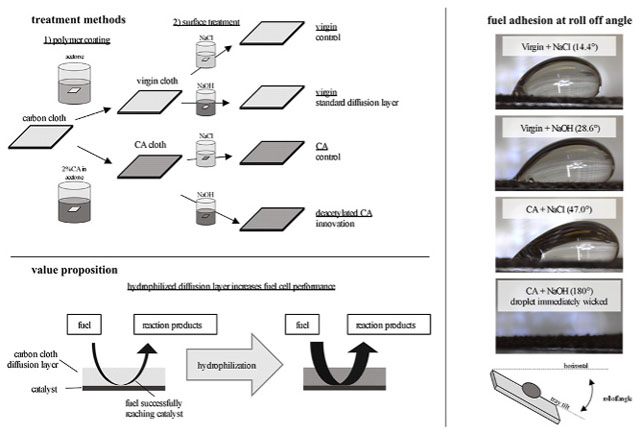
Keywords: PEM fuel cell, Glucose, Cellulose acetate, Gas diffusion layer
Abstract
Direct glucose fuel cells (DGFCs) and direct methanol fuel cells (DMFCs) commonly supply the reducing agent in liquid (aq.) form. In this work, we present key characteristics of implementing cellulose acetate (CA) coatings, which can subsequently be deacetylated toward cellulose, on carbon cloth used as a fuel diffusion layer in aqueous fuel-fed cells. Specifically, we illustrate functionality with an abiotic glucose fuel cell. Carbon cloth with and without a CA coating (with varying deacetylation) was characterized in terms of liquid permeation rate, electronic conductivity, and roll-off angle wetting characteristics. Additionally, fuel cell power production was measured over a variety of fuel concentrations and alkalinities by generating polarization curve data. These coatings facilitated a significant increase in aqueous solution permeation and adhesion properties, as well as providing up to two-fold increases in maximum power generation in an alkaline DGFC, despite experiencing some decreased conductivity of the carbon cloth diffusion layer.
1. Introduction
A fuel cell (FC) is a device that converts chemical energy directly into electrical energy by facilitating a redox reaction [1]. Our overarching interest is the development of a direct glucose fuel cell (DGFC) suitable for biomedical applications using either biological fluids or external cartridges as the fuel reservoir depending on the context. In all of these end-use milieus efficient mass transfer of the liquid fuel solution to the anode catalyst interface is required. In this study, we describe and characterize the utility of a simple coating approach with a bio-compatible polymer, cellulose acetate, which may be broadly viable for many diffusion layer (DL) formats.
DGFC technology has gained popularity due to the abundance of glucose in nature, and some research has focused on the grid-scale conversion of agricultural waste and by-products [2]. DGFCs are also particularly compelling as a power source for implanted medical devices, as glucose in the human body could theoretically be used as a fuel source [3,4]. DGFCs catalyze the following reaction via anodic and cathodic half reactions—even though oxidation releasing 24 electrons is theoretically possible, prior work has identified only the first reaction step as occurring to produce gluconic acid [4–6]:
| (1) |
The same oxidation reaction can be run using either an acidic or alkaline electrolyte, which determines the half reactions involved in the oxidation. For an acid electrolyte, the full reaction can be further reduced to the following anode and cathode half reactions:
| (2) |
| (3) |
Whereas an alkaline electrolyte forces the cell to mediate the following half reactions:
| (4) |
| (5) |
Alkaline electrolyte fuel cells often confer higher power generation capabilities than their acid electrolyte counterparts, as the kinetics of glucose oxidation and oxygen reduction are improved in an alkaline electrolyte. Also, since ion flow is from cathode to anode, possible fuel crossover from the anode to cathode is limited [4,7–9]. Alkaline DGFC reaction kinetics can be further improved by making the reaction site more alkaline, so strong bases such as KOH and NaOH are often added to the fuel solution, dramatically improving the power density for a given reactant molarity [4,8,10]. Though, for in-vivo applications this is not viable.
DGFCs have been proposed to be driven by a variety of bodily fluids for the focus of application within the human body. Researchers have proposed to use fluids such as cerebra-spinal fluid [11], interstitial fluid [12–14], and blood [3,4] (each of which hold about 5 mM glucose [15, 16]) as the possible fuel sources. Thus mass transfer driving forces will be low.
Generally, FCs utilize a DL—often alternately called the gas diffusion layer (GDL) because the reactants are most frequently gaseous H2 and O2. DLs have three primary functions: i) allow for even exposure of fuel and oxidizer molecules to catalyst sites across the surface area of the membrane; ii) to conduct electrons between the reaction site and the bipolar plates; and, iii) in some fabrication methods, to support catalyst particles directly adjacent to the electrolyte membrane (though in some methods, the catalyst is supported by the membrane itself) [17–19]. For these reasons, an optimal DL would be highly permeable to reactants and reaction products, highly electrically conductive, and mechanically robust (though able to deform to any geometry required of the cell design).
Commonly, flexible and conductive materials such as carbon cloth and carbon paper have been used for the DL. While carbon is a good material for cells utilizing gas reactants, it is nominally hydrophobic—Parry et al. [20] characterized GDLs for PEMFCs and noted them to be somewhat hydrophilic at elevated operating temperatures but poorly wet by most liquids—floating in pure water as well as the aqueous glucose (and sometimes KOH) solutions that we use in our DGFC studies. While hydrophobicity can be a benefit in gas-fed PEMFC DLs, which are prone to flooding at the cathode [18], but a hydrophobic anode DL presents an obvious impediment to aqueous solutions of reactants, as this will limit availability to the catalyst sites, as well as, inhibiting reaction product removal. Thus, the hydrophobic properties of carbon cloth and carbon paper may be inhibiting power production in DGFCs, as well as, direct methanol fuel cells (DMFCs) [19,21], which also use a dense, liquid reactant.
Prior work with DMFCs [22,23] has shown that increased aqueous solution transport through the anode DL will increase FC performance and it is likely to be accomplished by increased hydrophilicity. Though in earlier work [24], increasing hydrophobicity was cited to be advantageous. Thus, studies continue to consider alternative approaches for the DL. Wang et al. [25] treated a carbon paper DL with nitric acid for 2h at 30 °C to hydrophilize it. A DMFC using proton exchange membrane (PEM) electrolyte and PtRu/C catalyst was used to illustrate an ~25% increase in the peak power density (PPD) as a result of the nitration. On the otherhand, Xie et al. [26] fabricated hierarchically porous DLs using micron-sized carbon spheres held together with an ionomeric, polytetrafluorosulfonic acid (aka Nafion®) binder and evaluated them in DMFC based on PEM and PtRu/C catalyst. They found that the performance enhancement for their new design versus conventional DL was increased at higher current densities where mass transfer effects were most important. Their view was that both transport of fuel to the anode, and reaction product (CO2) away, was improved.
More relevant to our current purposes, Cha et al. [27] recently stated that there were few extant studies on the DL for non-enzymatic (aka abiotic) DGFCs, which we have also found to be the case. Their study [27] reported comparison of a hydrophobic carbon paper DL, with and without polytetrafluoroethylene (PTFE) treatment, and a manufactured microporous carbon layer in an abiotic DGFC using a PEM and PtRu/C catalyst. There was no added KOH. They found that the least hydrophobic, thinnest, and most porous DL provided the most favorable PPD and open circuit voltages. Earlier, Song et al. [28] had also performed experiments modifying the microporous structure made of carbon particles and PTFE, with an undisclosed (patented) alkaline ionomer binder, I2, to attach a Pd/C catalyst to create a microporous layer contiguous to the carbon paper of the anode DL. They used 0.5 M glucose and 2 M KOH in their DGFC, with an anion exchange membrane (AEM) electrolyte, and determined that the thinnest microporous layer with highest PTFE content provided the highest PPD.
Our studies are focused on using cellulose acetate/cellulose as a simple method to hydrophilize DLs for DGFCs. Cellulose is a biopolymer polysaccharide [29] that can be converted to various cellulose acetates [30]. Cellulose acetates are then more easily processed (e.g. coated) than cellulose by dissolution in familiar, polar organic solvents, and then can be deacetylated back toward cellulose by exposure to a strong base, such as NaOH [31] (Fig. 1C). Cellulose monomer units naturally form strong interchain OH–O hydrogen bonds (Fig. 1A) as well as van der Waals (vdW) dispersion forces and weak CH–O hydrogen bonds between sheets. Thus, it is highly hydrophilic, while the vdW dispersion forces within crystalline regions of the polymer chain stabilize the polymer structure to keep from dissolving in water [30,32] (Fig. 1B).
Fig. 1.
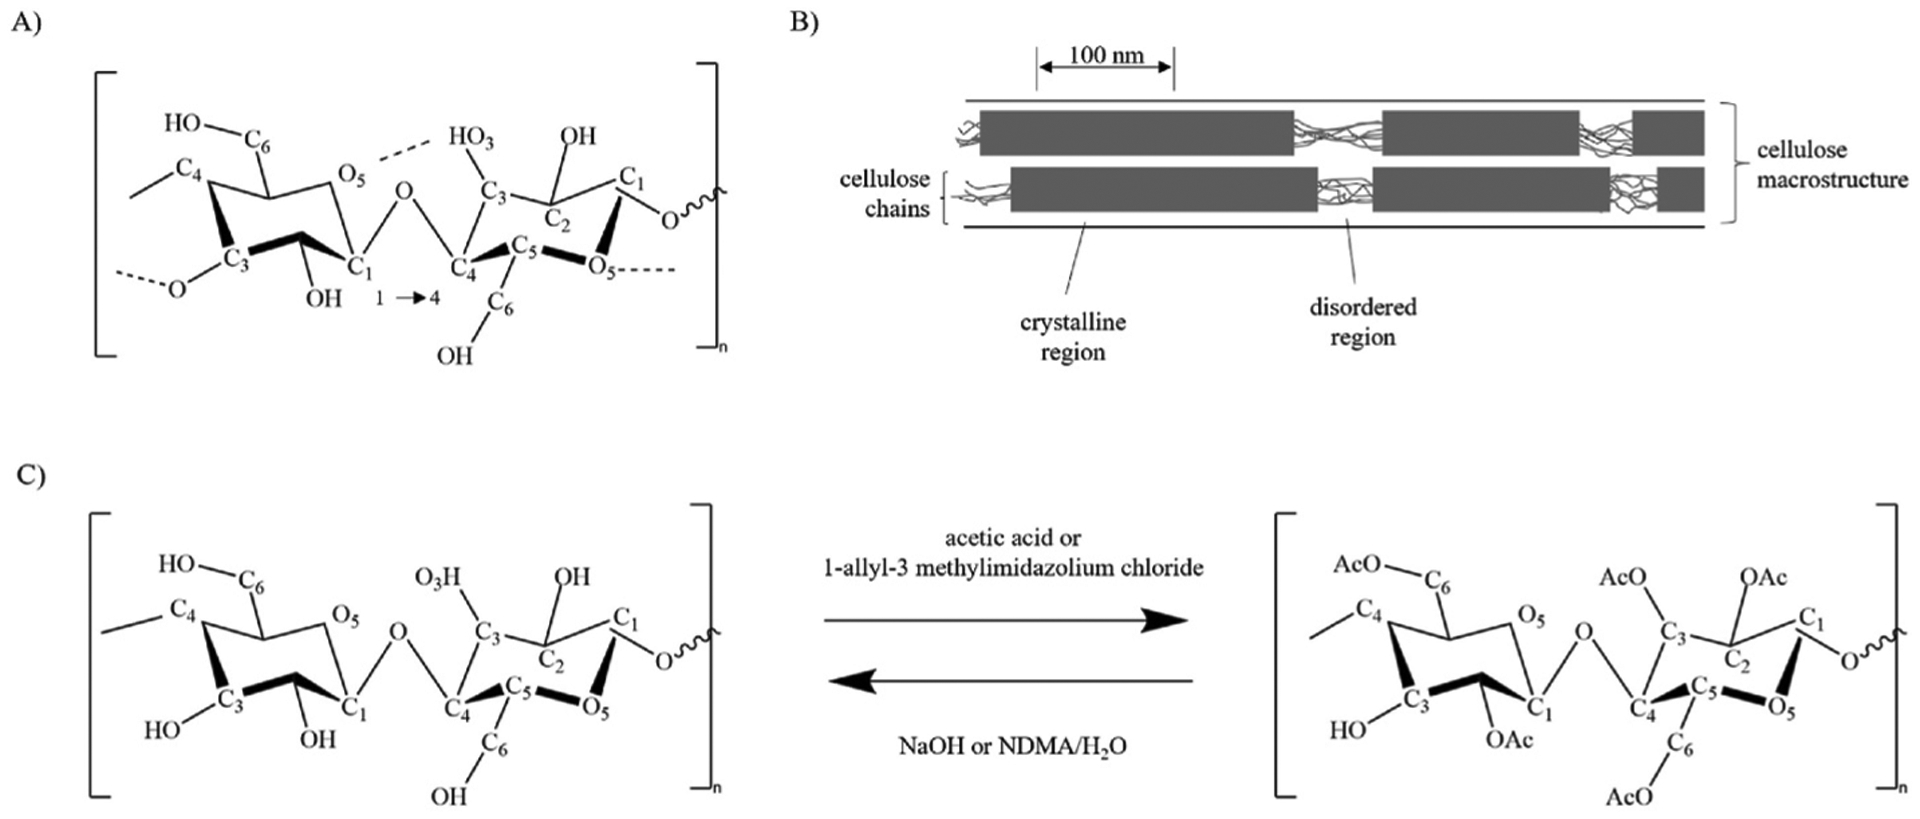
A) cellulose monomer with hydrogen bonds, which contribute to hydrophilicity. C) Acetylation and deacetylation of cellulose (left) into cellulose acetate (right). Acetylation and deacetylation are expected to be completed to varying degrees (with more or less sites converted to AcO or OH) based on the amount of time spent in alkaline or acetic acid solution. A and B are reproduced from Ref. [32] under creative commons licensing (https://creativecommons.org/licenses/by/3.0/legalcode). C reproduced with modification from Ref. [31].
Additionally, cellulose and cellulose acetates have been implemented in a variety of bodily-fluid interfacing medical devices. Cellulose acetate (CA) is considered as a biodegradable, renewable, non-corrosive, non-toxic and biocompatible material, making it an ideal candidate for investigation within a medical device [33]. Recently, an electrospun CA nanofiber has been implemented in a biosensor for blood glucose [34]. The sensor, which was deacetylated with NaOH solution, showed high sensitivity to glucose within the 3.3–27.7 mM range. More broadly, cellulose and cellulose acetates are commonly used as membranes for hemodialysis due to the low thrombogenicity and high water transport [35].
In this work, we present the effect of a simple CA coating of a carbon cloth DL to increase performance of an AEM DGFC by improving aqueous solution transport at the anode. Due to our interest in an alkaline cell, we also investigate the effect of possible CA deacetylation when placed in a strongly alkaline solution. To investigate the individual factors that may influence power generation in a fuel cell with this modified DL, we isolated 1) fuel-DL adhesion 2) fuel-DL permeation, and 3) DL electrical resistance, followed by 4) characterizing fuel cell power characteristics using polarization curves.
2. Methods
2.1. Carbon cloth treatment
Plain carbon cloth was cut to size from stock (1071 HCB, 351 μm thickness, Fuel Cell Store, USA). Cloth was treated with either 0, 0.5, 1, 2, or 5% by mass cellulose acetate (CAS: 9004-35-7, Sigma Aldrich, USA) in acetone (CAS: 67-64-1, Macron, USA) or pure acetone solution. The cloth was then dipped (immersed) with forceps in coating solution for 10s, then dried on glass petri dish for 1h at 60 °C. For each CA solution concentration %, 24 samples were weighed before CA treatment and after drying to quantify CA loading on the carbon cloth. Samples were then immersed in the following treatment solutions for 12h: either 0.5 M NaOH (CAS:1310-73-2, Fisher Chemical, USA) or 0.5 M NaCl (CAS:7647-14-5, Fisher Chemical, USA). Following treatment, samples were rinsed for 15s using 50 mL flowing DI water, then were dried for 1h at 60 °C.
2.2. Volumetric permeation
The carbon cloth samples were clamped with a gasket underneath a graduated funnel (Pyrex no. 33971-300) with a 3.24 cm2 permeation area. Samples were wetted by having 100 mL DI water poured through the funnel three times while time to permeate was measured. Following wetting, 100 mL of fuel solutions containing various concentrations of glucose (CAS:50-99-7, Fisher Chemical, USA) and KOH (CAS:1310-58-3, Fisher Chemical, USA) were poured into the top of the funnel, without any applied pressure besides the liquid’s height (≤4 cm). The elapsed time for the fuel to completely move through the carbon cloth was measured three times for each sample in a consistent fashion to facilitate comparisons among the treatments and fuel compositions. Samples were prepared for 0, 0.5, 1, 2, and 5% mass CA in acetone treated with either NaCl or NaOH for n = 240 trials.
2.3. Roll-off angle
Roll-off angle was measured using a custom-fabricated roll-off device (shown schematically in Fig. 2). 3 cm × 1 cm DL cloth samples were affixed flat onto the plate by taping the edges. A 100 μL drop of fuel solution was placed on top of it, and visual data was recorded using a DinoLite® Eagle digital microscope while the angle was recorded using a 2GIG Inclinometer. Samples were rotated from horizontal at a rate of 1.1°/s until the solution droplet rolled off the cloth. The plate’s angle of rotation when the droplet rolled (defined as any movement on the surface of the cloth) was recorded. Contact angle was recorded using 0.01 M glucose at maximum angle before rolling off of the cloth sample, and contact angle hysteresis was calculated as |Angleleading – Anglereceding|. For roll-off experimentation three samples were prepared of each CA loading and salt treatment (NaCl or NaOH) condition, for n = 120 total trials.
Fig. 2.
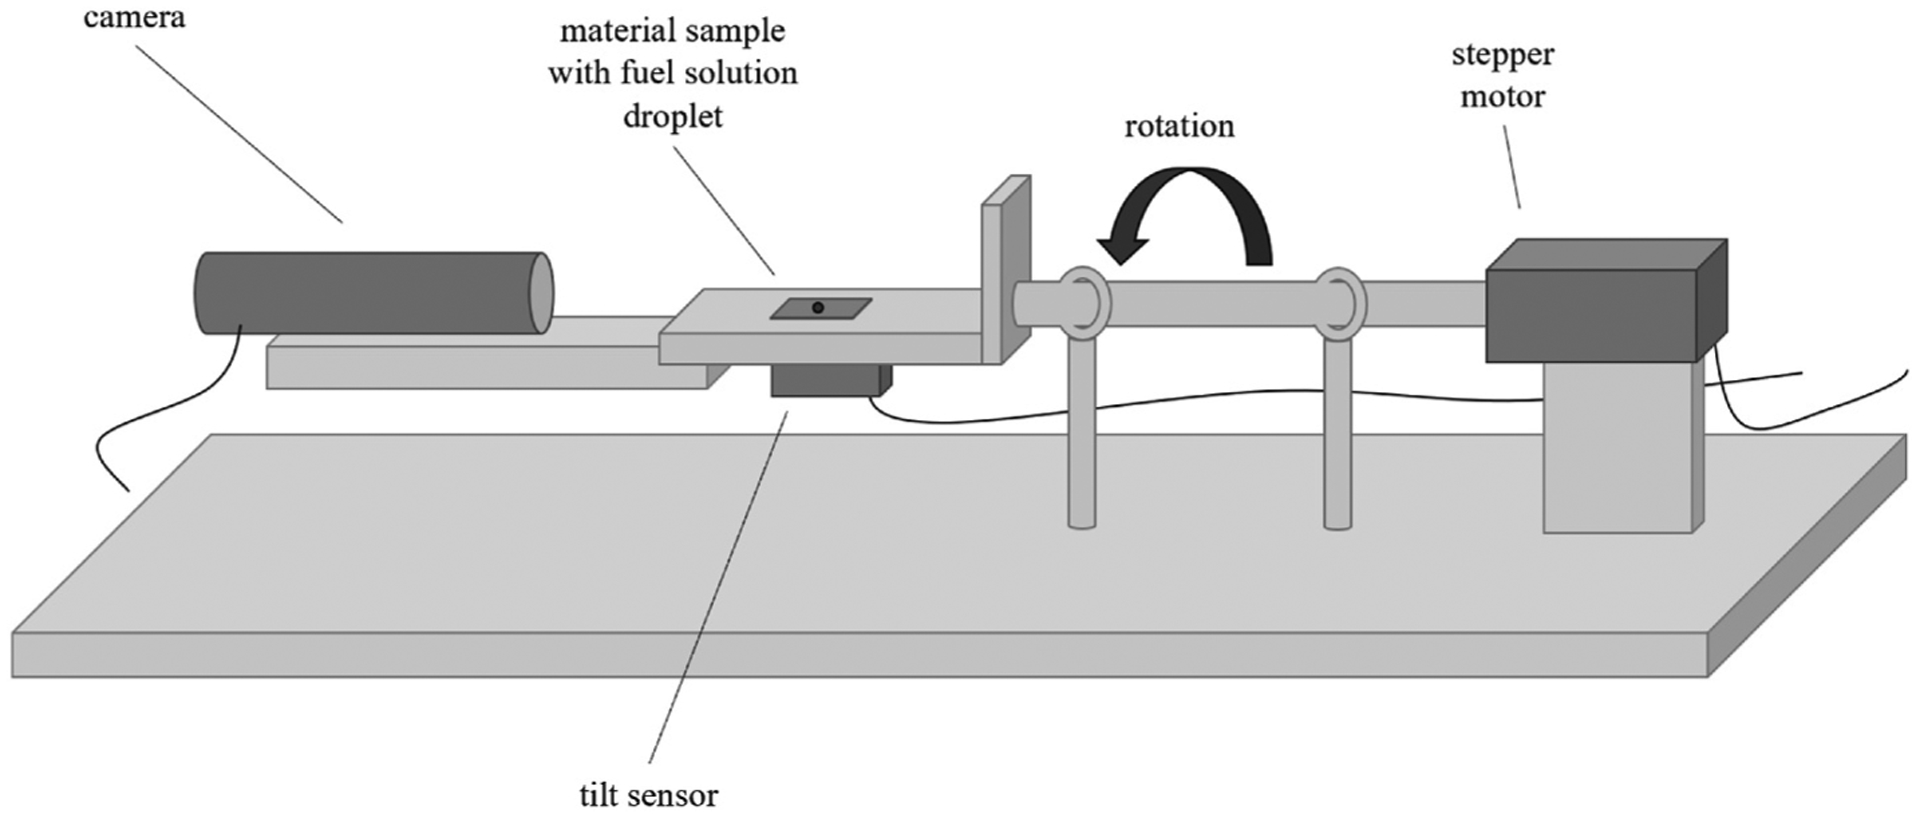
Schematic of roll-off angle measurement fixture that is covered in an acrylic enclosure during measurements.
2.4. Sheet conductivity
The sheet surface conductivity was measured and calculated according to the Van Der Pauw method [36,37]. Small wires were held against the corners of a 1 cm × 1 cm sample (using a homemade clamping fixture). Current was supplied using a Hewlett Packard E3615A current source and voltage was measured using a Keithley 2002 multimeter. Samples were prepared for 0, 0.5, 1, 2, and 5% by mass CA in acetone treated with either NaCl or NaOH. Twelve samples were prepared for each CA loading + electrolyte solution treatment condition, and each sample was measured at twelve probe locations across the surface of the sample.
2.5. Electrochemical cell
Electrodes (carbon support painted with ionomer and catalyst) were fabricated from carbon cloth (1071 HCB, 351 μm thickness, Fuel Cell Store, USA) loaded with Pt black (12755, Alfa Aesar, UK) catalyst at 3.125 mg/cm2 using FMN1 ionomer [38] to create a more alkaline environment proximal to the catalyst. Carbon cloth was cut to size (9.6 cm2), dipped in varying loads of cellulose acetate, and dried 1h at 60 °C. To prepare catalyst-ionomer slurry for assembling the MEA, 30 mg Pt black was suspended in 66 μL DI H2O, 155 μL isopropanol (IPA) (70% mass relative to H2O), and 111 μL FMN1 ionomer via 1h sonication at 40 kHz. Catalyst-ionomer slurry was evenly painted by hand onto one side of the carbon cloth and was dried for 1h at 60 °C. The electrodes were then soaked in 0.5 M NaCl (CAS:7647-14-5, Fisher Chemical, USA) solution for 12h, thoroughly rinsed with 25 mL flowing DI H2O, then soaked in 0.5 M NaOH (CAS:1310-73-2, Fisher Chemical, USA) for 2h. The electrodes were then rinsed with approximately 25 mL flowing DI H2O before being loaded into the cell.
Our cell electrolyte was an FAA-3 AEM (50 μm thickness, Fumasep, Germany). Membrane was cut to size and soaked 14h in 0.5 M NaCl. The membranes were then rinsed with approximately 25 mL flowing DI H2O before being loaded into the cell.
To evaluate the performance of MEAs, we designed a small benchscale fuel cell with a 9.6 cm2 membrane area. Electrodes were loaded into the cell facing each other, separated by the AEM. The AEMs were measured via micrometer to have a thickness of approximately 62 μm after use in the cell. Two graphite bipolar plates (590327, Fuel Cell Store, USA), one on either side of the electrodes, facilitated current collection from the electrodes; fuel and oxidant dispersal across the electrode surface; and mechanical compression to form the MEA. Teflon gaskets seal the cell to prevent fuel leaking or catalyst poisoning. The cell was held together between two acrylic plates, each having a copper shim pressed to the edge of the bipolar plate to collect current to be directed through the external circuit. Eight screws fastening the cell together were tightened until the MEA thickness was 0.0625 in (~1588 μm).
2.6. Polarization curve
The power characteristics of each MEA were found by measuring polarization curves. Aqueous fuel feed containing glucose (CAS:50-99-7, Fisher Chemical, USA) and KOH (CAS:1310-58-3, Fisher Chemical, USA) was supplied to the anode via a peristaltic pump at 10 mL/min. Humidified O2 was supplied once-through to the cathode at 25 standard cubic centimeters per minute (sccm). Internal fuel cell temperature was measured as the temperature of fuel solution at the liquid exhaust outlet. Before running, the cell was heated to 25.5 °C by running with 32 °C DI water through the anode feed for 45 min; temperature was maintained between 25.5 °C and 27 °C.
To manipulate current through the cell, a variable resistive load (RS-500, Elenco) was attached between the anode and cathode, while potential across the resistive load was monitored with a multimeter (2002 - Benchtop Digital Multimeter, Keithley). The open circuit voltage (OCV) was recorded for each MEA and fuel combination after running for 30 min with a 10 MΩ load. To obtain polarization data, resistance was gradually stepped down until either a minimum load of 0.79 Ω was reached or potential across the cell fell beneath 0.1V. Potential across the cell was recorded 2 min after each step down in resistance to allow the potential to settle to a constant value. Power has been normalized to power density (mWcm–2) using the 9.6 cm2 membrane interface of our MEA. An integral of the polarization curve (integrating potential with respect to current until voltage reached 0.1 V), was used as a metric to compare MEA performance, in addition to OCV and maximum power output.
The cell was fed with aqueous fuel to the anode and humidified O2 gas to the cathode. Anode fuel composition was varied between 0.01 M – 0.5 M glucose and 0 M – 0.5 M KOH. The aqueous KOH and glucose solutions were prepared separately at twice the molarity reported; were warmed to 32 °C; and then were mixed in-line in equal volumes approximately 10s before being fed into the cell to reduce the amount of pre-reaction occurring between the glucose and OH− outside of the cell.
3. Results and discussion
3.1. Carbon cloth coating
The mass gain of the carbon cloth against the concentration of CA in acetone is presented in Fig. 3. It monotonically increases for the constant immersion time of 10s. There is certainly sample by sample variability as indicated by the uncertainty bars (1 standard deviation) for the 24 samples at each condition. We also show typical microscopic images of the uncoated carbon cloth, and samples coated from 2% to 5% solutions. There is little visual evidence of the coating other than slightly thickened fibers. Nonetheless, the Raman spectroscopy signal was saturated by background fluoresence from CA, with our instrument’s laser (512 and 785 nm), when compared to spectrum of the uncoated carbon cloth. Thus, this and the mass gain confirms coating occurred. In the following sections, we use the value of the CA concentration in the coating solution as a labeling surrogate for the effect from adding more mass of CA onto the carbon cloth.
Fig. 3.
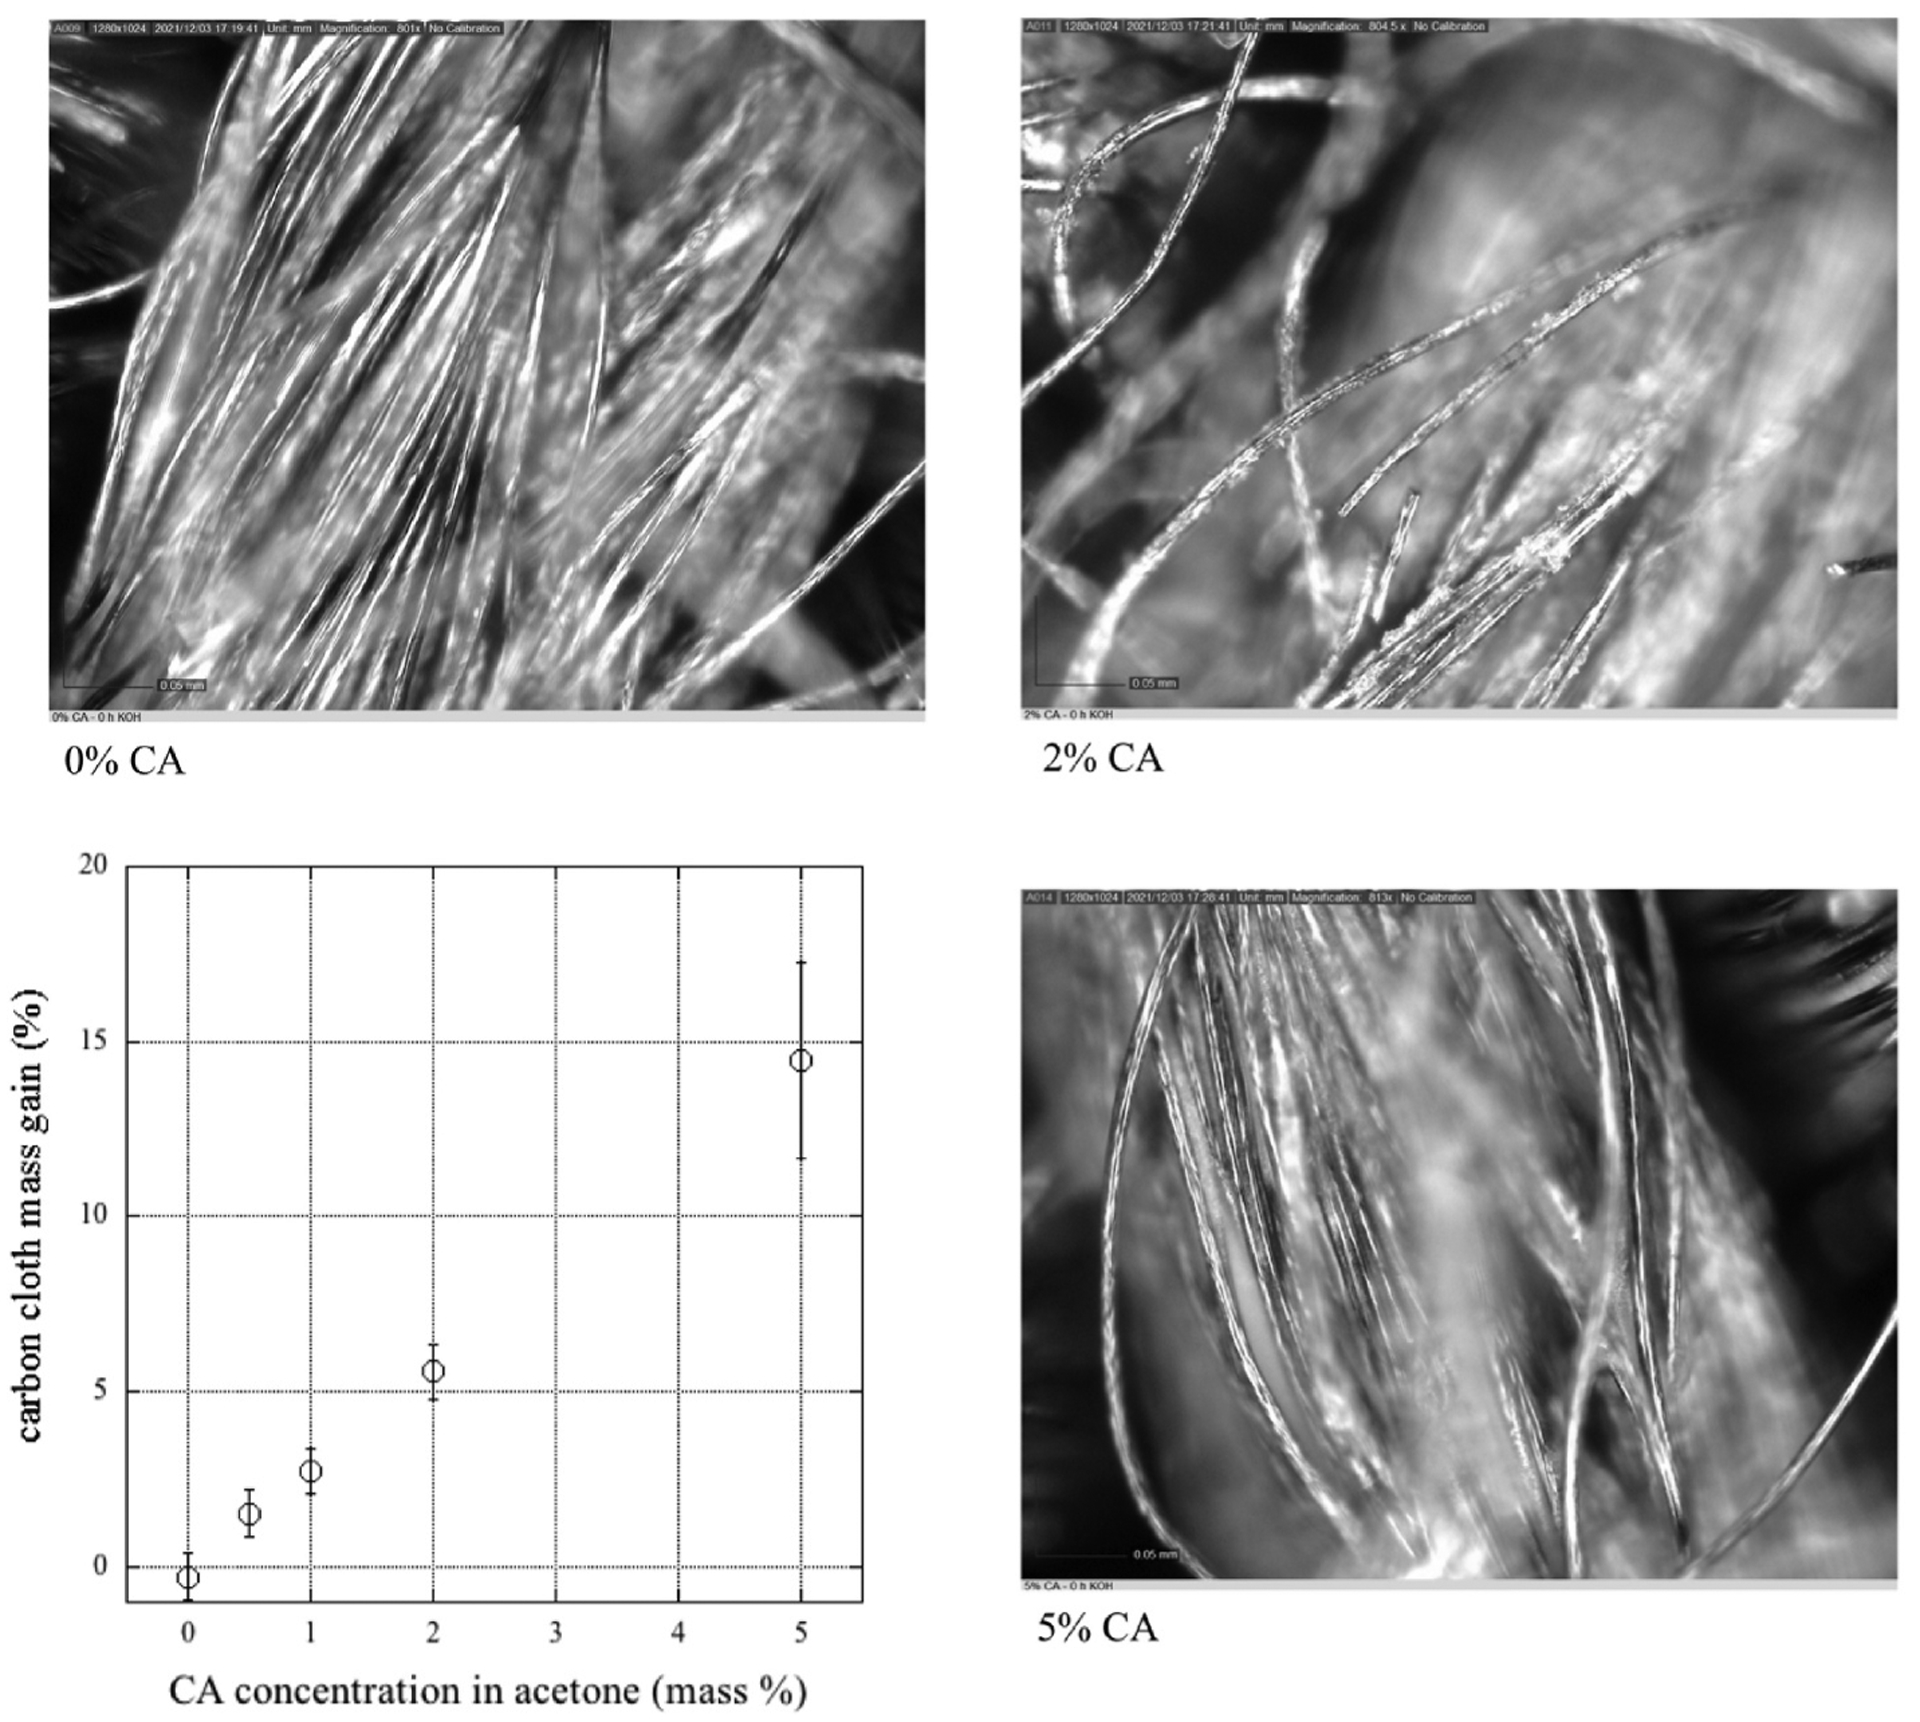
Mass change of the carbon cloth with varying CA concentration in the coating solution. Clockwise from upper left are light microscope images of uncoated (0%), and 2% and 5% CA solution-coated carbon cloths. Scale bars in images are 0.05 mm.
3.2. Volumetric permeation
Fig. 4 presents the time to pass 100 mL of our various fuel solutions (and DI H2O) under their own head for DLs untreated or coated from the different CA concentrations noted previously, and then exposed to either NaCl (Fig. 4A) or NaOH (Fig. 4B) solutions. It should be noted that the CA coating will be subjected to hydrolysis by both any pretreatment with NaOH and by any KOH in the nominal fuel feed mixtures allowed to permeate, though the former occurs over 12h and the latter over 5–8s. We could not determine the degree of deacetylation using Raman spectroscopy as the signal was too weak with our instrument. As noted in Fig. 4C, the statistical analysis of variance indicates that our only significant factor of comparison is whether the DL was coated with CA or not. This result is not surprising since fluid penetration/wicking is governed by surface interactions.
Fig. 4.
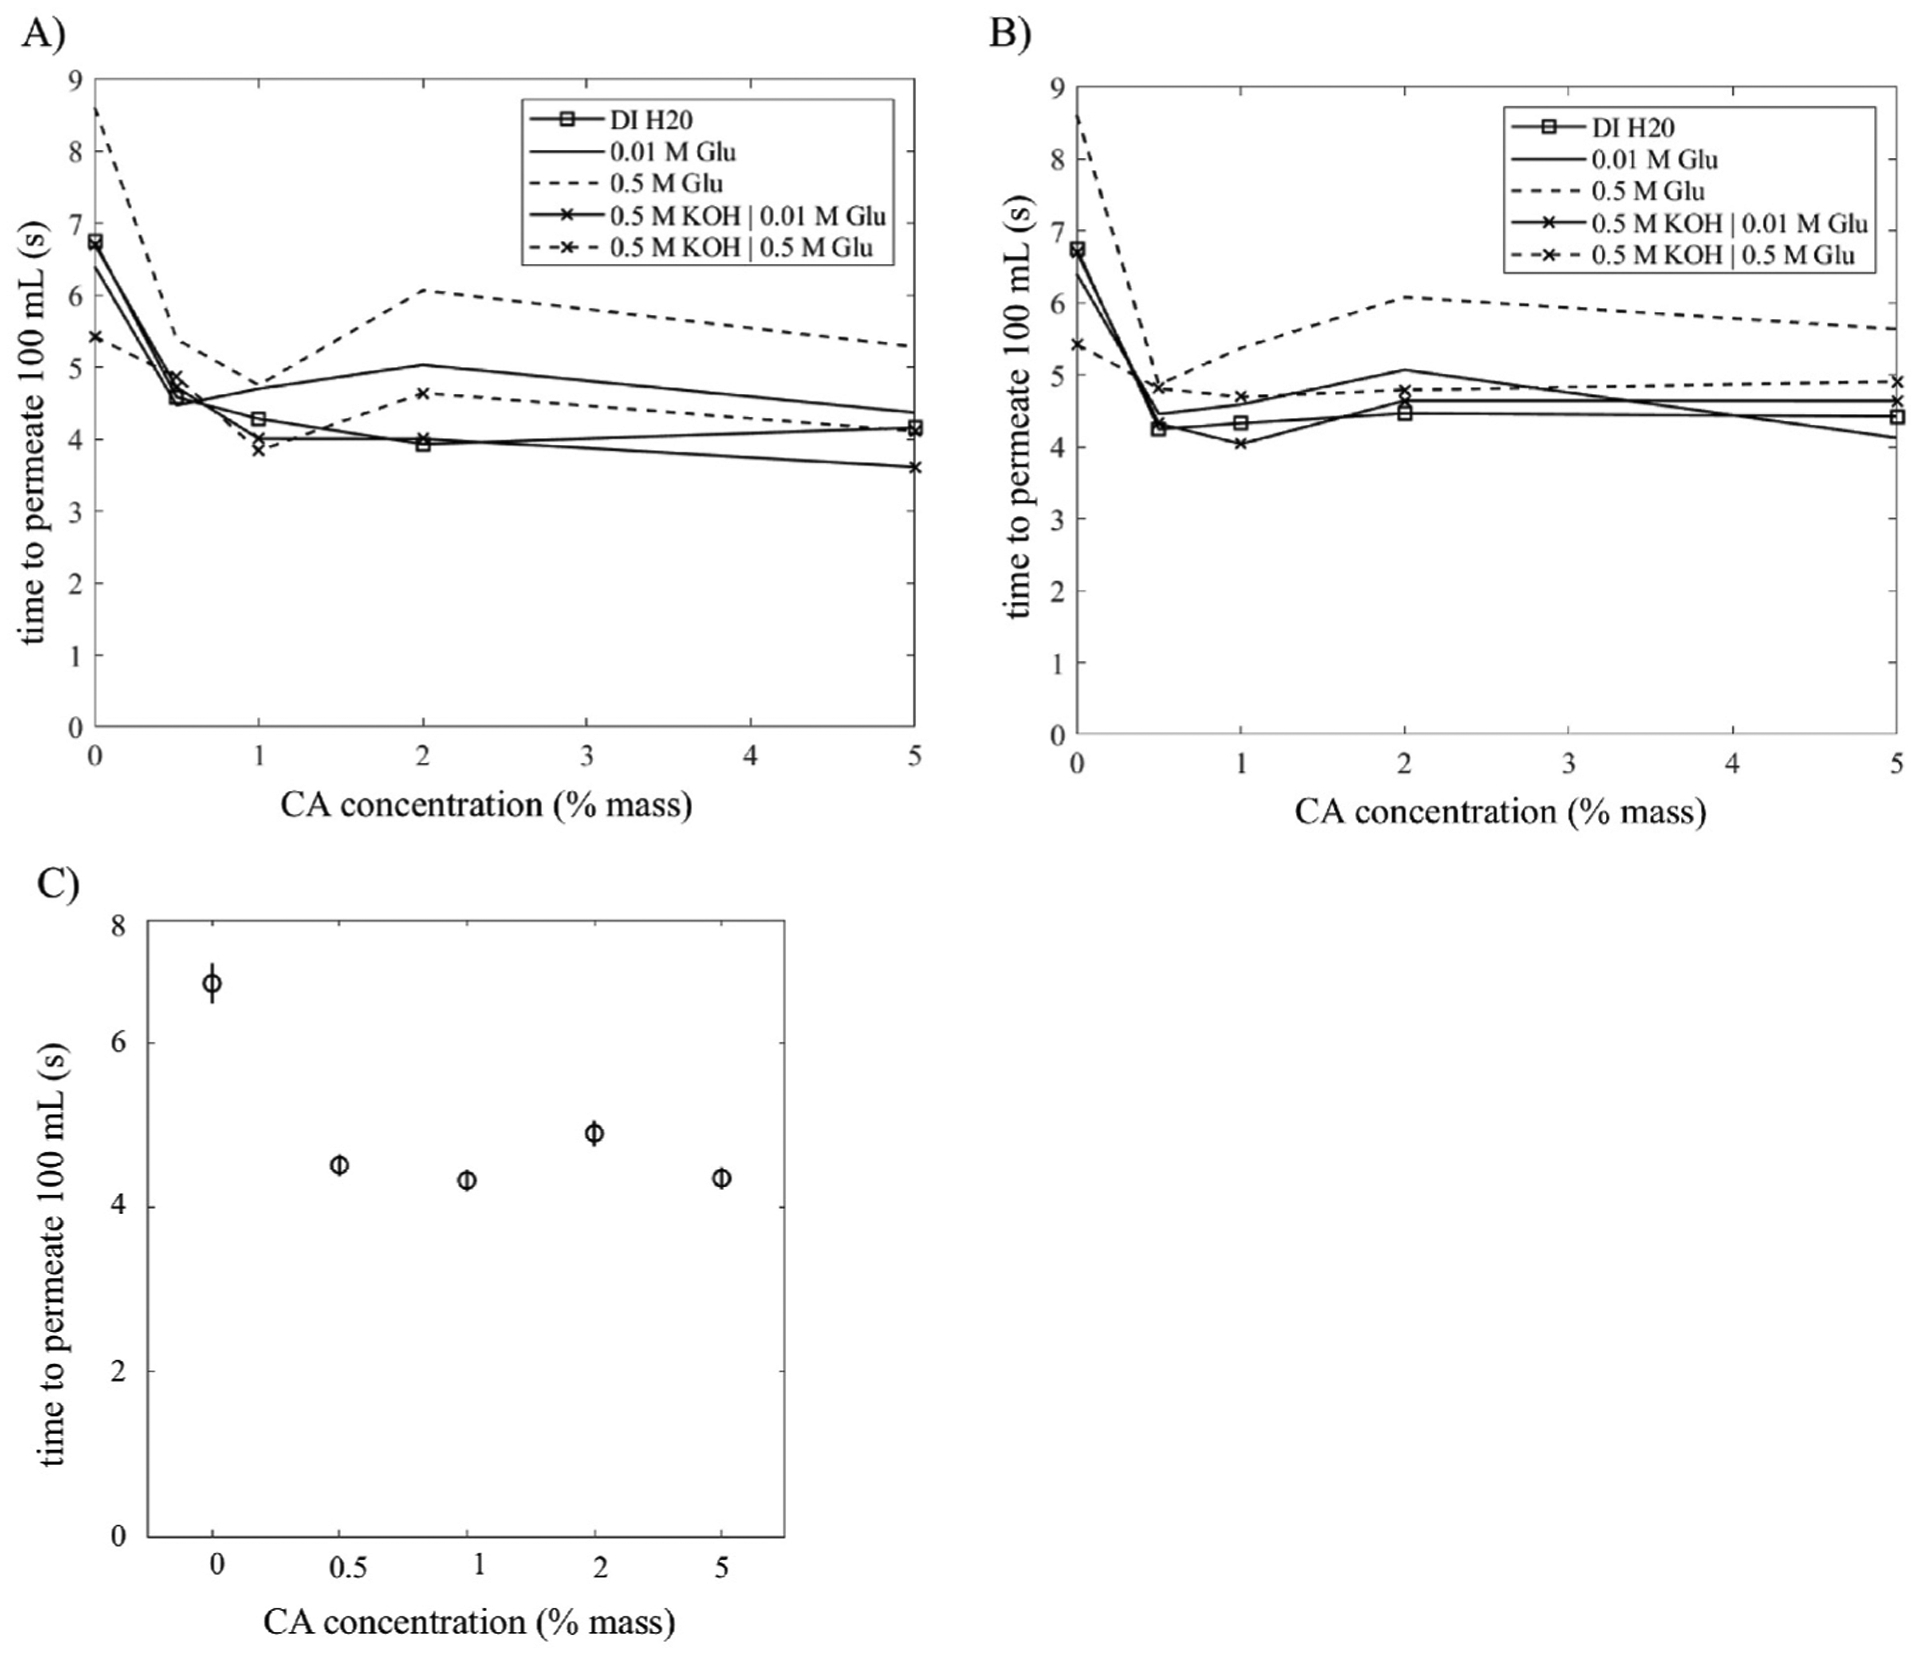
Time to permeate 100 mL of solution through 3.24 cm2 carbon cloth area versus the CA concentration in the coating solution. Data sets are differing composition of the permeating solution. A) CA-coated carbon cloth treated with NaCl or B) with NaOH (lines between data points drawn to guide the eye). C) ANOVA results comparing fluid permeation time through a carbon cloth versus CA concentration in the coating solution. When all post-coating treatments and permeating solutions have been aggregated (n = 256).
The treatment of the carbon cloth with strong base also significantly affected the permeation time (4-way ANOVA, p = 0.03). This indicates that deacetylation of CA to create a higher proportion of hydrophilic hydrogen-bonding sites may be a significant contributor to the permeation time under a slight liquid height. Solutions selected to be tested are typical for use in an alkaline fuel cell such as our own and have been the basis for much of our overall investigations of abiotic DGFC. Both the molarity of glucose (4-way ANOVA, p = 0) and KOH (4-way ANOVA, p = 0) within the fuel solutions significantly affected the permeation time through the carbon cloth.
3.3. Roll-off angle
While the volumetric permeation measurement gives a macroscale understanding of the interaction between the DL and fuel solution, it misses quantifying smaller wetting interactions. To gain further insight into the wetting of the carbon cloth, we performed roll-off measurements, wherein a drop of fuel solution was placed on top of the DL material and then tilted and observed for adhesion. While wetting phenomena are often investigated by measuring the contact angle of a droplet with respect to the material beneath [39,40], we believed the heterogeneities in surface texture of carbon cloth make roll-off angle more probative (see discussion about textured surfaces in Ref. [41]). Thus, we measured the angle at which the droplet of fuel began to move on the DL material (Fig. 5). The ability to rotate to a greater angle was interpreted as an indication of greater surface adhesion between the DL and fuel solution.
Fig. 5.
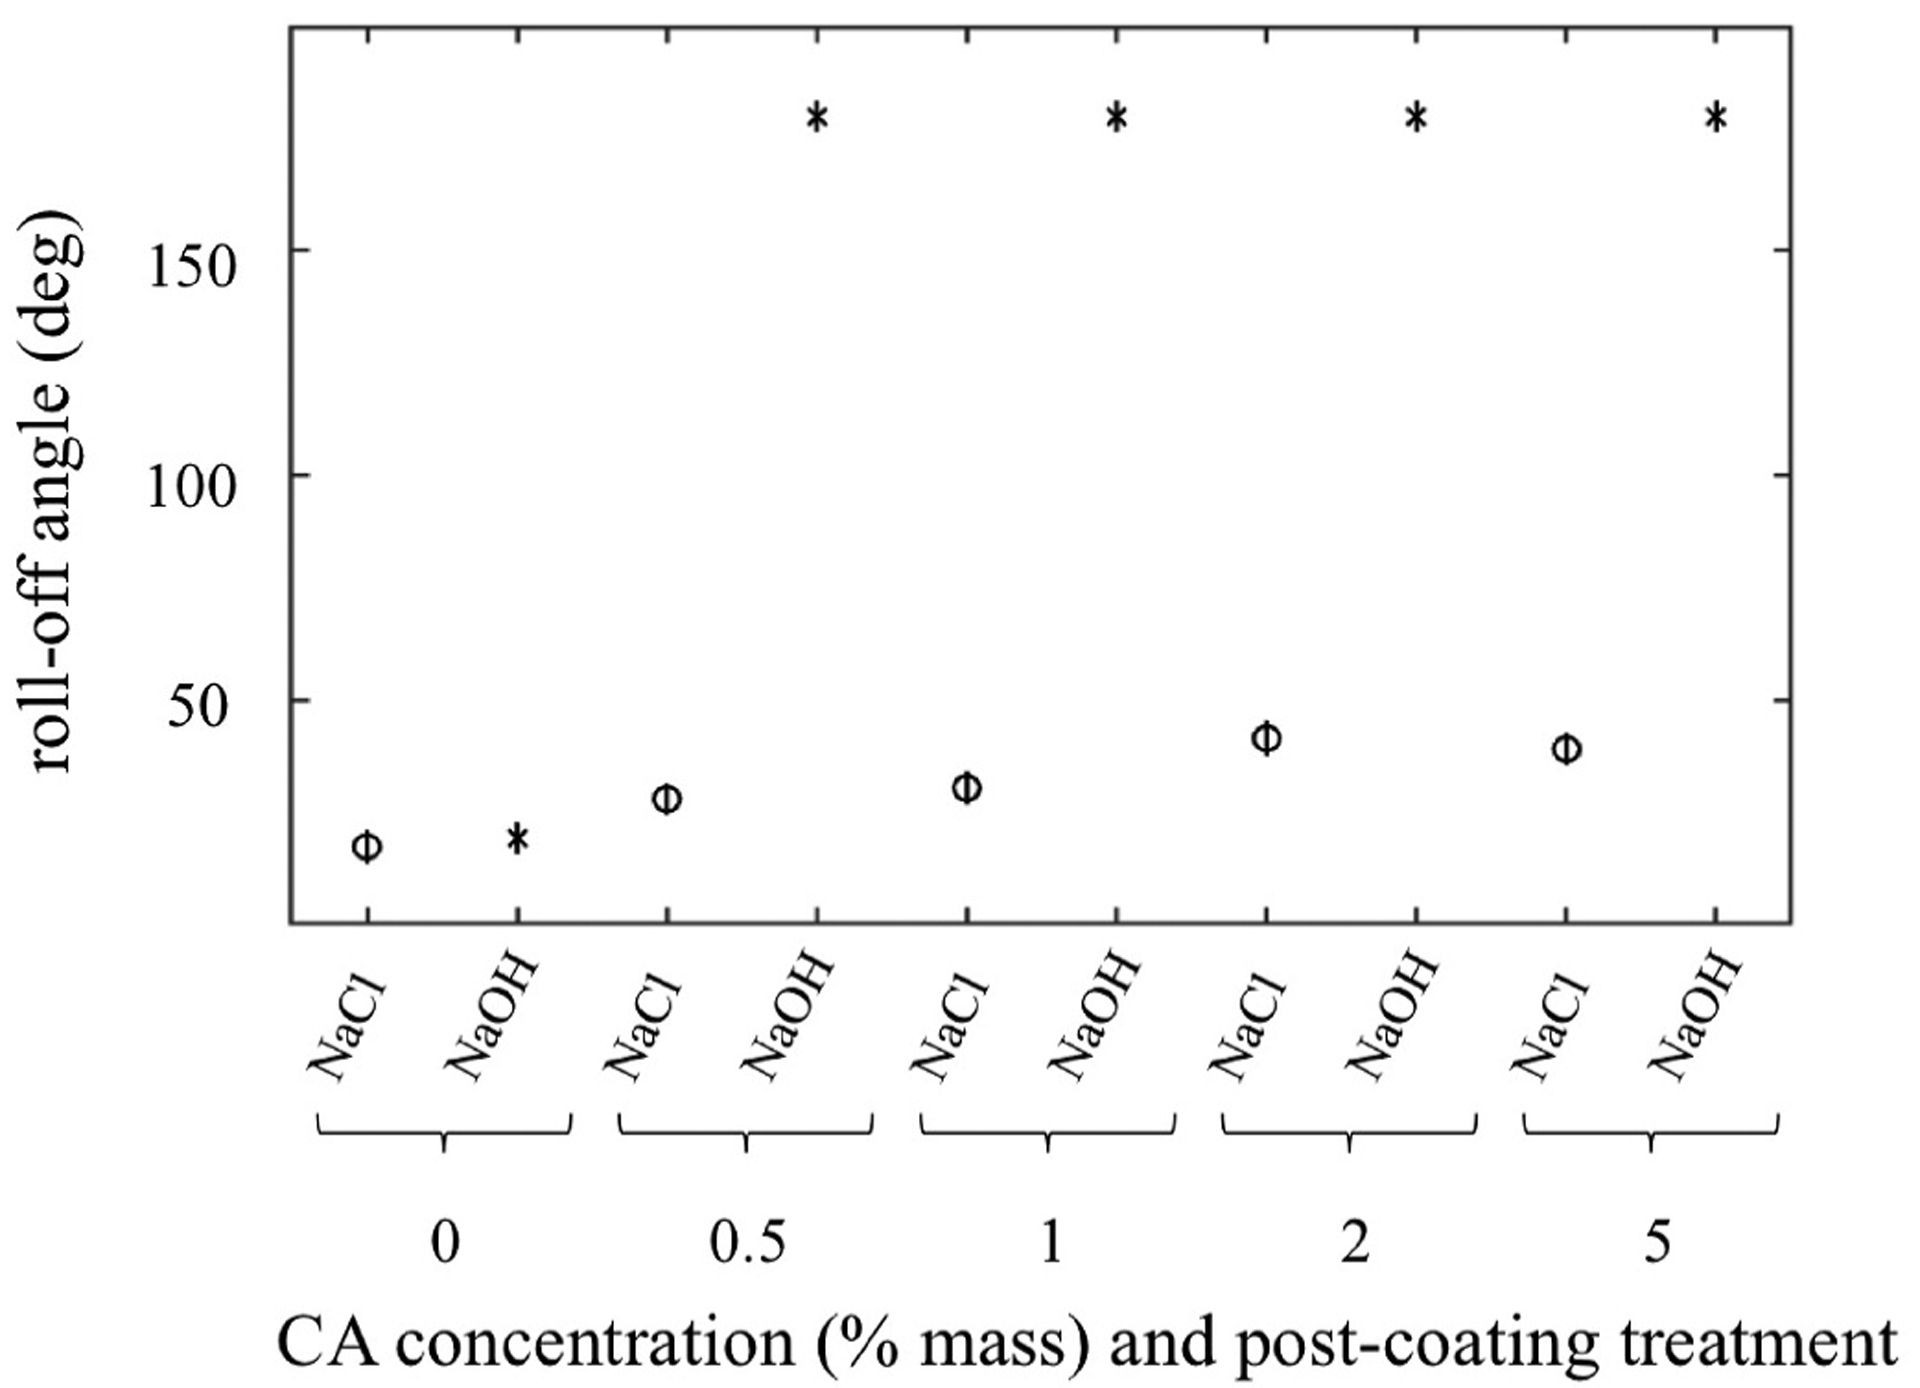
ANOVA results for roll-off angle of varying coating (virgin cloth or cellulose acetate) and treatment (soaked in NaCl or NaOH) of carbon cloth. Note: an angle of 180° was used for cases wherein the droplet immediately wicked into the DL. Vertical bars represent confidence interval for significant difference.
A 4-way ANOVA was performed to find significant differences between treatment, coating, and fuel compositions (concentration of glucose and KOH). Both the CA coating concentration (p = 0) and treatment (p = 0) significantly affected the angle to which the sample could be rotated before the droplet began rolling. Notably, adhesion was so high in the case of the carbon cloth treated with cellulose acetate that was deacetylated with NaOH that the droplet immediately wicked into the cloth sample. Thus, we reported this as 180° since the droplet didn’t roll. Each of these results supports the interpretation that an increasingly hydrophilic coating of the DL material increases permeation capabilities. In the context of a fuel cell, this is particularly important in designs that use little or no pumping, where pressure to drive fuel across the DL would be minimal. Neither the concentration of glucose nor KOH in the droplet was found to have a significant influence on the roll-off angle of the solution.
Droplet contact angles (Fig. 6) were also measured for the nearphysiological 0.01 M glucose fuel solution (no KOH added) droplets directly before rolling. Leading and receding contact angle was measured and contact angle hysteresis was calculated as the difference between these two angles directly before rolling. The large magnitude of the hysteresis (>5°) reflects the highly textured surface of the carbon cloth.
Fig. 6.
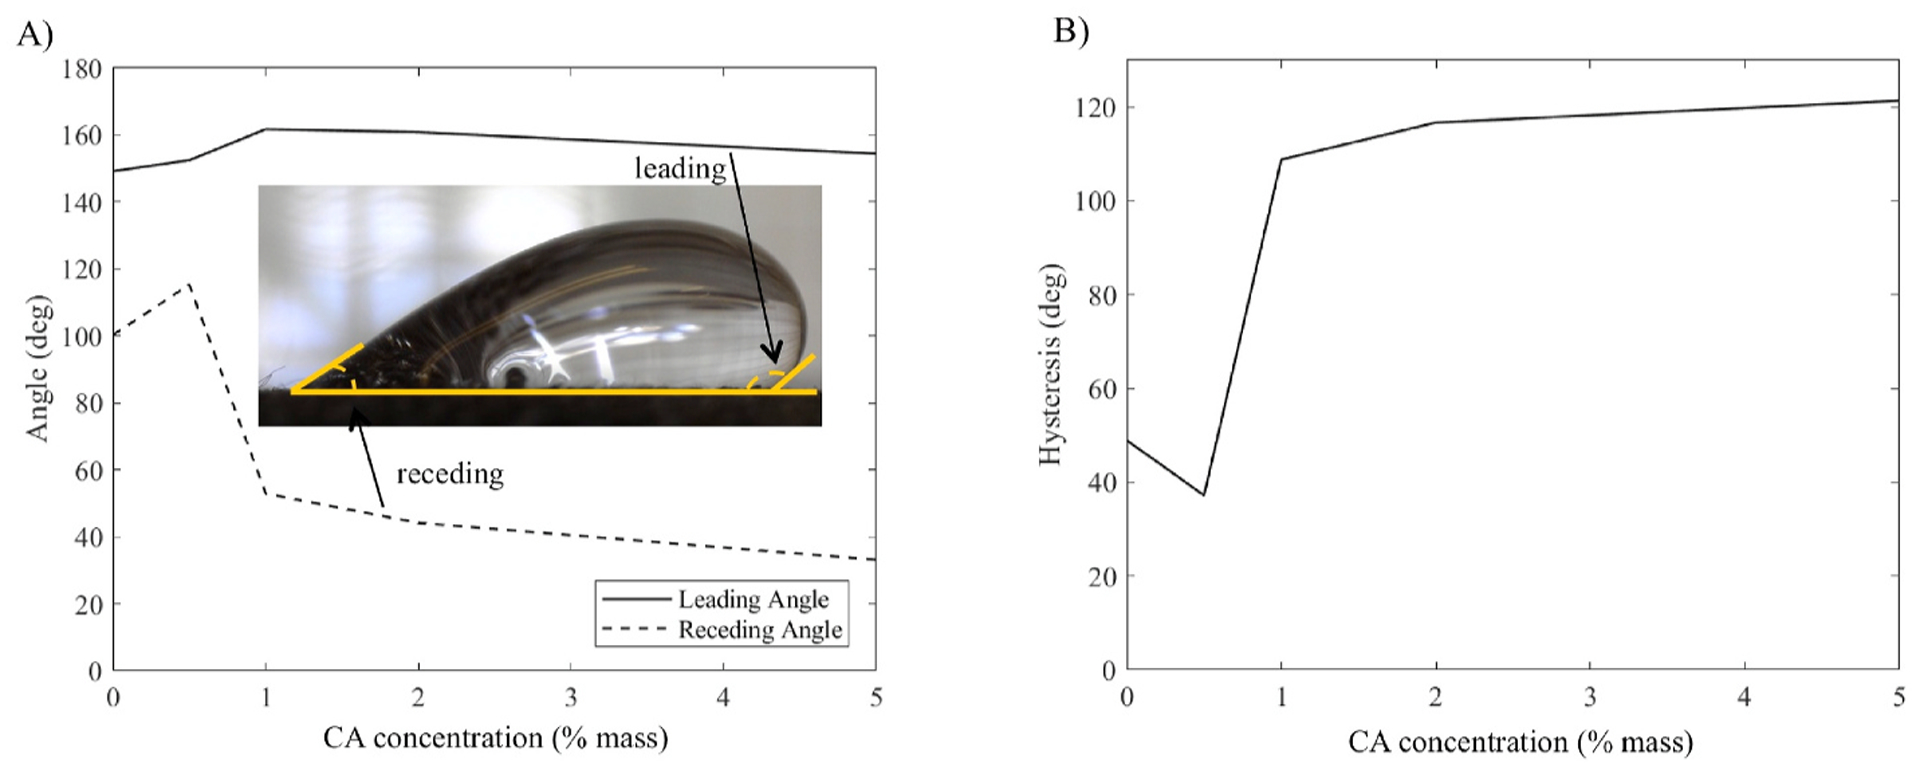
A) Leading (advancing) and receding contact angle measurements for 0.01 M glucose droplets on carbon cloth treated with CA and NaCl. B) Contact angle hysteresis. Angle was not recorded for samples treated with NaOH, as droplets immediately wicked into the cloth for all samples but 0% CA.
3.4. Sheet conductivity
Conductivity is an extremely important attribute for the DL, as it is the only electrical pathway between individual catalyst particles and the current collector for the cell. Electrons must be able to easily move through the DL to minimize ohmic power losses, which increase linearly as current generated by the cell increases [42]. Reasonably, a polymer such as cellulose or CA would be an electrical insulator, so the effect of a polymer coating on the DL must be investigated.
As expected, treating the DL with CA affected the sheet conductivity of the material (two way ANOVA, p = 0)). However, there was no clear trend correlating sheet conductivity to CA loading on the carbon cloth as shown in Fig. 7. This is likely due to uneven coverage of the polymer across the carbon fibers (Fig. 3), which can reduce but not completely eliminate electrical continuity. When our recording electrode tip is touched to the surface of the cloth there is randomness as to whether or not each electrode is touching either a bare or CA-covered region of the cloth. Nonetheless, a rationale for lower sheet conductivity when coating at 2% (mass) CA remains elusive.
Fig. 7.
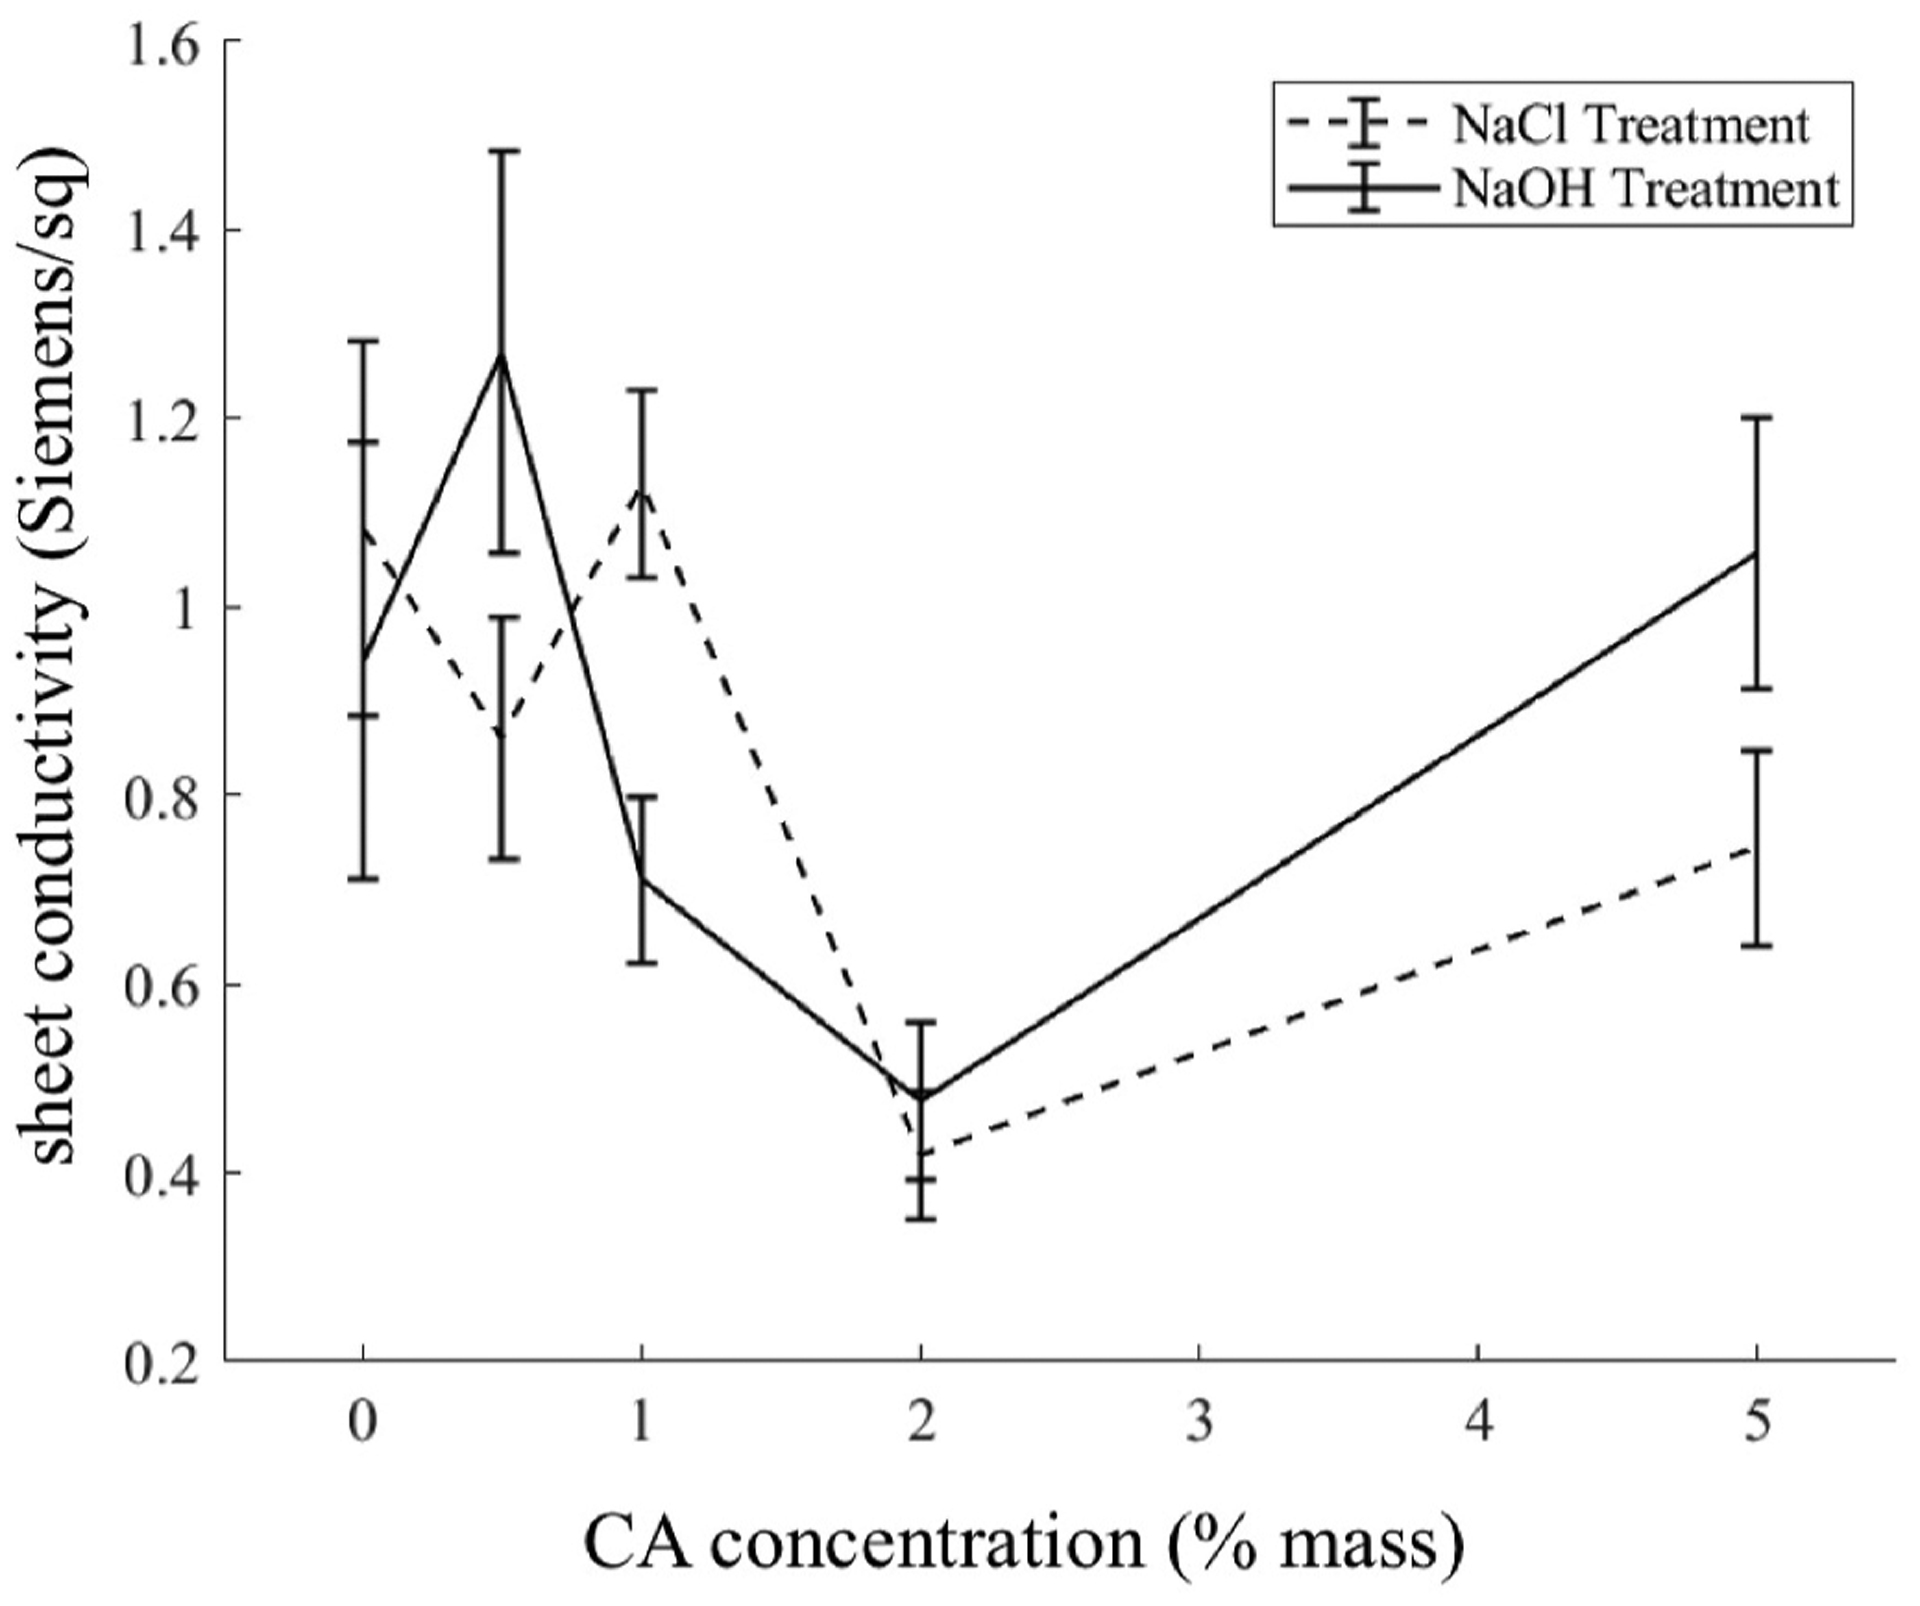
Sheet conductivity of carbon cloth against varying treatments. Bars indicate one standard deviation. Lines have been drawn to guide the eye.
Deacetylation of CA with NaOH treatment did not significantly change conductivity of the carbon cloth (p = 0.33). There is no reason to assume that introduction of hydroxyl vs acetyl groups would allow for increased/decreased conduction within the polymer. Additionally, this stands as evidence that neither the CA layer nor underlying carbon cloth are mechanically degraded by exposure to highly alkaline NaOH solution.
3.5. Power generation
The most important quantification of the effect of DL modification is its effect on power output from the cell. We performed initial polarization testing on MEAs, varying whether the DL was modified with only a 2% CA in acetone solution. We tested MEAs using anolyte fuel solutions with varying glucose concentration 0.01 M – 0.5 M and KOH concentrations 0 M – 0.5 M. A standard step in preparing the electrode is a 2h soak in 0.5 M NaOH, so it is reasonable to assume that the polymer coating was deacetylated to some degree before mounting in the cell. Cell power generation was quantified by the open circuit voltage (OCV) and maximum power density, as well as an integral taken under the polarization curve (from OCV to 0.1V) plotting voltage vs current density. The latter quantity reflects a metric of the overall energy harvesting. The polarization curve results are presented in Fig. 8A for varying glucose concentrations without any added KOH, since the physiological context is our primary interest. These cases will provide very low current density due to both the low pH and our current use of off-the-shelf (unoptimized) catalyst. Fig. 8B, C, and D provides the statistical analysis of the aforementioned figures-of-merit for all the fuel compositions.
Fig. 8.
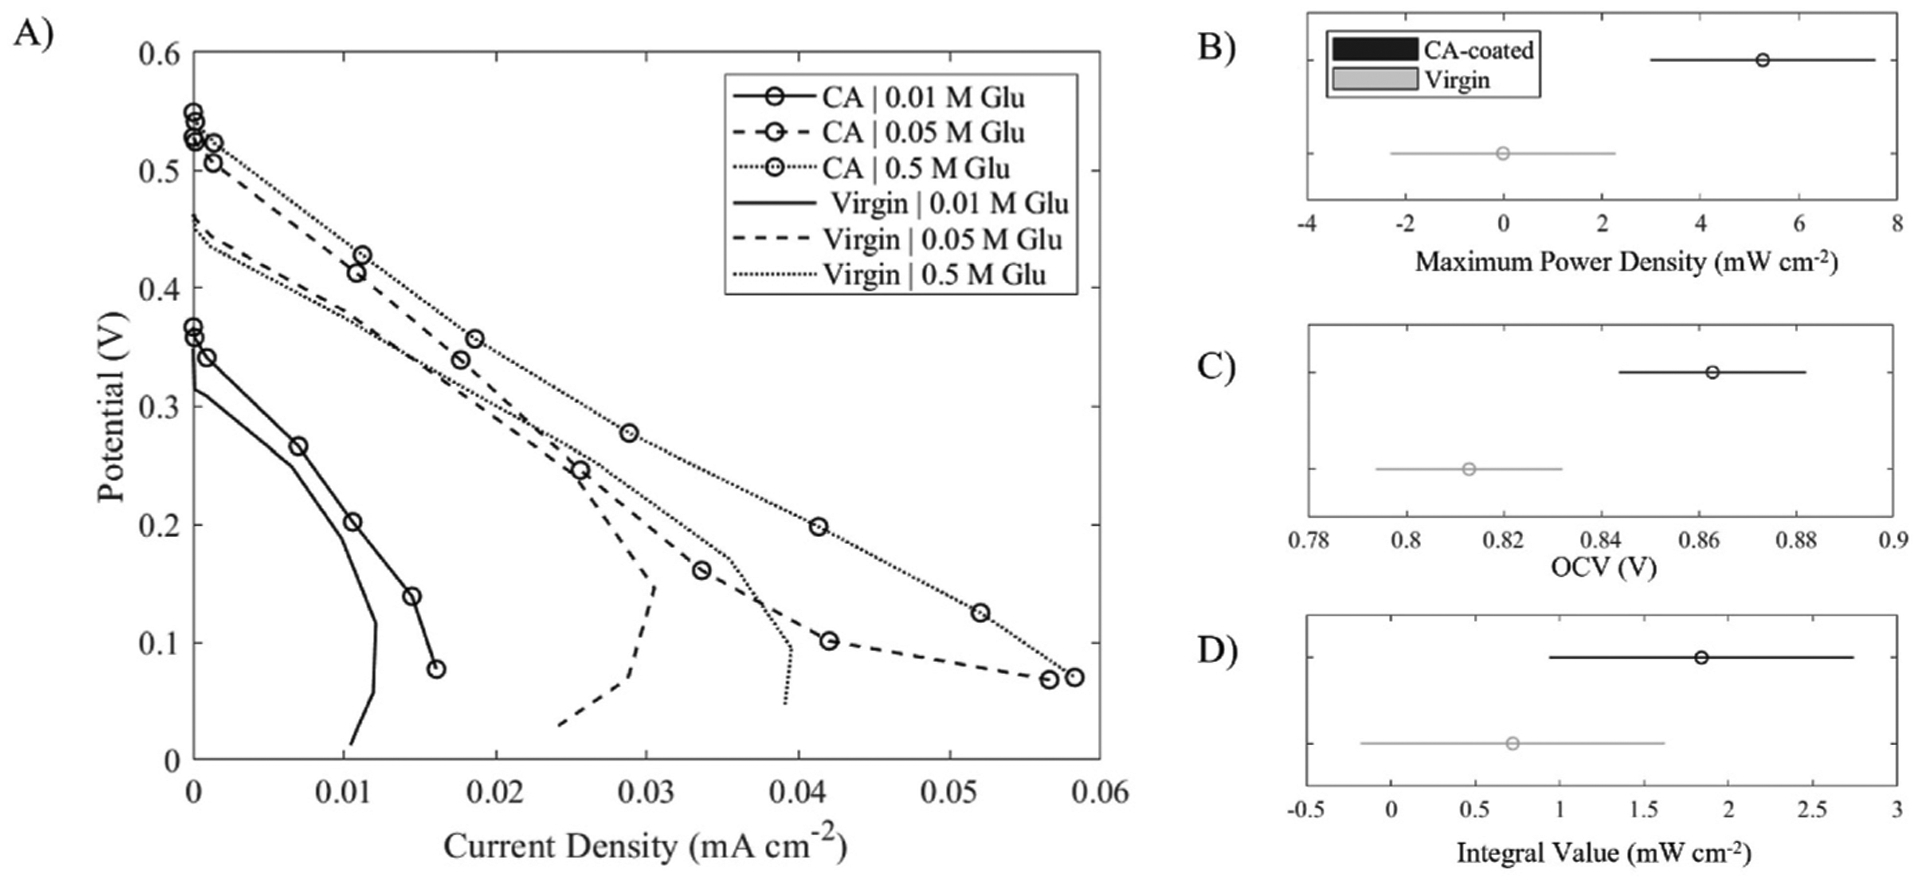
Power generation testing comparing CA-coated (with 2% mass solution) vs virgin carbon cloth DL in a DGFC. A) Polarization curves with and without DL polymer coating and varying anolyte glucose concentration—no KOH was fed. Lines are drawn to guide the eye. ANOVA results comparing CA-coated (black) and virgin (gray) electrode B) power density, C) OCV, and D) integral underneath the polarization curve to between OCV and 0.1 V. Note, negative values in the ranges of significance are artifacts of the plotting routine in the ANOVA analysis function in Matlab®.
We found that CA treatment of the DL significantly increased both the maximum power density (4-way ANOVA, p = 0.02) and OCV (4-way ANOVA, p = 0.01) reached by the MEA across tested fuel solutions. However, the integration under polarization curves (4-way ANOVA, p = 0.22) was not significantly affected by DL modification across all the fuel compositions. These results are likely indicative of the dual effects from better mass transfer but lower electrical conductivity. A greater peak power density is indicative of a greater rate of oxidation reaction taking place, caused by easier access of anolyte to catalyst reaction sites. Similarly higher OCV reflects better catalyst exposure to fuel molecules. However, the insignificant change in area under a polarization curve may point to increased ohmic losses caused by the reduced conductivity of the DL that are more important when higher current densities occur when added KOH is in the fuel feed. A higher peak power may be reached at low current density using a polymer-treated DL, but costly resistive losses make voltage decline more quickly at higher current densities.
Further MEA polarization curve measurements were carried out to evaluate the effects from changing the mass % CA in the coating solution. MEAs were prepared with carbon cloth DL electrodes coated with 0%, 1%, 2%, and 5% CA by mass. Polarization curves were run on the MEAs for two different fuel compositions: ‘high performance’ (0.5 M KOH and 0.5 M glucose) and ‘low performance’ (0 M KOH and 0.01 M glucose. The results for the average maximum power density for three replicates are presented in Fig. 9. For the ‘low performance’ fuel composition and 5% CA in the coating solution, the power reading was below our OCV measurement threshold of 0.1V. ANOVA analysis of these data indicated that all the ‘low performance’ cases were statistically different from each other, as well as, the 2% CA versus the 0 and 5% cases for the ‘high performance’ fuel composition.
Fig. 9.
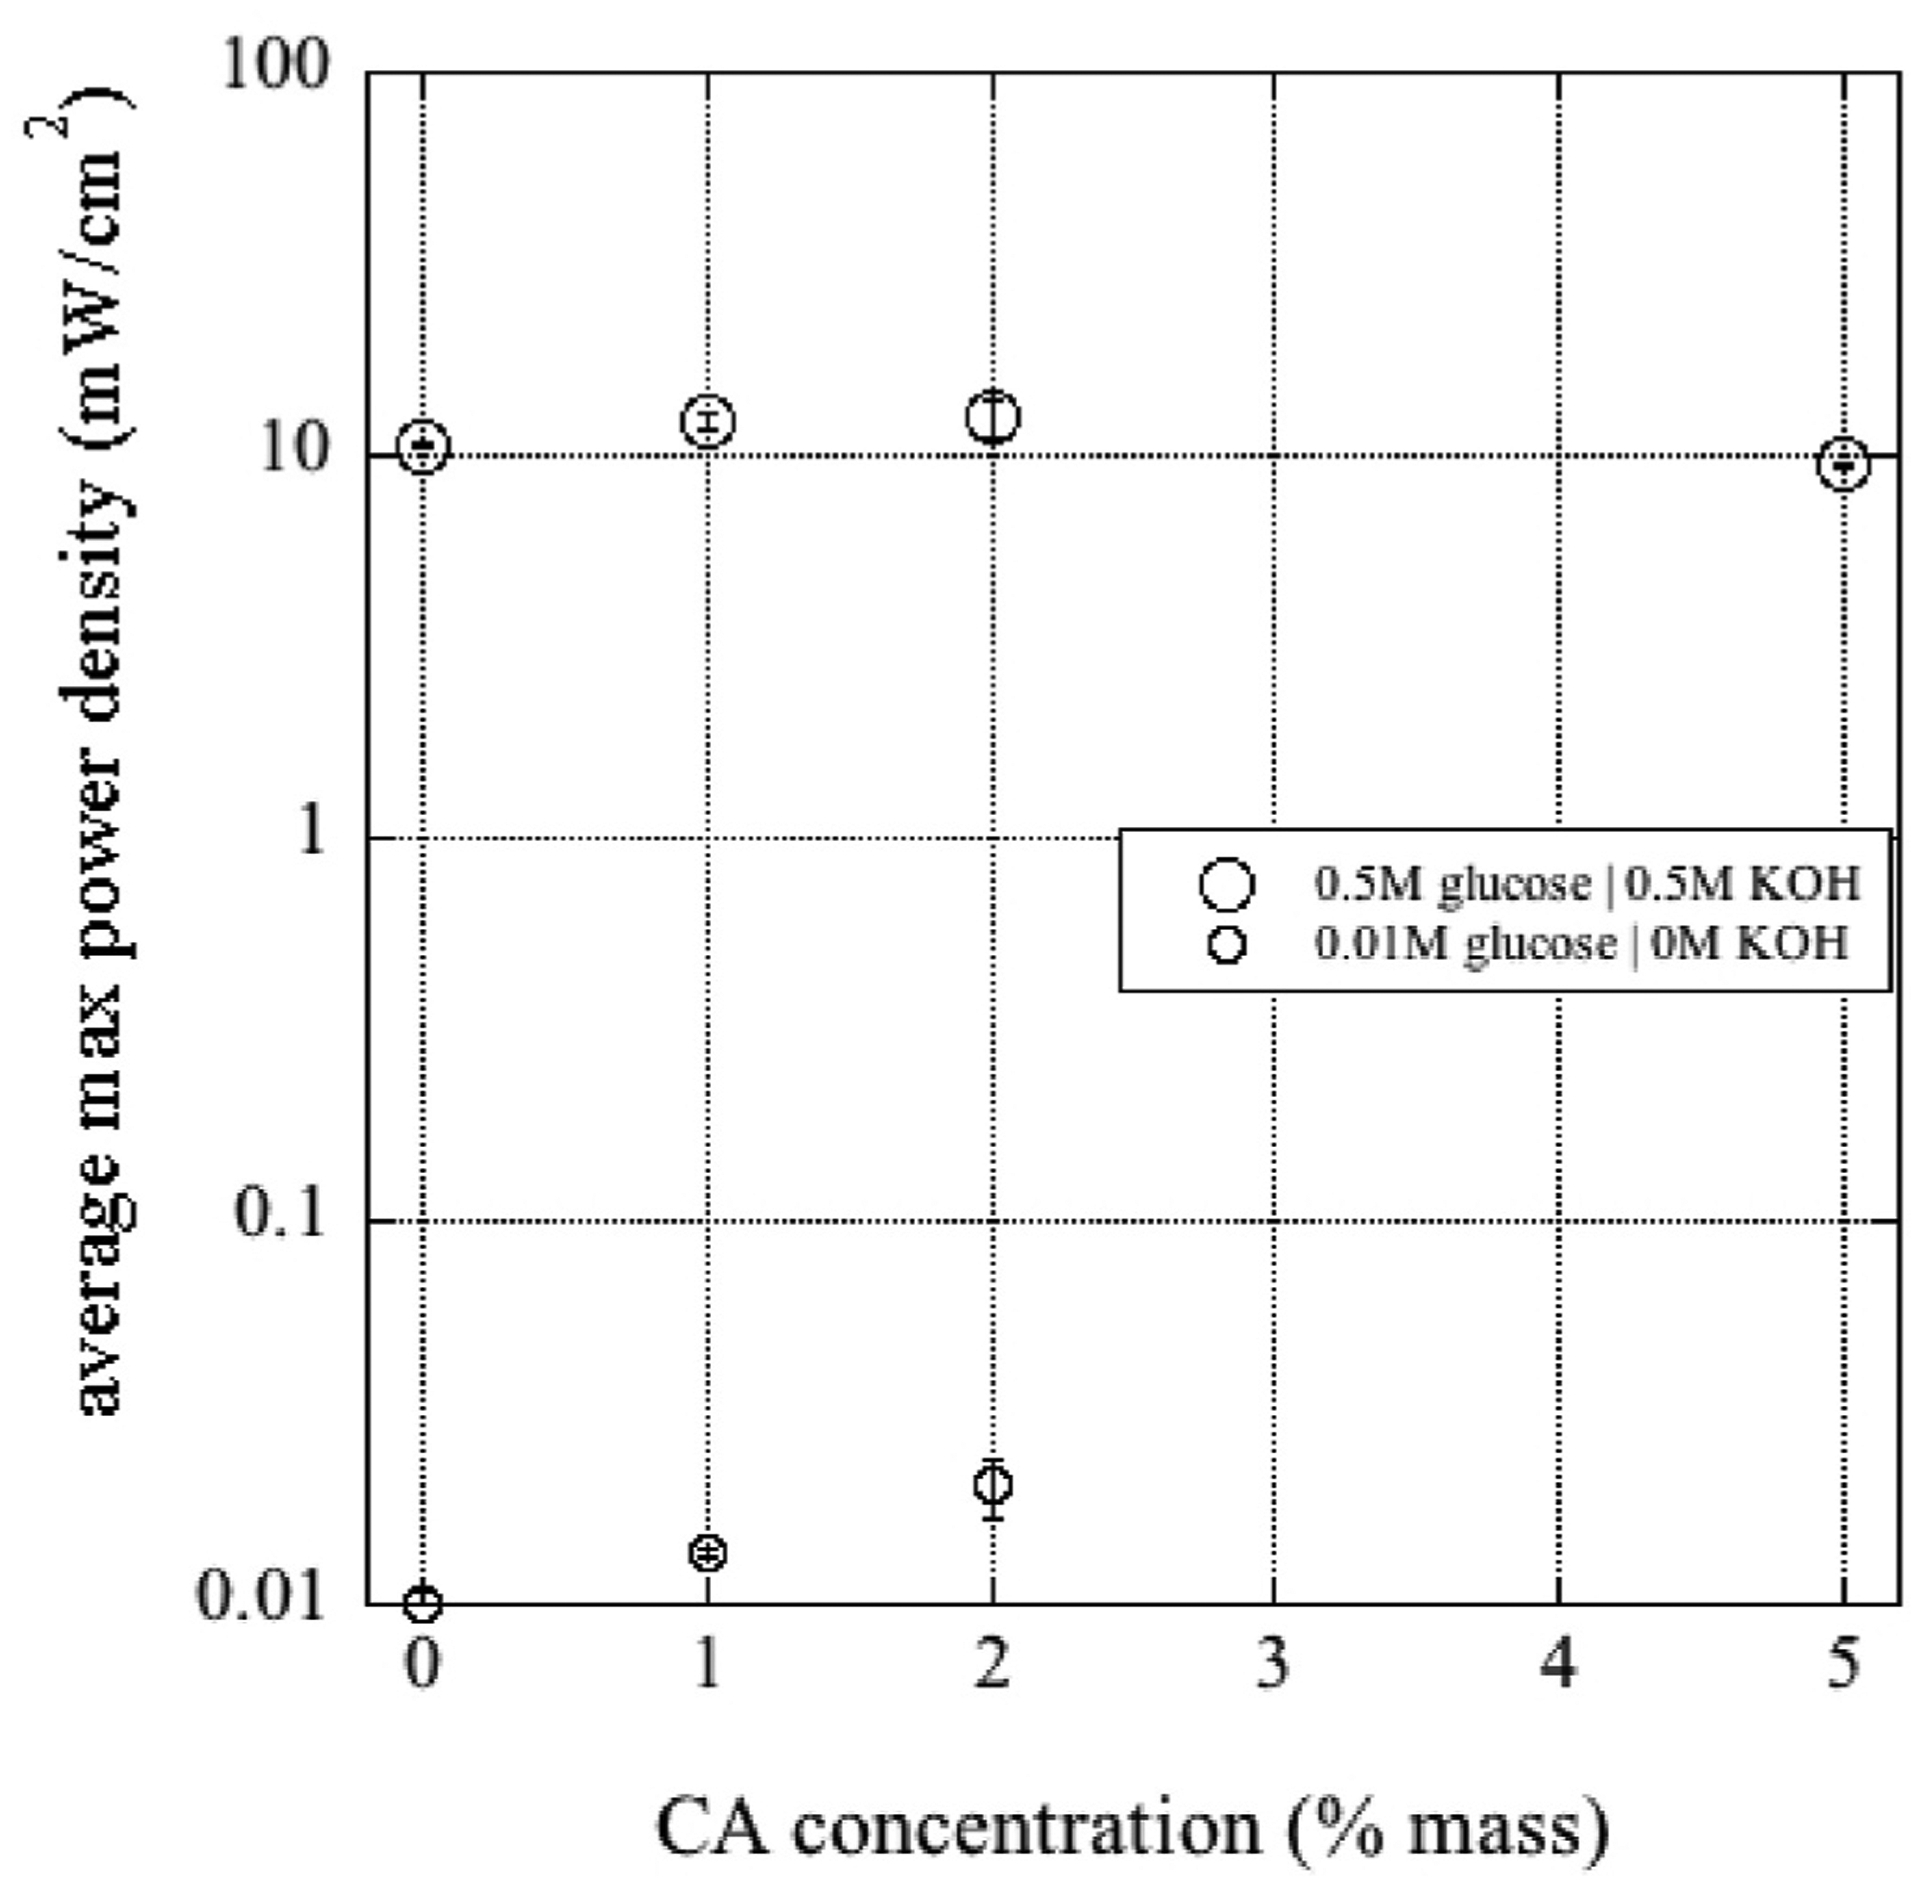
Average maximum power density (mW/cm2) versus the concentration of CA in the coating solution used on the carbon cloth. Uncertainty bars are 1 standard deviation over three replicates.
From our metrics, the 2% CA-coated MEA was generally the highest performing. The reason for the large drop-off in performance for the 5% CA MEA in the ‘low performance’ fuel’s polarization curves requires further study. It is possible that there was too much surface adsorption of glucose onto the deacetylated CA, such that diffusive transport was actually hindered with a low number of percolation pathways.
In addition, after running all polarization curves, MEAs using the ‘high performance’ fuel composition were subjected to a hold at the maximum power, wherein the load on the cell was set to what had experimentally produced the maximum power output, and power generation (voltage and current) was tracked from this point for an hour (see Fig. 10). All DLs had a significant nonlinear decline (loss of 35–55% of their initial power output) in the first 10 min, followed by a continuous monotonic, approximately linear decline to ~25–30% of their initial power value for the remaining time monitored. The DLs coated with 1 and 2% CA solutions had the highest power outputs throughout the monitored period, starting with power outputs of 14 and 11 mW/ cm2, respectively, and declining to ~2.3 and 2.5 mW/cm2, respectively after 60 min. It should be noted that flushing the anode, as mentioned in the methods section, regenerates initial performance. Elucidating mechanisms, and mitigation, of our DGFC’s performance decline are a focus of our continuing research, and motivated our current investigations of CA coating the carbon cloth DL.
Fig. 10.
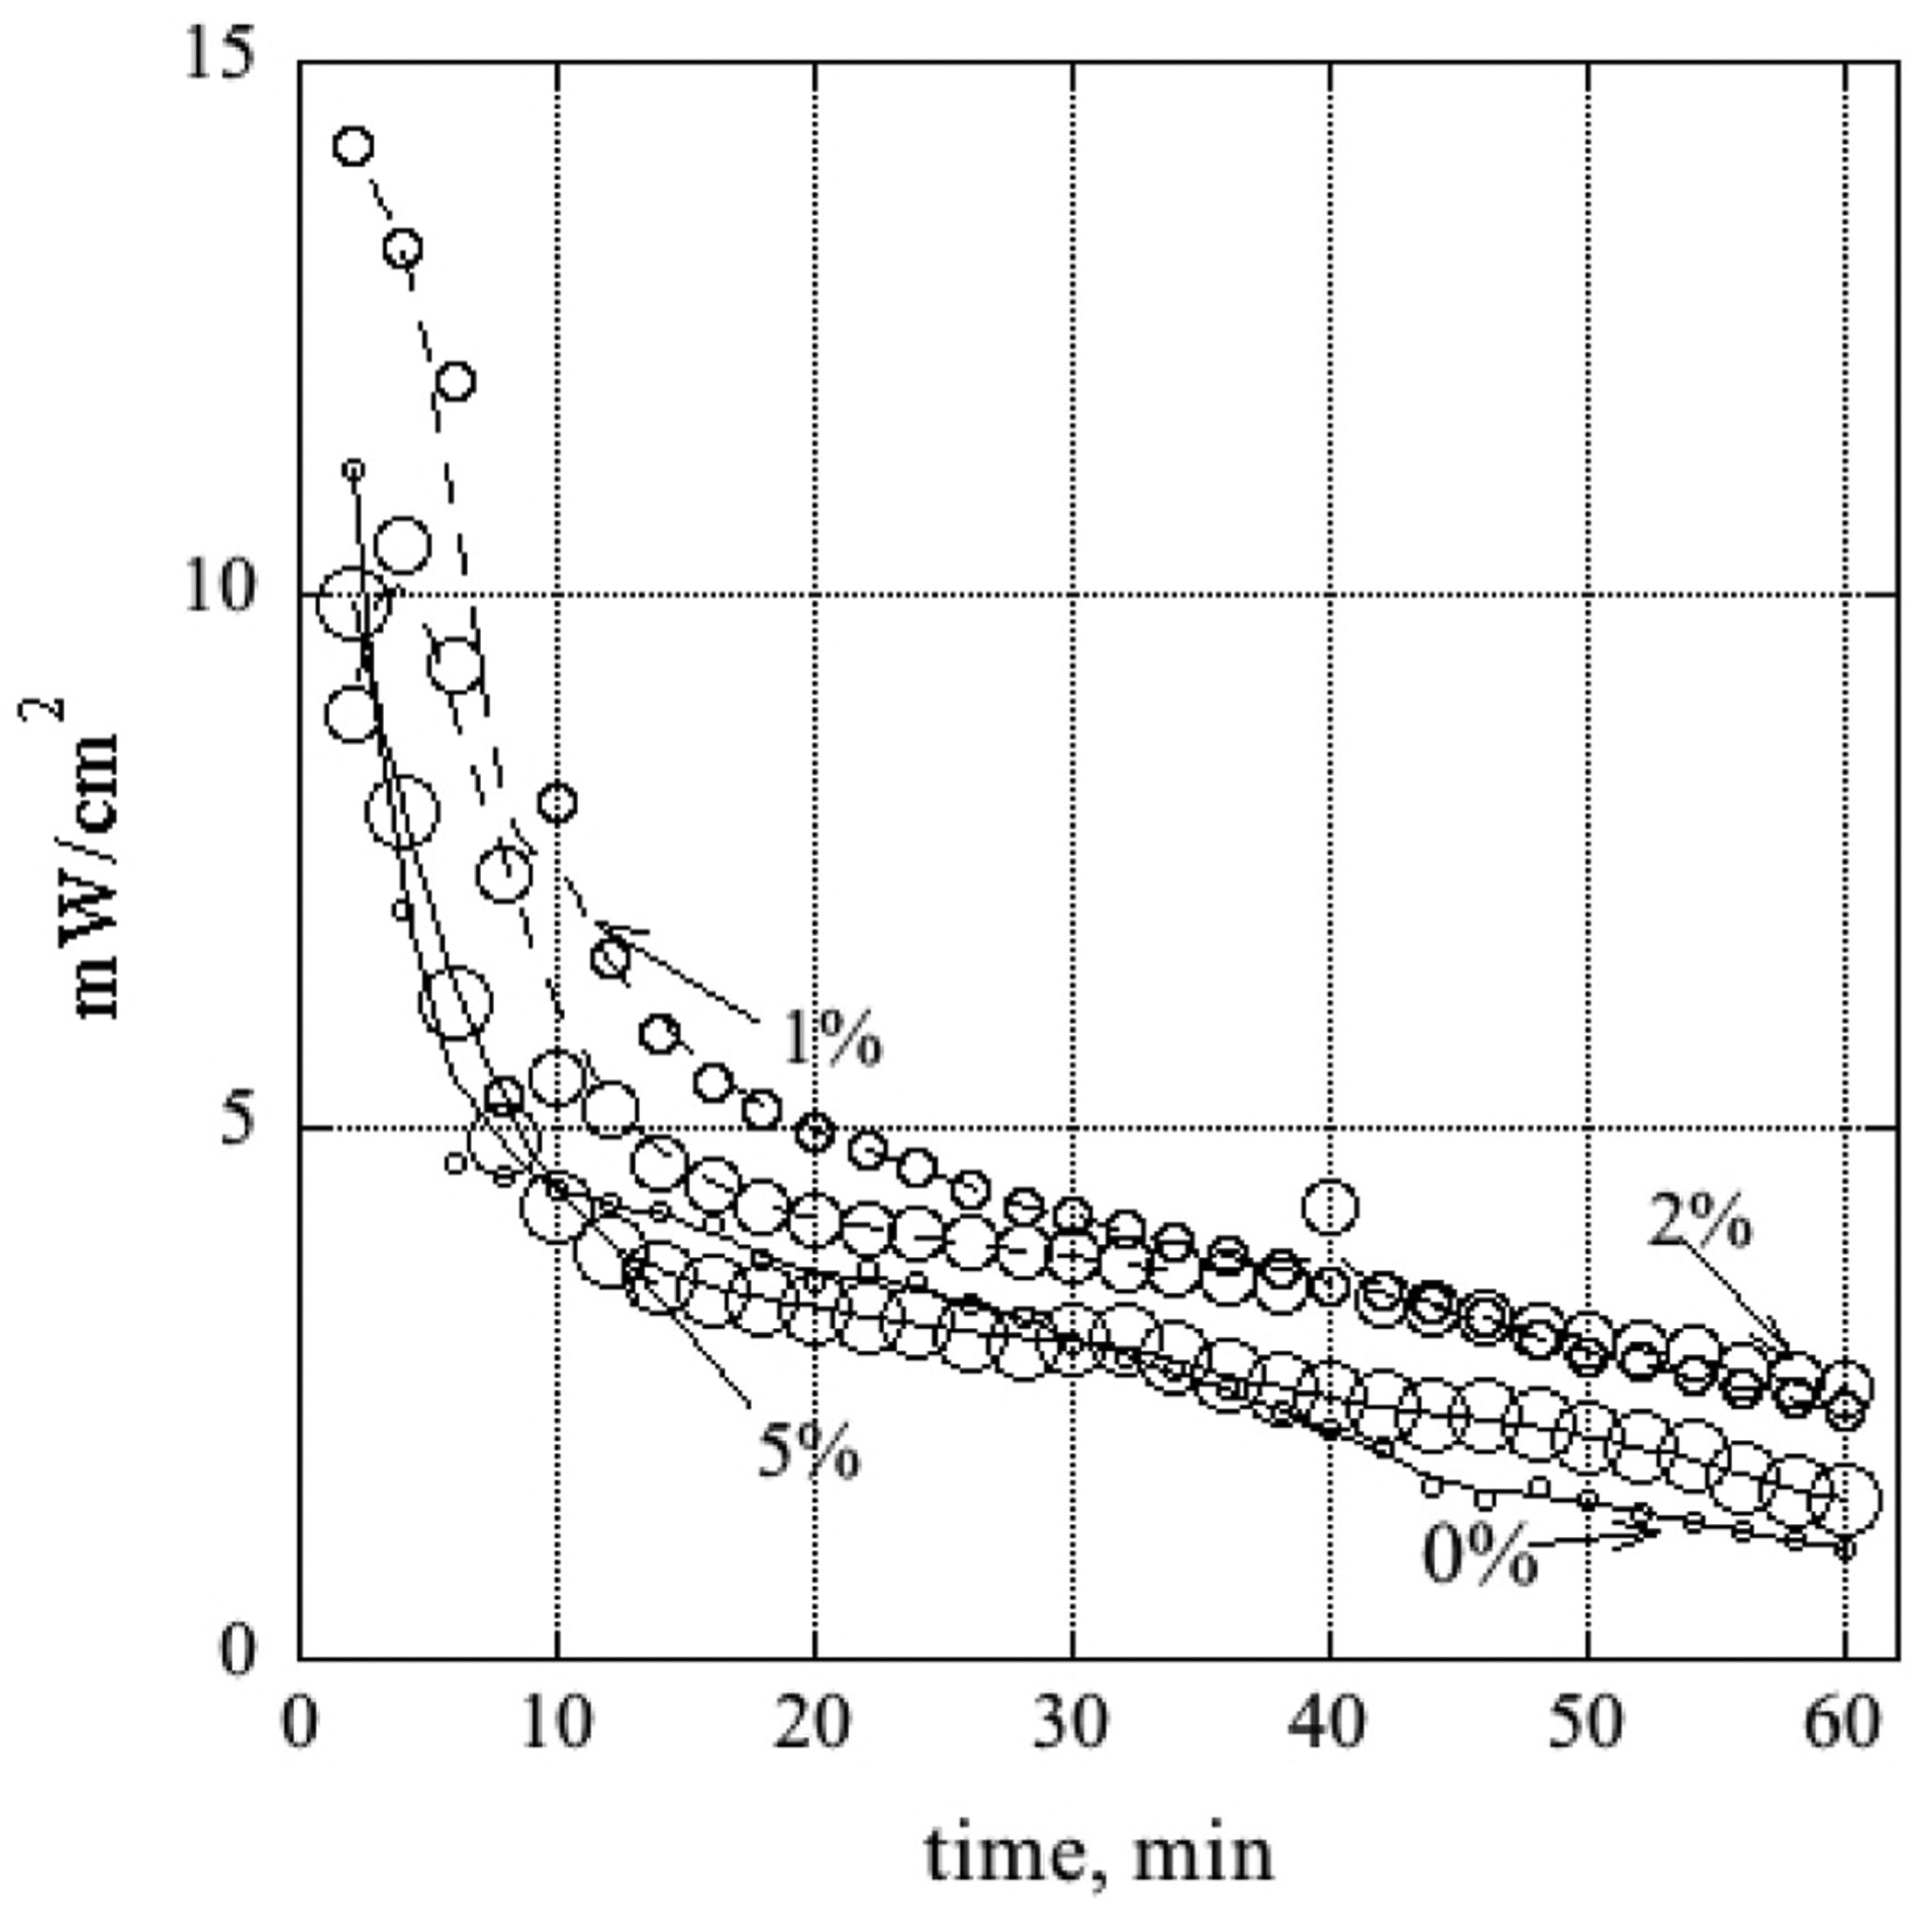
Power density versus time when load held constant for fuel feed composition 0.5 M glucose and 0.5 M KOH. The labels are the CA concentration in the DL coating solution. Symbol size increases as the % increases. The smoothing lines have been drawn to guide the eye.
We note that researchers studying enzymatic biofuel cells (EFCs) have also concerned themselves with liquid transport through the anodic (and cathodic) electrodes in order to overcome issues relating to low power density. An illustrative example by Kwon et al. [43] used a multi-walled carbon nanotube yarn, coated with the conducting polymer, poly (3,4-ethylenedioxythiophene), PEDOT, with both glucose oxidase and a redox mediator, to reach a maximum power density of ~2.3 mW/cm2, with 0.06 M glucose at 37 °C and pure O2 at the cathode. Notwithstanding, a review by Xiao et al. [44] pointed out that the majority of EFCs have maximum power densities between 0.001 and 1 mW/cm2 with less than a handful listed at levels ≥1 mW/cm2 (measured over a range glucose concentrations from 0.05 to 0.8 M and a variety of temperatures). Our ‘low performance’ fuel mixture (0.01 M glucose at 26 °C), with a 2% CA-coated DL, provided a peak power density of 0.02 mW/cm2, which is encouraging when considering the known improvements in catalyst composition and dispersion we have yet to implement.
4. Conclusion
This study presents data that support cellulose acetate and deacetylated cellulose as a DL coating for aqueous-fed DGFC fuel cells to improve power generation properties. While the polymer coatings were shown to possibly decrease carbon cloth sheet conductivity, increased fuel permeability and wetting ability yielded higher power density generation in a CA-treated DL within an MEA. This result has potential to benefit both DGFC and DMFC performance in polymer electrolyte membrane fixtures where a carbon cloth is used as the DL and the anolyte is provided as an aqueous solution. Further optimization of pretreatment approaches to suit individual device designs may be able to ameliorate the diminishment of the surface electrical conductivity.
HIGHLIGHTS.
Hydrophilization of anode diffusion layer (DL) using cellulose acetate coating.
Additional benefit from deacetylation to cellulose.
Physical characterization methods elucidated.
Application for an abiotic direct glucose fuel cell presented.
Coated-DL increases power density.
Acknowledgements
This work was supported in part by VA Rehabilitation Research & Development (RR&D) grant IK21RX003471(Weir): Power Hungry: Fuel Cells Harvesting Biofluids for Renewable Power of Wearable Medical Devices; as well as in part by Research Career Scientist Award, IK6RX002996 (Weir) and Career Development/Capacity Building Award IK2 RX003282 (Segil) from United States (U.S.) Department of Veterans Affairs Rehabilitation R&D (Rehab RD) Service administered through the Rocky Mountain Regional VA Medical Center of the Eastern Colorado Healthcare System. We thank Prof. Chulsung Bae and his students from RPI for supplying the FMN1 ionomer ink, as well as, Dr. Adrian Gestos for the Raman spectrums obtained at the MIMIC, CU Boulder (RRID:SCR_019307).
Footnotes
Declaration of competing interest
The authors declare that they have no known competing financial interests or personal relationships that could have appeared to influence the work reported in this paper.
CRediT authorship contribution statement
Jared Beshai: Investigation, Formal analysis, Writing – original draft. Thomas DiSorbo: Investigation, Formal analysis, Software, Writing – original draft. Jacob Hutfles: Methodology, Investigation, Writing – review & editing. Jacob Segil: Conceptualization, Writing – review & editing, Project administration. Richard F. ff Weir: Conceptualization, Writing – review & editing, Project administration, Funding acquisition. John Pellegrino: Conceptualization, Methodology, Resources, Writing – original draft, Visualization, Supervision, Project administration.
References
- [1].Wilberforce T, Alaswad A, Palumbo A, Dassisti M, Olabi AG, Bari P, Int. J. Hydrogen Energy 41 (2016) 16509–16522. [Google Scholar]
- [2].Spets JP, Kuosa M, Granstr√∂m T, Kiros Y, Rantanen J, Lampinen MJ, Saari K, Mater. Sci. Forum 638–642 (2010) 1164–1169. [Google Scholar]
- [3].Ibrahim R, (2021) 14245–14273.
- [4].Santiago ì., Navarro E, Raso MA, Leo TJ, Appl. Energy 179 (2016) 497–522. [Google Scholar]
- [5].Brouzgou A, Tsiakaras P, Top. Catal 58 (2015) 1311–1327. [Google Scholar]
- [6].Kerzenmacher S, Ducr√©e J, Zengerle R, von Stetten F, J. Power Sources 182 (2008) 1–17. [Google Scholar]
- [7].Basu D, Basu S, Int. J. Hydrogen Energy 36 (2011) 14923–14929. [Google Scholar]
- [8].An L, Zhao TS, Shen SY, Wu QX, Chen R, J. Power Sources 196 (2011) 186–190. [Google Scholar]
- [9].Brouzgou A, Song S, Tsiakaras P, Appl. Catal. B Environ 158–159 (2014) 209–216. [Google Scholar]
- [10].Yang Y-L, Liu X-H, Hao M-Q, Zhang P-P, Int. J. Hydrogen Energy 40 (2015) 10979–10984. [Google Scholar]
- [11].Rapoport BI, Kedzierski JT, Sarpeshkar R, PLoS One 7 (2012) 1–15. [DOI] [PMC free article] [PubMed] [Google Scholar]
- [12].Cosnier S, Le Goff A, Holzinger M, Electrochem. Commun 38 (2014) 19–23. [Google Scholar]
- [13].Drake RF, Kusserow BK, Messinger S, Matsuda S, Trans. Am. Soc. Artif. Inter. Organ 26 (1970) 199–205. [PubMed] [Google Scholar]
- [14].Lee D, Jeong SH, Yun S, Kim S, Sung J, Seo J, Son S, Kim JT, Susanti L, Jeong Y, Park S, Seo K, Kim SJ, Chung TD, Biosens. Bioelectron 171 (2021), 112746, 112746. [DOI] [PubMed] [Google Scholar]
- [15].Freckmann G, Hagenlocher S, Baumstark A, Jendrike N, Gillen RC, Rossner K, Haug C, J. Dibet. Sci. Technol 1 (2007) 695–703. [DOI] [PMC free article] [PubMed] [Google Scholar]
- [16].Davson H, Segal MB, Physiology of the CSF and Blood-Brain Barriers, 1996. [Google Scholar]
- [17].Shu QZ, Xia ZX, Wei W, Xu XL, Wang SL, Zhao H, Sun GQ, Xinxing Tan Cailiao/New Carbon Mater. 36 (2021) 409–419. [Google Scholar]
- [18].Park S, Lee J-W, Popov BN, Int. J. Hydrogen Energy 37 (2012) 5850–5865. [Google Scholar]
- [19].Falcao DS, Oliveira VB, Rangel CM, Pinto AMFR, Renew. Sustain. Energy Rev 34 (2014) 58–70. [Google Scholar]
- [20].Parry V, Appert E, Joud JC, Appl. Surf. Sci 256 (2010) 2474–2478. [Google Scholar]
- [21].Wasmus S, Kuver A, J. Electroanal. Chem 461 (1999) 14–31. [Google Scholar]
- [22].Janarthanan R, Pilli SK, Horan JL, Gamarra DA, Hibbs MR, Herring AM, J. Electrochem. Soc 161 (2014) F944–F950. [Google Scholar]
- [23].Omasta TJ, Peng X, Lewis CA, Varcoe JR, Mustain WE, Polymer Electrolyte Fuel Cells 16 (2016) 949–954. PEFC 16. [Google Scholar]
- [24].Kim H, Zhou JF, Unlu M, Anestis-Richard I, Joseph K, Kohl PA, Electrochim. Acta 56 (2011) 3085–3090. [Google Scholar]
- [25].Wang YT, Zheng L, Han GM, Lu LX, Wang M, Li JL, Wang XD, Int. J. Hydrogen Energy 39 (2014) 19132–19139. [Google Scholar]
- [26].Xie F, Chen C, Meng H, Shen PK, Fuel Cell. 7 (2007) 319–322. [Google Scholar]
- [27].Cha H, Kwon O, Kim J, Choi H, Yoo H, Kim H, Park T, ACS Omega 6 (2021) 34752–34762. [DOI] [PMC free article] [PubMed] [Google Scholar]
- [28].Song B-Y, He Y, He Y-L, Huang D, Zhang Y-W, Energy 176 (2019) 15–22. [Google Scholar]
- [29].Moon RJ, Martini A, Nairn J, Simonsen J, Youngblood J, Cellulose Nanomaterials Review: Structure, Properties and Nanocomposites, 2011. [DOI] [PubMed] [Google Scholar]
- [30].Klemm D, Philip B, Heinze T, Heinze U, Wagenknecht W, Comprehensive Cellulose Chemistry, vol. 2, Derivatization of cellulose, 1998. [Google Scholar]
- [31].Zhang K, Feldner A, Fischer S, Cellulose 18 (2011) 995–1003. [Google Scholar]
- [32].Chami Khazraji A, Robert S, J. Nanomater 2013 (2013), 409676, 10.1155/2013/409676. [DOI] [Google Scholar]
- [33].Elham NB, Khan SB, Alamry KA, Asiri AM, Akhtar K, Curr. Pharmaceut. Des (2016) 22. [DOI] [PubMed] [Google Scholar]
- [34].Ahmadi A, Khoshfetrat SM, Kabiri S, Fotouhi L, Dorraji PS, Omidfar K, IEEE Sensor. J 21 (2021) 9210–9217. [Google Scholar]
- [35].Woffindin C, Hoenich NA, Matthews JNS, Nephrol. Dial. Transplant 7 (1992) 340–345. [DOI] [PubMed] [Google Scholar]
- [36].van der Pauw LJ, Philips Res. Rep 20 (1958) 220–224. [Google Scholar]
- [37].van der Pauw LJ, Philips Res. Rep 13 (1958) 1–9. [Google Scholar]
- [38].Walgama R, Jeon JY, Maurya S, Kim YS, Bae C, Electrochem. Soc (2020) 2268, 2268. [Google Scholar]
- [39].Bico J, Thiele U, Quere D, Colloids Surf. A Physicochem. Eng. Asp 206 (2002) 41–46. [Google Scholar]
- [40].Bormashenko E, Adv. Colloid Interface Sci 222 (2015) 92–103. [DOI] [PubMed] [Google Scholar]
- [41].Movafaghi S, Wang W, Metzger A, Williams DD, Williams JD, Kota AK, Lab Chip 16 (2016) 3204–3209. [DOI] [PubMed] [Google Scholar]
- [42].Li X, Principles of Fuel Cells, Taylor and Francis Group, New York, 2006. [Google Scholar]
- [43].Kwon CH, Lee S-H, Choi Y-B, Lee JA, Kim SH, Kim H-H, Spinks GM, Wallace GG, Lima MD, Kozlov ME, Baughman RH, Kim SJ, Nat. Commun 5 (2014) 3928. [DOI] [PubMed] [Google Scholar]
- [44].Xiao X, Xia H.-q., Wu R, Bai L, Yan L, Magner E, Cosnier S, Lojou E, Zhu Z, Liu A, Chem. Rev 119 (2019) 9509–9558. [DOI] [PubMed] [Google Scholar]


