Abstract
Purpose
Proliferative diabetic retinopathy (PDR) is characterized by retinal new vessel formation, pointing to the importance of the antiangiogenic treatment in PDR. Hepatocyte nuclear factor 4A (HNF4A) has been highlighted to inhibit vascular endothelial growth factor (VEGF)-stimulated in vitro angiogenesis. Therefore, this study aims to elucidate the potential antiangiogenic mechanisms of HNF4A in PDR.
Methods
PDR-related high-throughput sequencing datasets (GSE94019, GSE102485, and GSE191210) were obtained from the Gene Expression Omnibus (GEO) database, followed by the screening of differentially expressed genes (DEGs). The protein-protein interaction (PPI) network of the candidate DEGs was constructed based on gene set enrichment analysis (GSEA) data and Search Tool for the Retrieval of Interacting Genes (STRING) data. In addition, the key genes and pathways related to angiogenesis were screened by functional enrichment analysis. Furthermore, human retinal microvascular cells were used for further in vitro validation.
Results
Four key genes (CACNA1A, CACNA1E, PDE1B, and CHRM3) related to PDR were identified in the grey module. CACNA1A affected angiogenesis in PDR by regulating vascular endothelial growth factor A (VEGFA) expression. Furthermore, HNF4A participated in angiogenesis in PDR by activating CACNA1A. In vitro experiments further identified that inhibition of HNF4A reduced CACNA1A expression and increased VEGFA expression, thus promoting angiogenesis in PDR.
Conclusions
In conclusion, the obtained findings suggest that antiangiogenic HNF4A activates the CACNA1A/VEGFA axis in PDR. Our work provides new insights into the angiogenic mechanism of PDR and offers potential targets for translational applications.
Keywords: high-throughput sequencing, proliferative diabetic retinopathy (PDR), HNF4A, CACNA1A, VEGFA, angiogenesis
Diabetic retinopathy (DR) is a major contributor to visual impairment among working-age individuals.1,2 It can progress to an advanced stage known as proliferative diabetic retinopathy (PDR).3 PDR carries a high hazard of severe visual impairment and is featured by the growth of aberrant new vessels.4 Angiogenesis has been recognized as a hallmark of retinopathy.5 Interestingly, vascular endothelial growth factor (VEGF) confers important roles in the angiogenic potential in PDR.6 The VEGF-induced angiogenic capacities have been suggested to be compensatory responses of diabetic retina to microvascular rarefaction leading to PDR.7 Thus, novel insights into the angiogenesis mechanism are required to develop potential strategies to prevent the development of PDR.
The traditional application of gene-expression analysis methods, including quantitative PCR, microarray, and bulk RNA sequencing, provides gene-expression levels averaged among a heterogeneous population and reported as a single data point.8 High-throughput sequencing confers multiple benefits as compared with DNA microarrays, because it holds higher accuracy and a larger dynamic range without influencing of cross-hybridization.9 Notably, high-throughput sequencing data-based analysis is becoming a main component in molecular biology and medical study.10 The Gene Expression Omnibus (GEO), a global public repository for high-throughput microarray and next-generation sequence functional genomic datasets, provides indexed, cross-linked, and searchable data.11 In the current study, the analysis of high-throughput sequencing data predicted calcium voltage-gated channel subunit alpha1 A (CACNA1A) as an important differentially expressed gene (DEG) in angiogenesis in PDR. CACNA1A is identified as a gene encoding the poreforming subunit of the voltage-dependent Ca v2.1 calcium channel, which is voltage-sensitive.12 Deletion of CACNA1A can result in a series of disorders, such as epilepsy, ataxia, and neurocognitive deficits like intellectual deficiency and autism.13 Hepatocyte nuclear factor 4 alpha (HNF4A) is a significant transcriptional mediator for early development and appropriate function of pancreatic ß-cells.14 HNF4A variants and polymorphisms are associated with type 2 diabetes in distinct populations with maturity-onset diabetes of the young, type 2 diabetes, gestational diabetes, and diabetes-associated risk factors.15 As previously reported, absence of Drosophila HNF4 presented key symptoms of Maturity Onset Diabetes of the Young 1 (MODY1) in the aspects of hyperglycemia and glucose intolerance, in addition to glucose-stimulated insulin secretion.16 Strikingly, HNF4A was previously found to blunt in vitro angiogenesis stimulated by vascular endothelial growth factor A (VEGFA).17 It is known that VEGFA plays a pivotal role in PDR.18 Intriguingly, VEGFA-dependent and -independent pathways are considered one of the pro-angiogenic processes over-represented in PDR.19
Taking the aforementioned findings into account, we thus used high-throughput sequencing data based on the GEO database in combination with in vitro assays in the current study in order to reveal the key molecular mechanisms of angiogenesis in PDR, which may involve HNF4A, CACNA1A, and VEGFA.
Methods
Sequencing Dataset Acquisition
DEGs were systematically screened from healthy controls and patients with PDR, and bioinformatics analysis was performed to explore the molecular mechanism of PDR. The PDR-related high-throughput sequencing datasets GSE94019,20 GSE102485,21 and GSE191210 (https://www.ncbi.nlm.nih.gov/geo/query/acc.cgi) were obtained through the GEO database. The GSE94019 dataset contains retinal tissue samples from 8 patients with PDR and 4 healthy controls, the GSE102485 dataset includes retinal tissue samples from 23 patients with PDR and 4 healthy controls and the GSE191210 dataset includes retinal tissue samples from 3 patients with PDR and 3 healthy controls.
Sequencing Data Quality Control and Reference Genome Alignment
The quality of paired-end reads of the original sequencing data was checked using the FastQC software version 0.11.8. The original data were preprocessed using the Cutadapt software 1.18: the Illumina sequencing linker and poly(A) tail sequence were removed. Perl script was utilized to remove reads with more than 5% N content. The FASTX-Toolkit software 0.0.13 was used to extract 70% of reads with a base mass above 20. The double-ended sequences were repaired using the BBMap software. Finally, the filtered high-quality reads fragments were compared with the human reference genome through the HISAT2 software (0.7.12).
Differential Analysis of Sequencing Data
Gene expression matrices of the GEO sequencing datasets were combined, and the “SVA” package in R software was used to remove the differences between the batches. DEGs between healthy controls and PDR samples were screened through the “limma” package in R software, with |logFC| > 1 and P value < 0.05 as the threshold.
Weighted Gene Co-Expression Network Analysis
The weighted gene co-expression network analysis (WGCNA) is a systematic biological method used to describe gene association patterns between different samples. It can be used to find highly synergistic gene modules and identify candidate biomarkers or therapeutic targets according to the connectivity of gene modules and the association between gene modules and phenotypes.22
The “WGCNA” package in R software was used for WGCNA analysis. First, hierarchical cluster analysis was carried out through the Hclust function. The appropriate soft threshold β was selected through the “pickSoftThreshold” function, followed by the transformation of adjacency matrices. The topological overlap matrix (TOM) was further calculated, and a hierarchical clustering dendrogram was constructed. Consistent gene expression was assigned to different modules, and 50 was selected as the minimum number of genes in the module. In order to merge the possible similar modules, 0.25 was defined as the threshold of cutting height. Finally, the expression profile of each module was summarized based on the module eigengenes (MEs), and the correlation between MEs and traits was calculated.
Functional Enrichment Analysis
The “ClusterProfiler” software package in R software was used for functional enrichment analysis of the screened target genes. The Fisher test was performed to determine the significantly enriched Gene Ontology (GO) and Kyoto Encyclopedia of Genes and Genomes (KEGG) pathways. Any P < 0.05 was considered to be statistically significant.
Screening Angiogenesis in PDR-Related Genes Using Gene Set Enrichment Analysis and Search Tool for the Retrieval of Interacting Genes Databases
A total of 51 angiogenesis-related genes were retrieved through the gene set enrichment analysis (GSEA) database. The angiogenesis-related genes and the PDR-related genes were co-imported into the Search Tool for the Retrieval of Interacting Genes (STRING) database. Protein-protein interaction (PPI) analysis was carried out, with the “species” limited to “human.” Furthermore, the Cytoscape software (version 3.6.0) was utilized to draw the network regulation relationship.
Construction of Target Gene-Transcription Factor Network
The promoter region sequences 2 kb upstream of the target genes were downloaded from the University of California – Santa Cruz (UCSC) database, and the “JASPAR2020” package in R software was used to obtain the transcription factors (TFs) that could bind to the promoter regions of the target genes. Differentially expressed TFs in PDR were selected, and a PDR-specific transcription regulation network was constructed using the Cytoscape software. Then, Spearman's correlation analysis was applied to analyze the correlation between TFs and corresponding target genes, with P < 0.05 indicating significant differences.
Cell Culture and Treatment
Primary human retinal microvascular endothelial cells (HRMECs; ACBRI 181, Cell Systems, Kirkland, WA, USA) were cultured with M131 medium supplemented with microvascular growth supplement (MVGS), 100 U/mL of penicillin and 100 µg/mL of streptomycin (Gibco, Grand Island, NY, USA) in an incubator with 5% CO2 at 37°C. Upon reaching 80% confluence, cells were washed twice with PBS (Hyclone Laboratories, Logan, UT, USA) at 37°C and subcultured with 0.25% trypsin (Hyclone). Cells were gently dispersed into cell suspension, centrifuged at 1000 rpm for 5 minutes, and adjusted to a certain concentration for passage. Cells were collected for subsequent experiments.
HRMECs were then transduced with lentivirus carrying short hairpin RNA (sh)-HNF4A + overexpression vector of negative control (oe-NC) + sh-NC, sh-HNF4A + oe-NC + sh-VEGFA, sh-HNF4A + oe-CACNA1A + sh-NC, sh-HNF4A + oe-CACNA1A + sh-VEGFA, sh-NC + oe-CACNA1A + sh-NC, and sh-NC + oe-CACNA1A + sh-VEGFA.
All lentiviral vectors carried luciferase. Before the formal experiment, according to the virus titer provided, the virus was diluted into different titer gradients with PBS, and then used to transduce the HRMECs plated in a 96-well plate. After 24 hours, the fluorescence intensity of GFP at different titers was observed under a fluorescence microscope. The most appropriate titer was selected for formal transduction. Cells (5 × 10⁴ cells/well) were seeded in a 24-well plate. Those in the logarithmic growth phase were added with virus solution and 10 ug/mL Polybrene (H8761; Solarbio Science & Technology Co., Ltd., Beijing, China) to promote transduction efficiency. After 16 to 24 hours, the medium was changed, and 72 hours later, 1 ug/mL puromycin (A1113803; Invitrogen Inc., Carlsbad, CA, USA) was added to the renewed medium for stable cell screening. When the cells could grow stably, the transduction efficiency was detected by RT-qPCR. All plasmids and lentivirus were purchased from Shanghai Genechem Co., Ltd. (Shanghai, China).
Quantitative Polymerase Chain Reaction
Total RNA was extracted from cells using TRIzol reagent (16096020; Thermo Fisher Scientific Inc., Waltham, MA, USA). For mRNA detection, PrimeScript RT reagent kit (TaKaRa, Japan) was used to synthesize cDNA. The qPCR was then conducted using the SYBR Premix Ex Taq Kit (TaKaRa) with a LightCycler480 System (Roche Diagnostics, Pleasanton, CA, USA). SYBR green fluorescence value was detected and used for relative quantification of target gene expression. β-actin was regarded as an internal reference and the fold changes were calculated by relative quantification (2−△△Ct method). The primer sequences (Shanghai Genomics Institute, Shanghai, China) are shown in Supplementary Table S1.
Western Blot
Total protein was extracted from cells using 200 µL 1 × SDS lysis buffer (P0013G; Beyotime Biotechnology Co., Shanghai, China) containing protease inhibitor. The concentration was determined using a BCA protein assay kit (BCA1-1KT; Sigma). Next, 30 µg protein was separated with 5% SDS-PAGE and transferred onto membranes. The membrane was blocked with 5% skimmed milk-TBST for 1 hour and probed overnight at 4°C with primary antibodies to HNF4A (ab92378; Abcam Inc., Cambridge, UK), CACNA1A (ab181371; Abcam), VEGFA (ab46154; Abcam), and β-actin (mAbcam 8226, 1: 5000; Abbkine, Redlands, CA, USA). After washing, the membrane was re-probed with the HRP-conjugated secondary antibody goat anti-rabbit (A0208; Beyotime) at 37°C for 45 minutes. Afterward, the membrane was visualized using an ECL reagent (ECL808-25; Biomiga), and the band intensities were analyzed using Gel-Pro Analyzer version 4.0 software (Media Cybernetics, Silver Springs, MD, USA). The ratio of the gray value of the target band to the internal reference β-actin was representative of the relative protein expression.
In Vitro Angiogenesis Assay
Matrigel was used for evaluating the angiogenesis capacity of HRMECs. The HRMECs were seeded in a 96-well glass slide precoated with Matrigel (BD Bioscience, San Jose, CA, USA) at a density of 1 × 10⁴ cells/well. After 4 days of transduction, the tube-forming ability of cells was examined and quantified for assessing the sprouting of new capillary tubes.7
Statistical Analysis
The measurement data were expressed as mean ± SD calculated by Graphpad Prism. Data between two groups were compared using an unpaired t-test. For multigroup data comparison, 1-way analysis of variance (ANOVA) with Tukey's post hoc test was applied. The results were considered statistically significant when P < 0.05.
Results
Five Thousand, Three Hundred Ninety-Nine Genes That Might be Involved in PDR Were Screened From High-Throughput Sequencing Datasets
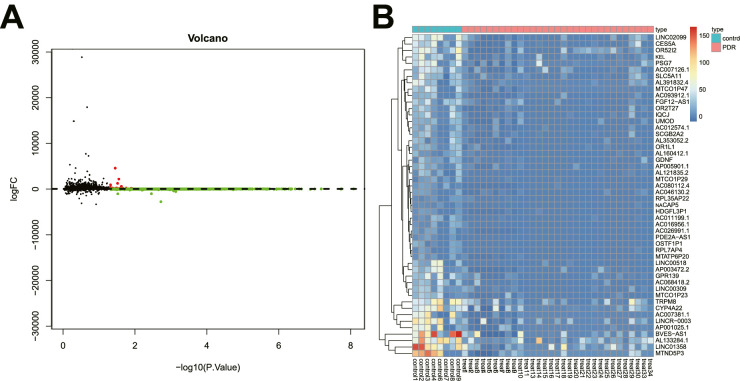
In order to eliminate the differences between samples from different platforms and different batches, we used the ComBat function in the sva package to remove the batch effect between GSE94019 and GSE102485 datasets. After data preprocessing, we identified 5399 DEGs in retinal tissue samples from patients with PDR, including 5326 downregulated genes (Supplementary Table S2) and 73 upregulated genes (Supplementary Table S3), (Figs. 1A, 1B), relative to retinal tissue samples from healthy controls.
Figure 1.
Five thousand, three hundred ninety-nine genes involved in PDR are screened from high-throughput sequencing datasets. (A) The volcano map of DEGs (the black dots represent genes with no differential expression, the red dots represent upregulated genes, and the green dots represent downregulated genes). (B) The heat map for DEGs (green indicates downregulation, and red indicates upregulation). There were 8 for the control samples and 1 for the PDR samples.
WGCNA Data Identified a Key Co-Expression Module That Might be Involved in the Pathogenesis of PDR
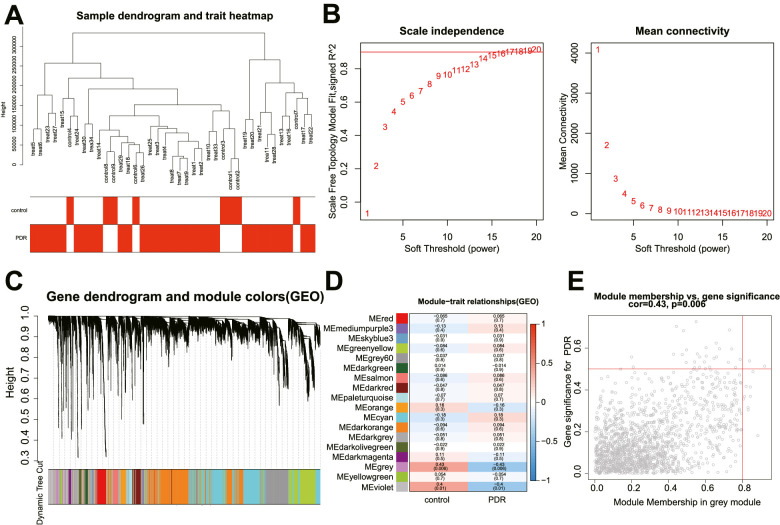
Next, we performed WGCNA analysis based on the combined high-throughput sequencing dataset. We reserved the top 25% of the genes with the largest variance for subsequent analysis, including 39 samples, followed by hierarchical clustering of the samples (Fig. 2A). β = 16 was used as a soft threshold to establish a scale-free network (Fig. 2B). Eighteen co-expression modules were identified in the PDR expression profile, and each color represents a different module (Fig. 2C). The correlation analysis of module features revealed that the grey module was most related to PDR, followed by the violet one (Figs. 2D, 2E).
Figure 2.
WGCNA screens a key co-expression module that may be involved in the pathogenesis of PDR. (A) The dendrogram of 39 samples. (B) The scale-free fitting index (left) and average connectivity (right) for various soft threshold power β. The red line represents the correlation coefficient. (C) The dendrogram of co-expressed genes. Each leaf on the dendrogram corresponds to a different gene module. Each color represents a module in the gene co-expression network constructed by WGCNA. (D) The correlation heat map between modules and traits in PDR, and each cell contains the corresponding correlation and P value. Each row corresponds to a module, and each column corresponds to a trait. (E) The scatter plot of gene significance and module membership in the grey module (a point represents a gene in the grey module).
Four Key Genes Involved in PDR Were Screened by Functional Enrichment Analysis
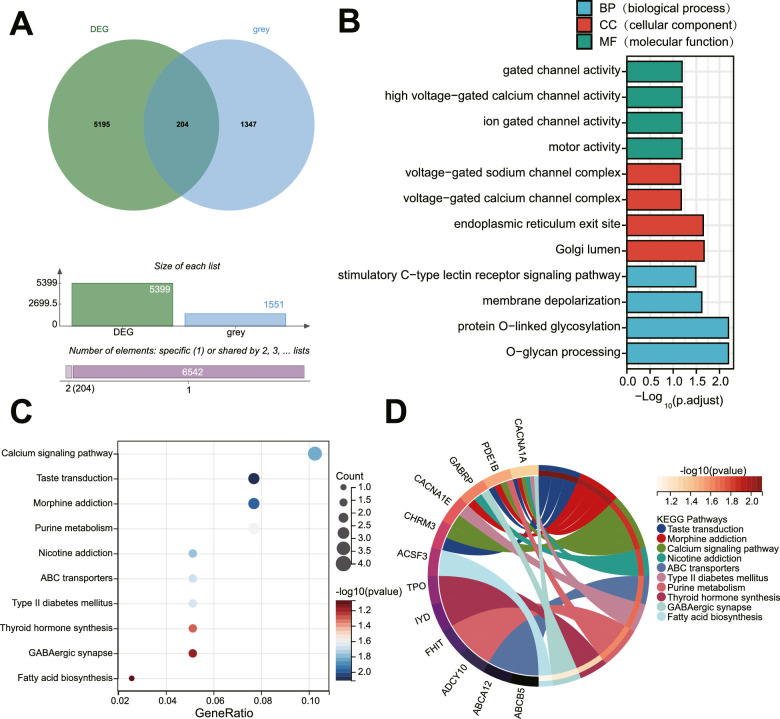
Next, the key genes involved in PDR were further screened. We intersected DEGs with the genes in the grey module to obtain 204 candidate genes (Fig. 3A, Supplementary Table S4). Next, GO and KEGG functional enrichment pathway analyses were performed on these 204 candidate genes.
Figure 3.
Four key genes involved in PDR are screened by functional enrichment analysis. (A) The Venn diagram showing the intersection of DEGs and genes in the grey module. (B) GO functional analysis of candidate DEGs at the level of biological process (BP), cellular component (CC), and molecular function (MF). (C) The bubble diagram of candidate DEGs analyzed by KEGG pathway enrichment analysis. (D) The circle diagram of candidate DEGs analyzed by KEGG pathway enrichment analysis.
The results of GO functional analysis displayed that the candidate genes were mainly enriched in the biological process (BP) of gated channel activity, high voltage-gated calcium channel activity, ion-gated channel activity, and motor activity. Moreover, the candidate genes were mainly enriched in the cellular component (CC) of voltage-gated sodium channel complex, voltage-gated calcium channel complex, endoplasmic reticulum exit site, and Golgi lumen. The candidate genes were mainly enriched in molecular function (MF) of stimulatory C-type lectin receptor signaling pathway, membrane depolarization, protein O-linked glycosylation, and O-glycan processing (Fig. 3B).
Based on KEGG pathway analysis, the candidate genes were mainly enriched in items including the calcium signaling pathway (Fig. 3C). Furthermore, as shown in Figure 3D, CACNA1A, CACNA1E, phosphodiesterase 1B (PDE1B), and cholinergic receptor muscarinic 3 (CHRM3) were mainly involved in the regulation of the calcium signaling pathway. Collectively, CACNA1A, CACNA1E, PDE1B, and CHRM3 may participate in the pathogenesis of PDR by regulating the calcium signaling pathway.
CACNA1A Might Participate in Angiogenesis in PDR by Regulating the Expression of VEGFA
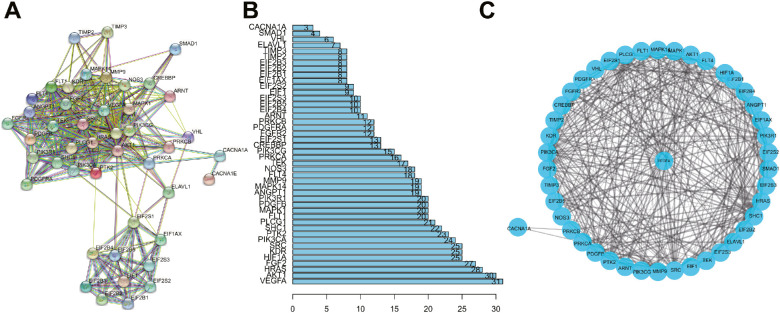
We screened 51 angiogenesis-related genes through the GSEA database (Supplementary Table S5). The four key genes identified by KEGG functional analysis and angiogenesis-related genes were imported into the STRING database. The PPI network was obtained by limiting the “species” to “human” (Fig. 4A). PPI results demonstrated that only CACNA1A among the four key genes recognized by KEGG could interact with angiogenesis-related genes (Fig. 4B).
Figure 4.
CACNA1A may participate in angiogenesis in PDR by regulating the expression of VEGFA. (A) The PPI network diagram of PDR angiogenesis-related genes was constructed using the STRING database. (B) The PPI network diagram of the number of associated genes of each gene. (C) The PPI network diagram of CACNA1A-regulated angiogenesis in PDR constructed by Cytoscape software.
Furthermore, CACNA1A and angiogenesis-related genes were introduced into the Cytoscape software to construct the PPI network of CACNA1A-regulated angiogenesis in PDR. As shown in Figure 4C, CACNA1A might participate in angiogenesis in PDR through protein kinase C beta (PRKCB) and protein kinase C alpha (PRKCA). The above results suggest that CACNA1A may regulate the expression of VEGFA to participate in angiogenesis in PDR directly or indirectly.
Eight TFs Might Participate in Angiogenesis in PDR by Regulating the CACNA1A/VEGFA Axis
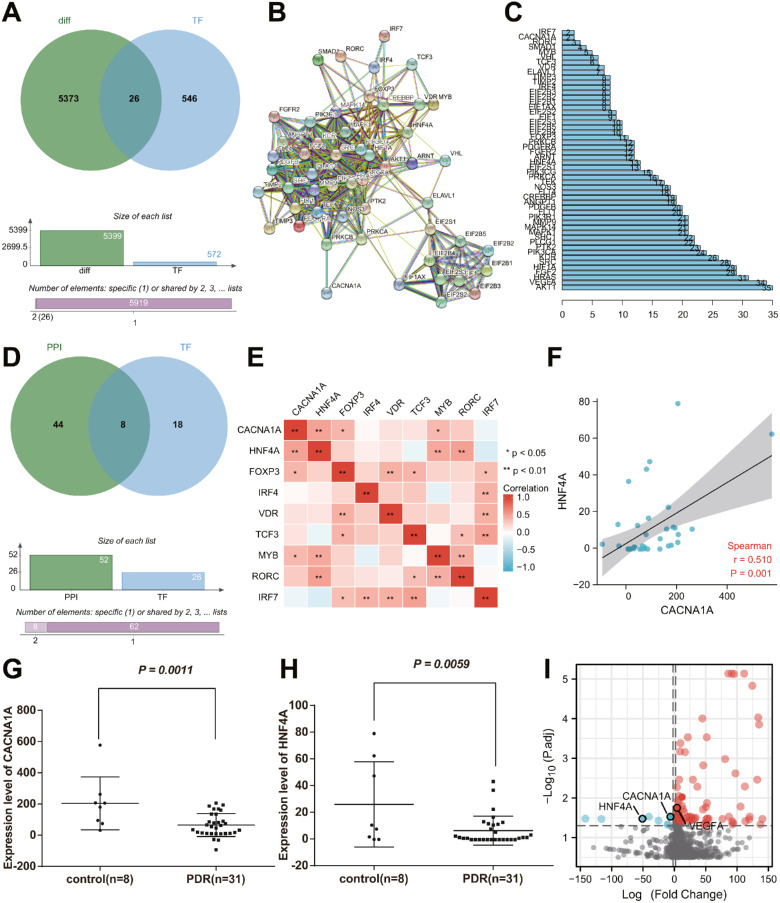
In order to construct the transcriptional regulatory network of angiogenesis in PDR, we extracted CACNA1A promoter sequences and obtained 572 TFs targeting candidate genes through the “JASPAR2020” package. Among the TFs, 26 TFs were differentially expressed in PDR, namely forkhead box P3 (FOXP3), forkhead box B1 (FOXB1), BARX homeobox 2 (BARX2), notochord homeobox (NOTO), homeobox B8 (HOXB8), LIM homeobox transcription factor 1 alpha (LMX1A), homeobox D13 (HOXD13), double homeobox 4 (DUX4), forkhead box I1 (FOXI1), HNF4A, RAR related orphan receptor C (RORC), interferon regulatory factor 7 (IRF7), divergent-paired related homeobox (DPRX), empty spiracles homeobox 1 (EMX1), interferon regulatory factor 4 (IRF4), mesenchyme homeobox 2 (MEOX2), motor neuron and pancreas homeobox 1 (MNX1), transcription factor 3 (TCF3), ladybird homeobox 1 (LBX1), vitamin D receptor (VDR), Rhox homeobox family member 1 (RHOXF1), E74 like ETS transcription factor 5 (ELF5), POU class 5 homeobox 1B (POU5F1B), v-Myb avian myeloblastosis viral oncogene homolog (MYB), ovo like transcriptional repressor 1 (OVOL1), and NK2 homeobox 8 (NKX2-8) (Fig. 5A).
Figure 5.
Eight TFs may participate in angiogenesis in PDR by regulating CACNA1A/VEGFA axis. (A) The Venn diagram showing the intersection of DEGs and TFs of candidate genes. (B) The PPI network of the involvement of TFs in the regulation of CACNA1A. (C) The number of interacting genes of all genes involved in the PPI network regulation. (D) The Venn diagram showing the intersection of regulatory genes in the PPI network and 26 TFs. (E) The correlation heat map of 8 TFs and CACNA1A in PDR samples. (F) Correlation analysis of HNF4A expression and CACNA1A expression in PDR samples. (G) Expression of CACNA1A in PDR and healthy control samples. (H) Expression of HNF4A in PDR and healthy control samples. (I) A volcano map of the expression of CACNA1A, HNF4A, and VEGFA in PDR samples and healthy control samples in the GSE191210 dataset. The red dots represent upregulated genes, and the blue dots represent downregulated genes. The abscissa represents the log2 (fold change), and the ordinate represents the -log10 (adjusted P value). The measurement data were expressed as mean ± SD. Data between the two groups were compared using an unpaired t-test. For multigroup data comparison, 1-way analysis of variance (ANOVA) with Tukey's post hoc test was applied. * P < 0.05, ** P < 0.01.
In addition, we imported 26 TFs and genes in the PPI network constructed by CACNA1A into the STRING database to obtain the PPI relationship by limiting the “species” to “human” (Fig. 5B). As shown in Figures 5C and 5D, we found the possible participation of 8 TFs (HNF4A, FOXP3, IRF4, VDR, TCF3, MYB, RORC, and IRF7) in angiogenesis in PDR by regulating CACNA1A/VEGFA axis.
Furthermore, we analyzed the correlation between the above 8 TFs and CACNA1A (cor > 0.4, P < 0.05). The results displayed that only HNF4A had a moderate positive correlation with its target gene CACNA1A in PDR samples (Fig. 5E). The moderate positive correlation was further confirmed through the correlation analysis of the expression of HNF4A and CACNA1A in PDR samples (Fig. 5F). Moreover, we found that the expression of CACNA1A and HNF4A in PDR samples was lower than that in healthy control samples (Figs. 5G, 5H). Meanwhile, analysis of the GSE191210 dataset suggested poor expression of CACNA1A and HNF4A and abundant VEGFA expression in PDR samples relative to healthy control samples (Fig. 5I).
HNF4A Might Inhibit Angiogenesis in PDR by Activating the CACNA1A/VEGFA Axis
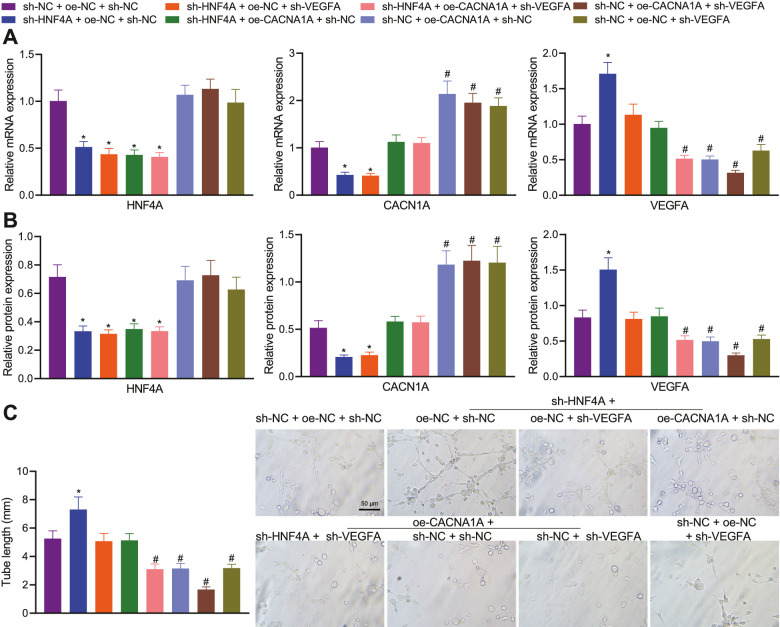
In the next experiment, we focused on the role of the HNF4A/CACNA1A/VEGFA axis in angiogenesis in PDR. The results of qPCR and Western blot suggested a decline in the expression of HNF4A and CACNA1A, yet an increase in that of VEGFA in HRMECs treated with sh-HNF4A + oe-NC + sh-NC. Opposite results were detected in response to treatment with sh-HNF4A + oe-CACNA1A + sh-NC. In addition, sh-HNF4A + oe-NC + sh-VEGFA led to lower VEGFA expression without affecting CACNA1A expression relative to sh-HNF4A + oe-NC + sh-NC. In the presence of sh-NC + oe-CACNA1A + sh-NC, HNF4A expression showed no changes, CACNA1A expression was elevated, and VEGFA expression was decreased. Additionally, treatment with sh-NC + oe-NC + sh-VEGFA led to downregulated VEGFA expression without altering HNF4A and CACNA1A expression (Figs. 6A, 6B). These results demonstrated that the knockdown of HNF4A can reduce the expression of CACNA1A, and positively regulate the expression of VEGFA via CACNA1A.
Figure 6.
HNF4A impairs angiogenesis in PDR by regulating the CACNA1A/VEGFA axis in vitro. (A) Expression of HNF4A, CACNA1A, and VEGFA in HRMECs treated with sh-HNF4A, sh-VEGFA, and oe-CACNA1A either separately or in combination determined by qPCR. (B) Expression of HNF4A, CACNA1A, and VEGFA in HRMECs treated with sh-HNF4A, sh-VEGFA, and oe-CACNA1A either separately or in combination determined by Western blot. (C) Tube-forming ability of HRMECs treated with sh-HNF4A, sh-VEGFA, and oe-CACNA1A either separately or in combination. */# P < 0.05, compared with HRMECs treated with sh-NC + oe-NC + sh-NC. The cell experiment was run in triplicate independently.
Furthermore, the tube-forming ability was found to be promoted by silencing of HNF4A, which was reversed by further CACNA1A overexpression or VEGFA silencing. In addition, CACNA1A overexpression or VEGFA silencing reduced the tube-forming ability, whereas a more pronounced reduction was noted upon dual treatment with CACNA1A overexpression and VEGFA silencing (Fig. 6C). Overall, inhibition of HNF4A may promote angiogenesis in PDR by diminishing CACNA1A expression and increasing VEGFA expression.
Discussion
PDR is an underlying blinding sequela of out-of-control diabetes, which involves a complicated interaction of pro-angiogenic and inflammatory responses.23 High-throughput sequencing has remarkably advanced the understanding and research of risk factors and molecular mechanisms underlying human diseases.24,25 Based on high-throughput sequencing data and in vitro experiments, this study found that HNF4A could inhibit angiogenesis in PDR through the CACNA1A/VEGFA axis.
In the current study, we utilized three high-throughput sequencing datasets (GSE94019, GSE102485, and GSE191210) to screen genes involved in PDR and obtain key co-expression modules implicated in the pathogenesis of PDR. Through PPI network analysis and further functional enrichment analysis, four key genes involved in PDR were identified, including CACNA1A, CACNA1E, PDE1B, and CHRM3, which were enriched in the calcium signaling pathway. Of note, our PPI results using the STRING database demonstrated CACNA1A as the only key gene interacting with angiogenesis-related genes. The STRING database is used for PPI network aiming to integrate all known and predicted associations between proteins, including both physical interactions and functional associations.26 In a single-cell transcriptome analysis of the Akimba mouse retina by Van et al., they studied DEG networks in neuronal, glial, and immune cell compartments using the STRING database.27 Retinal and choroidal neovascularization are a leading cause of visual impairment worldwide. A previous study has retrieved a PPI network from 42 proteins (organism searched: Homo sapiens), available at version 10.0 of STRING (with a minimum required interaction score of 0.400) and concluded that the combination of blockades and/or enhancements of different molecules, to manage the complex angiogenesis-related PPI is probably the future treatment of retinal and choroidal neovascularization.28 High-throughput techniques have witnessed rapid advancements, fueling the production of biological data on a large scale at affordable costs and inducing the exponential growth of the size of many biological databases, including National Center for Biotechnology Information (NCBI)-GEO.29 Recent studies have used either the GSE94019 or GSE102485 datasets to identify key genes related to the hallmark processes of DR. For instance, by analyzing DEGs in GEO datasets (GSE60436 and GSE94019), three hub genes (COL1A1, COL1A2, and SERPINH1) have been demonstrated to be potentially associated with DR pathophysiology.30 In a recent study, differential analysis of the GSE102485 dataset identifies CCN1 as an important regulator in the pathogenesis of DR.31 Analysis of the dataset GSE94019 downloaded from the GEO database together with conjoint analysis using WGCNA and Cytoscape software obtains 3 hub genes, EEF1A1, RPL11, and RPS27A, and reveals their relationship to the pathogenesis of PDR.32 In addition, following differential analysis of the GSE102485 dataset, 3 genes (FCGR3A, DPEP2, and ADGRF5) are upregulated in PDR samples and as potential biomarkers for PDR.33 Lack of CACNA1A has also been unfolded in different disorders. For instance, CACNA1A displayed downregulated expression during epileptogenesis.34 In addition, CACNA1A was unfolded as one of the crucial genes for insulin secretion in beta cells.35 Moreover, CACNA1A can mediate the calcium signaling pathway36 that participates in the development of diabetic retinal rod bipolar cells.37
One of the key findings obtained in the study was the implication of the CACNA1A/VEGFA axis in angiogenesis in PDR. Mechanistically, we further demonstrated the regulatory role of CACNA1A in angiogenesis in PDR by downregulating the expression of VEGFA. Prior evidence has highlighted the promoting role of VEGFA in angiogenesis and DR. It was found that repression of VEGFA by microRNA-200b contributed to the alleviation of the development of DR.38 VEGFA is involved in abnormal angiogenesis, and the knockdown of VEGFA can diminish intravitreal neovascularization in rats with retinopathy of prematurity.39 Besides, VEGFA augmented the expression of angiogenesis TFs and growth factors, thereby facilitating retinal neovascularization in a PDR model.21 The microRNA-203a-3p-mediated downregulation of VEGFA has been reported to suppress retinal angiogenesis and ameliorate PDR in oxygen-induced retinopathy rats.40 However, there is a lack of reports regarding the effect of CACNA1A on VEGFA. The results in the current study suggested that CACNA1A may regulate VEGFA through PRKCB and PRKCA. Notably, multiple studies have unveiled the regulatory relationship between PRKCB/PRKCA and VEGFA. For instance, PRKCA can mediate VEGFA expression to affect the angiogenic activity of endothelial cells,41 and PRKCB regulates the expression of VEGFA in JEG-3 cells.42 Therefore, it can be concluded that the inhibitory role of CACNA1A in angiogenesis in PDR may be achieved by regulating VEGFA/PRKCB/PRKCA.
Importantly, our results demonstrated that HNF4A might inhibit angiogenesis in PDR by activating the CACNA1A/VEGFA axis. The downregulated HNF4A by exosomal microRNA-103a can produce a pro-angiogenic effect in a mouse model of rheumatoid arthritis.43 Moreover, a previous study observed retinal disorders in mice with null HNF4A.44 To our knowledge, the interaction between HNF4A and CACNA1A has rarely been reported. Of note, the regulation of HNF4A on VEGFA has been documented. For instance, HNF4A was found to blunt VEGFA-stimulated in vitro angiogenesis, with the involvement of the direct transcriptional regulation of FLK1 in diabetic endothelial cells.17 These reports can partially support our finding regarding the mechanism of HNF4A in angiogenesis in PDR.
Taken together, the present study demonstrates that HNF4A activates the CACNA1A/VEGFA axis, which upregulates CACNA1A and inhibits VEGFA expression, thereby preventing angiogenesis in PDR (Fig. 7). This study provides a new theoretical basis for revealing the mechanism of angiogenesis in PDR. Nevertheless, the use of different datasets is a limitation of the study and these datasets were selected based on the literature.
Figure 7.
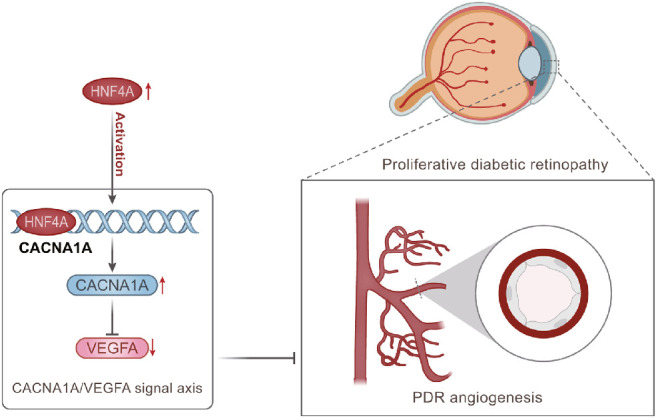
The molecular mechanism graph of HNF4A in inhibiting angiogenesis in PDR through the CACNA1A/VEGFA axis. HNF4A upregulates CACNA1A and inhibits VEGFA expression, ultimately curtailing angiogenesis in PDR.
Supplementary Material
Acknowledgments
Author Contributions: Y.Y. and S.W. designed the study. S.W., L.Z.N., and S.W.H. collated the data, carried out data analyses, and produced the initial draft of the manuscript. Y.Y. and S.W.H. contributed to drafting the manuscript. All authors have read and approved the final submitted manuscript.
Data Availability Statement: The data that supports the findings of this study are available on request from the corresponding author upon reasonable request.
Disclosure: Y. Yin, None; S. Wu, None; L. Niu, None; S. Huang, None
References
- 1. Hendrick AM, Gibson MV, Kulshreshtha A.. Diabetic retinopathy. Prim Care. 2015; 42: 451–464. [DOI] [PubMed] [Google Scholar]
- 2. Jiang Q, Liu C, Li CP, et al.. Circular RNA-ZNF532 regulates diabetes-induced retinal pericyte degeneration and vascular dysfunction. J Clin Invest. 2020; 130: 3833–3847. [DOI] [PMC free article] [PubMed] [Google Scholar]
- 3. Nawaz IM, Rezzola S, Cancarini A, et al.. Human vitreous in proliferative diabetic retinopathy: characterization and translational implications. Prog Retin Eye Res. 2019; 72: 100756. [DOI] [PubMed] [Google Scholar]
- 4. Welikala RA, Fraz MM, Dehmeshki J, et al.. Genetic algorithm based feature selection combined with dual classification for the automated detection of proliferative diabetic retinopathy. Comput Med Imaging Graph. 2015; 43: 64–77. [DOI] [PubMed] [Google Scholar]
- 5. Oubaha M, Miloudi K, Dejda A, et al.. Senescence-associated secretory phenotype contributes to pathological angiogenesis in retinopathy. Sci Transl Med. 2016; 8: 362ra144. [DOI] [PubMed] [Google Scholar]
- 6. Huang X, Zhou G, Wu W, et al.. Genome editing abrogates angiogenesis in vivo. Nat Commun. 2017; 8: 112. [DOI] [PMC free article] [PubMed] [Google Scholar]
- 7. Yang Y, Liu Y, Li Y, et al.. MicroRNA-15b targets VEGF and inhibits angiogenesis in proliferative diabetic retinopathy. J Clin Endocrinol Metab. 2020; 105: 3404–3415. [DOI] [PMC free article] [PubMed] [Google Scholar]
- 8. Heid CA, Stevens J, Livak KJ, et al.. Real time quantitative PCR. Genome Res. 1996; 6: 986–994. [DOI] [PubMed] [Google Scholar]
- 9. Wang Z, Gerstein M, Snyder M.. RNA-Seq: a revolutionary tool for transcriptomics. Nat Rev Genet. 2009; 10: 57–63. [DOI] [PMC free article] [PubMed] [Google Scholar]
- 10. Minoche AE, Dohm JC, Himmelbauer H.. Evaluation of genomic high-throughput sequencing data generated on Illumina HiSeq and genome analyzer systems. Genome Biol. 2011; 12: R112. [DOI] [PMC free article] [PubMed] [Google Scholar]
- 11. Barrett T, Wilhite SE, Ledoux P, et al.. NCBI GEO: archive for functional genomics data sets–update. Nucleic Acids Res. 2013; 41: D991–995. [DOI] [PMC free article] [PubMed] [Google Scholar]
- 12. Saito H, Okada M, Miki T, et al.. Knockdown of Cav2.1 calcium channels is sufficient to induce neurological disorders observed in natural occurring Cacna1a mutants in mice. Biochem Biophys Res Commun. 2009; 390: 1029–1033. [DOI] [PubMed] [Google Scholar]
- 13. Lupien-Meilleur A, Jiang X, Lachance M, et al.. Reversing frontal disinhibition rescues behavioural deficits in models of CACNA1A-associated neurodevelopment disorders. Mol Psychiatry. 2021; 26: 7225–7246. [DOI] [PubMed] [Google Scholar]
- 14. Han EH, Rha GB, Chi YI.. MED25 is a mediator component of HNF4α-driven transcription leading to insulin secretion in pancreatic beta-cells. PLoS One. 2012; 7: e44007. [DOI] [PMC free article] [PubMed] [Google Scholar]
- 15. Love-Gregory L, Permutt MA.. HNF4A genetic variants: role in diabetes. Curr Opin Clin Nutr Metab Care. 2007; 10: 397–402. [DOI] [PubMed] [Google Scholar]
- 16. Barry WE, Thummel CS.. The Drosophila HNF4 nuclear receptor promotes glucose-stimulated insulin secretion and mitochondrial function in adults. Elife. 2016; 5: e11183. [DOI] [PMC free article] [PubMed] [Google Scholar]
- 17. Chai X, Yan J, Gao Y, et al.. Endothelial HNF4alpha potentiates angiogenic dysfunction via enhancement of vascular endothelial growth factor resistance in T2DM. J Cell Biochem. 2019; 120: 12989–13000. [DOI] [PubMed] [Google Scholar]
- 18. Itoh K, Furuhashi M, Ida Y, et al.. Detection of significantly high vitreous concentrations of fatty acid-binding protein 4 in patients with proliferative diabetic retinopathy. Sci Rep. 2021; 11: 12382. [DOI] [PMC free article] [PubMed] [Google Scholar]
- 19. Korhonen A, Gucciardo E, Lehti K, et al.. Proliferative diabetic retinopathy transcriptomes reveal angiogenesis, anti-angiogenic therapy escape mechanisms, fibrosis and lymphatic involvement. Sci Rep. 2021; 11: 18810. [DOI] [PMC free article] [PubMed] [Google Scholar]
- 20. Lam JD, Oh DJ, Wong LL, et al.. Identification of RUNX1 as a mediator of aberrant retinal angiogenesis. Diabetes. 2017; 66: 1950–1956. [DOI] [PMC free article] [PubMed] [Google Scholar]
- 21. Li Y, Chen D, Sun L, et al.. Induced expression of VEGFC, ANGPT, and EFNB2 and their receptors characterizes neovascularization in proliferative diabetic retinopathy. Invest Ophthalmol Vis Sci. 2019; 60: 4084–4096. [DOI] [PubMed] [Google Scholar]
- 22. Langfelder P, Horvath S.. WGCNA: an R package for weighted correlation network analysis. BMC Bioinformatics. 2008; 9: 559. [DOI] [PMC free article] [PubMed] [Google Scholar]
- 23. Lin AL, Roman RJ, Regan KA, et al.. Eicosanoid profiles in the vitreous humor of patients with proliferative diabetic retinopathy. Int J Mol Sci. 2020; 21: 7451. [DOI] [PMC free article] [PubMed] [Google Scholar]
- 24. Rego SM, Snyder MP.. High throughput sequencing and assessing disease risk. Cold Spring Harb Perspect Med. 2019; 9: a026849. [DOI] [PMC free article] [PubMed] [Google Scholar]
- 25. Churko JM, Mantalas GL, Snyder MP, et al.. Overview of high throughput sequencing technologies to elucidate molecular pathways in cardiovascular diseases. Circ Res. 2013; 112: 1613–1623. [DOI] [PMC free article] [PubMed] [Google Scholar]
- 26. Snel B, Lehmann G, Bork P, et al.. STRING: a web-server to retrieve and display the repeatedly occurring neighbourhood of a gene. Nucleic Acids Res. 2000; 28: 3442–3444. [DOI] [PMC free article] [PubMed] [Google Scholar]
- 27. Van Hove I, De Groef L, Boeckx B, et al.. Single-cell transcriptome analysis of the Akimba mouse retina reveals cell-type-specific insights into the pathobiology of diabetic retinopathy. Diabetologia. 2020; 63: 2235–2248. [DOI] [PubMed] [Google Scholar]
- 28. Cabral T, Mello LGM, Lima LH, et al.. Retinal and choroidal angiogenesis: a review of new targets. Int J Retina Vitreous. 2017; 3: 31. [DOI] [PMC free article] [PubMed] [Google Scholar]
- 29. Raza K. Fuzzy logic based approaches for gene regulatory network inference. Artif Intell Med. 2019; 97: 189–203. [DOI] [PubMed] [Google Scholar]
- 30. Hu L, Liu Y, Wei C, et al.. SERPINH1, targeted by miR-29b, modulated proliferation and migration of human retinal endothelial cells under high glucose conditions. Diabetes Metab Syndr Obes. 2021; 14: 3471–3483. [DOI] [PMC free article] [PubMed] [Google Scholar]
- 31. Li H, Li T, Wang H, et al.. Diabetes promotes retinal vascular endothelial cell injury by inducing CCN1 expression. Front Cardiovasc Med. 2021; 8: 689318. [DOI] [PMC free article] [PubMed] [Google Scholar]
- 32. Huang J, Zhou Q.. Identification of the relationship between hub genes and immune cell infiltration in vascular endothelial cells of proliferative diabetic retinopathy using bioinformatics methods. Dis Markers. 2022; 2022: 7231046. [DOI] [PMC free article] [PubMed] [Google Scholar]
- 33. Wu H, Wang D, Zheng Q, et al.. Integrating SWATH-MS proteomics and transcriptome analysis to preliminarily identify three DEGs as biomarkers for proliferative diabetic retinopathy. Proteomics Clin Appl. 2022; 16: e2100016. [DOI] [PubMed] [Google Scholar]
- 34. Kumar P, Sharma D.. Ameliorative effect of curcumin on altered expression of CACNA1A and GABRD in the pathogenesis of FeCl(3)-induced epilepsy. Mol Biol Rep. 2020; 47: 5699–5710. [DOI] [PubMed] [Google Scholar]
- 35. Schreiber V, Mercier R, Jimenez S, et al.. Extensive NEUROG3 occupancy in the human pancreatic endocrine gene regulatory network. Mol Metab. 2021; 53: 101313. [DOI] [PMC free article] [PubMed] [Google Scholar]
- 36. Qu SY, Li XY, Heng X, et al.. Analysis of antidepressant activity of Huang-Lian Jie-Du decoction through network pharmacology and metabolomics. Front Pharmacol. 2021; 12: 619288. [DOI] [PMC free article] [PubMed] [Google Scholar]
- 37. Moore-Dotson JM, Eggers ED.. Reductions in calcium signaling limit inhibition to diabetic retinal rod bipolar cells. Invest Ophthalmol Vis Sci. 2019; 60: 4063–4073. [DOI] [PMC free article] [PubMed] [Google Scholar]
- 38. Li EH, Huang QZ, Li GC, et al.. Effects of miRNA-200b on the development of diabetic retinopathy by targeting VEGFA gene. Biosci Rep. 2017; 37: BSR20160572. [DOI] [PMC free article] [PubMed] [Google Scholar]
- 39. Wang H, Smith GW, Yang Z, et al.. Short hairpin RNA-mediated knockdown of VEGFA in Muller cells reduces intravitreal neovascularization in a rat model of retinopathy of prematurity. Am J Pathol. 2013; 183: 964–974. [DOI] [PMC free article] [PubMed] [Google Scholar]
- 40. Han N, Xu H, Yu N, et al.. MiR-203a-3p inhibits retinal angiogenesis and alleviates proliferative diabetic retinopathy in oxygen-induced retinopathy (OIR) rat model via targeting VEGFA and HIF-1alpha. Clin Exp Pharmacol Physiol. 2020; 47: 85–94. [DOI] [PubMed] [Google Scholar]
- 41. Xu H, Czerwinski P, Hortmann M, et al.. Protein kinase C alpha promotes angiogenic activity of human endothelial cells via induction of vascular endothelial growth factor. Cardiovasc Res. 2008; 78: 349–355. [DOI] [PubMed] [Google Scholar]
- 42. Zhao H, Gong L, Wu S, et al.. The inhibition of protein kinase C beta contributes to the pathogenesis of preeclampsia by activating autophagy. EBioMedicine. 2020; 56: 102813. [DOI] [PMC free article] [PubMed] [Google Scholar]
- 43. Chen M, Li MH, Zhang N, et al.. Pro-angiogenic effect of exosomal microRNA-103a in mice with rheumatoid arthritis via the downregulation of hepatocyte nuclear factor 4 alpha and activation of the JAK/STAT3 signaling pathway. J Biol Regul Homeost Agents. 2021; 35: 629–640. [DOI] [PubMed] [Google Scholar]
- 44. Li S, Xu F, Liu L, et al.. A systems genetics approach to revealing the Pdgfb molecular network of the retina. Mol Vis. 2020; 26: 459–471. [PMC free article] [PubMed] [Google Scholar]
Associated Data
This section collects any data citations, data availability statements, or supplementary materials included in this article.


