Abstract
Background
Among the brain and the other central nervous system, gliomas are the most prevalent malignant primary tumors. Adenylate kinase 2 (AK2) is generally thought to be crucial for energy metabolism and signal transduction. Several disorders are correlated with its aberrant expression. However, it is unclear what functions AK2 might have in gliomas.
Methods
We investigated the relationship between AK2 expression and clinicopathological features of glioma patients using information obtained from public databases and patient tissue microarrays. AK2 knockdown glioma cell lines were constructed to explore how AK2 affects glioma progress. The association between AK2 and the immune microenvironment in gliomas was evaluated by multiple methods.
Results
AK2 expression was higher in glioma samples than in normal brain tissues. Older patients and those with higher‐grade, IDH‐wildtype, 1p/19q codeletion‐free, and MGMT‐unmethylated tumors had higher levels of AK2 expression, linking to poor outcomes. Thus, gliomas with high AK2 expression have a worse prognosis. GO and KEGG analyses demonstrated that AK2 was relevant to cell division and DNA replication. Downregulation of AK2 suppresses cell proliferation, migration, and colony formation of glioma cell lines in vitro. AK2 expression was positively connected to the inhibitory immune checkpoints, also correlating with immune infiltration degree.
Conclusions
In this study, AK2 may be a potential biological target for more precise molecular therapy of gliomas, since its high expression is associated with worse outcomes and a more malignant immune microenvironment.
Keywords: AK2, biomarker, glioma, immune checkpoint, tumor microenvironment
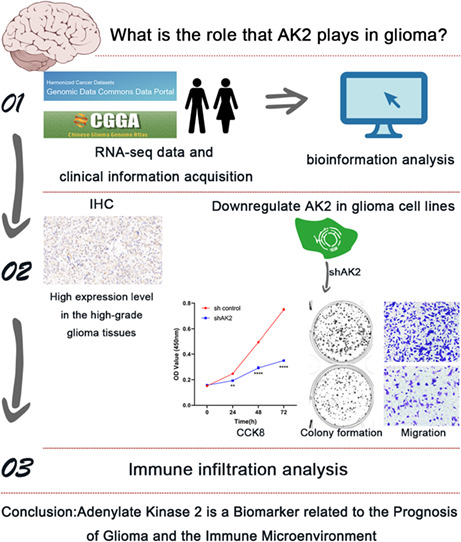
Based on bioinformatical data analysis and validation in experimental studies in vitro, we found Adenylate Kinase 2 is a biomarker related to the prognosis of glioma and the immune microenvironment.
1. INTRODUCTION
Gliomas, including lower‐grade glioma (LGG) and glioblastoma (GBM), account for the vast majority of primary malignant tumors affecting the brain and other parts of the central nervous system (CNS). 1 They have received significant attention because of their dismal prognosis and poor treatment outcomes. In 2021, the WHO released the fifth edition of the WHO Classification of Tumors of the Central Nervous System (WHO CNS5), in which the glioma grading system includes four grades, WHO 1 to 4. 2 Despite the availability of several effective treatments for the disease, including maximum excision of tumor tissue, supplemented with radiotherapy and chemotherapy, the 5‐year survival rates of GBM patients remain low, at 3% for adults older than 65 years and 27% for adults aged 20–39 years. 3 Patients with lower‐grade gliomas (LGG) have a better chance of surviving when the tumor is surgically removed and treated with chemo/radiotherapy, but most LGG patients eventually develop extremely aggressive gliomas. 4 Consequently, it is essential to investigate more potent therapy options.
The adenylate kinase (AK) family is widely thought to be involved in signaling and energy metabolism. 5 AKs, which include nine different isoenzymes in human tissues, named AK1–9, catalyze the ATP + AMP ↔ 2ADP nucleotide phosphoryl exchange process. 6 As a member of the AK family, adenylate kinase 2 (AK2) is usually substantially expressed in the kidneys, liver, and intestines, with weak expression in the brain and pancreas. 7 It is widely distributed in the intermembrane space of mitochondria. Previous research revealed that AK2 depletion caused developmental death in the larval stage of Drosophila melanogaster. 8 Similarly, complete AK2 deletion was embryonically fatal in mice. 9 These findings implied that AK2 was essential for development and growth. According to numerous studies, the aberrant expression of AK2 has also been linked to human diseases. For instance, human AK2 deficiency results in reticular dysgenesis accompanied by sensorineural deafness. 10 , 11 It was also reported that AK2 mediated a distinct intrinsic apoptotic process that may aid in the development of cancer by interacting with FADD and caspase‐10. 12 In addition, in lung adenocarcinoma, AK2 was overexpressed, and high AK2 expression was linked to tumor development and indicated poor prognoses in patients with pulmonary adenocarcinoma. 13 , 14 It was also reported that AK2 plays a role in hepatocellular carcinoma (HCC), breast cancer, and cervical cancer. 15 , 16 , 17 Although AK2 is related to several malignancies, little is known about the precise underlying mechanisms and its potential cancer‐driving roles, particularly in glioma. Thus, it requires more investigation to determine the predictive value and potential roles of AK2 in glioma.
In this work, we utilized information from numerous public online databases to assess the prognostic value of AK2 in glioma. Furthermore, we explored the potential mechanisms through which AK2 plays role in the cancer biology of glioma by GO and KEGG analyses. Then we confirmed the effect of AK2 knockdown in glioma cells in vitro. Finally, we also discussed the correlation of AK2 expression with tumor immune cell infiltration. Our results revealed that AK2 may be a predictive biomarker for gliomas.
2. MATERIALS AND METHODS
2.1. Data acquisition
AK2 expression data were obtained from the Gene Expression Profiling Interactive Analysis (GEPIA2, http://gepia2.cancer‐pku.cn/#index), 18 Clinical Proteomic Tumor Analysis Consortium (CPTAC, https://pdc.cancer.gov) databases. RNA‐seq data with matching clinical information for 1018 glioma samples (2 datasets were included, with 325 samples and 693 samples respectively, called CGGA325 and CGGA693) were obtained from the Chinese Glioma Genome Atlas (CGGA, http://www.cgga.org.cn/) 19 and 681 samples from The Cancer Genome Atlas (TCGA, https://portal.gdc.cancer.gov/). Finally, 966 samples (309 samples in CGGA325, 657 samples in CGGA693) from CGGA, and 602 samples from TCGA with complete WHO‐grade data and survival information were included in our analysis.
2.2. Patient tissue microarray and immunohistochemical staining
The tissue microarray of human glioma tissues (HBraGli060PG01) was purchased from Shanghai Outdo Biotech Company (Shanghai, China). The study was approved by the Ethics Committee of Shanghai Outdo Biotech Company. The glioma slice was deparaffinated, dehydrated, antigen retrieval, cyclooxygenase block, nonspecific antigen block, primary antibody incubated at 4°C overnight, second antibody incubated for 1 h, and then stained. The primary antibody was rabbit anti‐human AK2 (ab166901; Abcam). H‐SCORE = ∑(pi × i) = (percentage of weak intensity ×1) + (percentage of moderate intensity ×2) + (percentage of strong intensity ×3), where pi represents the percentage of positive cells in the total number of cells in the section. i stands for coloring intensity.
2.3. Prognostic significance analysis
Taking the median value of TPM as the threshold, patients with gliomas from the CGGA and TCGA databases were categorized into high‐ and low‐AK2 groups, respectively. The Kaplan–Meier method and log‐rank test were used to evaluate the survival prognostic value of AK2 in these cohorts.
Univariate and multivariate Cox regression analyses were used to determine if AK2 might be viewed as an independent prognostic marker.
A nomogram for the likelihood of overall survival (OS) was constructed using the R package RMS. The total points, which are the sum of the points of each factor, can be used to accurately predict the 1‐, 2‐, 3‐, 5‐, and 10‐year survival rates of glioma patients. The accuracy of the survival prediction was evaluated using calibration curves and C‐Index values.
2.4. Functional enrichment analysis of co‐expressed genes
Genes positively correlated with AK2 were identified using Pearson correlation analysis (R > 0.5, p < 0.05). The identification results were submitted to the Database for Annotation, Visualization, and Integrated Discovery (DAVID, v2021, https://david.ncifcrf.gov/tools.jsp) 20 , 21 for further Gene Ontology (GO) and Kyoto Encyclopedia of Genes and Genomes (KEGG) pathway enrichment analyses.
2.5. Cell culture
The glioma cell lines (A172 and T98G) (kind gift from Prof. Wei Wei, Department of Neurosurgery, Zhongnan Hospital of Wuhan University) and HEK293T (thoughtful gift from Prof. Zan Huang, School of Life Sciences of Wuhan University) were maintained in the complete Dulbecco's modified Eagle medium (DMEM, Gibco) with 10% fetal bovine serum (FBS, Cegrogen) and 1% penicillin and streptomycin (Gibco).
2.6. shRNA‐mediated AK2 downregulation
Pairs of complementary synthetic oligonucleotides for the AK2 target sequence were annealed together and cloned into pLKO.1 puro vector (Addgene) to generate shAK2 constructs. The sequence is 5′‐CGATGTCGTGTTCGCAAGCAT‐3′ (shAK2). The construction of AK2‐knockdown glioma cell lines was performed as previously described. 22
2.7. Quantitative RT‐PCR and Western blotting
Quantitative RT‐PCR (qRT‐PCR) analysis was performed as previously described. 22 The primer sets used for the qRT‐PCR analysis are as follows:
human‐β‐actin‐F: CTCCATCCTGGCCTCGCTGT;
human‐β‐actin‐R: GCTGTCACCTTCACCGTTCC;
human‐AK2‐F: CTCAAACCACCCCACTCATAGA;
human‐AK2‐R: ATGCTTGCGAACACGACATCG.
Western blotting was performed following a standard protocol. 22 The primary antibodies used were as follows: anti‐β‐actin (1: 1000; AC026, Abclonal), anti‐human AK2 (1:1000, ab166901, Abcam).
2.8. Cell proliferation assay
5 × 10³ cells were seeded in 100 mL culture medium in a 96‐well plate in triplicates. On each day, cells were incubated with CCK8 for 2 h. The absorbance at 450 nm was measured using a microplate reader.
2.9. Cell migration assays
Glioma cells were resuspended in DMEM without serum at a density of 1.6 × 10⁵/mL. 250 μL of the cell suspension was added to the transwell chamber. 750 μL complete DMEM containing 20% FBS was added to the bottom of the plate. After 24 h, the transwell chamber was stained with 0.05% crystal violet for 45 min. The upper layer of cells was wiped off and randomly selected microscopic fields were used for counting migrated cells by Image J software.
2.10. Colony formation assay
2–4 × 10³ glioma cells were added to a 6‐well plate. After 10–15 days, the plate was washed with PBS and fixed with 4% paraformaldehyde at 4°C overnight. Next, the plate was stained with 0.1% crystal violet for 20 min and scanned by a scanner. Colony numbers were counted by Image J software.
2.11. Immune infiltration and immune checkpoint analysis
The CIBERSORT 23 and TIMER2.0 (http://timer.cistrome.org/) 24 , 25 , 26 were applied to investigate the relationships between AK2 expression and immune‐cell infiltration. The xCell 27 was used to evaluate the microenvironment score etc. We further analyzed the relationships between AK2 expression, relevant inhibitory immune checkpoints, and eight immune system‐related metagene clusters.
2.12. Single‐cell analysis
The single‐cell RNA‐seq data was downloaded from CGGA. Low‐quality sequencing results were excluded based on the criterion of <200 expressed genes or 20% mitochondrial transcripts. Seurat R package was used.
2.13. Statistical analysis
The R (version 4.0.5), GraphPad Prism 9 (version 9.3.0), and SPSS 26.0 software packages were used for statistical analysis. Student t‐test, Mann–Whitney test, one‐way ANOVA, and the Kruskal–Wallis test were used. Differences with a two‐tailed p‐value of <0.05 were considered to be statistically significant.
3. RESULTS
3.1. AK2 expression is upregulated in gliomas
Based on data from GEPIA2.0, the AK2 expression levels were substantially higher in LGG (518 cases) and GBM (163 cases) than in normal tissues (207 samples) (p < 0.05; Figure 1A,B). To further assess AK2 protein expression levels, we obtained AK2 protein expression data from the CPTAC database. The finding revealed that the AK2 protein expression was also more abundant in glioma samples than in normal tissues (p < 0.0001; Figure 1C). We further used tissue microarray to confirm AK2 expression in human glioma tissues, which included 12 low‐grade glioma samples and 43 high‐grade glioma samples. The detailed clinical characteristics of glioma patients of tissue microarray was shown in Table S1. Immunohistochemical results showed that AK2 was significantly upregulated at the protein level in the high‐grade glioma tissues compared to the low‐grade glioma tissues (p < 0.001; Figure 1D–F).
FIGURE 1.
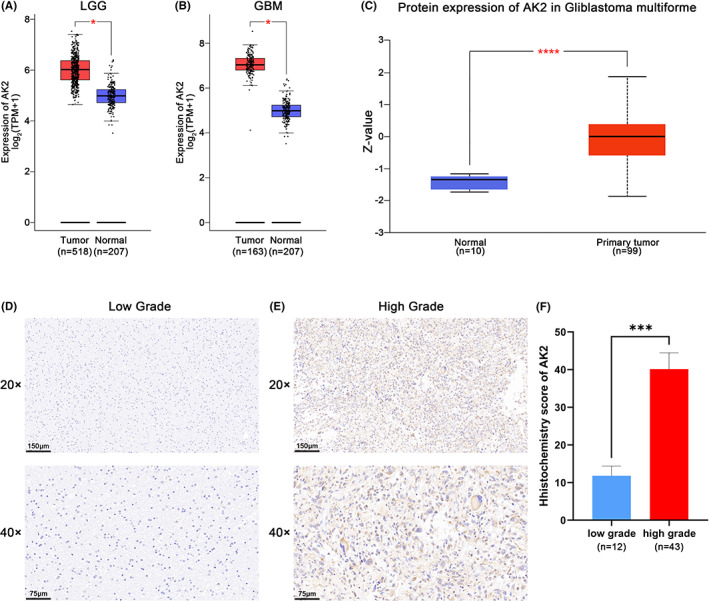
AK2 Expression of mRNA and protein level between gliomas and normal brain tissues. (A) Different expression of AK2 at mRNA level between LGG and normal brain tissues in GEPIA2 website. (B) Different expression of AK2 at mRNA level between GBM and normal brain tissues in GEPIA2 website. (C) Different expression of AK2 at protein level between gliomas and normal brain tissues in CPTAC database. (D, E) AK2 immunohistochemical pictures of the low‐grade and high‐grade glioma samples. (F) Immunohistochemistry revealed higher expression patterns of AK2 in high‐grade glioma tissues than in low‐grade glioma tissues. (*p < 0.05, **p < 0.01, ***p < 0.001, ****p < 0.0001).
3.2. AK2 expression is positive relative to aggressive clinicopathological and molecular features of glioma
A total of 602 cases from TCGA and 966 samples from CGGA were included in this analysis. In the TCGA, CGGA325, and CGGA693 datasets (Figure 2A–C), the MGMT promoter methylation status, 1p/19q codeletion status, IDH mutation status, age, WHO grade, and histological diagnosis displayed asymmetrical distributions with the increased of AK2 expression levels. We further compared AK2 expression in different groups stratified by clinicopathological features. In the TCGA cohort, AK2 was markedly overexpressed in higher‐grade gliomas (Figure 3A) and older patients (Figure 3B). In addition, AK2 expression was higher in IDH‐wildtype gliomas (Figure 3C) and gliomas without 1p/19q codeletion (Figure 3D). The data from the CGGA325 and CGGA693 provided strong support for the aforementioned findings (Figure 3F–I,K–N). In the TCGA cohort, AK2 expression was upregulated in MGMT‐unmethylated samples (Figure 3E). AK2 expression in the CGGA325 and CGGA693 followed the same pattern, even though there were no statistically significant distinctions (Figure 3J,O). Generally, the above findings demonstrate that AK2 is more highly upregulated in gliomas with unfavorable clinicopathological traits.
FIGURE 2.
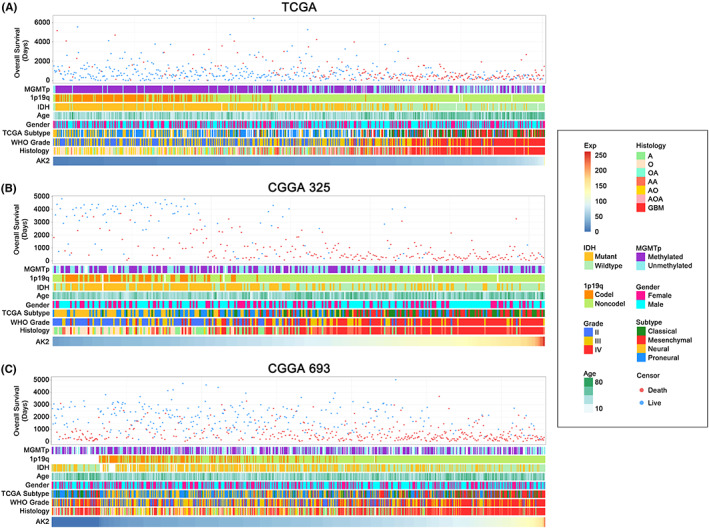
Heatmaps of clinicopathological features of glioma patients with AK2 increasing in TCGA, CGGA325, and CGGA693 datasets.
FIGURE 3.
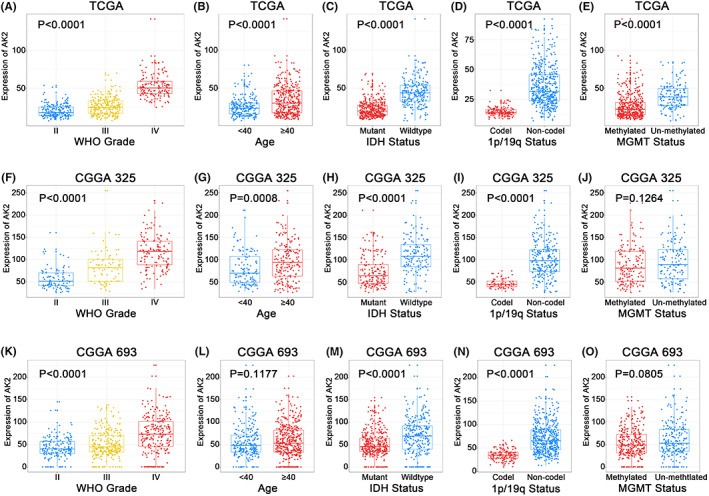
Relationship between AK2 and clinicopathological characteristics of glioma patients. (A, F, K) AK2 expression in different WHO grades in TCGA, CGGA325, and CGGA693. (B, G, L) AK2 expression in different age groups in TCGA, CGGA325, and CGGA693. (C, H, M) AK2 expression in different IDH statuses in TCGA, CGGA325, and CGGA693. (D, I, N) AK2 expression in different 1p/19q statuses in TCGA, CGGA325, and CGGA693. (E, J, O) AK2 expression in different MGMT statuses in TCGA, CGGA325, and CGGA693.
3.3. AK2 has predictive significance for the classical and mesenchymal subtypes, 1p/19q codeletion status, and IDH mutation status of glioma
Transcriptional subtype analysis is a widely used molecular diagnostic tool for gliomas. GBM is divided into pro‐neural, neural, classical, and mesenchymal subtypes using a robust molecular classification based on gene expression patterns. 28 All the TCGA (Figure 4A), CGGA325 (Figure 4C), and CGGA693 (Figure S1a) showed highly substantial upregulation of AK2 in the classical and mesenchymal subtypes (p < 0.0001) in comparison with the other two subtypes. Furthermore, we applied receiver‐operating characteristic (ROC) curve analysis to explore the AK2 expression specificity in the classical and mesenchymal subtypes. The area under the curve (AUC) was up to 93.0% (p < 0.0001), 86.1% (p < 0.0001), and 74.9% (p < 0.0001) in TCGA (Figure 4B), CGGA325 (Figure 4D), and CGGA693 (Figure S1b), respectively. According to these observations, AK2 was specifically upregulated in classical and mesenchymal gliomas, indicating that it may have predictive value for these two subtypes.
FIGURE 4.

AK2 expression of glioma transcriptional subtypes. (A, C) AK2 expression in glioma transcriptional subtypes in TCGA and CGGA325. (B, D) The receiver‐operating characteristic (ROC) curve of AK2 in the classical and mesenchymal subtype of gliomas in the TCGA and CGGA325.
Furthermore, we detected whether AK2 could predict other clinicopathological features in glioma, we applied ROC curve analysis to explore the AK2 expression specificity in the 1p/19q non‐codel, IDH wildtype, and MGMT un‐methylated status, respectively. It was found that AK2 could predict 1p/19q codeletion status and IDH mutation status of glioma well (p < 0.0001) (Figure S2a,b,d,e,g,h). It could predict MGMT status in the TCGA dataset (p < 0.0001) (Figure S2c) but not in CGGA325 (Figure S2f) and CGGA693 (Figure S2i).
As patients with classical and mesenchymal subtypes of GBM, 1p/19q non‐codel, IDH wildtype have a poor prognosis, these findings confirmed the link between AK2 and the high malignancy of gliomas that we had previously discovered.
3.4. AK2 is an independent prognostic factor of glioma
Using information from the TCGA and CGGA databases, we performed Kaplan–Meier survival analyses and constructed a Cox proportional hazards model to assess the prognostic value of AK2 in patients with glioma. Kaplan–Meier analyses of the data from the TCGA database (Figure 5A), CGGA325 (Figure 5B), and CGGA693 (Figure 5C) showed that higher expression of AK2 predicted shorter survival in glioma patients (p < 0.0001). The Cox proportional hazards model, which included AK2 expression, WHO grade, age, IDH status, 1p/19q status, and MGMT status, indicated that AK2 expression was a significant independent risk factor for poor clinical outcomes in both the TCGA and CGGA databases (Tables 1, 2, 3).
FIGURE 5.

Kaplan–Meier analysis of glioma patients in TCGA, CGGA325, and CGGA693.
TABLE 1.
Univariate and multivariate analyses of prognostic factors in TCGA overall survival (OS).
| Variable | Univariate analysis | Multivariate analysis | ||
|---|---|---|---|---|
| HR (95% CI) | p‐value | HR (95% CI) | p‐value | |
| AK2 expression | 1.029 (1.024–1.033) | 4.79e‐40 | 1.013 (1.003–1.024) | 0.009 |
| WHO grade | 5.700 (3.879–8.374) | 7.57e‐19 | 2.186 (1.408–3.394) | 0.05e‐2 |
| Age | 1.069 (1.058–1.079) | 7.45e‐39 | 1.048 (1.035–1.061) | 4.58e‐13 |
| IDH status | 0.093 (0.069–0.126) | 3.61e‐53 | 0.347 (0.213–0.565) | 0.02e‐3 |
| 1p/19q Codel | 0.219 (0.138–0.347) | 1.02e‐10 | 0.579 (0.331–1.012) | 0.055 |
| MGMT status | 0.302 (0.227–0.404) | 4.69e‐16 | 0.743 (0.527–1.049) | 0.091 |
TABLE 2.
Univariate and multivariate analyses of prognostic factors in CGGA325 overall survival (OS).
| Variable | Univariate analysis | Multivariate analysis | ||
|---|---|---|---|---|
| HR (95% CI) | p‐value | HR (95% CI) | p‐value | |
| AK2 expression | 1.017 (1.014–1.020) | 9.02e‐33 | 1.010 (1.006–1.014) | 2.81e‐8 |
| WHO grade | 5.657 (3.917–8.171) | 2.49e‐20 | 3.795 (2.543–5.662) | 6.57e‐11 |
| Age | 1.033 (1.020–1.046) | 4.11e‐7 | 1.010 (0.998–1.023) | 0.104 |
| IDH status | 0.360 (0.272–0.477) | 8.88e‐13 | 1.129 (0.809–1.575) | 0.475 |
| 1p/19q Codel | 0.170 (0.104–0.277) | 1.28e‐12 | 0.304 (0.178–0.520) | 0.01e‐3 |
| MGMT status | 0.837 (0.636–1.100) | 0.202 | ||
TABLE 3.
Univariate and multivariate analyses of prognostic factors in CGGA693 overall survival (OS).
| Variable | Univariate analysis | Multivariate analysis | ||
|---|---|---|---|---|
| HR (95% CI) | p‐value | HR (95% CI) | p‐value | |
| AK2 expression | 1.014 (1.011–1.017) | 3.16e‐24 | 1.007 (1.003–1.011) | 3.05e‐4 |
| WHO grade | 2.666 (2.303–3.087) | 2.80e‐39 | 2.983 (2.020–4.407) | 3.99e‐8 |
| Age | 1.026 (1.018–1.035) | 1.37e‐9 | 1.011 (1.002–1.011) | 0.018 |
| IDH status | 0.323 (0.262–0.399) | 3.38e‐26 | 0.577 (0.435–0.763) | 1.20e‐4 |
| 1p/19q Codel | 0.268 (0.193–0.372) | 3.02e‐15 | 0.511 (0.336–0.777) | 0.002 |
| MGMT status | 0.795 (0.639–0.990) | 0.041 | 0.931 (0.731, 1.186) | 0.562 |
Next, we created a nomogram using the identified clinical parameters (WHO grade, gender, age, IDH status, 1p/19q status, MGMT status, and AK2 expression) to forecast each glioma patient's likelihood of surviving for 1, 3, 5, and 10 years (Figure 6A). The nomogram‐predicted survival probability was quite close to the ideal reference line in the CGGA database, according to the calibration plot for the likelihood of survival (Figure 6B). In the CGGA dataset, the C‐index was 0.744 (Figure 6C). In conclusion, AK2 may be a biomarker and an independent risk factor for tumor progression in glioma patients, relating to the prognosis.
FIGURE 6.

The individualized prediction models of OS in gliomas. (A) The nomogram predicts the 1‐, 2–3‐, 5‐, and 10‐year survival rates of glioma patients in CGGA325. (B) The calibration plot verifies the prediction model's prediction effect in CGGA325. (C) The C‐Index measures the predictive effect of the prediction model in CGGA325.
3.5. GO functional annotation and KEGG pathway enrichment analysis of AK2
In TCGA and CGGA325, we applied Pearson correlation analysis (R > 0.5, p < 0.05) to identify the genes most strongly correlated with AK2. A total of 1950 genes were screened from the TCGA and 1352 genes were screened from the CCGA325. These gene sets were submitted to the DAVID website to further explore the biological functions or pathways in which these genes are enriched. In the TCGA, AK2 functions were enriched in the biological processes (BP) of cell division, ER to Golgi vesicle‐mediated transport, and apoptosis (Figure 7A), while the most relevant cellular component (CC) was the cytosol (Figure 7B), and the corresponding molecular functions (MF) mainly involved protein‐, RNA‐, and protein domain‐specific binding (Figure 7C). The KEGG analysis revealed the proteasome, the cell cycle, and the DNA replication as relevant to AK2 (Figure 7D). The BP, CC, MF, and KEGG pathways associated with AK2 in CGGA were similar to those identified in TCGA (Figure 7E–H). These findings suggested that AK2 might play a potential role in tumor development and the tumor microenvironment, with possible specific roles in gliomas.
FIGURE 7.
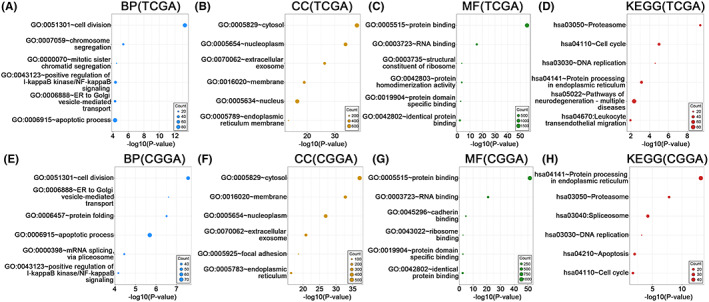
GO functional enrichment analysis and KEGG pathway enrichment analysis of positively AK2‐related genes (R > 0.5, p < 0.05) in TCGA and CGGA. (A–D) Biological processes (BP), cellular components (CC), molecular functions (MF), and KEGG pathways involved with AK2 from the TCGA. (E–H) Biological processes (BP), cellular components (CC), molecular functions (MF), and KEGG pathways involved with AK2 from the CGGA. The circle size represents the size of the relevant gene set contained in the pathway, and the larger the circle, the more relevant genes are contained.
3.6. Downregulation of AK2 suppresses cell proliferation, migration, and colony formation of glioma cell lines in vitro
We utilized shRNA knockdown of AK2 in A172 and T98G cell lines, and the knockdown efficiency was verified by qRT‐PCR assay and western blotting (Figure 8A,B). The CCK8 assay showed that the downregulation of AK2 significantly inhibits glioma cells' proliferation ability (Figure 8C). The migration assay revealed that AK2 knockdown suppressed the migration of A172 and T98G (Figure 8D). Additionally, the colony formation assay performed that the depilation of AK2 also abated the colony formation ability of glioma cell lines (Figure 8E).
FIGURE 8.
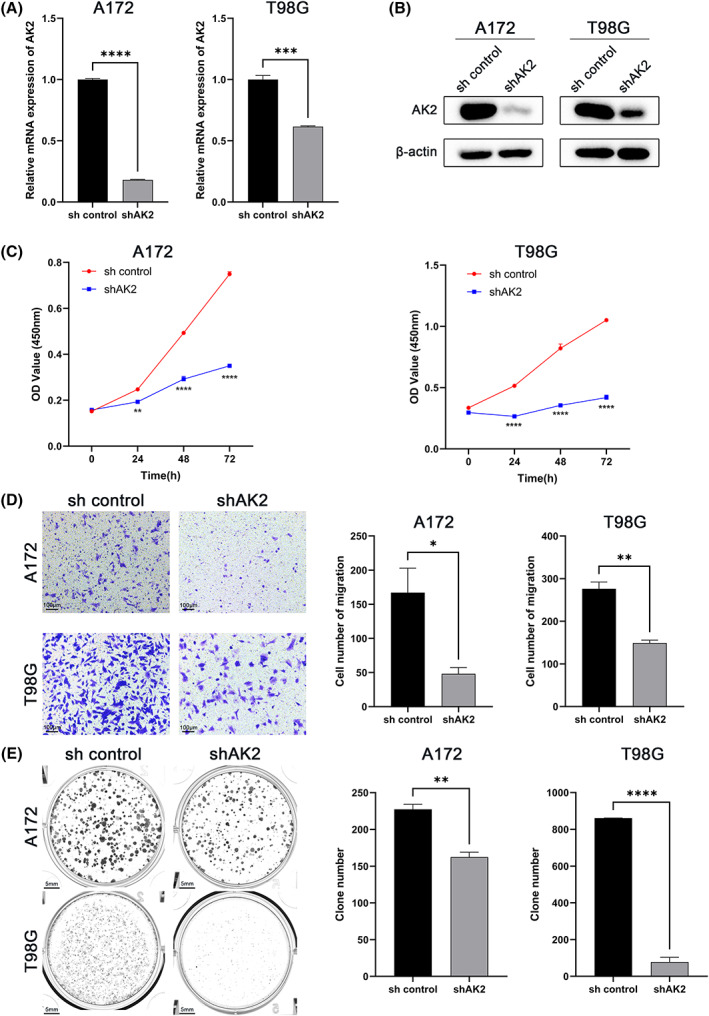
Effects of AK2 knockdown on the proliferation, migration, and colony formation of glioma cell lines in vitro. (A) Knockdown efficiency of AK2 in glioma cells verified with qRT‐PCR. The mean β‐Actin was used as the endogenous control. (B) Knockdown efficiency of AK2 in glioma cells verified with western blotting. (C) Effect of AK2 knockdown on the proliferation of glioma cells. (D) Effect of AK2 knockdown on the migration of glioma cells. (E) Effect of AK2 knockdown on the colony formation of glioma cells (*p < 0.05, **p < 0.01, ***p < 0.001, ****p < 0.0001).
3.7. Relationship between AK2 expression and tumor‐infiltrating immune cells in glioma
We applied CIBERSORT to assess the tumor infiltration levels of 22 immune cell types in glioma tissues from different AK2‐expression subgroups. The results revealed that there were significant variations in the proportion of 11 types of immune cells in TCGA (Figure 9A), as well as 6 types of immune cells in CGGA (Figure 9B). We discovered that the AK2 high‐expression group in TCGA had an enriched population of M2 macrophages. Although there was a similar trend in CGGA, the result did not reach statistical significance.
FIGURE 9.

Differential infiltration of tumor immune cells related to AK2 expression. (A) Differential infiltration of 22 types of immune cells between different AK2 expression groups in TCGA by CIBERSORT analysis. (B) Differential infiltration of 22 types of immune cells between different AK2 expression groups in CGGA by CIBERSORT analysis. (C) Relationship between AK2 expression and tumor immune cells in LGG by TIMER2.0 database. (D) Relationship between AK2 expression and tumor immune cells in GBM by TIMER2.0 database.
It should be noted that the connection between AK2 and immune cell infiltration might vary between gliomas with different levels of malignancy. The TIMER2.0 database was applied to explore the link between AK2 and 6 types of immune cells in LGG and GBM including B cells, CD8+ T cells, CD4+ T cells, macrophages, neutrophils, and dendritic cells. In LGG (Figure 9C), infiltration by the 5 aforementioned cell types was positively correlated with AK2 expression except for CD8+ T cells. However, AK2 expression was only weakly positively correlated with CD8+ T cells, as well as weakly negatively correlated with CD4+ T cells in GBM (Figure 9D).
Then, we used the xCell method to obtain the microenvironment score, stroma score, and immune score of glioma samples in TCGA (Figure 10A) and CGGA (Figure 10B). With the rise in AK2 expression levels, they all showed asymmetrical distributions. And the enrichment scores of macrophages M2 between the AK2 low‐expression group and high‐expression group in TCGA (Figure S3a) and CGGA (Figure S3b) were compared respectively, there was a higher enrichment score in AK2 high‐expression group. This result was consistent with the above results of the CIBERSORT method.
FIGURE 10.

Heatmaps of microenvironment score, stroma score, and an immune score of glioma patients with AK2 increasing in TCGA and CGGA by xCell analysis.
Taken together, the above analyses strongly implied that AK2 might influence the tumor immune microenvironment of gliomas.
3.8. Single‐cell analysis of AK2
All cells were divided into 15 clusters (Figure 11A) and finally annotated as 6 types of cells: cancer cell, oligodendrocyte, microglia, M1 macrophage, M2 microphage, and T cell (Figure 11B). The scatter plot (Figure 11C) showed that AK2 was expressed in all cell clusters, but it was found from the scatter plot (Figure 11D) that the AK2 expression level of M2 macrophages was higher than that of M1 macrophages. This also supported the results of the above immune infiltration analysis.
FIGURE 11.
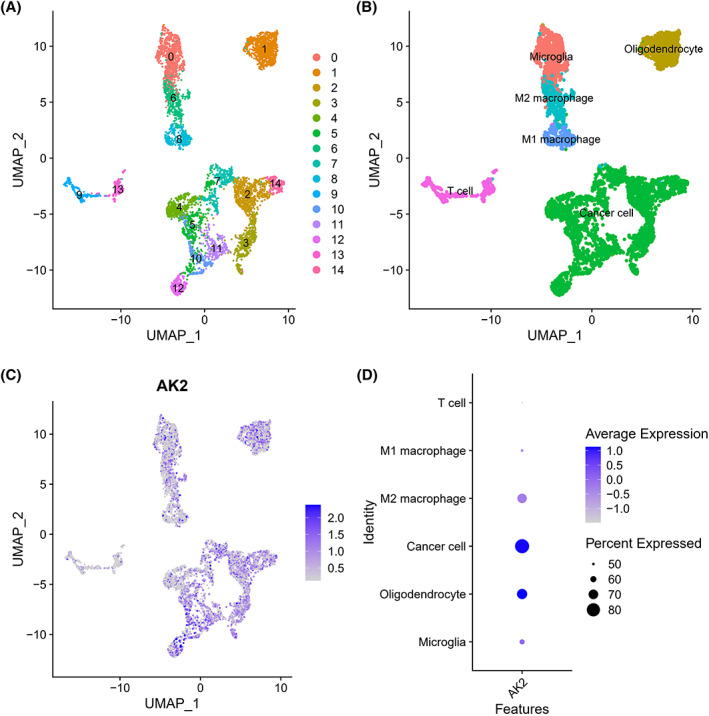
Single‐cell analysis of single‐cell mRNA sequence. (A) A two‐dimensional UMP plot depicted that 6148 single cells were divided into 15 clusters and displayed in different colors. (B) The 15 clusters were annotated as six types of cells: cancer cell, oligodendrocyte, microglia, M2 macrophage, M1 macrophage, and T cell. (C) AK2 expression in each cell. (D) The bubble plot showed AK2 expression in different types of cells.
3.9. AK2 expression is related to inhibitory immune checkpoints and immune‐related metagene clusters
Given the significance of immune checkpoints in the antitumor response, we looked at the interactions between AK2 and relevant inhibitory immune checkpoints in the TCGA and CGGA datasets, including TIGIT, CTLA‐4, PD‐2, PD‐1, CD200R1, TIM‐3, and HVEM (Figure 12A). AK2 exhibited positive relationships with all the analyzed inhibitory immune checkpoints except TIGIT. Thus, the inhibition of the antitumor immune response against gliomas was positively correlated with AK2 expression. The co‐expression of AK2 with eight immune system‐related metagene clusters 29 , 30 that serve as indicators of immunological states was also examined. These clusters include HCK, IgG, interferon, LCK, MHC‐I/MHC‐II, and STAT1/2. As shown in the corrgrams of the TCGA and CGGA data (Figure 12B,C), the majority of inflammatory responses related to glioma showed highly positive correlations with AK2 expression. These results suggest that AK2 may be essential for the immunological response against glioma.
FIGURE 12.
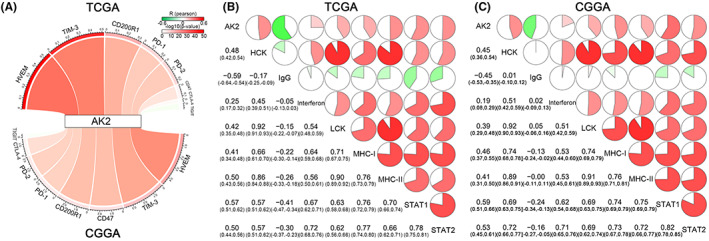
The correlation between AK2 expression and inhibitory immune checkpoints and inflammatory activities. (A) Pearson correlation between AK2 and inhibitory immune checkpoints. The R‐value was expressed by the band's width. The p‐value was denoted by the band's color. (B, C) Correlation matrix of AK2 and inflammatory‐related metagenes. The correlation coefficient was displayed at the bottom left. The percentages of the pie charts were used to show the correlation coefficients. A positive correlation was represented by the red regions and a negative correlation by the green parts.
4. DISCUSSION
Glioma classification has long been determined by histological features, but the important role of molecular biomarkers such as IDH mutation, 1p/19q codeletion, and MGMTp methylation was emphasized in WHO CNS5. 2 In our research, we are committed to identifying new biomarkers that can meaningfully contribute to the diagnosis and treatment of glioma.
According to this investigation, we discovered that AK2 expression was significantly upregulated in gliomas compared to normal brain tissues. Both the mRNA data from GEPIA 2.0 and protein expression data from CPTAC supported these results. And immunohistochemical results of glioma patient samples showed that AK2 was significantly upregulated in the high‐grade glioma tissues compared to the low‐grade glioma tissues. To further assess the prognostic potential of AK2 in gliomas, we analyzed transcriptomic and clinical data from the TCGA and CGGA databases. It was found that AK2 expression was increased in patients with advanced age, in tumors with higher WHO grade, as well as IDH wildtype, 1p/19q codeletion‐free, and MGMTp un‐methylated tumors, which are characterized by poor survival. Furthermore, AK2 was more highly expressed in the classical and mesenchymal subtypes than in the neural and pro‐neural subtypes of glioma. In previous studies, it was reported that classical and mesenchymal gliomas are generally more malignant and have poorer clinical outcomes. Above all, our research indicated that AK2 might be a novel prognostic biomarker for gliomas.
Consistently, glioma patients with high AK2 expression had shorter survival in the Kaplan–Meier survival analysis than those with lower AK2 expression levels. Furthermore, AK2 was identified as an independent predictive factor for glioma using a Cox proportional hazards model. Given that AK2 was identified as a powerful predictive factor, we constructed a nomogram based on AK2 expression information from the CGGA325 to predict the 1‐, 2‐, 3‐, 5‐, and 10‐year OS of individual glioma patients. The calibration plot and C‐index showed that the model had a good prediction effect. In summary, higher levels of AK2 expression were associated with a worse prognosis for glioma patients.
To further identify the potential mechanisms through which AK2 contributes to the tumor biology of gliomas, Pearson correlation analysis was applied to screen the upregulated genes with increasing AK2 expression, followed by GO and KEGG pathway enrichment analyses. In the GO annotation, biological processes related to cell division and apoptosis were identified as relevant to AK2. KEGG analysis revealed that the cell cycle and DNA replication pathways were significantly enriched in the high‐AK2 expression group. Thus, these findings suggest that AK2 may be related to the proliferation and invasion of gliomas.
Then we constructed AK2 knockdown glioma cell lines to explore whether AK2 could affect glioma progress. It was performed that when AK2 was downregulated, glioma cells had worse proliferation, migration, and colony formation abilities.
In both primary and metastatic brain tumors, the tumor microenvironment (TME) is increasingly being recognized as a crucial regulator of cancer progression. 31 In addition to cancer cells, the TME also comprises several non‐cancerous cell types, such as endothelial cells, pericytes, fibroblasts, and immune cells. 32 Macrophages make up the majority of immune cells in brain tumors and can play either oncogenic or anticancer roles. 33 Classical M1 polarization was associated with the ability to engulf cancer cells and attract T lymphocytes, resulting in a tumoricidal activity. Conversely, M2 polarization was associated with an immunologically quiescent profile. 34 The CIBERSORT computational method indicated that M2 macrophages were enriched in the AK2 high‐expression group in the TCGA database, and the CGGA data showed a similar tendency. According to data from the TIMER2.0 database, AK2 expression was correlated with the level of immune cell infiltration. By xCell, it was revealed AK2 high expression group had a higher microenvironment score, stroma score, and immune score. Through single‐cell analysis, it was shown that the AK2 expression of M2 macrophages was higher than M1 macrophages. We also discovered that AK2 displayed the same pattern of expression as inhibitory immunological checkpoints, including HVEM, TIM‐3, CD200R1, and PD‐1, among others. In conclusion, AK2 was found to be related to the level of immune cell infiltration in gliomas and may influence the level of immune cell infiltration to encourage tumor immune escape, thereby affecting the prognosis of glioma patients.
Even though our current study supports the important role of AK2 in gliomas, it has certain limitations. We look forward to identifying and corroborating these findings in further studies in vivo and investigating the mechanisms underlying the role of AK2 in gliomas.
FUNDING INFORMATION
The authors declare that no funds, grants, or other support were received during the preparation of this manuscript.
CONFLICT OF INTEREST STATEMENT
The authors have no relevant financial or non‐financial interests to disclose.
Supporting information
Data S1.
Figure S1.
Liu Z, Tang C, Teng X, Mohamed ZA, Fan J. Adenylate kinase 2 is a biomarker related to the prognosis of glioma and the immune microenvironment. J Clin Lab Anal. 2023;37:e24892. doi: 10.1002/jcla.24892
DATA AVAILABILITY STATEMENT
The datasets presented in this study can be found in CGGA (http://www.cgga.org.cn/) and TCGA (https://portal.gdc.cancer.gov/).
REFERENCES
- 1. Ostrom QT, Price M, Neff C, et al. CBTRUS statistical report: primary brain and other central nervous system tumors diagnosed in the United States in 2015–2019. Neuro‐Oncology. 2022;24(Suppl_5):v1‐v95. [DOI] [PMC free article] [PubMed] [Google Scholar]
- 2. Louis DN, Perry A, Wesseling P, et al. The 2021 WHO classification of tumors of the central nervous system: a summary. Neuro‐Oncology. 2021;23(8):1231‐1251. [DOI] [PMC free article] [PubMed] [Google Scholar]
- 3. Miller KD, Ostrom QT, Kruchko C, et al. Brain and other central nervous system tumor statistics, 2021. CA Cancer J Clin. 2021;71(5):381‐406. [DOI] [PubMed] [Google Scholar]
- 4. Claus EB, Walsh KM, Wiencke JK, et al. Survival and low‐grade glioma: the emergence of genetic information. Neurosurgical Focus FOC. 2015;38(1):E6. [DOI] [PMC free article] [PubMed] [Google Scholar]
- 5. Dzeja P, Terzic A. Adenylate kinase and AMP signaling networks: metabolic monitoring, signal communication, and body energy sensing. Int J Mol Sci. 2009;10(4):1729‐1772. [DOI] [PMC free article] [PubMed] [Google Scholar]
- 6. Panayiotou C, Solaroli N, Karlsson A. The many isoforms of human adenylate kinases. Int J Biochem Cell Biol. 2014;49:75‐83. [DOI] [PubMed] [Google Scholar]
- 7. Fagerberg L, Hallström BM, Oksvold P, et al. Analysis of the human tissue‐specific expression by genome‐wide integration of transcriptomics and antibody‐based proteomics. Molec Cellular Proteomics. 2014;13(2):397‐406. [DOI] [PMC free article] [PubMed] [Google Scholar]
- 8. Fujisawa K, Murakami R, Horiguchi T, Noma T. Adenylate kinase isozyme 2 is essential for growth and development of Drosophila melanogaster. Comparat Biochem Physiol Part B: Biochem Molec Biol. 2009;153(1):29‐38. [DOI] [PubMed] [Google Scholar]
- 9. Zhang S, Yamada S, Park S, et al. Adenylate kinase AK2 isoform integral in embryo and adult heart homeostasis. Biochem Biophys Res Commun. 2021;546:59‐64. [DOI] [PMC free article] [PubMed] [Google Scholar]
- 10. Pannicke U, Hönig M, Hess I, et al. Reticular dysgenesis (aleukocytosis) is caused by mutations in the gene encoding mitochondrial adenylate kinase 2. Nat Genet. 2009;41(1):101‐105. [DOI] [PubMed] [Google Scholar]
- 11. Lagresle‐Peyrou C, Six EM, Picard C, et al. Human adenylate kinase 2 deficiency causes a profound hematopoietic defect associated with sensorineural deafness. Nat Genet. 2009;41(1):106‐111. [DOI] [PMC free article] [PubMed] [Google Scholar]
- 12. Lee H‐J, Pyo J‐O, Oh Y, et al. AK2 activates a novel apoptotic pathway through formation of a complex with FADD and caspase‐10. Nat Cell Biol. 2007;9(11):1303‐1310. [DOI] [PubMed] [Google Scholar]
- 13. Liu H, Pu Y, Amina Q, et al. Prognostic and therapeutic potential of adenylate kinase 2 in lung adenocarcinoma. Sci Rep. 2019;9(1):17757. [DOI] [PMC free article] [PubMed] [Google Scholar]
- 14. Cai F, Xu H, Zha D, et al. AK2 promotes the migration and invasion of lung adenocarcinoma by activating TGF‐β/Smad pathway In vitro and In vivo. Front Pharmacol. 2021;12:714365. [DOI] [PMC free article] [PubMed] [Google Scholar]
- 15. Kim H, Jeong M, Na D‐H, et al. AK2 is an AMP‐sensing negative regulator of BRAF in tumorigenesis. Cell Death Dis. 2022;13(5):469. [DOI] [PMC free article] [PubMed] [Google Scholar]
- 16. Wang H, Zhao X, Wang H. circ_0075943 dominates the miR‐141‐3p/AK2 network to support the development of breast carcinoma. J Oncol. 2021;2021:4098270. [DOI] [PMC free article] [PubMed] [Google Scholar]
- 17. Kim H, Lee H‐J, Oh Y, et al. The DUSP26 phosphatase activator adenylate kinase 2 regulates FADD phosphorylation and cell growth. Nat Commun. 2014;5(1):3351. [DOI] [PMC free article] [PubMed] [Google Scholar]
- 18. Tang Z, Kang B, Li C, Chen T, Zhang Z. GEPIA2: an enhanced web server for large‐scale expression profiling and interactive analysis. Nucleic Acids Res. 2019;47(W1):W556‐W560. [DOI] [PMC free article] [PubMed] [Google Scholar]
- 19. Zhao Z, Zhang K‐N, Wang Q, et al. Chinese glioma genome atlas (CGGA): a comprehensive resource with functional genomic data from Chinese glioma patients. Genomics Proteomics Bioinformatics. 2021;19(1):1‐12. [DOI] [PMC free article] [PubMed] [Google Scholar]
- 20. Sherman BT, Hao M, Qiu J, et al. DAVID: a web server for functional enrichment analysis and functional annotation of gene lists (2021 update). Nucleic Acids Res. 2022;50(W1):W216‐W221. [DOI] [PMC free article] [PubMed] [Google Scholar]
- 21. Huang DW, Sherman BT, Lempicki RA. Systematic and integrative analysis of large gene lists using DAVID bioinformatics resources. Nat Protoc. 2009;4(1):44‐57. [DOI] [PubMed] [Google Scholar]
- 22. Zhou J, Zhou Q, Zhang T, Fan J. C7ORF41 regulates inflammation by inhibiting NF‐κB signaling pathway. Biomed Res Int. 2021;2021:7413605‐7413607. [DOI] [PMC free article] [PubMed] [Google Scholar]
- 23. Newman AM, Steen CB, Liu CL, et al. Determining cell type abundance and expression from bulk tissues with digital cytometry. Nat Biotechnol. 2019;37(7):773‐782. [DOI] [PMC free article] [PubMed] [Google Scholar]
- 24. Li T, Fan J, Wang B, et al. TIMER: a web server for comprehensive analysis of tumor‐infiltrating immune cells. Cancer Res. 2017;77(21):e108‐e110. [DOI] [PMC free article] [PubMed] [Google Scholar]
- 25. Li B, Severson E, Pignon J‐C, et al. Comprehensive analyses of tumor immunity: implications for cancer immunotherapy. Genome Biol. 2016;17(1):174. [DOI] [PMC free article] [PubMed] [Google Scholar]
- 26. Li T, Fu J, Zeng Z, et al. TIMER2.0 for analysis of tumor‐infiltrating immune cells. Nucleic Acids Res. 2020;48(W1):W509‐W514. [DOI] [PMC free article] [PubMed] [Google Scholar]
- 27. Aran D, Hu Z, Butte AJ. xCell: digitally portraying the tissue cellular heterogeneity landscape. Genome Biol. 2017;18(1):220. [DOI] [PMC free article] [PubMed] [Google Scholar]
- 28. Verhaak RG, Hoadley KA, Purdom E, et al. Integrated genomic analysis identifies clinically relevant subtypes of glioblastoma characterized by abnormalities in PDGFRA, IDH1, EGFR, and NF1. Cancer Cell. 2010;17(1):98‐110. [DOI] [PMC free article] [PubMed] [Google Scholar]
- 29. Rody A, Holtrich U, Pusztai L, et al. T‐cell metagene predicts a favorable prognosis in estrogen receptor‐negative and HER2‐positive breast cancers. Breast Cancer Res. 2009;11(2):R15. [DOI] [PMC free article] [PubMed] [Google Scholar]
- 30. Wang Z, Zhang C, Liu X, et al. Molecular and clinical characterization of PD‐L1 expression at transcriptional level via 976 samples of brain glioma. Onco Targets Ther. 2016;5(11):e1196310. [DOI] [PMC free article] [PubMed] [Google Scholar]
- 31. Quail DF, Joyce JA. The microenvironmental landscape of brain tumors. Cancer Cell. 2017;31(3):326‐341. [DOI] [PMC free article] [PubMed] [Google Scholar]
- 32. Quail DF, Joyce JA. Microenvironmental regulation of tumor progression and metastasis. Nat Med. 2013;19(11):1423‐1437. [DOI] [PMC free article] [PubMed] [Google Scholar]
- 33. Robinson A, Han CZ, Glass CK, Pollard JW. Monocyte regulation in homeostasis and malignancy. Trends Immunol. 2021;42(2):104‐119. [DOI] [PMC free article] [PubMed] [Google Scholar]
- 34. Sica A, Larghi P, Mancino A, et al. Macrophage polarization in tumour progression. Semin Cancer Biol. 2008;18(5):349‐355. [DOI] [PubMed] [Google Scholar]
Associated Data
This section collects any data citations, data availability statements, or supplementary materials included in this article.
Supplementary Materials
Data S1.
Figure S1.
Data Availability Statement
The datasets presented in this study can be found in CGGA (http://www.cgga.org.cn/) and TCGA (https://portal.gdc.cancer.gov/).


