Abstract
Purpose
We have recorded the electrically evoked electroretinogram (eERG) and flash ERG in Argus II retinal prosthesis wearers with end-stage retinitis pigmentosa to estimate response properties of the degenerated inner retina to local electrical stimulation. In addition, we have recorded pupil diameters during electrical stimulation.
Methods
Raw corneal eERGs were recorded at multiple stimulus levels in three subjects. eERG signals were heavily contaminated with various artifacts, including switching artifacts generated by the implant electronics, stimulus, blink, and eye-movement artifacts. Pupil responses were recorded in one subject using a pupil tracker.
Results
eERGs were decontaminated by a variety of techniques, including wavelet transformation and response averaging. The dominant component was a negative wave peaking at approximately 200 ms. eERG amplitudes correlated significantly with stimulus level, but peak latencies did not correlate with stimulus level. Pupil constriction correlated significantly with stimulus level and pupil responses could be accurately used to estimate subjective threshold.
Conclusions
eERG recordings hold the potential to be developed further for use as a diagnostic tool for retinal implants. A straightforward approach to increase eERG amplitudes would be the development of intraocular recording methods based on reverse telemetry. The robust pupil response to electrical stimulation in one subject indicates that pupillography can be exploited to assess implant functionality, but reliable pupil recordings could not be obtained in all subjects.
Keywords: electrical stimulation, retinal implant, Argus II, electroretinogram, electrophysiology, pupillography, pupil tracking
Introduction
Retinal implants have begun to emerge as treatments for restoring vision [1–3]. With these developments comes the need for appropriate diagnostic methods to assess implant functionality. Although psychophysical measures and other behavioral tests have been used effectively to assess retinal implant performance [4,5], there is also need for objective measures. In cochlear implants, which have been clinically approved since the 1980s [6], built-in electronics are being used to record electrically evoked auditory-nerve activity. These electrically evoked compound action potential (eCAP) recordings represent the synchronized action potential response of spiral ganglion cells in the cochlea. eCAP recordings are routinely performed for diagnostic purposes. They can be deployed during rehabilitation as an objective measure of electric hearing to aid in fitting of the device [7], and are essential during implantation surgery when the patient is held under general anesthesia and cannot verbally confirm device functionality [8]. Measurement of the electrically evoked electroretinogram (eERG) could likewise prove useful for intraoperative device assessment, diagnostics and device-fitting.
Previously we reported on electrically elicited VEPs in Argus II retinal implant wearers [9]. In that study we found these eVEP recordings to be relatively straightforward, and we concluded that they can be useful for similar diagnostic purposes as the eERG. However, eVEPs only reflect end-to-end signal transmission along the visual pathway, for a subset of electrodes located over the central macula; moreover, eERGs have the important advantage that they reflect neural activity generated at the interface between implant and nervous tissue. Any changes in device functionality are likely the result of processes occurring at this electrode-tissue interface, such as retinal rewiring, gliosis, infection, dislocation of the implant, electrode drop-out and continuing neural degeneration. Furthermore, eVEP amplitudes were shown to depend on retinal location, which can be explained by cortical magnification and layout under the skull [9]. Retinal potentials do not suffer from these distortions.
Although there have been other attempts (Zrenner E and Wilke R, personal communications), we are aware of only one published study on eERGs. This was a study done in rats with substantial residual vision, and focused on the pharmacological dissection of the eERG response [10]. In the present study we established the input-output characteristics of the eERG in three Argus II retinal implant wearers. These subjects were diagnosed with end-stage retinitis pigmentosa and had no functional vision other than bare light perception. An additional goal of the study was to examine the presence of detectable flash ERGs in either the implanted or fellow eye.
The Argus II prosthesis consists of an array of 60 electrodes that stimulate the surviving neurons in the degenerate retina. It is implanted epiretinally and spans 20° diagonally of the visual field. Visual information is obtained from a glasses-mounted camera [11]. In this study, however, the implant was under computer control to allow direct stimulation of each electrode with precisely known parameters. Stimuli sent to the implant are processed in a video processing unit. This processing unit refreshes the information sent to the implanted array at a rate of 120 s−1. At present, patients are implanted unilaterally, usually in the eye with the worst residual vision.
The eERG was heavily contaminated by various artifacts, and several signal-processing techniques were used to decontaminate the signal. We have recorded the pupil diameter during electrical stimulation and we show that implant stimulation evokes robust pupil responses in the implanted eye as well as the fellow eye. We discuss how pupil responses may have affected the eERG, and how pupillography may be useful for assessing retinal implant functionality. This study sheds light on the functionality of the degenerate human retina in a way that has never been investigated before.
Materials and methods
Subjects
Three Argus II retinal implantees participated in the study. These subjects were enrolled in an ongoing safety/efficacy study sponsored by Second Sight Medical Products (SSMP, Sylmar, CA, USA: http://clinicaltrials.gov/ct2/show/NCT00407602) and were implanted in the right eye. Prior to implantation, all three subjects had been diagnosed with end-stage retinitis pigmentosa and they had no residual visual function greater than bare-light perception.
The experiments adhered to the tenets of the Declaration of Helsinki. Before the experiments were started, the nature and possible consequences of electrically evoked ERG recording were explained, and informed consent was obtained from each subject. The experimental protocol was approved by the Institutional Review Board of the Johns Hopkins Medical Institutions.
Recording of light-evoked ERGs
To investigate the residual light-sensitivity, dark-adapted flash ERGs were recorded with a Burian-Allen electrode using the Espion e2 system and Color Dome Ganzfeld (Diagnosys LLC, Westford, MA, USA). Subjects were dilated using 2.5% phenylephrine hydrochloride and 1% tropicamide topical solutions and subsequently dark-adapted for half an hour. Stimuli were −5 dB to 30 dB (ref. 3 cd.s/m2) starting from the lowest intensity, increasing in 5 dB steps. Full-field light sensitivity thresholds ranged from −4 dB to +10 dB, dependent on the subject and the eye tested. ERGs were registered from both eyes by recording 20 epochs per light intensity per eye. The retinal prosthesis system was switched off. At intensities of +20 dB and higher, a stimulus artifact was registered. We assume this artifact to be of photoelectric origin [12,13]. The artifact was reduced by subtracting a template of the photoelectric response, which was obtained by immersion of a Burian-Allen electrode in artificial tears and recording of the signal with identical stimulus and recording parameters as the ERG. The template was obtained at 20, 25 and 30 dB. The template at 30 dB was amplitude-matched with the ERG at that intensity by scaling its peak amplitude relative to match the peak artifact amplitude in the ERG obtained at 30 dB; this accounted for the difference in light exposure of the electrode speculum in the eye relative to that in saline. This scale factor was applied at all intensities. At flash intensities below 20 dB, the template at 30 dB was scaled down in proportion with the stimulus level before subtracting it from the ERG. After artifact reduction, signal drift was removed per epoch as described below for the eERG, and background noise was removed by averaging the epochs. Epochs with an overall amplitude >50 μV typically contained eye movement and/or blink artifacts and were excluded. Figure 1 shows a flow chart of the signal processing of the ERGs, and Fig. 2 shows sample ERGs obtained from one subject.
Fig. 1.
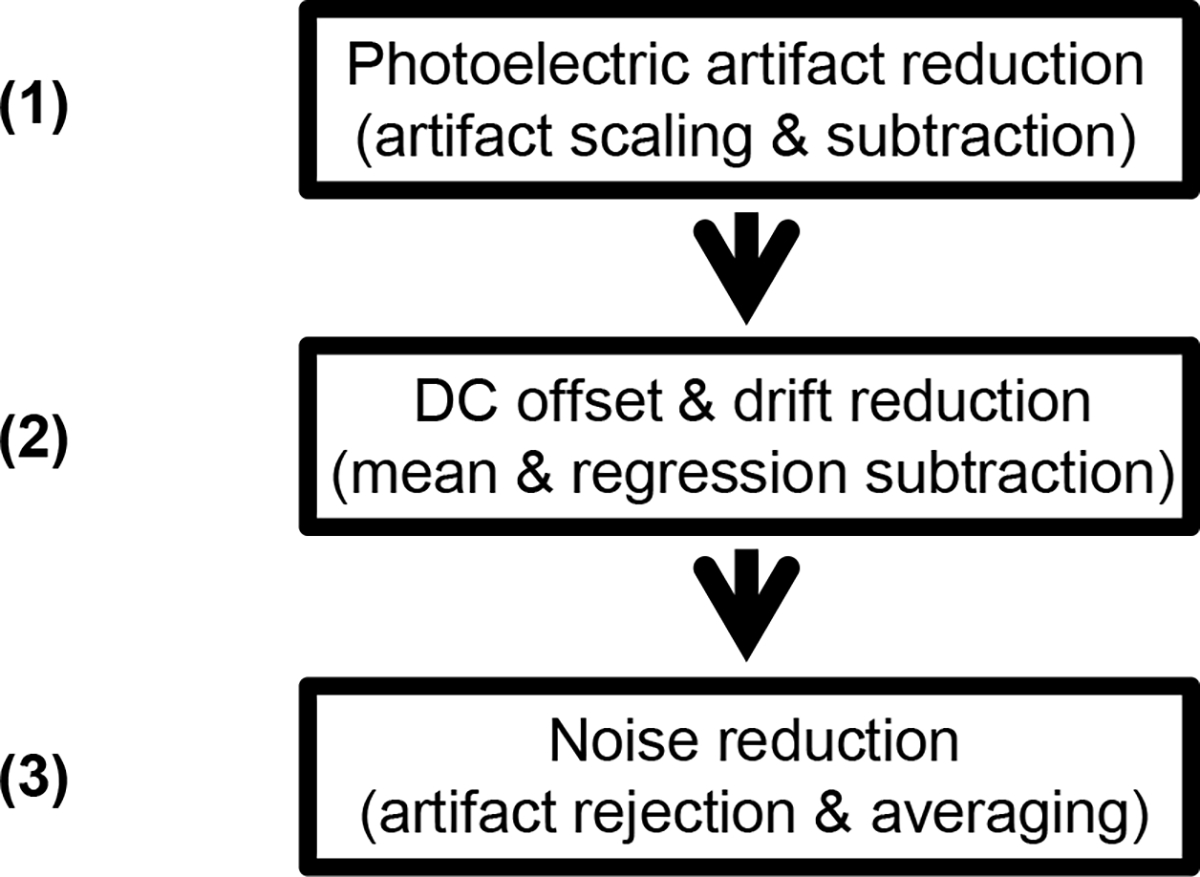
Flow chart of the signal processing steps of light-evoked ERGs to reduce the stimulus artifact and noise. The photoelectric stimulus artifact was prominent at 20 dB and higher, and was reduced by subtracting an amplitude-corrected template of the recorded artifact (1). Drift was removed by subtracting the linear regression line and baseline shifts were compensated for by subtracting the overall epoch average (2). The resultant epochs were averaged after removal of those sweeps with movement artifacts as identified by an overall amplitude >50 μV.
Fig. 2.
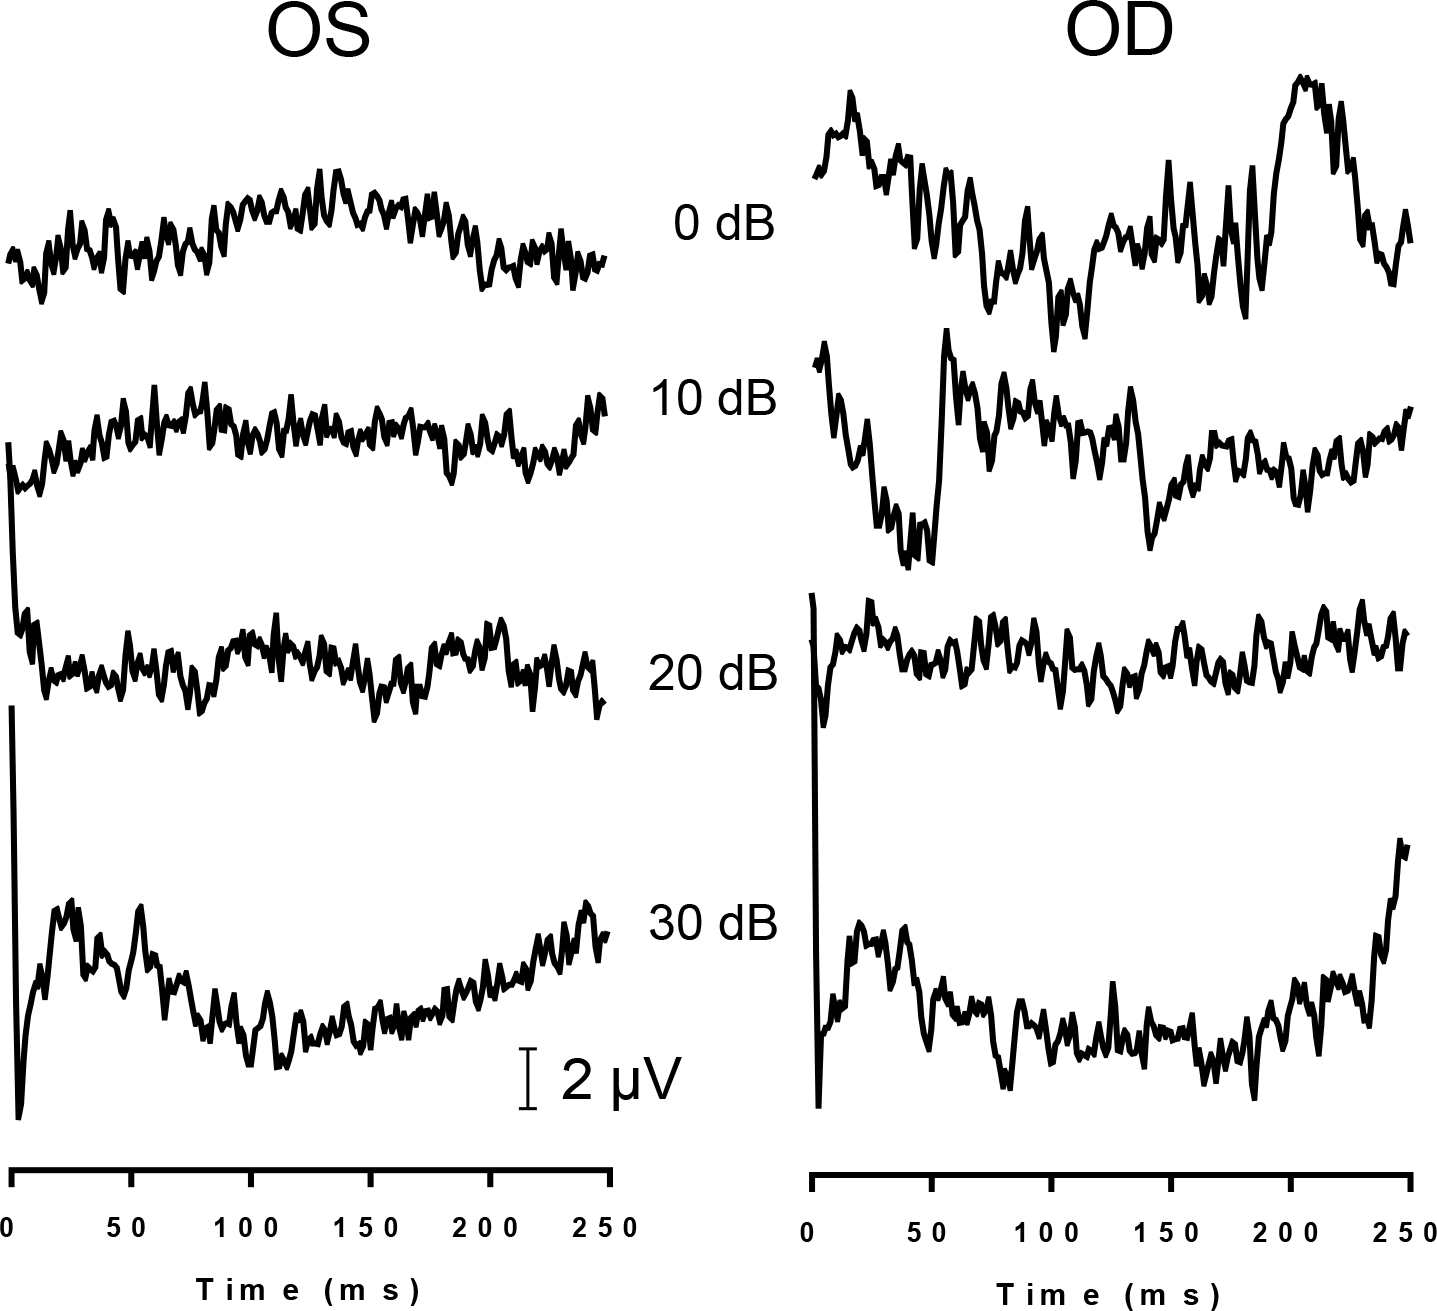
Sample recordings of light-evoked flash ERGs of S3 at various light intensities (re: 3 cd.s/m2) obtained from the left (OS) and right eye (OD).
Recording of electrically evoked ERGs
Electrically evoked electroretinogram (eERG) responses were measured using the Espion e2 system (Diagnosys LLC, Westford, MA, USA). We applied the maximum available sampling rate of 5 kHz with maximum bandwidth (0 – 1000 Hz filter setting). eERGs were registered from the cornea using Burian-Allen contact lens electrodes. We chose these electrodes because this type of electrodes yields relatively large ERG responses compared to other ERG electrodes [14]. More importantly, pilot experiments with monopolar DTL fiber electrodes resulted in substantially larger stimulus artifacts from the implant electronics when recording the eERG. In the experiments, eERG recordings were recorded from both eyes simultaneously. The ground was a gold cup electrode (Grass Technologies, West Warwick, RI) filled with conductive paste (Ten20; Weaver and Company, Aurora, CO) positioned on the forehead.
Electrical stimuli were evoked under direct computer control and the glasses-mounted camera of the Argus II visual prosthesis system was switched off. To maximize the electrically evoked retinal response, all available electrodes were stimulated in synchrony. The number of activated electrodes differed between subjects; S2 had 51, S3 had 55 and S5 had 56 electrodes available. The maximum safe current level was restricted by the implant electronics and depended on the number of available electrodes; S2’s current limit was 58 μA, S3’s and S5’s limit was 54 μA. Hence, the total injected current at maximal current level was 3.0 A in all subjects, and the total charge injected during the 0.46 ms stimulus phase was 1.38 mC. Throughout this paper, the current levels mentioned refer to per-electrode stimulus levels. Current levels were the same for each active electrode in the implant.
Electrical stimuli consisted of biphasic, rectangular current pulses 920 μs in duration (460 μs/phase), without an interphase gap. Stimuli were presented at a repetition rate of 0.5 Hz allowing for 2-second epochs to be recorded. A typical run consisted of 250 stimuli and lasted approximately 8 minutes. Current levels were varied from threshold to the maximum available current level. Stimulus threshold was defined as the lowest current level that elicited barely visible phosphenes that were stably present throughout the run (7 – 26 μA, dependent on the subject).
eERGs were typically tested using both stimulus polarities, i.e., anodic-first and cathodic-first stimuli. Opposite polarities were recorded in separate runs and averaged offline for artifact reduction (see Results section). The electrical stimulus artifact was used as an external trigger for the Espion system to initiate recording. Each trigger was followed by a recording sweep that included 5 epochs.
To minimize discomfort, proparacaine hydrochloride 0.5% numbing drops were administered. Typically, pupils were not dilated for recording. In a selected number of recordings we dilated the eyes, as described above, to assess signal differences without and with dilation.
Recording of the pupil diameter during implant stimulation
Pupil diameter was measured with a video camera and ViewPoint™ EyeTracker® software (Arrington Research Inc., Scottsdale, AZ). Pupil diameters were recorded in pixels and converted offline to metric units. The eye tracker and the system driving the Argus II retinal prosthesis were running on separate, unsynchronized computers. Supplying a trigger signal directly to the electronics of the Argus II retinal prosthesis system, or vice versa, was not possible due to FDA regulations prohibiting such modifications. Therefore, the initiation of implant stimulation and the start of pupil monitoring had to be synchronized manually. The experimenter starting the implant stimulation signaled a second experimenter to start the eye tracker. To correct for the delay in eye tracking, the pupil measurements were shifted offline by 200 ms, which approximates the motor response latency [15]. Note that this correction may not have been an accurate estimate of the latency introduced in the pupil record and hence absolute latencies of the pupil responses are not entirely accurate.
Data analysis
Raw eERG data were imported into a Matlab programming environment (Natick, Massachusetts, USA), after which artifact reduction methods were applied offline, as described in the Results section.
Statistical analyses were performed using Prism 5.04 (GraphPad Software, San Diego, CA, USA), including correlation analysis, linear regression and F-tests on the slope (H0: slope= 0, i.e. a horizontal line). The significance level criterion was always 0.05.
Results
Light-evoked ERGs
Light-evoked flash ERGs were obtained at light intensities from −5 to +30 dB in all three subjects. No visible identifiable waveform was obtained in any of the subjects. Figure 2 shows sample ERGs from S3 at four light intensities.
Electrically evoked ERGs
eERG signals were contaminated by a variety of artifacts, and several artifact and noise reduction steps were devised to reduce these artifacts, as shown in a flowchart in Fig. 3.
Fig. 3.
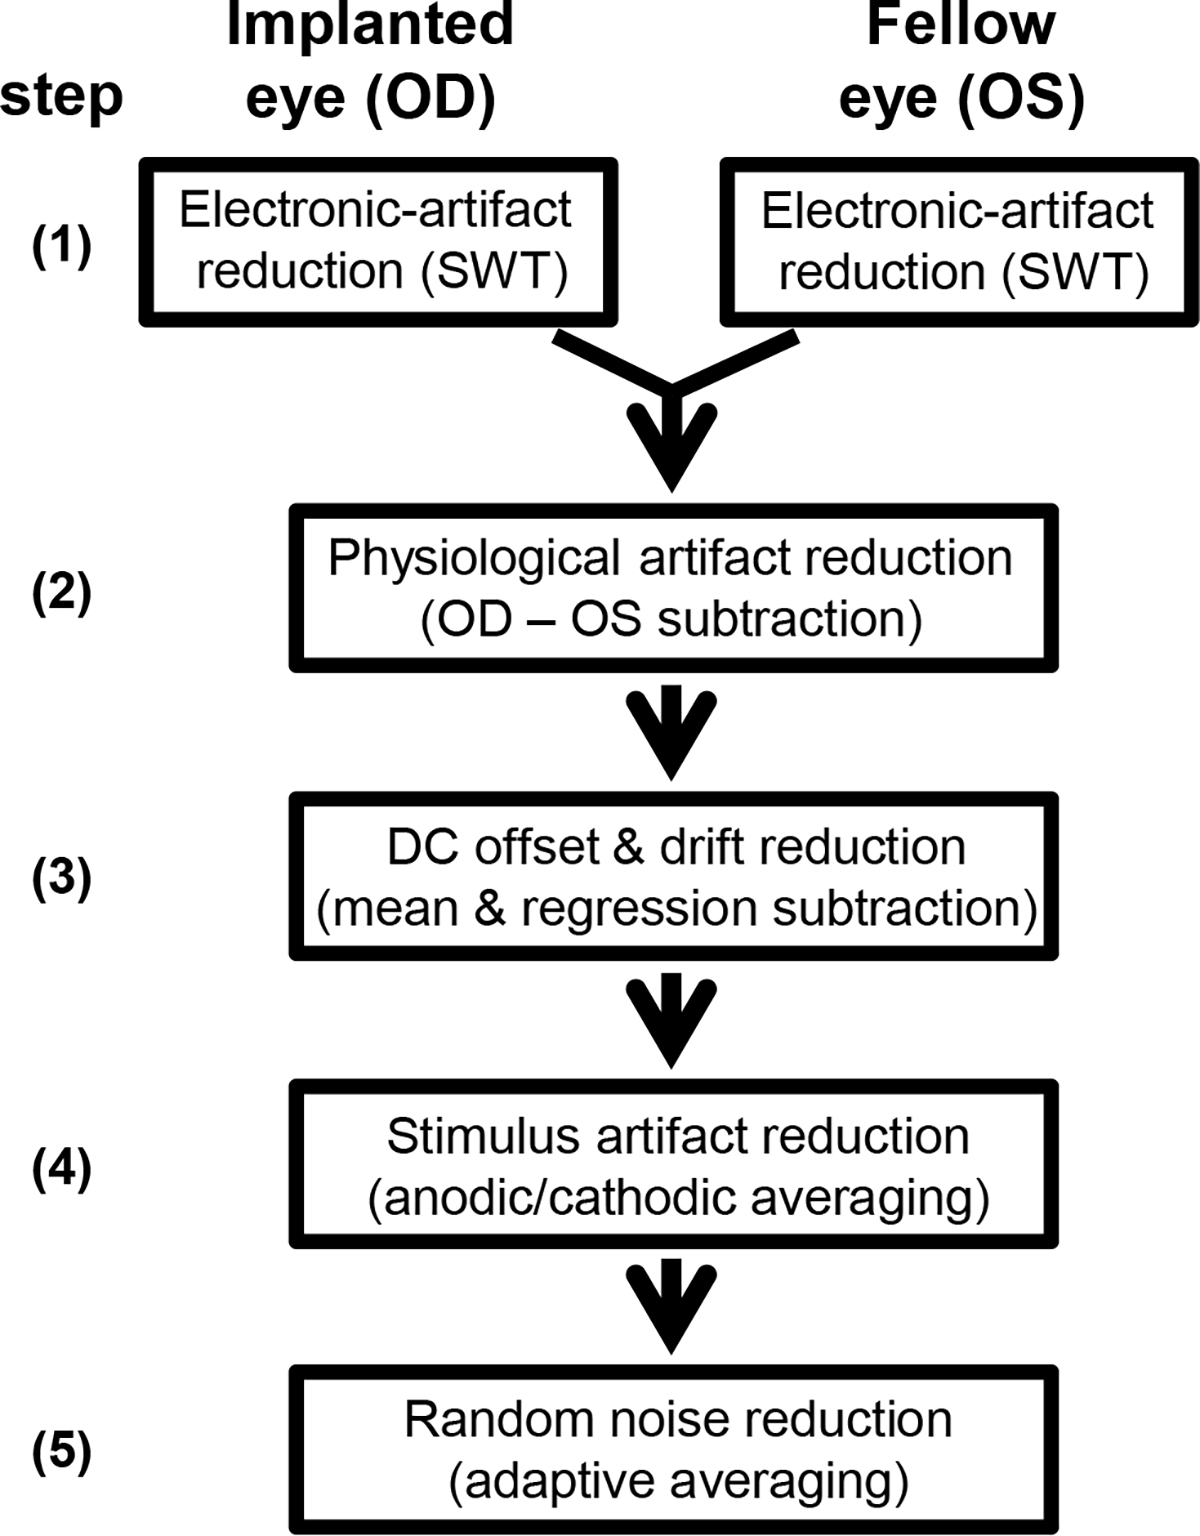
Flow chart of the signal processing steps of electrically evoked ERGs (eERGs) to reduce the stimulus artifact and noise. First, stationary wavelet transformation was applied to decrease the 120/s electronic artifact. OD and OS responses were then subtracted correcting for physiological artifacts. Resulting epochs were corrected for DC offset and drift using simple linear transformations. Stimulus artifacts were reduced by averaging of anodic-first and cathodic-first stimuli. Lastly, adaptive averaging was used to decrease signal noise by including low-noise epochs and reject those with large movement artifacts.
Step 1: Reducing the artifacts generated by the implant electronics
One of the most conspicuous artifacts in the raw eERG signal appeared as large spikes with amplitudes of up to 300 μV when recorded from the implanted eye. In the fellow eye amplitudes were substantially smaller. The artifacts occurred at a repetition rate of approximately 120·s−1 (Fig. 4A), and could be attributed to the refresh rate of the implant electronics. It was effectively eliminated in the eERG by a level 6 stationary wavelet transform (Fig. 4B), using the sym5 wavelet as described previously [9].
Fig. 4.
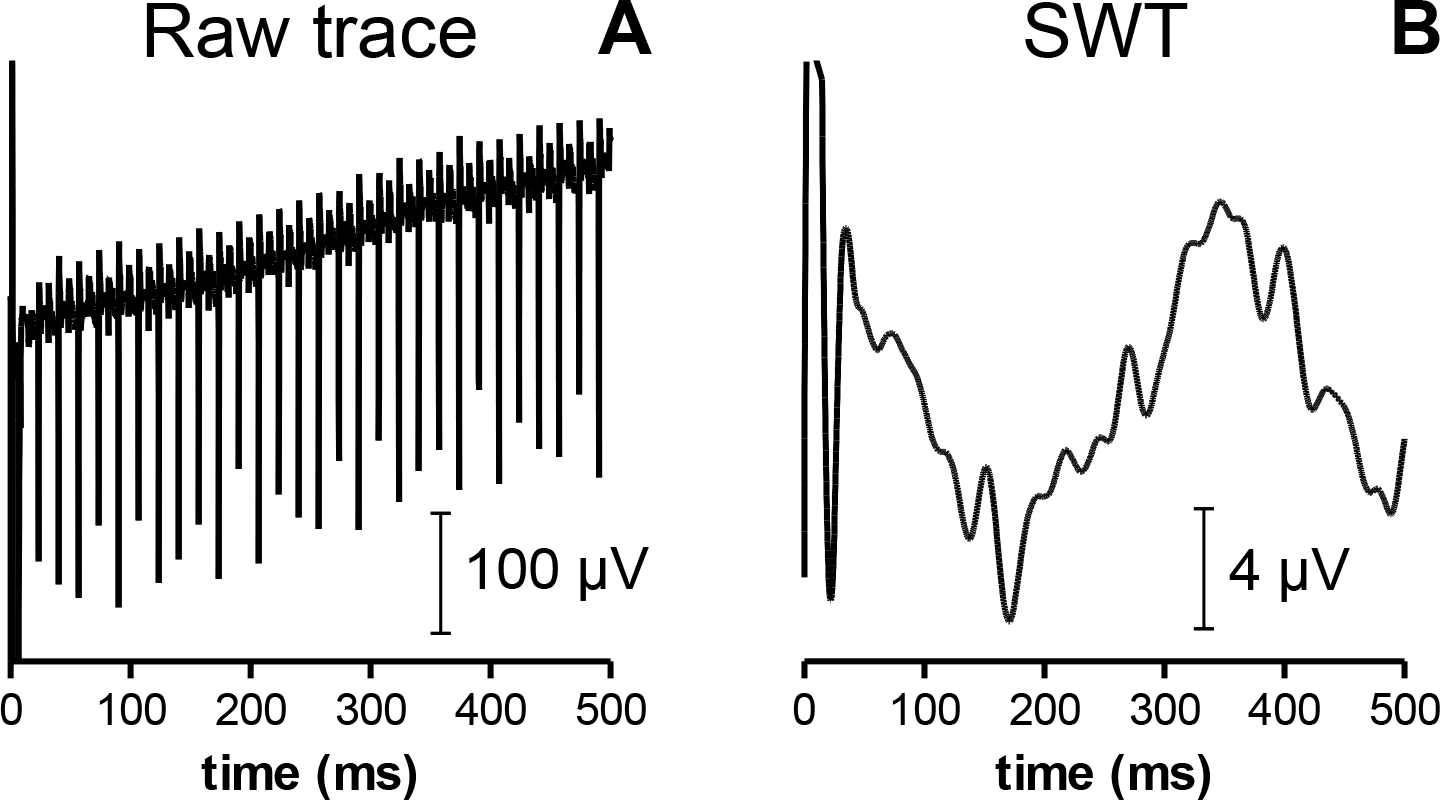
Single sample eERG epochs from S2 evoked by a cathodic-first 50 μA stimulus before (A) and after (B) stationary wavelet transform and drift removal. Wavelet transformation effectively eliminated the 120/s frame-switching artifact generated by the implant electronics. Note the different amplitude scaling and drift reduction due to the linear regression-based correction.
Step 2: Reducing physiological artifacts
Wavelet-transformed eERGs in the implanted eye were characterized by a large negative wave peaking at 500 – 1000 milliseconds after the stimulus. A similar wave of comparable amplitude was identified in the eERG of the fellow eye (Fig. 5A). The cornea of the fellow eye is at least 4 times as far from the signal source at the implant as the cornea of the implanted eye. For this reason, an implant-generated eERG should be measurable only from the cornea of the implanted eye, and should be very small in the fellow eye. This brought us to the realization that the wave recorded in the fellow eye was an artifact that might affect both eyes. Because these waves were of comparable shape and amplitude in both eyes, we reasoned they were most likely to be contaminations originating from a single artifact. One possible source of this observed bilateral waveform is the pupil response. Both pupils constrict in response to unilateral stimulation due to a coupling of the two retinas via a central reflex pathway. One obvious way of removing this bilateral artifact was to subtract the contralateral recording (OS) from that of the implanted eye (OD). Subtraction of the fellow eye response indeed removed much of the negative wave, as shown in Fig. 5B. Note that the eERG signal shown in Fig. 5B was obtained after subtracting the OS-recorded signal from the OD recording for each individual epoch. Hence, Fig. 5B is not the result of simple arithmetic subtraction of the averages shown in Fig. 5A, but was obtained through epoch-by-epoch subtraction instead. This procedure had the advantage that it reduced other bilateral artifacts (e.g., blink and eye movement) artifacts, and was therefore preferable to subtraction of averaged eERGs. Note that many epochs with binocular artifacts would otherwise have been removed during the adaptive averaging procedure, which only retained the less contaminated epochs; see below.
Fig. 5.
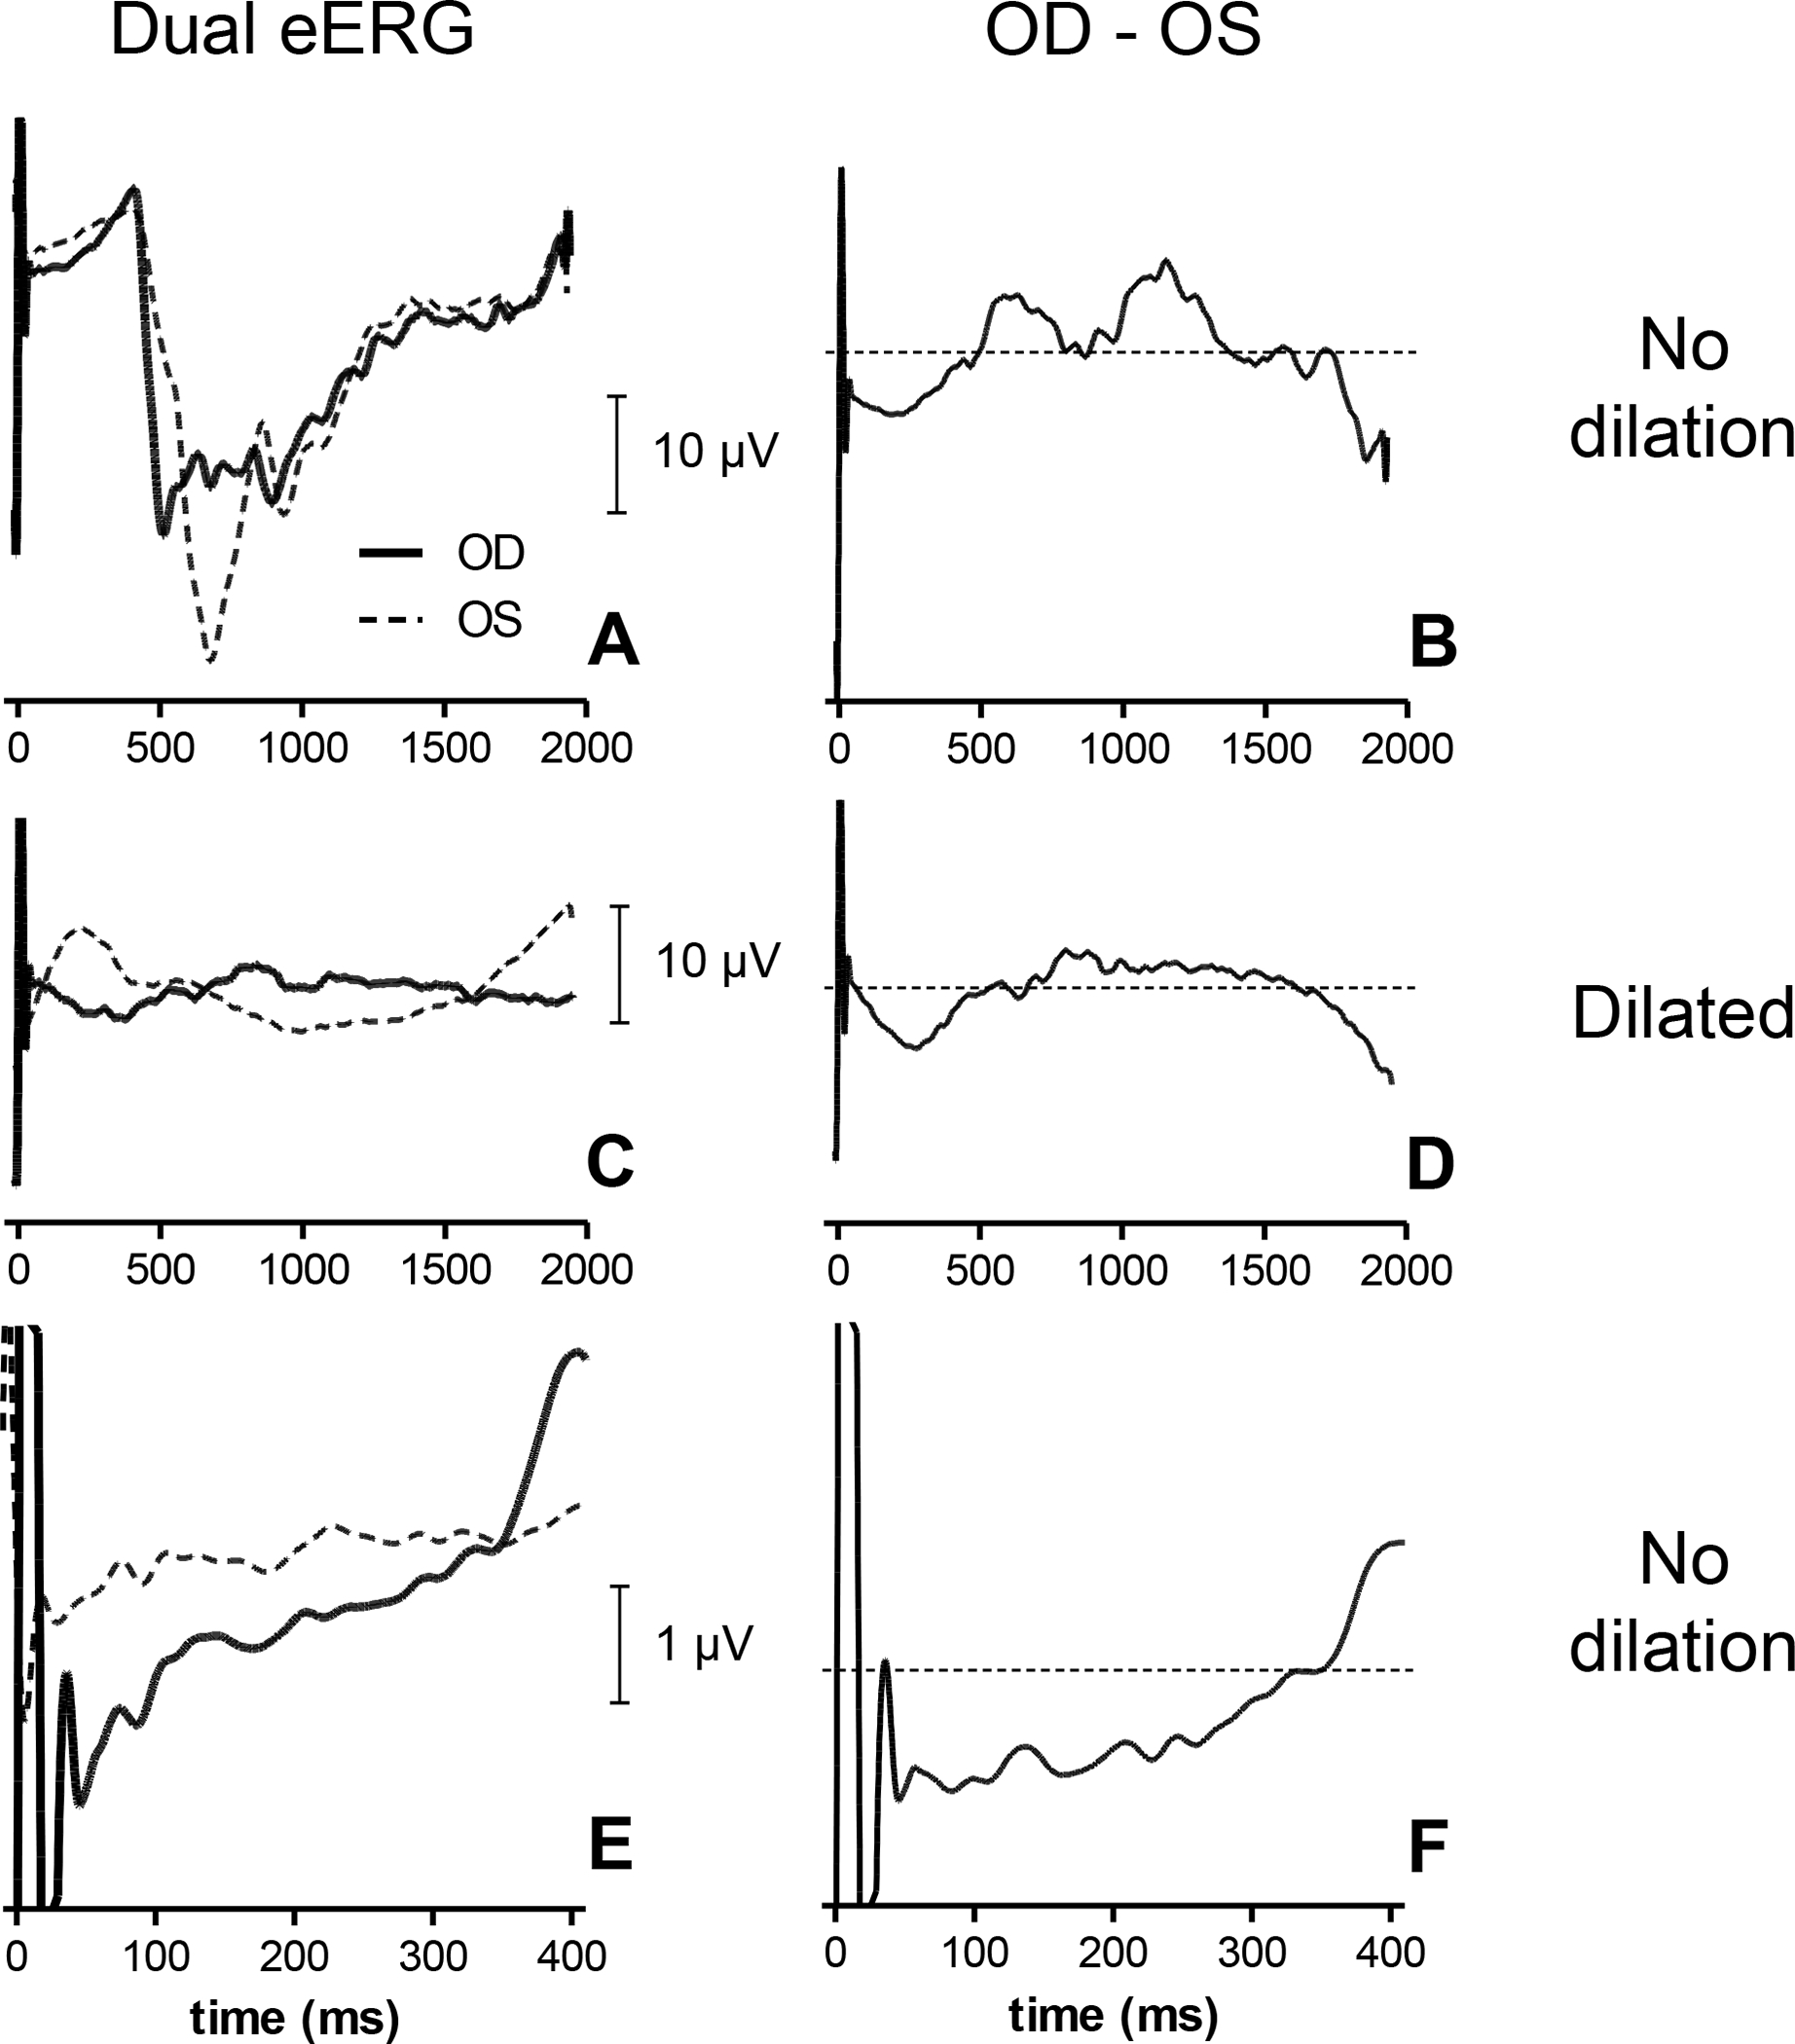
Dual eERG recordings obtained in S5 with cathodic-first stimuli at a stimulus level well above the subjective threshold (30 μA). eERGs were obtained before and after pupil dilation. Prior to dilation the eERG showed a large negative wave bilaterally (A) that could be reduced by subtracting the fellow eye OS from the stimulated eye OD (B). After dilation the fellow eye response was reduced, but not abolished (C). Subtraction of OS from OD (D) yielded a response similar to (B). Subtraction of OS from OD in the undilated condition (E) is shown in (F) on a smaller time scale. Data were obtained by adaptive averaging of approximately 10 runs (~2500 epochs).
Pharmacologic pupil dilation of both eyes abolished the pupil constriction response recorded with the Viewpoint software (results not shown) and substantially decreased, but did not fully abolish, the large negative wave in the response in both the stimulated eye and fellow eye (Fig. 5C). Subtraction of the remaining response in the fellow eye from that in the stimulated eye (Fig. 5D) resulted in a similar eERG response compared to the non-dilated condition (cf. Fig. 5B). We therefore chose to subtract the OS from the OD recording and omit pupil dilation in subsequent recordings.
In an earlier study we found that the eVEP developed within roughly 300 ms after the stimulus [9]. As the eERG represents an earlier visual response, it was expected to occur with a comparable or shorter latency. Therefore, we restricted our analysis to the first 400 ms of the eERG (Figs. 5E,F).
Step 3: Eliminating signal drift and DC offset
Over the course of 400 ms there could be considerable signal drift. Because recordings were performed in 10-second sweeps containing 5 epochs, any signal drift generated a DC offset in each of the individual epochs. DC offset was eliminated by subtracting the average of the (first 400 ms) of the signal from each data point in the epoch. Signal drift within an epoch (visible in Fig. 4A) was eliminated by performing a linear regression and subtracting the fitted line from the epoch (Fig. 3), which effectively eliminated the signal drift (cf. Fig. 4B). Both of these linear corrections eliminated low-frequency content and together effectively constituted a simple high-pass filter.
Step 4: Stimulus artifact reduction
The wavelet transformation (step 1) drastically reduced the stimulus artifact, but was not able to completely eliminate it. Especially in the first 50 ms a substantial artifact remained that reversed in polarity when the stimulus was reversed (Fig. 6). In addition, despite the linear drift removal over the whole epoch (step 3), the eERG evoked with cathodic-first stimuli showed a small residual positive drift immediately following the stimulus artifact, while anodic-first responses showed a drift in the opposite direction (Fig. 6). These stimulus artifacts were reduced by averaging the responses evoked by anodic-first and cathodic-first stimuli. Although this procedure removed much of the stimulus artifact, the first 50 ms of the eERG typically remained contaminated and was not used for further analysis. The anodic-first and cathodic-first epochs were recorded in separate eERG runs; they were combined epoch-by-epoch to account for possible time-dependent changes during a run, such as adaptation. However, any longer-term changes across runs and/or sessions could not be compensated using this approach.
Fig. 6.
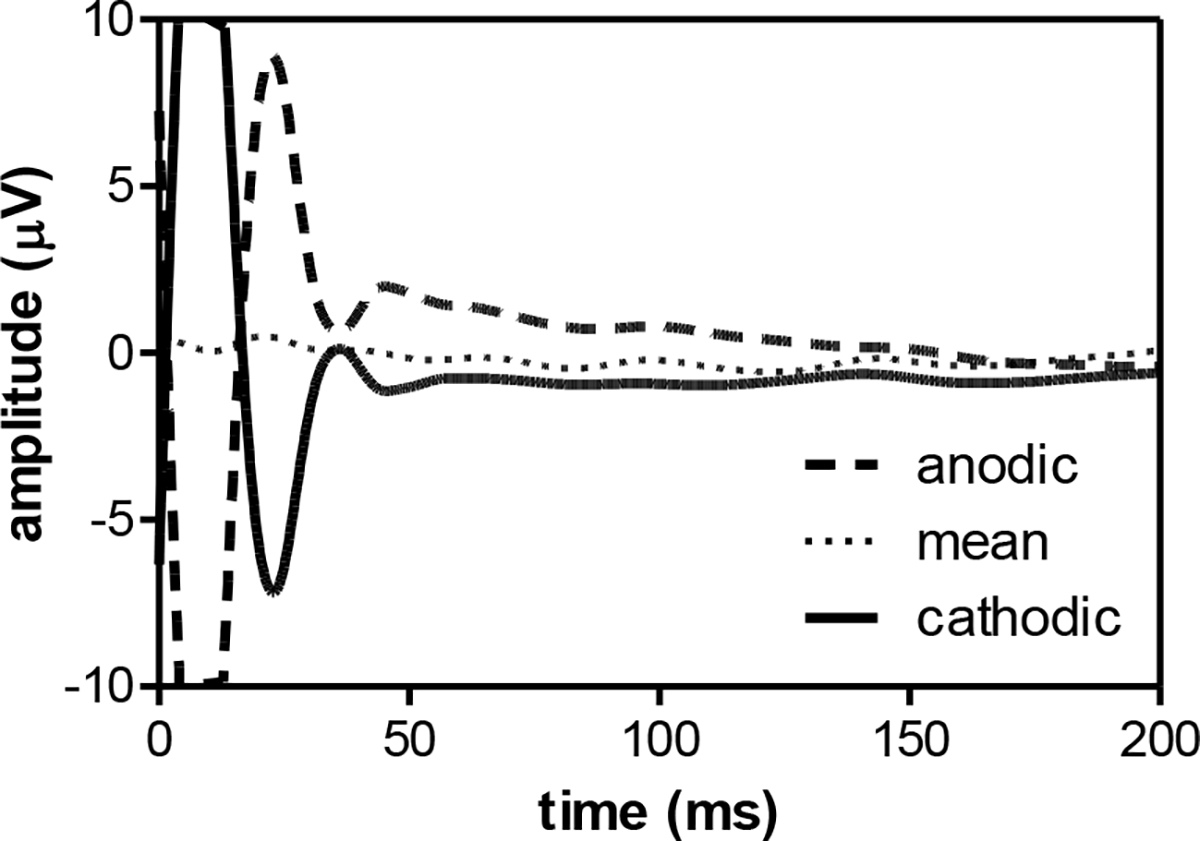
Average eERG traces at 30 μA in S5 of two runs using anodic-first (dashed line, 156 accepted epochs after adaptive averaging) and cathodic-first stimuli (176 epochs, solid line). After epoch-by-epoch averaging, stimulus artifact and signal drift were substantially reduced (158 epochs, dotted line). Traces shown were corrected for drift using linear regression, but averaging of both stimulus polarities was necessary for robust drift removal. In practice, drift removal was performed after polarity averaging. Note that the sample eERGs are scaled to visualize the stimulus artifacts (i.e., increased y-scaling, and only the first 200 ms of the eERG are shown).
Step 5: movement-artifact rejection and random noise reduction
The eERG signal processing procedure was concluded by adaptive averaging, which was described previously in more detail for eVEP recordings [9]. Typically, this procedure included half of the epochs, omitting those with the highest overall amplitudes. All epochs with a peak amplitude ≤50 μV were included as they were considered to be free of blink and movement artifacts. Epochs with a peak amplitudes >250 μV were excluded as they were deemed to be contaminated by such artifacts. Epochs with amplitudes >50 μV were used only if fewer than half of the total number of epochs were included. In this case epochs with amplitudes >50 μV were added, in increasing amplitude order until half of the total number of epochs was included. After this adaptive averaging, each eERG response contained at least 125 epochs, with each epoch being the average of a cathodic-first and anodic-first stimulus recording.
eERG waveform analysis
Sample waveforms for all three subjects at different stimulus levels are shown in Fig. 7. The eERG typically contained a single, negative peak. The amplitude of the principal peak was defined as the most negative value occurring after the stimulus artifact (>50 ms) relative to the baseline (0 μV). We could not use the pre-stimulus baseline as a reference point, because recordings were performed using 10-second sweeps containing 5 epochs each. As can be seen in Fig. 5A–D, the eERG trace did not fully return to baseline within 2 seconds, and hence no valid pre-stimulus baseline could be defined. Late components in the raw eERG response caused a substantial baseline shift that varied from trial to trial, and according to stimulus level. Using the pre-stimulus baseline as a reference level was therefore inappropriate, and the arithmetic average value of the epoch interval from 50 to 400 ms post-stimulus was used as reference instead. We chose not to use the positive peak(s) present at 500 – 1000 ms (visible in e.g. Figs. 5B and D) as a reference for eERG amplitude, because these peaks occurred relatively late in the eERG and their relevance to electrically evoked vision may be questionable. The use of the 0 μV-baseline, as defined by the average of the eERG trace from 50 ms to 400 ms, resulted in relatively small variations in eERGs amplitudes.
Fig. 7.
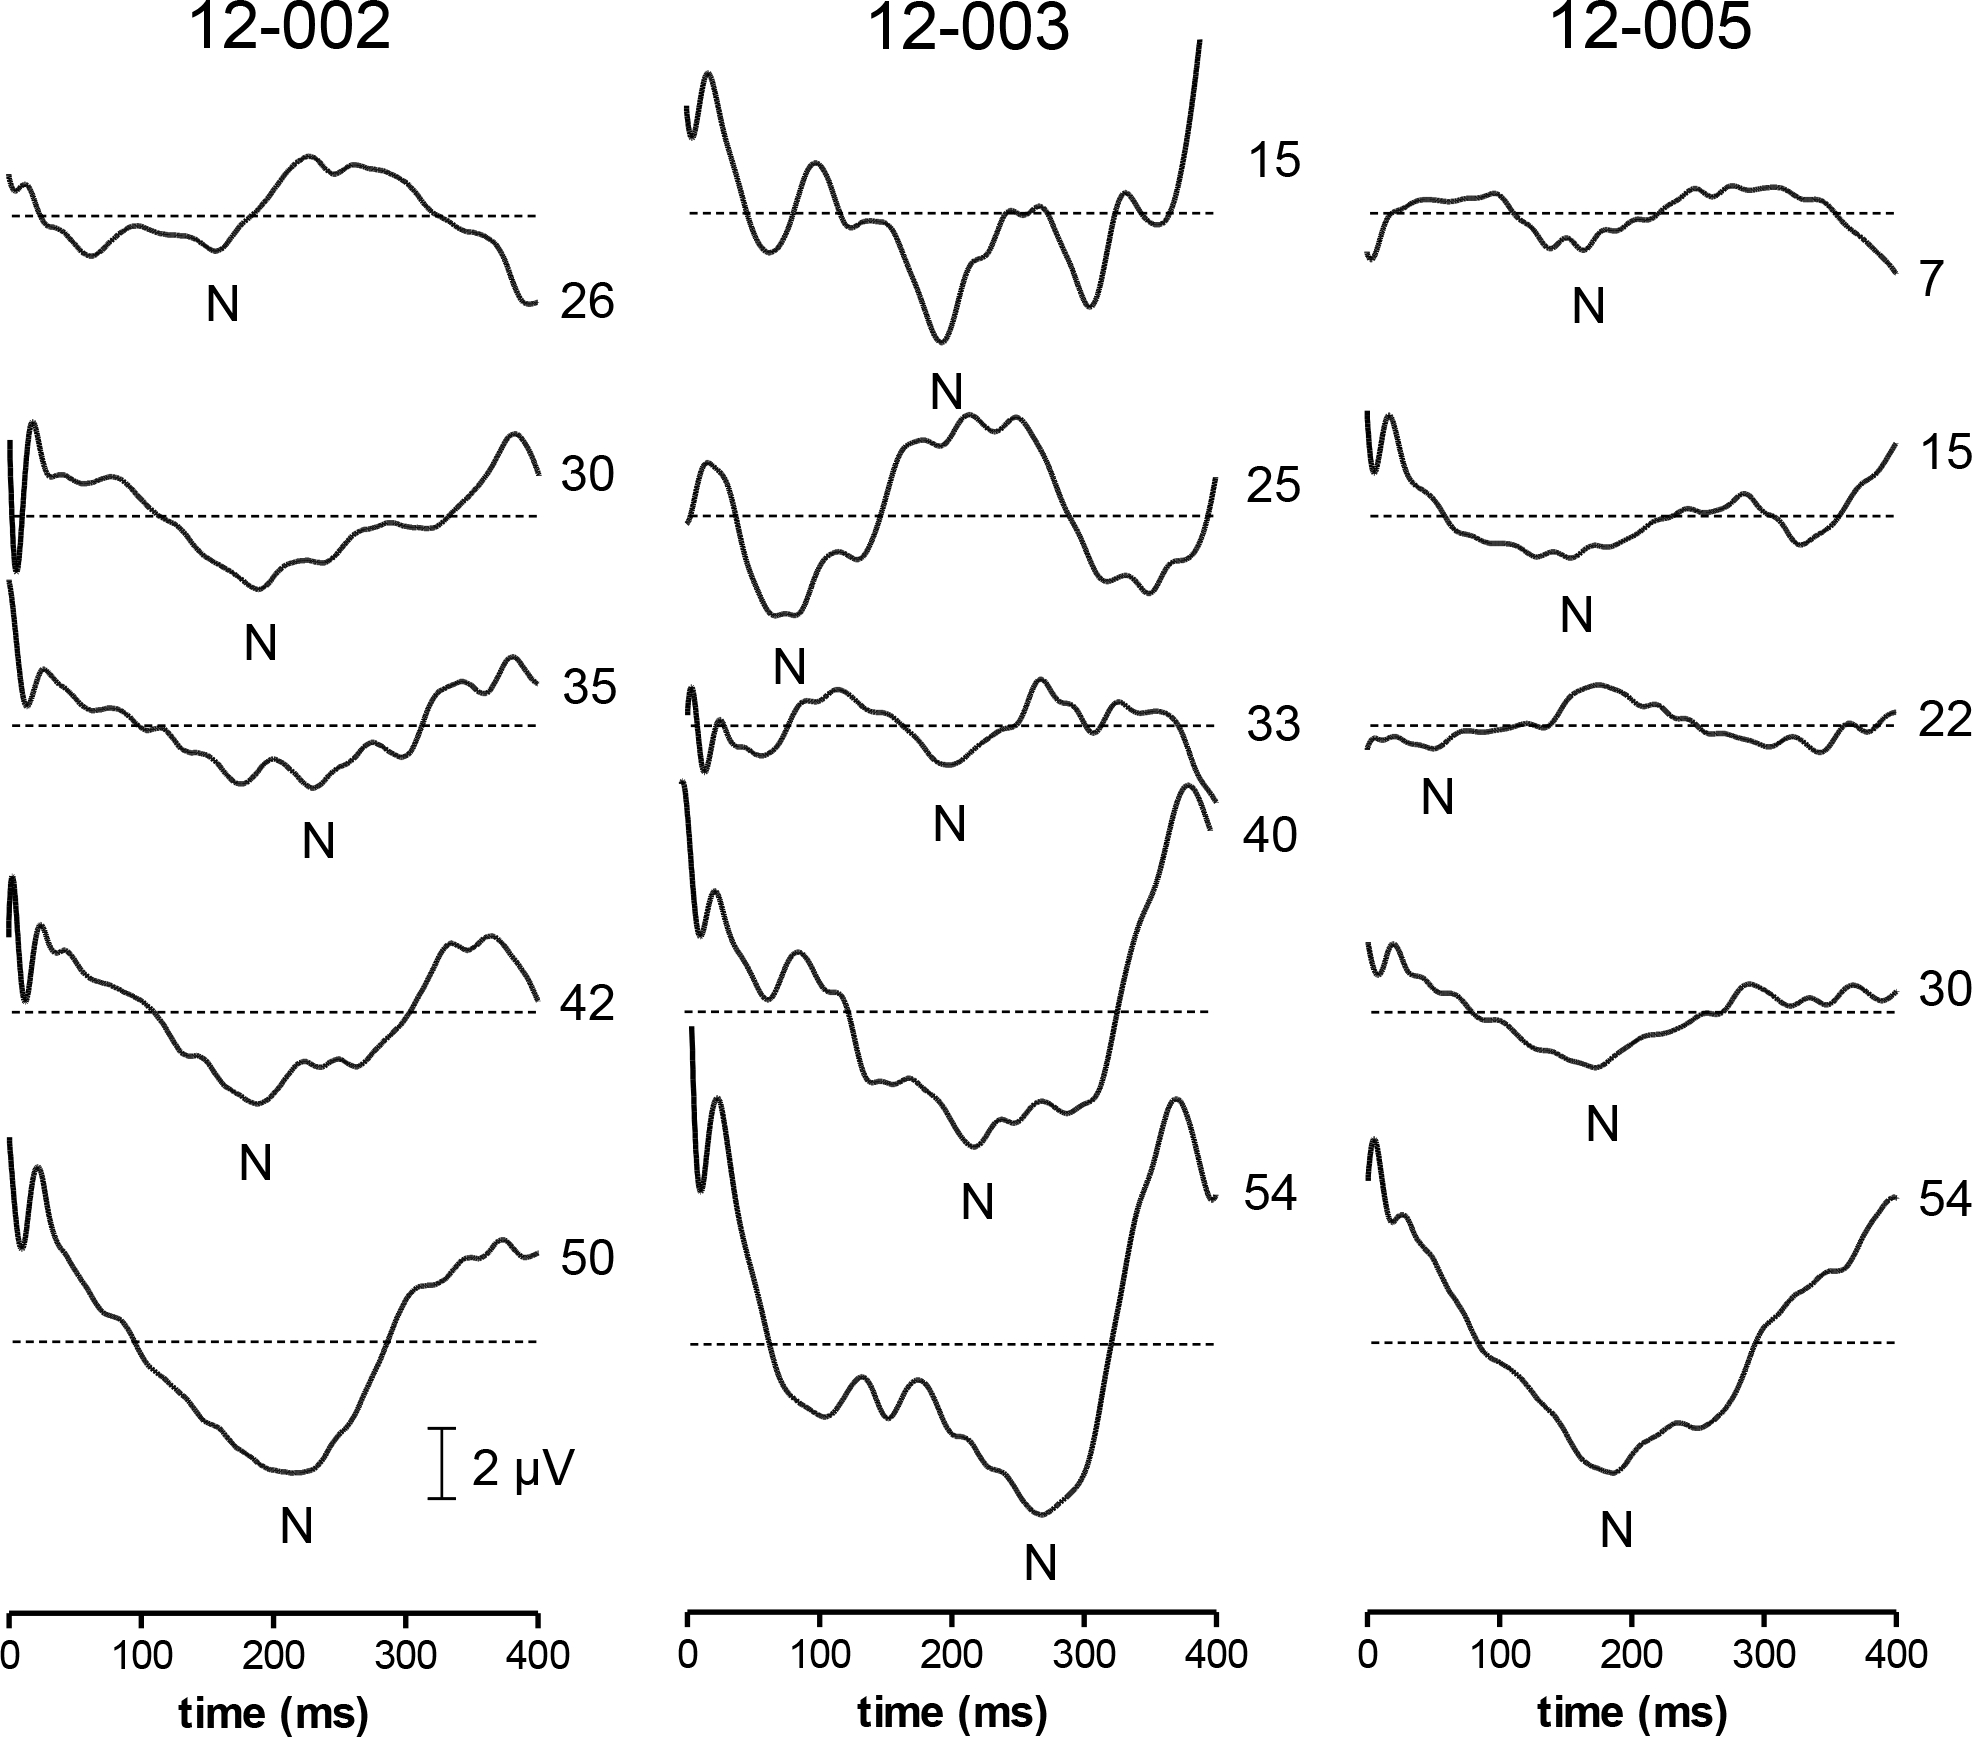
Sample eERG recordings in three subjects at different stimulus levels. The negative peak (N) was analyzed in terms of absolute amplitude relative to baseline (0 μV) and latency relative to stimulus onset (t= 0 ms). The lowest stimulus levels (26, 15, and 7 μA for S2, S3 and S5, respectively) approximate subjective thresholds. Note that residual stimulus artifacts were smallest in S5. Perhaps the eERG responses in S2 and S3 to stimuli of opposite polarity were more nonlinear, or affected more by time-dependent changes, such as adaptation or fatigue.
Peak amplitudes are plotted against stimulus level in Fig. 8. Linear regression analyses showed significant correlations between eERG amplitude and current level in all three subjects (S2: r2= 0.3, F(1,21)= 9, P<0.01; S3: r2= 0.3, F(1,13)= 5, P<0.05; S5: r2= 0.2, F(1,23)= 7, P<0.05). One data point in S3’s amplitude-stimulus level relation was removed (open circle in Fig. 8B). Omission was justified by the fact that this point represented the largest recorded amplitude at the lowest current level tested in this subject. Omitting it substantially increased the correlation coefficient from 0.08 to 0.3.
Fig. 8.
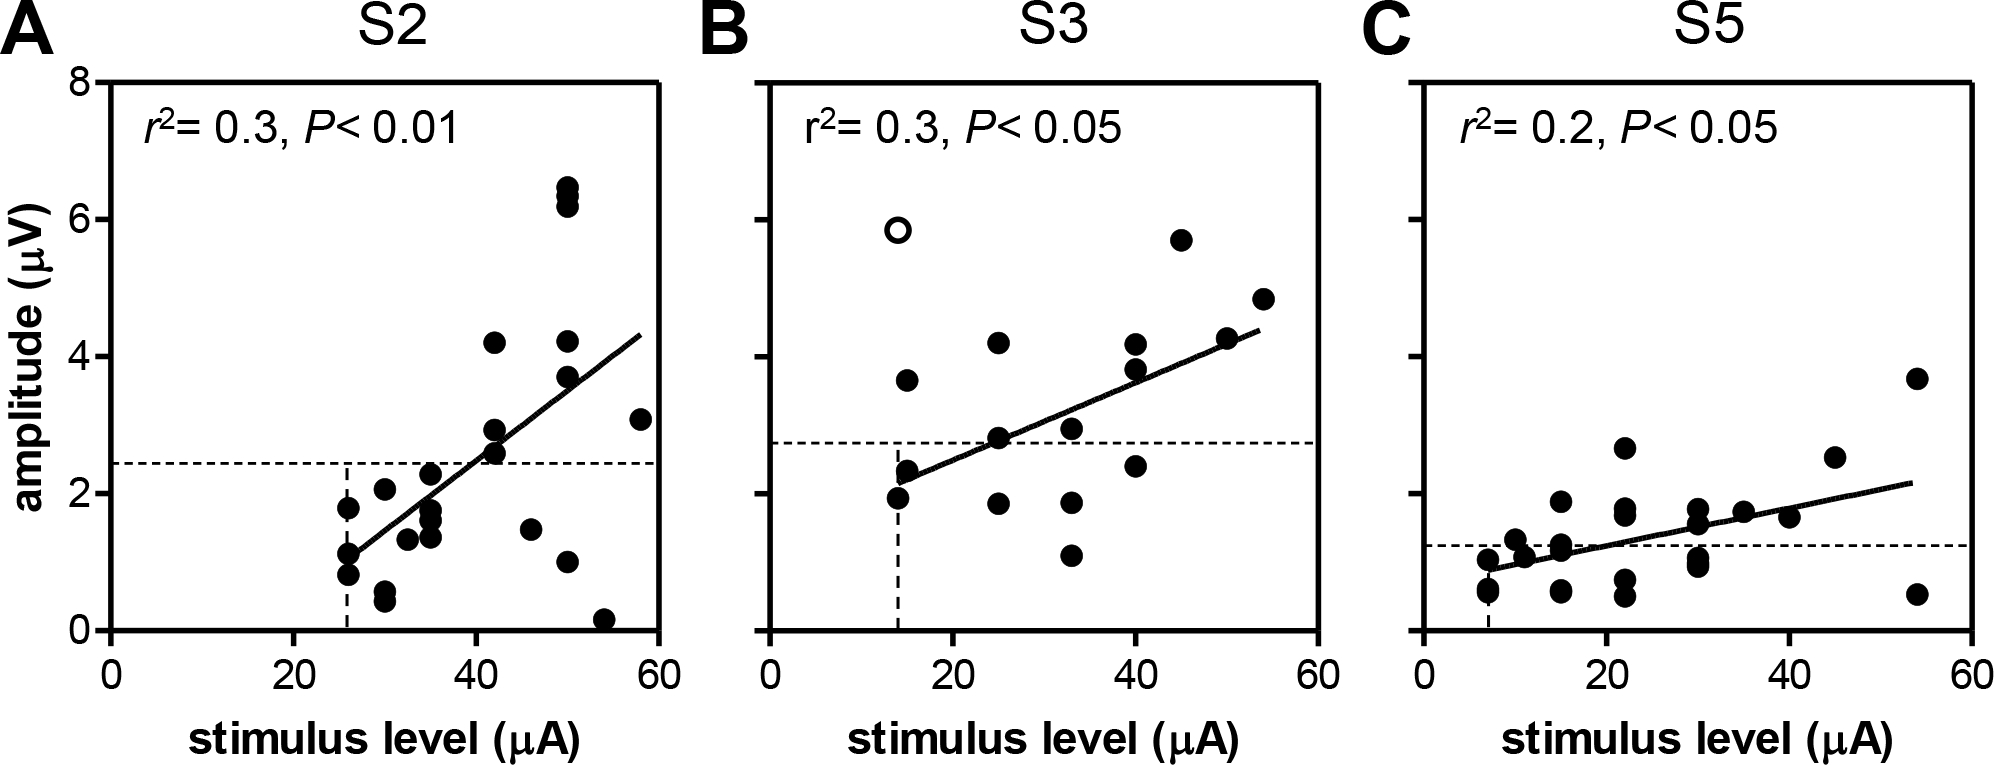
eERG amplitude as a function of stimulus level for S2 (A), S3 (B) and S5 (C). Insets show the correlation coefficients of the linear regression analysis and significance level of F-tests on the slope. One value was excluded from analysis in S3 (open circle). Vertical lines: subjective threshold; horizontal lines: objective threshold (2·SD).
To investigate whether the eERG data could be used to estimate the subjective threshold (vertical dotted lines in Fig. 8) we defined the objective threshold as two times the standard deviation (2·SD) of the eERG signal (horizontal dotted lines in Fig. 8). Under the assumption of a normal distribution, this criterion approximates a threshold response that has less than 5% chance of occurring randomly. eERGs with peak amplitudes below this threshold did not appear to contain any response signal, and were thus considered sub-threshold. The SD was determined for each subject individually by using the eERG waveform at the lowest stimulus level tested for that subject. The window used to determine the SD was from 50 – 400 ms to exclude the stimulus artifact. As can be seen in Fig. 8, subjective thresholds (S2: 26 μA; S3: 14 μA; S5: 7 μA) were substantially (1.5 to 3 times) lower than the interpolated objective threshold for all subjects (S2: 40 μA; S3: 24 μA; S5: 20 μA), so the objective eERG-based estimate is overly cautious.
The latency of the principal peak showed no significant relation with stimulus level in any of the three subjects (P> 0.05, Fig. 9). S2 showed the largest correlation coefficient (r2= 0.07) and latency tended to increase with stimulus level in this subject.
Fig. 9.
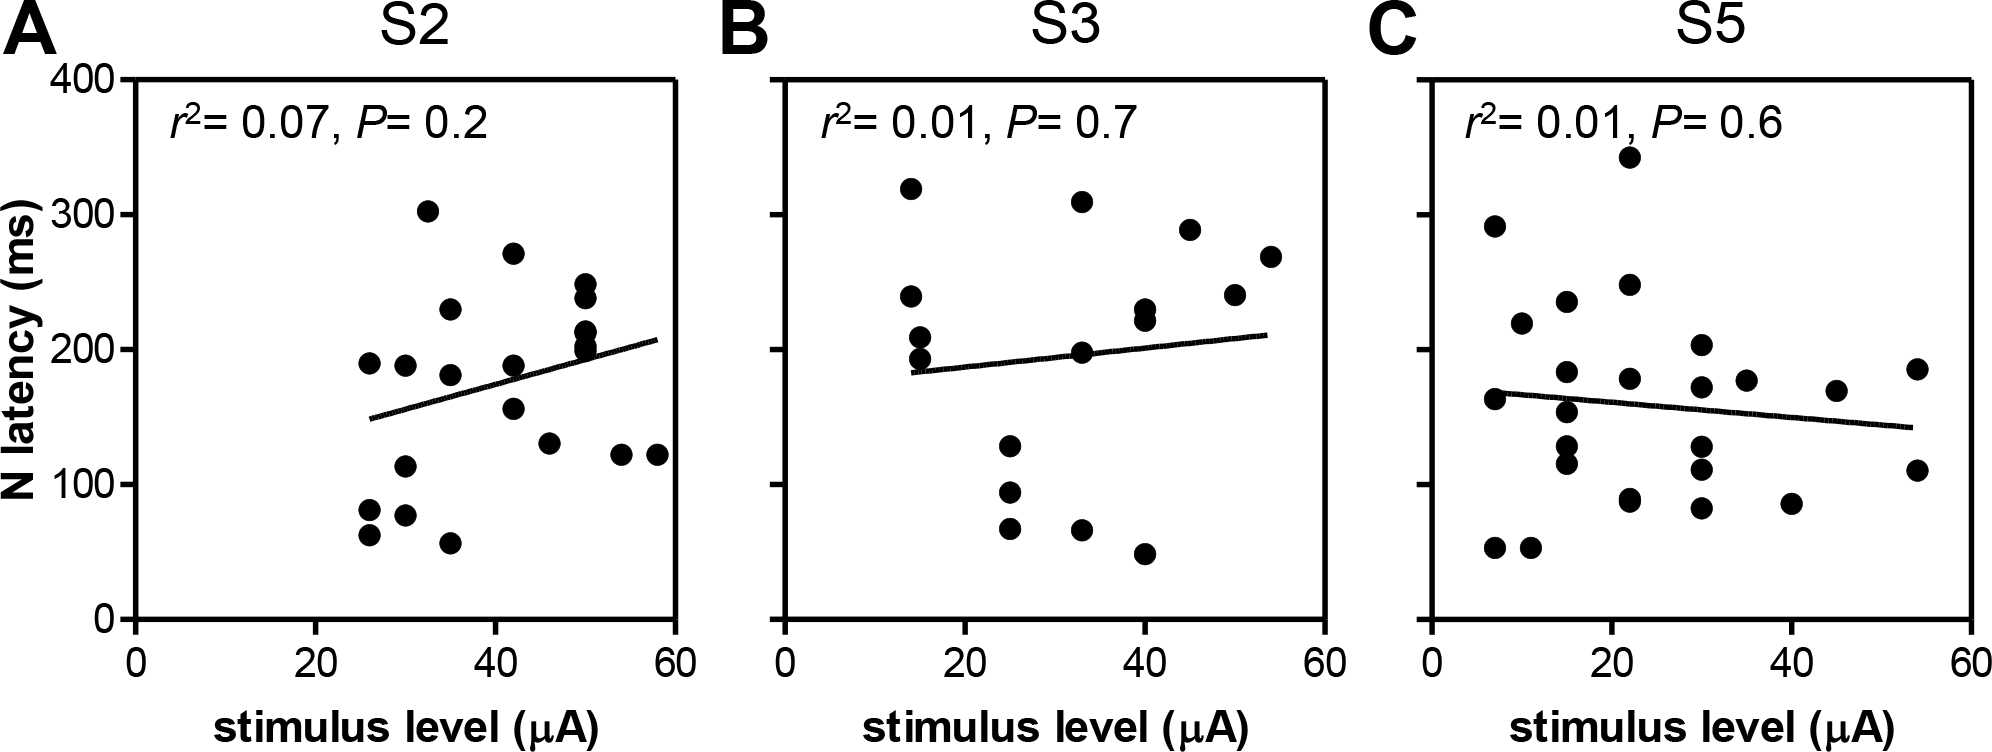
eERG latency as a function of stimulus level for S2 (A), S3 (B) and S5 (C). Insets show linear regression results. None of the subjects showed a statistically significant correlation between stimulus level and latency.
Pupillometry
We suspected that the contralateral eERG waveform was caused by neural mechanisms regulated centrally in the visual pathway. Specifically, the consensual pupillary response was a likely explanation for activity in the fellow eye [16]. Indeed, electrical stimulation in the right eye of one subject (S5) resulted in pupil constriction in the stimulated eye (OD, Fig. 10A), as well as in the fellow eye (OS, Fig. 10B). Linear regression analysis showed that both the direct (implanted eye: OD) and the consensual pupil constriction (fellow eye: OS) significantly increased with stimulus level (Fig. 10C, OD: r2= 0.95, F(1,3)= 52, P<0.01; OS: r2= 0.85, F(1,3)= 17, P<0.05).
Fig. 10.
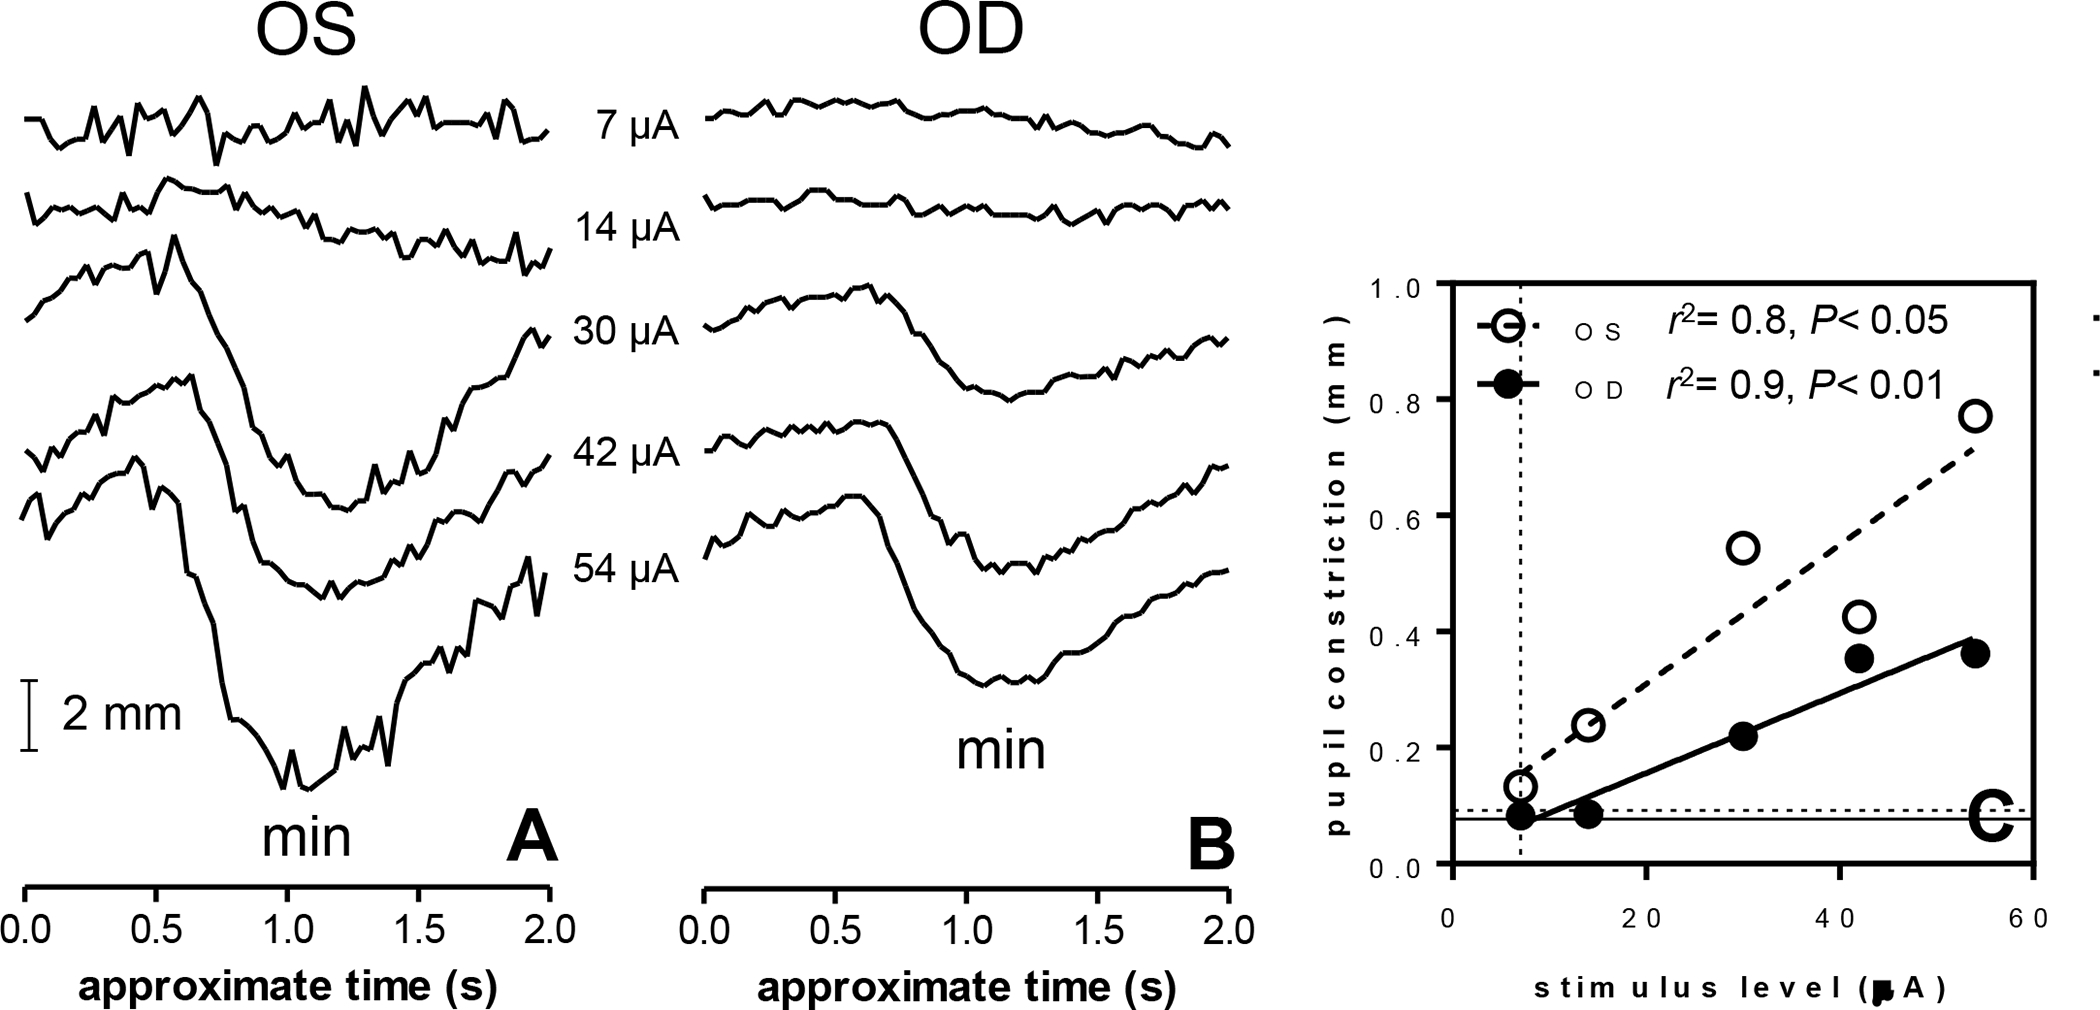
Pupil diameter measurements (mm) in subject S5 obtained from the fellow eye (A) and stimulated eye (B). Stimuli were cathodic-first pulses. Pupil diameters were quantified at approximately 1 second after stimulation, when constriction was maximal (C). Both eyes showed a significant relation between pupil constriction and stimulus level (F-test on the slope, P< 0.05). Pupil dilation abolished the pupil constriction response to electrical stimulation (not shown). Timing of the recordings is approximate because implant stimulation and recording were manually synchronized (see Materials and Methods). Vertical dotted line: subjective threshold; horizontal lines: objective thresholds (2·SD); solid line: OD, dashed line: OS.
To investigate whether the magnitude of pupil constriction could be used to estimate the subjective threshold in this subject (7 μA, dotted vertical line in Fig. 10C) we defined the objective threshold as 2·SD of the trace obtained at 7 μA (dotted horizontal lines in Fig. 10C), similar to the threshold definition applied for the eERGs. Interpolation of the objective threshold using the fitted regression line yielded 8.5 μA in the implanted eye and 1.8 μA in the fellow eye.
The slope of the constriction-stimulus level relation was nearly twice as steep in the fellow eye (0.012 mm/μA) as in the implanted eye (0.0069 mm/μA, F(1,8)= 7.5, P< 0.05). Statistically, however, the slopes were not different (F(1,6)= 2.8, P= 0.15). Any differences between the pupil responses of OD and OS may have been attributable to two factors: first, the pupil responses were recorded monocularly and therefore separate recording sessions were required for the two eyes and second, the implanted eye may have been adversely affected by the implant surgery. Pupillometry in the second subject (S2) was challenging, as this subject had difficulty keeping the eyes open for prolonged periods of time. S3 had nystagmus which made stable pupil recordings extremely difficult. Due to these reasons and time limitations no further pupillometry was performed in these two subjects.
Discussion
By using various artifact reduction techniques we were able to record electrically evoked ERGs from the cornea in three Argus II retinal implant wearers. The major component in the eERG was a negative peak with a latency of approximately 200 ms. eERG amplitudes showed a significant correlation with stimulus amplitude in all three subjects. Latencies were, however, not significantly correlated with stimulus level.
eERG waveforms
To this date, we are aware of one published study on eERGs, namely a study where the eERG was pharmacologically dissected in P23H rats [10]. Other attempts have been undertaken in Alpha-IMS retinal implant wearers (unpublished results, personal communications with Zrenner and Wilke). The published report describes eERGs in animals with moderately degenerated retinas (cell loss 30–40%) that had substantial residual light sensitivity. Interestingly, the eERG waveforms in that study were characterized by a predominantly negative waveform, similar to the polarity of the major component in our recordings. The rat eERG consisted of an early negative peak at 35 ms, followed by a small positive peak at 85 ms (that never reached positive values), and a second negative wave peaking at 135 ms and returning to baseline at approximately 400 ms. This second peak roughly corresponds to the latency of our eERG waveform peaking at approximately 200 ms, and was identified as being mediated by OFF ganglion cells [10]. The first negative peak in the rat eERG, if present in our recordings, would be obscured by the residual stimulus artifact. The study did not investigate the stimulus-level dependency of eERG amplitude and latency. Because eERG peak amplitude and latency are expected to differ between species, a direct comparison of the latencies and amplitudes is not necessarily appropriate. Therefore, it would be interesting to verify whether in the rat eERG amplitude also depends on stimulus level and eERG latency does not. This could help to verify if the rat model accurately reflects eERGs obtained in human with retinitis pigmentosa.
In terms of the normal light-evoked ERG our recordings would approximate those used in the flash ERG, since we used relatively short electrical pulses of 920 μs. Light-evoked photopic flash ERGs in normally sighted subjects have (b-wave) amplitudes in the order of 100 μV, and scotopic amplitudes can reach amplitudes of approximately 500 μV [14]. In contrast, eERG amplitudes in the present experiments did not exceed 10 μV. This difference may be readily explained by the fact that the Argus II electrode array covers approximately the central 16.5 mm2 of the retina [11], while a full-field flash activates the entire retina, which has an estimated surface area of over 1000 mm2 [17,18]. In addition, the retinas of our subjects were extensively degenerated due to end-stage retinitis pigmentosa (RP), which is associated with a reduction of neuronal cell counts [19], retinal remodeling [20] and reduced ERG amplitudes [21]. Taken together, the eERG in subjects with end-stage retinitis pigmentosa patients is expected to be very different from the light-evoked ERGs in sighted eyes.
The flash ERG in the healthy retina is characterized by a series of peaks (e.g., the a-wave and b-wave) with latencies shorter than the ~200 ms negative peak in the present eERG waves. The a- and b-waves represent early activity of the photoreceptors and secondary neurons [22]. A late component in the flash ERG is the scotopic threshold response (STR). The STR is a small negative wave peaking at approximately 185 ms that slowly returns to baseline after approximately 300 ms in humans. Its negative polarity and long latency resembles the eERG waveforms in this study. The STR, however, is predominantly observed when stimulus levels are close to threshold. Both its amplitude and latency decrease at higher stimulation levels [23–25]. In contrast, amplitudes of the eERG in this study tended to increase with stimulus level and we were not able to show a relationship between latency of the principal peak and stimulus level. Taken together, it seems unlikely that the two responses are related. It is possible, however, that the response has a similar origin to the STR, which is thought to reflect Müller cell depolarization [26] in response to K+ release by rod-driven proximal neurons, i.e., amacrine cells [27] and retinal ganglion cells [28]. Müller cells are present in relatively normal numbers in the degenerated retina of late-stage retinitis pigmentosa patients, and Müller cell function may still serve the same role of providing an electrochemical buffer to the extracellular milieu in the retina that is thought to be reflected by the STR.
Animal work has shown that stimulation of the retina with an epiretinal electrode can evoke action potentials in retinal ganglion cells within milliseconds [29]. These early responses, if present, could not be observed in our present data due to the stimulus artifact. However, in the rat eERG no responses with a latency <35 ms were observed [10].
Identified artifacts in the eERG
Most artifacts in our recordings could easily be separated from the putative retinal response. For instance, artifacts introduced by electrical switching, electrical stimulation, blinks and eye movements were anticipated and could be reduced by standard artifact removal techniques, such as stationary wavelet transformation, averaging of opposite polarities and artifact rejection, respectively (Fig. 3). However, the occurrence of a contralateral response was not expected. Contralateral light-evoked ERG responses have been reported in the rat, but this phenomenon has not been firmly established in humans [30,31]. Because of the prominent pupil constrictions in both stimulated and unstimulated eyes, a tentative source of the contralateral signal is the consensual pupil response. Because the common waveforms in both eyes persisted after pupil dilation, albeit with a different waveform, they could be due in part to neural activity, presumably produced by neurons innervating the ciliary muscle, as opposed to myogenic potentials generated by the ciliary muscle itself. The consensual pupil response is driven by a central pathway involving the Edinger-Westphal nuclei in the brainstem [32].
Whatever the source of the contralateral response, it must have been unrelated to prosthetic vision as it was evoked in the unimplanted eye. Because of the similar shape and amplitude of the response in both eyes, we reasoned that the ipsilateral eERG may also have been contaminated by this artifact and that subtraction of the contralateral from the ipsilateral recording was the most straightforward way to eliminate, or at least reduce it. Assuming that the functional eERG was present only in the stimulated eye, this step should result in a cleaner response in this eye.
Diagnostic relevance of eERGs
Like eCAPs [8], eERGs may be useful for intraoperative diagnostics to verify whether the retina is responsive to electrical stimulation and whether the implant is functional after implantation. eCAPs have also been used to objectively measure threshold levels for implant fitting purposes [7]. Although a complete objective fitting based on objective thresholds may not be feasible [33], threshold estimations based on the eERG may nonetheless find use for establishing preliminary stimulation settings. An objective baseline setting may reduce the time needed for psychophysical experiments which can be quite tiring on patients. This is especially important given that the numbers of electrodes that need fitting (60 electrodes in the Argus II) are much higher than for cochlear implants, which typically feature some 20 electrodes. However, due to the unfavorable signal-to-noise ratios in the corneal eERG our objective thresholds were substantially overestimated (Fig. 8) compared to the subjective ones. We have previously shown that eVEPs yielded more accurate threshold measurements [9] and cortical potentials may at this time be a more feasible alternative in this respect. However, eVEPs reflect activity in the primary visual cortex and thus do not provide information on retinal functionality alone. More direct measures of retinal function are required for diagnostic purposes.
Diagnostic relevance of electrically evoked pupil responses
Pupil constriction correlated significantly with stimulus amplitude in the implanted and the fellow eye in one subject (Fig. 10C), reminiscent of light-evoked pupil reflexes [34]. The objective threshold obtained from the implanted eye yielded an estimate (8.5 μA) close to the subjective threshold (approximately 7 μA), while the consensual response yielded a substantial underestimation (1.8 μA). The regression lines were constructed from 5 stimulus levels with just 10 averages each, and had favorable correlation coefficients of >0.8. We conclude that pupillography in the implanted eye may be a fast, reliable and non-invasive way of determining stimulation thresholds in those retinal implant wearers who are able to maintain a stable gaze and open eye lids.
The consensual pupil response has been previously used to estimate residual retinal ganglion cell function in patients with retinal degeneration [35]. Furthermore, pupillography has been shown to be useful in the diagnosis of age-related macular degeneration [36], glaucoma [37] and diabetic retinopathy [38]. More data in retinal implant wearers will need to be collected to establish whether electrically evoked pupillography is useful for assessing implant functionality in the degenerated retina. Moreover, pupil diameter recordings in two out of three subjects were complicated by nystagmus and difficulty in keeping the eyes open during the recordings. Nystagmus and loss of gaze control are common among blind people and may restrict the use of eye trackers for diagnostic purposes in retinal implant wearers. In addition, the pathways that regulate pupil constriction and visual perception are different, as the pupillary response is thought to be mediated via light-sensitive retinal ganglion cells [39]. Therefore, pupil responses may not accurately reflect implant functionality.
Limitations of the study
We have used wavelet transformation and anodic-first/cathodic-first pulse averaging for artifact reduction. However, these procedures did not remove the entire stimulus artifact and the remainder obscured the first 50 ms of the eERG. Further, averaging of opposite polarities may result in combining two different neural responses to electric stimuli, resulting in an estimate of the average response to cathodic-first and anodic-first stimulation. In cochlear implant studies, additional artifact-reduction techniques have been developed beyond averaging of responses to stimuli of opposite polarity. These methods include forward masking and template subtraction [40]. Similar to retinal implants, which restore vision by stimulating the surviving neurons in the degenerate retina, cochlear implants aim to restore hearing by circumventing the degenerated hair cells in the inner ear by directly stimulating the spiral ganglion cells of the auditory nerve. Forward masking makes use of the refractory period of the target neuronal population to subtract the stimulus artifact. However, due to the complex circuitry of the retina, and specifically due to extended slow waves of the eERG, forward masking techniques cannot be used. Template subtraction techniques rely on high-resolution recordings of the stimulus artifact at sub-threshold levels to subtract it at suprathreshold levels after proportional scaling to stimulus level. This method assumes linear behavior of the stimulus artifact that cannot be guaranteed a priori. We attempted to use the template-subtraction method, but subsequently abandoned this approach, because it substantially increased noise levels in the resultant eERG. Subtraction of a template mathematically sums the scaled-up background noise and artifacts to the eERG waveform. Averaging responses to opposite-polarity stimuli was therefore selected as a more practical way of reducing stimulus artifacts.
We used the Espion e2 system (Diagnosys LLC, Westford, MA, USA) for our recordings, which is widely used and has medical-device status, which is an essential requirement for studies in a clinical setting. However, it is designed for use with visual stimuli and its built-in amplifier may not be the most optimal for use in eERG recordings. For example, gated amplifiers such as those used in patch-clamp experiments are more robust to high stimulus voltages generated by stimulation electrodes [41].
Each data point in the input-output characteristic (Figs. 8 and 9) contained 500 epochs (250 anodic-first and 250 cathodic-first pulse stimulations) and took approximately 15 minutes to record. Despite extensive averaging, a considerable amount of noise remained in the eERG, which obscured the low-amplitude eERG. We believe it is necessary to increase signal amplitudes by recording the eERG intraocularly, similar to eCAPs which are registered intracochlearly via cochlear implant electrodes [42]. The close proximity of the recording electrode to the spiral ganglion cells in the cochlea yields relatively large responses [33], despite spiral ganglion cell death due to sensory deprivation. Hence, to increase eERG amplitude, improve signal-to-noise ratios, and reduce recording times we believe that recording capability from the electrodes in the array and a broadband reverse telemetry system are essential. This will allow eERGs to be recorded during stimulation of fewer, or even single, electrodes and should enable spatial resolution of the retinal response through mfERG techniques such as m-sequence stimulation. Additional benefits of this strategy may include reduced eye-movement artifacts and increased patient comfort as no corneal electrodes have to be applied.
Conclusion
We obtained eERG responses that resembled the N135 peak in the rat eERG and the STR in the light-evoked flash ERG. These responses may reflect OFF ganglion cell processing [10] or Müller cell activity secondary to ganglion cell and amacrine cell activity [26], but this cannot be ascertained without detailed recording from individual electrodes in the implant. The eERG amplitudes depended on stimulus level and hence eERGs could find use for objective device fitting procedures in the future, comparable to the use of eCAP recordings in cochlear implantees. According to previous work in rats with retinal degenerations, additional components with peak latencies of 35 and 85 ms are expected to be present in the eERG [10]. Further artifact-reduction techniques such as template subtraction [40],or (preferably) gated amplifiers should be used to decontaminate the recordings and examine the presence of early components in the human eERG.
Acknowledgments
The authors thank the subjects for their time and dedication. This study was supported by National Institutes of Health Grant R21EY019991.
Contributor Information
H. Christiaan Stronks, Department of Ophthalmology, Johns Hopkins University, Baltimore, Maryland; Computer Vision Research Group, NICTA, Canberra, Australia; Department of Neuroscience, the John Curtin School of Medical Research, Australian National University, Canberra, ACT, Australia.
Michael P. Barry, Department of Biomedical Engineering, Johns Hopkins University, Baltimore, Maryland
Gislin Dagnelie, Department of Ophthalmology, Johns Hopkins University, Baltimore, Maryland.
References
- 1.Ayton LN, Blamey PJ, Guymer RH, Luu CD, Nayagam DAX, Sinclair NC, Shivdasani MN, Yeoh J, McCombe MF, Briggs RJ, Opie NL, Villalobos J, Dimitrov PN, Varsamidis M, Petoe MA, McCarthy CD, Walker JG, Barnes N, Burkitt AN, Williams CE, Shepherd RK, Allen PJ (2014) First-in-human trial of a novel suprachoroidal retinal prosthesis. PLoS ONE 9 (12) [DOI] [PMC free article] [PubMed] [Google Scholar]
- 2.Humayun MS, Dorn JD, Da Cruz L, Dagnelie G, Sahel JA, Stanga PE, Cideciyan AV, Duncan JL, Eliott D, Filley E, Ho AC, Santos A, Safran AB, Arditi A, Del Priore LV, Greenberg RJ (2012) Interim results from the international trial of second sight’s visual prosthesis. Ophthalmology 119 (4):779–788 [DOI] [PMC free article] [PubMed] [Google Scholar]
- 3.Stingl K, Bartz-Schmidt KU, Besch D, Chee CK, Cottriall CL, Gekeler F, Groppe M, Jackson TL, MacLaren RE, Koitschev A, Kusnyerik A, Neffendorf J, Nemeth J, Naeem MAN, Peters T, Ramsden JD, Sachs H, Simpson A, Singh MS, Wilhelm B, Wong D, Zrenner E (2015) Subretinal Visual Implant Alpha IMS – Clinical trial interim report. Vision research 111, Part B:149–160 [DOI] [PubMed] [Google Scholar]
- 4.Humayun MS, Dorn JD, da Cruz L, Dagnelie G, Sahel JA, Stanga PE, Cideciyan AV, Duncan JL, Eliott D, Filley E, Ho AC, Santos A, Safran AB, Arditi A, Del Priore LV, Greenberg RJ (2012) Interim results from the international trial of Second Sight’s visual prosthesis. Ophthalmology 119 (4):779–788 [DOI] [PMC free article] [PubMed] [Google Scholar]
- 5.Stingl K, Bach M, Bartz-Schmidt KU, Braun A, Bruckmann A, Gekeler F, Greppmaier U, Hortdorfer G, Kusnyerik A, Peters T, Wilhelm B, Wilke R, Zrenner E (2013) Safety and efficacy of subretinal visual implants in humans: methodological aspects. Clinical and Experimental Optometry 96 (1):4–13 [DOI] [PubMed] [Google Scholar]
- 6.Zeng F-G (2004) Auditory prostheses: Past, present, and future. In: Zeng F-G, Popper AN, Fay RR (eds) Cochlear implants. Auditory prostheses and electric hearing. Springer-Verlag, New York, [Google Scholar]
- 7.Smoorenburg GF, Willeboer C, van Dijk JE (2002) Speech perception in nucleus CI24M cochlear implant users with processor settings based on electrically evoked compound action potential thresholds. Audiol Neurootol 7 (6):335–347 [DOI] [PubMed] [Google Scholar]
- 8.Van Wermeskerken GK, Van Olphen AF, Van Zanten GA (2006) A comparison of intra- versus post-operatively acquired electrically evoked compound action potentials. Int J Audiol 45 (10):589–594 [DOI] [PubMed] [Google Scholar]
- 9.Stronks HC, Barry MP, Dagnelie G (2013) Electrically elicited visual evoked potentials in argus II retinal implant wearers. Investigative Ophthalmology and Visual Science 54 (6):3891–3901 [DOI] [PMC free article] [PubMed] [Google Scholar]
- 10.Hetling JR (2007) Electrophysiology of natural and artificial vision. Artificial sight. Basic research, biomedical engineering, and clinical advances. Springer Science+Business Media, LLC., New York [Google Scholar]
- 11.Stronks HC, Dagnelie G (2014) The functional performance of the Argus II retinal prosthesis. Expert review of medical devices 11 (1):23–30 [DOI] [PMC free article] [PubMed] [Google Scholar]
- 12.Coupland SG (1991) Electrodes for clinical electrophysiological testing. In: Heckenlively JR, Arden GB (eds) Principles and practice of clinical electrophysiology of vision. Mosby-Year Book, Inc., St. Louis, MO, [Google Scholar]
- 13.Dagnelie G, Massof R (1993) Photovoltaic ‘responses’ in the ERG: a caveat when recording in the sub-microvolt range. Paper presented at the American Academy of Optometry Boston, MA, [Google Scholar]
- 14.Esakowitz L, Kriss A, Shawkat F (1993) A comparison of flash electroretinograms recorded from Burian Allen, JET, C-glide, gold foil, DTL and skin electrodes. Eye 7 (1):169–171 [DOI] [PubMed] [Google Scholar]
- 15.Gregg LW, Brogden WJ (1950) The relation between reaction time and the duration of the auditory stimulus. Journal of comparative and physiological psychology 43 (5):389–395 [DOI] [PubMed] [Google Scholar]
- 16.Wurtz RH, Kandel ER (2000) Central visual pathways. In: Kandel ER, Schwartz JH, Jessell TM (eds) Principles of neural science. McGraw-Hill, New York, pp 411–429 [Google Scholar]
- 17.Drasdo N, Fowler CW (1974) Non-linear projection of the retinal image in a wide-angle schematic eye. The British journal of ophthalmology 58 (8):709–714 [DOI] [PMC free article] [PubMed] [Google Scholar]
- 18.Kolb H (2005) Facts and Figures Concerning the Human Retina. In: Kolb H, Fernandez E, Nelson R (eds) Webvision: The Organization of the Retina and Visual System. University of Utah Health Sciences Center, Salt Lake City (UT), [PubMed] [Google Scholar]
- 19.Santos A, Humayun MS, De Juan E Jr, Greenburg RJ, Marsh MJ, Klock IB, Milam AH (1997) Preservation of the inner retina in retinitis pigmentosa:A morphometric analysis. Archives of ophthalmology 115 (4):511–515 [DOI] [PubMed] [Google Scholar]
- 20.Marc RE, Jones BW, Watt CB, Strettoi E (2003) Neural remodeling in retinal degeneration. Progress in Retinal Eye Research 22 (5):607–655 [DOI] [PubMed] [Google Scholar]
- 21.Cideciyan AV, Jacobson SG (1993) Negative electroretinograms in retinitis pigmentosa. Investigative Ophthalmology and Visual Science 34 (12):3253–3263 [PubMed] [Google Scholar]
- 22.Fishman GA (2001) The electroretinogram. In: Fishman GA, Birch DG, HG E, Brigell MG (eds) Electrophysiological testing in disorders of the retina, optic nerve, and visual pathway. 2nd edn. The Foundation of the American Academy of Ophthalmology, San Francisco, pp 1–155 [Google Scholar]
- 23.Finkelstein D, Gouras P, Hoff M (1968) Human electroretinogram near the absolute threshold of vision. Investigative Ophthalmology 7 (2):214–218 [PubMed] [Google Scholar]
- 24.Sieving PA, Nino C (1988) Scotopic threshold response (STR) of the human electroretinogram. Investigative Ophthalmology and Visual Science 29 (11):1608–1614 [PubMed] [Google Scholar]
- 25.Sieving PA (1991) Scotopic threshold response of the electroretinogram. In: Heckenlively JR, Arden GB (eds) Principles and practice of clinical electrophysiology of vision. Mosby Year Book, St. Louis, MO, pp 352–362 [Google Scholar]
- 26.Sieving PA, Frishman LJ, Steinberg RH (1986) Scotopic threshold response of proximal retina in cat. Journal of neurophysiology 56 (4):1049–1061 [DOI] [PubMed] [Google Scholar]
- 27.Frishman LJ, Steinberg RH (1989) Light-evoked increases in [K+]0 in proximal portion of the dark-adapted cat retina. Journal of neurophysiology 61 (6):1233–1243 [DOI] [PubMed] [Google Scholar]
- 28.Frishman LJ, Shen FF, Du L, Robson JG, Harwerth RS, Smith Iii EL, Carter-Dawson L, Crawford MLJ (1996) The scotopic electroretinogram of macaque after retinal ganglion cell loss from experimental glaucoma. Investigative Ophthalmology and Visual Science 37 (1):125–141 [PubMed] [Google Scholar]
- 29.Jensen RJ, Ziv OR, Rizzo JF (2005) Responses of rabbit retinal ganglion cells to electrical stimulation with an epiretinal electrode. Journal of neural engineering 2 (1):S16–S21 [DOI] [PubMed] [Google Scholar]
- 30.Passaglia CL, Tang X, Tzekov RT (2015) Experimental evidence for a “crossed ERG” in rat. Investigative Ophthalmology and Visual Science 56 (7):474–474 [Google Scholar]
- 31.Tang X, Tzekov RT, Passaglia CL (2015) Light-evoked properties of a “crossed ERG” in rat. Investigative Ophthalmology and Visual Science 56 (7):475–475 [Google Scholar]
- 32.Jabaley ME, Lerman M, Sanders HJ (1975) Ocular injuries in orbital fractures. A review of 119 cases. Plastic and Reconstructive Surgery 56 (4):410–418 [DOI] [PubMed] [Google Scholar]
- 33.McKay CM, Chandan K, Akhoun I, Siciliano C, Kluk K (2013) Can ECAP measures be used for totally objective programming of cochlear implants? Journal of the Association for Research in Otolaryngology 14 (6):879–890 [DOI] [PMC free article] [PubMed] [Google Scholar]
- 34.Ellis CJK (1981) The pupillary light reflex in normal subjects. British Journal of Ophthalmology 65 (11):754–759 [DOI] [PMC free article] [PubMed] [Google Scholar]
- 35.Morimoto T, Fukui T, Matsushita K, Okawa Y, Shimojyo H, Kusaka S, Tano Y, Fujikado T (2006) Evaluation of residual retinal function by pupillary constrictions and phosphenes using transcorneal electrical stimulation in patients with retinal degeneration. Graefe’s Archive for Clinical and Experimental Ophthalmology 244 (10):1283–1292 [DOI] [PubMed] [Google Scholar]
- 36.Rosli Y, Bedford SM, James AC, Maddess T (2012) Photopic and scotopic multifocal pupillographic responses in age-related macular degeneration. Vision research 69:42–48 [DOI] [PubMed] [Google Scholar]
- 37.Maddess T, Essex RW, Kolic M, Carle CF, James AC (2013) High- versus low-density multifocal pupillographic objective perimetry in glaucoma. Clinical and Experimental Ophthalmology 41 (2):140–147 [DOI] [PubMed] [Google Scholar]
- 38.Bell A, James AC, Kolic M, Essex RW, Maddess T (2010) Dichoptic multifocal pupillography reveals afferent visual field defects in early type 2 diabetes. Investigative Ophthalmology and Visual Science 51 (1):602–608 [DOI] [PubMed] [Google Scholar]
- 39.Panda S, Nayak SK, Campo B, Walker JR, Hogenesch JB, Jegla T (2005) Illumination of the melanopsin signaling pathway. Science (New York, NY) 307 (5709):600–604 [DOI] [PubMed] [Google Scholar]
- 40.Miller CA, Abbas PJ, Brown CJ (2000) An improved method of reducing stimulus artifact in the electrically evoked whole-nerve potential. Ear and Hearing 21 (4):280–290 [DOI] [PubMed] [Google Scholar]
- 41.Millard RE, McAnally KI, Clark GM (1992) A gated differential amplifier for recording physiological responses to electrical stimulation. Journal of Neuroscience Methods 44 (1):81–84 [DOI] [PubMed] [Google Scholar]
- 42.Brown CJ, Abbas PJ, Gantz BJ (1998) Preliminary experience with neural response telemetry in nucleus CI24M cochlear implant. American Journal of Otology 19 (3):320–327 [PubMed] [Google Scholar]


