

Summary
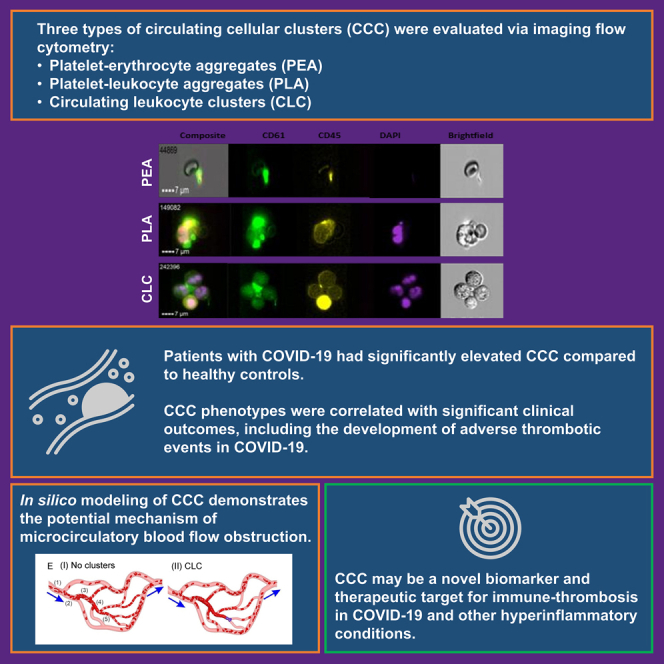
We sought to study the role of circulating cellular clusters (CCC) –such as circulating leukocyte clusters (CLCs), platelet-leukocyte aggregates (PLA), and platelet-erythrocyte aggregates (PEA)– in the immunothrombotic state induced by COVID-19. Forty-six blood samples from 37 COVID-19 patients and 12 samples from healthy controls were analyzed with imaging flow cytometry. Patients with COVID-19 had significantly higher levels of PEAs (p value<0.001) and PLAs (p value = 0.015) compared to healthy controls. Among COVID-19 patients, CLCs were correlated with thrombotic complications (p value = 0.016), vasopressor need (p value = 0.033), acute kidney injury (p value = 0.027), and pneumonia (p value = 0.036), whereas PEAs were associated with positive bacterial cultures (p value = 0.033). In predictive in silico simulations, CLCs were more likely to result in microcirculatory obstruction at low flow velocities (≤1 mm/s) and at higher branching angles. Further studies on the cellular component of hyperinflammatory prothrombotic states may lead to the identification of novel biomarkers and drug targets for inflammation-related thrombosis.
Subject areas: Cell biology, Health sciences, Immunology, Microbiology
Graphical abstract
Highlights
-
•
Circulating cellular clusters (CCC) are elevated in COVID-19
-
•
Circulating leukocyte clusters (CLC) are associated with thrombotic complications
-
•
In silico simulations suggest mechanistic explanations for CLC-related thrombosis
-
•
CCC may be a potential biomarker and therapeutic target for immunothrombosis
Cell biology; Health sciences; Immunology; Microbiology
Introduction
Immunothrombosis defines the prothrombotic tendency associated with hyperinflammatory disease states such as acute respiratory distress syndrome (ARDS) or severe trauma.1,2,3,4 Immunothrombosis is proposed to be a functional component of the innate immune system that helps detect, contain and combat pathogens.1,5 However, when uncontrolled, immunothrombotic processes can result in maladaptive responses and cause significant harm to the host. Immunothrombotic pathways involve an intricate network between immune effector cells, cytokines, coagulation factors, complement proteins, platelets, and endothelial cells.6,7,8 Immunothrombotic pathways also provide an exciting avenue for the selective prevention of thrombotic complications in hyperinflammatory states. Current antithrombotic therapies target pathological thrombosis at the cost of impairing the physiological hemostatic system, such as the direct or indirect inhibition of coagulation factors. Identification of novel immunothrombotic cellular therapeutic targets could result in the development of therapies that mitigate inflammation-related thrombosis while preserving physiological hemostasis.
Coronavirus Disease 2019 (COVID-19), the clinical syndrome associated with SARS-CoV-2 infection, is associated with systemic hyperinflammation, cytokine storm, and an increased risk of thrombotic complications.9 The immunothrombotic state induced by COVID-19 plays a key role in its pathogenesis and current evidence suggests that it is more severe compared to other viral causes of pneumonia such as the influenza virus H1N1.6,10,11 The recognized prothrombotic state associated with COVID-19 disease has prompted the investigation of mechanisms underlying COVID-19-related coagulopathy for the assessment of thrombotic risk, early detection of thrombotic complications, and the development of therapeutic protocols to prevent and treat thrombosis.12,13,14,15 Endothelial dysfunction, changes in the procoagulant and antifibrinolytic plasma protein phenotype, platelet hyperactivity, and neutrophil extracellular traps (NETs) have all been suggested as potential mechanisms mediating COVID-19-related thrombosis.7,16,17,18,19,20,21,22,23,24,25 In reality, it is likely a combination of multiple factors that contribute to the development of a prothrombotic state during COVID-19, and the exact contributors depend on the disease state of the patient. Although platelet-leukocyte aggregates (PLAs) have been studied in the context of COVID-19, various phenotypes of immunothrombotic circulating cellular clusters (CCCs) such as platelet-erythrocyte aggregates (PEAs) and circulating leukocyte clusters (CLCs) have not yet been described or evaluated.20,21,22,23
Computational fluid simulations incorporate the key factors involved in thrombogenesis such as hemodynamics, transport of coagulation factors and coagulation kinetics, blood cell mechanics, and adhesive dynamics, and offer an opportunity to study the behavior of CCCs in the microcirculation. The mechanistic insight provided by computational models is a step forward toward a deeper understanding of thrombotic complications in the presence of CCCs, identification of organ systems and patient phenotypes at increased risk, and ultimately the development of therapeutics that would target said thrombotic pathways.26 In this study, we evaluated and quantified various CCC phenotypes, including PEAs, CLCs, and PLAs, in patients with COVID-19 via imaging flow cytometry, and assessed the association between cluster levels and thrombotic complications along with other clinical outcomes in COVID-19.
Results
Fifty-eight samples were included in the analysis: a total of 46 samples from 37 COVID-19 patients, and 12 samples from healthy controls. Serial samples (x2) were taken from 9 COVID-19 patients during admission. Patient characteristics for the analyzed COVID-19+ blood samples including demographics, disease severity, comorbidities, and laboratory measurements at baseline are shown in Table 1. None of the patients had an underlying primary disease related to hemostasis, leukocyte, or platelet behavior. There were two patients with active malignancy of solid organs while none of the patients had a hematologic malignancy. The median analyzed volume during imaging flow cytometry was 4 μL (IQR = 3.1–4.7) and a median of 26.40 ∗104 (IQR = 19.47 ∗104–31.57 ∗104) objects were counted per sample, with objects including both cells as well as microparticles (particles ≥1 μm).
Table 1.
Patient characteristics for the analyzed COVID-19 + blood samples
| Factor | Value |
|---|---|
| Number of blood samples | 46 |
| Age (years), median (IQR) | 57 (37–70) |
| Gender, n (%) | |
| Male | 28 (61%) |
| Female | 18 (39%) |
| BMI (kg/m2), median (IQR) | 27.34 (23.7–32.3) |
| Race, n (%) | |
| Asian | 2 (4%) |
| Black or African American | 10 (22%) |
| White | 22 (48%) |
| Other | 12 (26%) |
| Ethnicity, n (%) | |
| Hispanic or Latino | 14 (30%) |
| Non-Hispanic/Latino | 32 (70%) |
| Respiratory symptoms at admission, n (%) | 20 (43%) |
| Comorbidities, n (%) | |
| Diabetes Mellitus | 17 (37%) |
| Coronary Artery Disease | 8 (17%) |
| Asthma | 2 (4%) |
| COPD | 3 (7%) |
| Hypertension | 16 (35%) |
| HFrEF | 3 (7%) |
| History of VTE | 1 (2%) |
| Sickle cell disease | 0 |
| Chronic kidney disease | 10 (22%) |
| Active malignancy | 2 (4%) |
| History of stroke | 4 (9%) |
| End-stage liver disease | 0 |
| Laboratory | |
| WBC count (x103/mm3), median (IQR) | 7.66 (5.49–11.94) |
| Neutrophil count (x103/mm3), median (IQR) | 4.71 (3.11–7.86) |
| Lymphocyte count (x103/mm3), median (IQR) | 1.35 (0.88–1.92) |
| Monocyte count (x103/mm3), median (IQR) | 0.6 (0.31–0.84) |
| Eosinophil count (x103/mm3), median (IQR) | 0.13 (0.06–0.27) |
| Basophil count (x103/mm3), median (IQR) | 0.03 (0.01–0.05) |
| Granulocyte count (x103/mm3), median (IQR) | 0.04 (0.01–0.07) |
| Hemoglobin (g/dL), median (IQR) | 10 (8.4–11.4) |
| Hematocrit (%), median (IQR) | 31.85 (26.7–35.3) |
| Platelet count (x103/mm3), median (IQR) | 244 (171–304) |
| Prothrombin Time (seconds), median (IQR) | 14.3 (13–15.9) |
| INR, median (IQR) | 1.1 (1–1.3) |
| aPTT (seconds), median (IQR) | 39.4 (33.9–45.6) |
| Fibrinogen (mg/dL), median (IQR) | 398.5 (303.5–637) |
| D-dimer (ng/mL), median (IQR) | 1401 (666.5–1535) |
| AST (U/L), median (IQR) | 44 (26.5–112.5) |
| ALT (U/L), median (IQR) | 40.5 (26.5–68.5) |
| Total bilirubin (mg/dL), median (IQR) | 0.5 (0.3–0.95) |
| BUN (mg/dL), median (IQR) | 18 (11–35) |
| Creatinine (mg/dL), median (IQR) | 0.97 (0.72–1.28) |
IQR: Interquartile range, BMI: Body mass index, COPD: Chronic obstructive pulmonary disease, HFrEF: Heart failure with reduced ejection fraction, VTE: Venous thromboembolism, WBC: White blood cell, INR: International normalized ratio, aPTT: Activated partial thromboplastin time, AST: Aspartate aminotransferase, ALT: Alanine aminotransferase, BUN: Blood urea nitrogen.
CCCs in COVID-19 patients versus controls
Patients with COVID-19 had significantly higher levels of PLAs (131.93 [IQR = 66.67–210.42] versus 53.61 [IQR = 48–68.50], p value = 0.002) and PEAs (24.12 [IQR = 18.26–32.03] versus 10.82 [IQR = 0.85–2.23], p value< 0.001) compared to healthy controls. Conversely, the difference in CLC levels was not significantly different between healthy controls and COVID-19 patients (Figure 1C & Table S1 [supplemental material 1]).
Figure 1.

Circulating cellular clusters (CCC) measured by imaging flow cytometry
(A) Flow cytometry images of Circulating Leukocyte Cluster (CLC), Platelet Leukocyte Aggregate (PLA), and Platelet Erythrocyte Aggregate (PEA). Green: CD61 (platelet), Purple: DAPI (nucleus).
(B) Examples of multicellular flow cytometric objects with and without intercellular contact.
(C) CCC levels between patients with COVID-19 and healthy donor samples. Asterix represents statistical significance, defined as p value <0.05. Statistical significance was tested with Somers’ D statistic. The horizontal line across box represents median value, upper and lower edges of boxes represent the 25th and 75th percentile, whisker represents range of data, individual dots represent outliers.
Association between CCCs and clinical outcomes in COVID-19 patients
Eleven blood samples corresponded to patients who experienced a thrombotic complication during their hospital stay (Table 2). The most common type of thrombotic complication was clotting in intravenous and/or intra-arterial lines or within the ECMO circuit (n = 7, 15%), followed by DVT (n = 4, 9%), acute mesenteric ischemia (n = 2, 4%), pulmonary embolism (n = 1, 2%), and myocardial infarction (n = 2, 4%). Three of the patients experienced more than one thrombotic complication during their hospital stay. Patients who experienced a thrombotic complication during hospital stay had significantly higher CLC levels compared to patients without thrombotic complications (12.70 [IQR = 7.09–38.10] versus 3.86 [IQR = 0–11.95], p value = 0.016) (Figure 2A, Table S2 [supplemental material 1]). PEA and PLA levels were not significantly associated with thrombotic complications.
Table 2.
Clinical outcomes for the analyzed COVID-19+ blood samples
| Factor | Value |
|---|---|
| Thrombotic complication, n (%) | 11 (23.9%) |
| Mortality, n (%) | 6 (13%) |
| Admitted to ICU, n (%) | 11 (23.9%) |
| Intubated & mechanically ventilated, n (%) | 7 (15.2%) |
| Vasopressor infusion, n (%) | 7 (15.2%) |
| Acute kidney injury, n (%) | 24 (52.1%) |
| Bacterial pneumonia, n (%) | 13 (28.3%) |
| Bacterial culture, n (%) | 29 (63%) |
Figure 2.

Circulating cellular cluster (CCC) levels in COVID-19 patients with and without clinical complications
Box and whisker plots comparing various CCC phenotypes and clinical outcomes in patients with COVID-19 disease. Asterix represents statistical significance, defined as p value <0.05. Statistical significance was tested with Somers’ D statistic. The horizontal line across box represents median value, upper and lower edges of boxes represent the 25th and 75th percentile, whisker represents range of data, individual dots represent outliers.
There was no significant difference in PEA, CLC, or PLA levels between patients who died during hospital stay and those discharged alive (Figures 2B and Table S2 [supplemental material 1]). No significant association was detected between CLC, PLA, PEA levels and ICU admission status or intubation & mechanical ventilation (Figures 2C and 2D, Table S2 [supplemental material 1]). CLCs were significantly higher in patients receiving vasopressor infusions (12.70 [IQR = 8.23–21.90] versus 5.29 [IQR = 0–12.02], p value = 0.033), patients who experienced AKI (9.83 [IQR = 1.93–19.02] versus 0 [IQR = 0–10.53], p value = 0.027), and patients with pneumonia (10.15 [IQR = 7.09–16.53] versus 0 [IQR = 0–11.95], p value = 0.036) (Figures 2E–2G, Table S2 [supplemental material 1]). PEA levels were found to be significantly higher in patients who had a positive bacterial culture during hospital stay (27.62 [IQR = 22.21, 33.33] versus 21.10 [IQR = 16.76–24.73], p value = 0.033) (Figures 2H and Table S2 [supplemental material 1]). Microorganisms isolated in bacterial cultures are reported in Table S3 [supplemental material 1].
Association between CCCs, blood type and race
When CLC levels were compared between different ABO blood types, patients with blood type B had significantly higher CLC levels compared to those who did not (p value< 0.001, Figure 3A, Table S4 [supplemental material 1]). PEA and PLA levels were not associated with ABO blood types. PLA levels were significantly higher in patients with an Rh+ blood type (p value<0.001, Figures 3B and Table S4 [supplemental material 1]).
Figure 3.

Circulating cellular cluster (CCC) levels in COVID-19 patients with different blood types and of different race
Box and whisker plots comparing various CCC phenotypes between blood types (A and B) and Race (C) in patients with COVID-19 disease. Asterix represents statistical significance, defined as p value <0.05. Statistical significance was tested with Somers’ D statistic. The horizontal line across box represents median value, upper and lower edges of boxes represent the 25th and 75th percentile, whisker represents range of data, individual dots represent outliers.
Patients who self-identified as Black or African American had significantly higher CLC levels compared to patients who self-identified as White (p value = 0.013, Figure 3C and Table S4 [supplemental material 1]). Owing to the low number of patients self-identifying as Asian (n = 2) and the heterogeneity of patients self-identifying as “other race” (n = 12), these were not included in the statistical analysis.
Correlation of CCCs with in-vitro coagulation tests
Table S5 (supplemental material 1) shows the results of linear regression models evaluating the association between CCCs versus PT, aPTT, fibrinogen, and D-Dimer. There was no significant association between CLC, PLA, PEA levels and conventional in vitro coagulation tests (p value >0.05). There was no association observed between conventional coagulation tests and the development of a thrombotic complication (Table S6 [supplemental material 1]).
Predictive modeling of CCCs in microvessels
First, we simulated CLCs flowing in microchannels containing a diverging and a converging bifurcation (Figures 4B–4D). Microchannels with increased bifurcation angles of 70°, 90°, and 110° were employed to investigate the impact of bifurcation angle on the transport of CLCs in microvessels (Figure 4D). Initially, we simulated CLCs flowing through microchannels with a fixed bifurcation angle of 70°, which is the average bifurcation angle computed from the complex network shown in Figure 4E. Our simulations show that when the blood flow velocity in the microvessels is relatively low (1.0 mm/s), the CLC obstructs the diverging bifurcation of the microvessel (Figure 4B). However, an increase of inlet flow velocity to 1.3 mm/s causes the breakup of the obstructing cluster, and subsequently the two split leukocytes flow through two branch channels separately (Figure 4C). A similar trend for microcirculatory flow velocity was also found for bifurcation angles of 90° and 110°, but the critical blood flow velocities needed to breakup CLCs increased to 1.6 mm/s and 1.9 mm/s, respectively (Figure 4D). These simulation results suggest that microvascular networks that contain diverging bifurcations with higher bifurcation angles are more susceptible for CLC-induced blockade.
Figure 4.

In-silico simulations of circulating cellular cluster (CCC) behavior in the microcirculation
(A) Two types of CCC models were examined: (I) circulating leukocyte clusters (CLC), (II) platelet erythrocyte aggregates (PEA).
(B and C) Three sequential snapshots of a CLC flowing in the microchannel containing a diverging bifurcation with an angel of 70°. While the CLC is clogged at the bifurcation under an inlet flow velocity of 1.0 mm/s (B), this cluster breaks into two WBCs under an inlet flow velocity of 1.3 mm/s and the two separated WBCs flow through the two daughter channels (C).
(D) The critical velocities causing the splitting of CLCs increase to 1.6 mm/s and 1.9 mm/s as the bifurcation angles are increased to 90° and 110°, respectively.
(E) Blood cell transport in a vessel network: (I) with no clusters and (II) with CLC. The mean blood flow velocities in the five segments of vessels in the network without clusters are (1) 4.5 mm/s, (2) 3.578 mm/s, (3) 2.98 mm/s, (4) 1.821 mm/s, (5) 0.83 mm/s. Blue arrows highlight the flow directions. Computational simulation of a PEA flowing through microchannels is pictured in Figure S1 [supplemental material 1].
Next, we simulated PEAs flowing in the same microchannels as examined for CLCs. Our results show that PEAs also either obstruct the microchannel or break up at the diverging bifurcation sites, depending on the blood flow velocities (Figures S1A and S1B], [supplemental material 1]). Conversely to critical velocities observed for CLCs, the critical velocities that cause splitting of PEAs were not sensitive to the angle of bifurcations (Figures S1A and S1B] [supplemental material 1]). Finally, we simulated CLCs flowing in the complex microchannel network as illustrated in Figure 4E. First, we show that under a physiologically relevant setting (a mean inlet velocity of 4.5 mm/s), all the microchannels in the network are perfused and no blockage of erythrocytes in the network is observed when no CLCs exist (Figure 4E [I]). When CLCs were introduced into the inlet of the network, under the same flow conditions as the simulation with no clusters, CLCs were able to travel through multiple diverging bifurcations before they were stuck at the diverging bifurcation site where the blood velocity upstream of the bifurcation was 0.83 mm/s prior to obstruction Figure 4E (II). This finding is consistent with the simulation results in the simple microchannels with a single diverging and converging bifurcation where CLC-induced obstruction was observed when blood flow velocity was reduced to 1 mm/s (Figure 4B).
Discussion
We compared CCC levels between patients with COVID-19 and healthy control samples and evaluated the association between CCC levels and clinical outcomes in COVID-19 patients. COVID-19 patients had higher PEA and PLA levels compared to healthy control samples. CLC levels –which were not significantly different between COVID-19 and control samples– were significantly correlated with the development of adverse thrombotic events, hemodynamic instability requiring vasopressor infusion, AKI, and pneumonia. PEA levels were found to be significantly higher in COVID-19 patients who had a positive bacterial culture during hospital stay.
Platelets play a central role in orchestrating the interaction between the innate immune and hemostatic systems.1 Accordingly, PLAs are well established markers of immune-thrombosis and have been shown to be elevated in a variety of thrombo-inflammatory conditions.27,28,29 PLA levels have been shown to be higher in COVID-19 patients and correlate with disease severity.20,21,22,23 In addition, platelet-monocyte interaction was shown to result in higher tissue factor (TF) expression by monocytes.22 Our findings are aligned with the literature in that PLA levels were higher in COVID-19 patients compared to healthy control samples. However, our analysis did not show a significant association between PLA levels and thrombotic complications, disease severity, or other in-hospital complications in COVID-19 patients.
The nature and impact of platelet-erythrocyte interactions in hyperinflammatory states remains largely understudied, with a limited number of research papers focusing on sickle cell disease (sickle cell crisis) and prothrombotic phenotypes during pregnancy.30,31 Platelet-erythrocyte interactions have been shown to enhance platelet glycoprotein αIIβIII activation and P-selectin expression following collagen exposure in vitro.32 Our study has shown a significantly higher level of PEAs in COVID-19 patients compared to healthy controls. PEAs were also found to be significantly elevated in COVID-19 patients with at least one positive bacterial culture during hospital stay. Future studies evaluating PEA levels in other hyperinflammatory disease states will be valuable to understand the role of PEAs in thrombosis and immune response.33,34
While our analysis found no significant difference in CLC levels between healthy controls and COVID-19 patients, CLC levels were significantly associated with thrombotic complications among COVID-19 patients. These findings suggest that CLCs may be a more specific marker for thrombotic risk, rather than simply being a proxy for COVID-19 infection. This is especially interesting considering we evaluated the association of conventional in vitro coagulation tests (PT, aPTT, fibrinogen, D-dimer) with CCCs and thrombotic complications, and found no significant relationship, suggesting that CCCs measure an aspect of thrombogenesis that is not readily captured by conventional clinical laboratory assays.
In the current analysis, CLCs were defined as any cluster including two or more leukocytes (identified as CD45+ and DAPI+), and therefore usually consisted of cellular clusters larger than >15 μm in diameter. Conceivably, rheology of such clusters could disrupt microcirculatory blood flow and result in a thrombogenic environment.35 This possible change in microcirculatory function could also explain the association between CLC levels and AKI.36 In addition, higher CLC levels could be a manifestation of neutrophil extracellular traps (NETs) which are established actors in immunothrombosis.37,38
To evaluate the potential microcirculatory effects of CCCs, we constructed in silico predictive simulations for CLCs and PEAs. CLCs were found to result in microcirculatory obstruction, particularly when blood flow velocity was low and capillary bifurcation angles were high. Although occlusion by CLCs was bifurcation-angle dependent (i.e., more likely to cause obstruction at higher angles), occlusion by PEAs was not associated with the bifurcation angles of microchannels. This discrepancy is likely because of the fact that leukocytes are less deformable compared to erythrocytes, following which we model leukocytes 100 times stiffer than erythrocytes in the current work.39,40 As CCCs containing leukocytes reach the diverging bifurcation sites, leukocytes need to alter their shape and orientation of their motion such that they can squeeze into the branch channels. Greater bifurcation angles would pose an increased challenge for leukocytes to adjust their forms and thus require larger blood flow velocities to maintain unobstructed flow. On the other hand, as erythrocytes are more deformable compared to leukocytes, and as platelets are much smaller than erythrocytes and leukocytes, PEAs can easily squeeze through branch channels and thus are not sensitive to increased bifurcation angles. These findings suggest that CLCs could be a potential culprit for microcirculatory complications in hemodynamically unstable patients with compromised capillary blood flow, particularly at microcirculatory beds with high branching angles. Our simulation results offer insight for a potential mechanism of microthrombotic complications associated with CCCs and provide a potential mechanistic rationale for the correlation between CLCs detected in blood samples of COVID-19 patients and clinical outcomes.
A higher prevalence of CCCs, specifically PLAs and PEAs, has been reported in several hyperinflammatory conditions such as ARDS, severe trauma, acute mesenteric ischemia, open heart surgery, HIV infection, sickle cell disease, and inflammatory bowel disease.3,28,31,33,41,42,43,44 Although COVID-19 is an appropriate disease model to study immune-thrombotic phenomena because of the relatively higher incidence of thrombotic complications, the findings of this study are likely not specific to COVID-19 and could possibly be extrapolated to other hyperinflammatory conditions.10,45 The strength of our methodology compared to other flow cytometric studies is that we used imaging flow cytometry which allowed accurate detection of CCCs by visual confirmation of intercellular contact in microscopic images in addition to gating by flowcytometric fluorescent signal intensity and object size.
In conclusion, circulating leukocyte clusters are significantly associated with the development of thrombotic complications in patients with COVID-19. Our computational simulation provides a potential mechanistic explanation for the association between CLCs and microthrombotic complications and suggests that CLCs are most likely to obstruct microcirculatory beds with low blood flow velocity and higher bifurcation angles. Further studies on the cellular component of hyperinflammatory prothrombotic states may lead to the identification of novel biomarkers and drug targets for inflammation-related thrombosis.
Limitations of the study
We did not have markers targeted at endothelial cells, histones, or extracellular DNA which have been previously shown to be involved in immune-thrombotic processes (these studies are currently in progress). Similarly, we did not have markers to differentiate between types of leukocytes (i.e., monocyte versus granulocyte versus lymphocyte) and their involvement in different types of clusters or data for proinflammatory cytokine (e.g., IL-6) levels in blood samples. Owing to the low number of samples, self-identified races other than “Black or African American” or “White” were not statistically analyzed. The in-silico models were constructed to simulate the microcirculatory environment in the arterioles, capillaries, and venules. It is unknown how the shear forces of the macrovasculature would affect CCCs; however, we suspect that being subjected to a turbulent environment may further activate “primed” platelets and leukocytes, as this is a well-known arm of Virchow’s triad. Finally, our analysis was limited by the sample size and the single center retrospective design. The possibility of type 2 error in the reported non-significant associations cannot be ruled out because of the relatively small sample size.
STAR★Methods
Key resources table
| REAGENT or RESOURCE | SOURCE | IDENTIFIER |
|---|---|---|
| Antibodies | ||
| CD45, HI30 - PE | BioLegend (8999 BioLegend Way San Diego, CA 92121) |
RRID: AB_314395 (BioLegend Cat. No. 304007) |
| CD61, VI-PL2 - FITC | BioLegend (8999 BioLegend Way San Diego, CA 92121) |
RRID: AB_1227581 |
| DAPI, Draq5TM | BioLegend (8999 BioLegend Way San Diego, CA 92121) |
|
| Software and algorithms | ||
| IDEAS (v6.2) | Millipore Sigma | |
| STATA v17 | (StataCorp 2021, College Station, TX) | |
| Other | ||
| AMNIS ImageStream MKII | Luminex Corp, Austin Tx | |
Resource availability
Lead contact
Further information and requests for resources and reagents should be directed to and will be fulfilled by the lead contact, Galit H Frydman, DVM ScD (gfrydman@mit.edu).
Materials availability
This study did not generate new unique reagents.
Experimental model and study participant details
Under IRB approval (protocol #:2020P001364), discarded whole blood samples collected in EDTA vacutainer tubes were collected from patients presenting to the Massachusetts General Hospital (Boston, MA) between July – August 2020. COVID-19 positivity was defined as having a positive SARS-CoV-2 PCR result. Fifty-eight samples were included in the analysis; a total of 46 samples from 37 COVID-19 patients and 12 samples from healthy controls. Serial samples were taken from patients who were hospitalized during more than one of the sample collection days. Healthy donor blood was purchased from a commercial blood bank (Research Blood Components, Watertown, MA). The blood bank providing the blood samples screens donors per the Association for the Advancement of Blood & Biotherapies (AABB) donor screening and testing criteria, including testing for HIV, HBV, HCV, and a health questionnaire including items for history of hemostatic disorders or the use of antiplatelet or anticoagulant medications (Figure S2, supplemental material 2). Demographics and other clinical information were not available for healthy donors. Blood samples were fixated with 4% paraformaldehyde, then washed for removal of plasma and stored at 4°C in phosphate buffered saline (PBS). Although there may have been some differences in the method of blood collection (some patients underwent venipuncture while some had vascular access lines for direct sampling), all samples were processed within 12 hours of blood draw to ensure that the post-processing time was not a variable in the sample activation. Samples were stained on the same day as flow cytometric analysis with fluorophore-labeled antibodies for the following molecular targets: CD61 (platelet), CD45 (leukocyte) (BioLegend, San Diego, CA), and 4′,6-diamidino-2-phenylindole (DAPI, nucleus). To account for any potential in vitro activation of cells and platelets resulting in CCCs, the control blood samples were treated the same as the patient blood sample: whole blood in EDTA was left at room temperature for 12 hours and then subject to processing by fixation.
Ethical oversight
This study was approved by the Mass General Brigham Institutional Review Board and exempted from informed consent (Protocol # 2020P001364).
Method details
Clinical data & outcomes
Clinical data was collected by physicians via retrospective electronic health record abstraction. The primary outcome was the development of thrombotic complications. Thrombotic complication was defined as experiencing deep vein thrombosis (DVT), pulmonary embolism, clotting in arterial or venous lines, clotting in the extracorporeal membrane oxygenation (ECMO) circuit, myocardial infarction, acute bowel ischemia, or stroke. Secondary outcomes included in-hospital mortality, Intensive Care Unit (ICU) admission, need for invasive mechanical ventilation, hemodynamic instability requiring vasopressor infusion (epinephrine, norepinephrine, vasopressin, phenylephrine, dopamine), acute kidney injury (AKI), bacterial pneumonia, and positive bacterial culture during hospital stay. ICU admission, need for invasive mechanical ventilation, hemodynamic instability requiring vasopressor infusion represent the patient’s clinical status at the time of blood sampling. Bacterial pneumonia was diagnosed via culture or radiology in the appropriate clinical setting. A positive bacterial culture was defined as having growth in at least one bacterial culture from respiratory (sputum, tracheal aspirate, bronchoalveolar lavage), urine, blood, peritoneal fluid, biliary, abscess, and wound samples during hospital stay. Acute kidney injury was diagnosed using the Kidney Disease Improving Global Outcomes (KDIGO) criteria or as reported by the caring physician in the electronic health record. Data regarding race and ethnicity was acquired from the electronic health record, as self-identified by the patient.
Results for prothrombin time, activated partial thromboplastin time, fibrinogen, D-Dimer, complete blood count, aspartate aminotransferase, alanine aminotransferase, total bilirubin, blood urea nitrogen, and creatinine were obtained from the clinical laboratory. Exploratory analyses were performed to compare CCC levels between COVID-19 patients of different race, and between different ABO & Rh blood types.
Flow cytometry & cellular cluster Definitions
Stained blood samples were analyzed with imaging flow cytometry (AMNIS ImageStream MKII, Luminex Corp, Austin Tx). Our flow cytometry panel consisted of 4 channels: a brightfield microscopy channel and 3 channels discretely calibrated for the fluorophore-labeled antibodies (CD61, CD45, DAPI). Flow cytometric data was processed with the IDEAS (v6.2) software.
We evaluated 3 types of CCCs. First, circulating leukocyte clusters (CLCs), defined as any cellular clusters including 2 or more leukocytes (CD45+DAPI+) (Figure 1A). CLCs could also contain platelets (CD61+) and/or erythrocytes (CD45−CD61−DAPI-) CLCs were reported as the number of CLCs per 105 nucleated (DAPI+) cells. Second, platelet leukocyte aggregates (PLAs), defined as a cluster with at least one platelet and one leukocyte (CD45+CD61+DAPI+) (Figure 1A). PLAs were reported as the number of PLAs per 105 nucleated (DAPI+) cells. Third, platelet-erythrocyte aggregates (PEAs), defined as a cluster involving at least one red blood cell (CD45−CD61−DAPI-) and one platelet (CD45−CD61+DAPI−) (Figure 1A). Red blood cells were evaluated with size-based gating and visual confirmation of flow cytometric images (CD45−CD61−DAPI-). PEAs were reported as the number of PEAs per 103 erythrocytes. Flow cytometric images of all CCCs were individually analyzed to confirm intercellular contact within clusters (Figure 1B).
Predictive modeling of CCC flowing in microvessels
We first reconstructed two types of CCC, namely CLC and PEA, as illustrated in Figure 4A (I-II). To simulate erythrocytes, platelets and leukocytes, we employed the models developed by Fedosov, and used its extension for platelets and leukocytes.46,47,48,49 Specifically, erythrocytes, which are simulated as biconcave-shaped cells, 8 μm wide and 2 μm thick. Platelets are modeled as oblate spheroids with size of 3 μm and 1.15 μm along the major and minor axes, respectively. The circulating leukocyte model is represented by a spherical cell with a diameter of 8 μm, comparable to the size of circulating leukocytes.50,51 Adhesive interactions, which are described by a Morse potential, are employed among leukocytes and erythrocytes to form the CCC models.48,52 The adhesive forces implemented between blood cells are selected to be 55 pN, following previous work on simulating the adhesion between circulating leukocytes and sickle erythrocytes.48
We simulated the motion of CCC models in two types of microchannels, microchannels with a diverging and a converging bifurcation as shown in Figures 4B–4D and complex microchannels as illustrated in Figure 4E. These 3D microvessels were generated using Solidworks (Dassault Systèmes SE, Vélizy-Villacoublay, France) and the vessel diameters are defined following Horton’s and Murray’s laws, which describe the relation of vessel diameters at bifurcations and confluences to capture the fractal nature of topologies.53,54,55 The complex microchannel in Figure 4E is reconstructed based on microvascular networks of the rat mesentery and it enables simulations of the blood cell transport from arterioles to capillaries and post-capillary venules.56 The mean inlet velocity on the left side of the simple microchannels in Figures 4B–4D is varied between 1 and 3 mm/s while the average inlet velocity for the complex microchannels in Figure 4E is selected to be 4.5 mm/s, which are consistent with the average velocity measured in the human capillaries and arterioles, respectively.57
We employ the smoothed particle hydrodynamics (SPH) method to model blood flow (plasma) in the microfluidic channels.S 1, 2 In SPH, field variables (such as density, velocity, and acceleration) can be obtained by approximating the governing equations on a set of particles. The connectivity between particles is not generated as part of the computation and can evolve with time. Following our previous work of, the interaction between the blood cell and fluid is modeled by the immersed boundary method.S 3, 4 The membrane of suspending cells including red blood cells (RBCs), platelets, and white blood cells (WBCs), is constructed by a 2D triangulated network with Nv vertices (particles). The vertices are connected by Ns elastic bonds to impose proper membrane mechanics. These particle representations of RBCs and platelets were extensively used and validated in the previous studies for both healthy and diseased cells.S 5-9 For a single cell, the free energy (Vcell) is given by:
The elastic energy Vs. representing the elastic interactions of the cell membrane is defined by:
where p is the persistence length, kp is the spring constant, kBT is the energy unit, lj is the length of the spring j, lm is the maximum spring extension, and xj = lj/lm. p and kp are computed by balancing the forces at equilibrium and from their relation to the macroscopic shear modulus, μs:
where l0 is the equilibrium spring length and x0 = l0/lm. The bending resistance Vb of the cell membrane is modeled by:
where kb is the bending constant, and it is related to the macroscopic bending rigidity kc with the expression kb = 2kc/√3, θj is the instantaneous angle between two adjacent triangles sharing the common edge j, and θ0 is the spontaneous angle. In addition, the area and volume constraints Va+v are imposed to mimic the area-preserving lipid bilayer and the incompressible interior fluid. The corresponding energy is given by:
where Nt is the number of triangles in the membrane network, A0 is the equilibrium value of a triangle area, and kd, ka and kv are the local area, global area and volume constraint coefficients, respectively. The terms A0tot and V0tot are targeted cell area and volume.
We model RBCs with a biconcave shape using Nv=500 DPD particles. The shear modulus and bending rigidity of the RBC model are selected to be μ0 = 4.73 μN/m and k0 = 2.4 x 10⁻¹⁹ J, respectively. The cell surface area is selected to be A0tot = 132.9 μm2, and cell volume V0tot = 92.5 μm3, which give a surface to volume ratio of S/V = 1.44. All parameters used in our RBCs model are validated based on existing experimental data from single RBC mechanics to blood flow dynamics.S 6-8, 10 The platelet model, which consists of Nv = 48 DPD particles, is assumed to have a discoid cell shape with an aspect ratio of AR = 0.38. Based on our previous analysis on the patient-specific data, the surface area and volume of a platelet in passive state is selected to be A0tot = 19.627 μm2 and V0tot = 6 μm3, respectively.S 11 Since platelets are nearly rigid in their passive form, we choose shear modulus and bending rigidity sufficiently large (μp = 100 μ0 and kp = 100 k0) to ensure its mechanical behavior as a more rigid cell.
A passive WBC model, comprised of Nv = 2498 DPD particles, is represented by a spherical cell with a diameter of 10 μm, following our previous work.S 8, 12 A WBC is less deformable compared to RBCs with the estimated shear modulus of 300–3000 μN/m and bending stiffness of 1–2 x 10⁻¹⁸ J.S 13, 14 Guided by these studies, we model a WBC with μl = 100 μ0 and kl = 8 k0 in the current work. In order to prevent cell overlap and generate circulating cell clusters (CCCs), we employ a Morse potential between cell membrane particles in the form of:
where r is the separation distance, r0 is the zero-force distance, De is the well depth of the potential, and β characterizes the interaction range. We present the Morse potential parameters used for cell-cell interactions in Table S7 (supplemental material 1). Note that the cutoff radius rcut = r0 is given for all the Morse interactions between blood cells that do not form CCCs. Supplemental references can be found in supplemental material 3.
Quantification and statistical analysis
CCC levels were compared between healthy control samples and COVID-19 patients with Somers’ D statistic, accounting for clustering in samples obtained from the same patient. Similarly, CCC levels were compared between COVID-19 patients who experienced a clinical complication and those who did not, between COVID-19 patients of different race & ethnicity, and between COVID-19 patients with different ABO and Rh blood groups using Somers’ D statistic, accounting for clustering in samples obtained from the same patient. Results were reported as Somers’ D coefficient (95% Confidence Interval) and p-values. Somers’ D coefficient is a measure of ordinal association which ranges between -1 (representing inverse association) and 1 (representing direct association).58 The relationships between CCCs and conventional in-vitro coagulation tests (PT, aPTT, fibrinogen, D-dimer) were evaluated with univariable linear regression, accounting for clustering in samples obtained from the same patient. Results of linear regression models were reported as unstandardized regression coefficients (B) and p-values (Table S5, supplemental material 1). The relationships between conventional in-vitro coagulation tests (PT, aPTT, fibrinogen, D-dimer) and thrombotic complications were evaluated with univariable logistic regression, accounting for clustering in samples obtained from the same patient. Results of logistic regression models were reported as odds ratios (OR) and p-values (Table S6, supplemental material 1).
There were no missing data points for IFC measurements or clinical outcomes. Missing data points for in-vitro coagulation tests (PT, aPTT, fibrinogen, D-dimer) were handled with multiple imputation with chained equations (MICE) (Table S8, supplemental material 1).
Statistical analyses were performed with STATA v.17 (College Station, TX). Statistical significance was set at a 2-sided p-value of less than 0.05.
Acknowledgments
This study was funded by the Massachusetts General Hospital Executive Committee on Research (MGH Internal ECOR - #237254).
Author contributions
Study Design: A.D-G.; G.L., H.L., L.N., Y.L., D.V.M., X.L., T.Y., E.V.C., R.R., D.G., R.T., G.K., H.MA.K., G.C.V., J.L., and G.H.F.. Conduct of Experiments: A.D-G., G.L., H.L., X.L., T.Y., and G.H.F.. Interpretation of Results: A.D-G., G.L., H.L., L.N.; Y.L., X.L., T.Y., E.V.C., R.R., D.G., R.T., G.K., H.MA.K., G.C.V., J.L., and G. H.F.. Drafting the Manuscript: A.D-G., and G.H.F.. Critical Revision of the Manuscript: G.L., H.L., L.N., Y.L., X.L., T.Y., E.V.C., R.R., D.G., R.T., G.K., H.MA.K., G.C.V., and J.L.
Declaration of interests
J.L. declares the following interests: Consultant, Butterly Network, Inc, (unrelated); Research Grant, Beckman Coultier, Inc. (unrelated), Founder, Health Tech Without Borders, Inc. (unrelated). G.H.F. declares the following interests: CSO of Coagulo Medical Technologies. R.R. declares the following interests: R.R. receives grant funding to her institution from BMS, Janssen; consultant to Abbott, BMS, Dova, Janssen, Inari, Penumbra; Principal Investigator for STORM PE (penumbra); and President-Elect for the Pulmonary Embolism Response Team (PERT) Consortium: all COI are outside the scope of this work. The remaining authors have no interest to declare.
Published: June 25, 2023
Footnotes
Supplemental information can be found online at https://doi.org/10.1016/j.isci.2023.107202.
Supplemental information
Data and code availability
-
•
Data collected for this study includes confidential protected health information and therefore cannot be uploaded to a public repository. To request access, contact Galit H Frydman, DVM ScD (gfrydman@mit.edu).
-
•
All original code is available in Data S1/Methods S1 (supplemental material 4).
-
•
Any additional information required to reanalyze the data reported in this paper is available from the lead contact upon request.
References
- 1.Engelmann B., Massberg S. Thrombosis as an intravascular effector of innate immunity. Nat. Rev. Immunol. 2012;13:34–45. doi: 10.1038/nri3345. [DOI] [PubMed] [Google Scholar]
- 2.Gaertner F., Massberg S. Blood coagulation in immunothrombosis—At the frontline of intravascular immunity. Semin. Immunol. 2016;28:561–569. doi: 10.1016/J.SMIM.2016.10.010. [DOI] [PubMed] [Google Scholar]
- 3.Gando S., Otomo Y. Local hemostasis, immunothrombosis, and systemic disseminated intravascular coagulation in trauma and traumatic shock. Crit. Care. 2015;19:72. doi: 10.1186/S13054-015-0735-X. [DOI] [PMC free article] [PubMed] [Google Scholar]
- 4.Frantzeskaki F., Armaganidis A., Orfanos S.E. Immunothrombosis in Acute Respiratory Distress Syndrome: Cross Talks between Inflammation and Coagulation. Respiration. 2017;93:212–225. doi: 10.1159/000453002. [DOI] [PubMed] [Google Scholar]
- 5.Hickey M.J., Kubes P. Intravascular immunity: The host-pathogen encounter in blood vessels. Nat. Rev. Immunol. 2009;9:364–375. doi: 10.1038/NRI2532. [DOI] [PubMed] [Google Scholar]
- 6.Bonaventura A., Vecchié A., Dagna L., Martinod K., Dixon D.L., Van Tassell B.W., Dentali F., Montecucco F., Massberg S., Levi M., et al. Endothelial dysfunction and immunothrombosis as key pathogenic mechanisms in COVID-19. Nat. Rev. Immunol. 2021;21:319–329. doi: 10.1038/s41577-021-00536-9. [DOI] [PMC free article] [PubMed] [Google Scholar]
- 7.Portier I., Campbell R.A., Denorme F. Mechanisms of immunothrombosis in COVID-19. Curr. Opin. Hematol. 2021;28:445–453. doi: 10.1097/MOH.0000000000000666. [DOI] [PMC free article] [PubMed] [Google Scholar]
- 8.Markiewski M.M., Nilsson B., Ekdahl K.N., Mollnes T.E., Lambris J.D. Complement and coagulation: strangers or partners in crime? Trends Immunol. 2007;28:184–192. doi: 10.1016/J.IT.2007.02.006. [DOI] [PubMed] [Google Scholar]
- 9.Cardone M., Yano M., Rosenberg A.S., Puig M. Lessons Learned to Date on COVID-19 Hyperinflammatory Syndrome: Considerations for Interventions to Mitigate SARS-CoV-2 Viral Infection and Detrimental Hyperinflammation. Front. Immunol. 2020;11:1131. doi: 10.3389/fimmu.2020.01131. [DOI] [PMC free article] [PubMed] [Google Scholar]
- 10.Stals M.A.M., Grootenboers M.J.J.H., van Guldener C., Kaptein F.H.J., Braken S.J.E., Chen Q., Chu G., Driel E.M.v., de Jonge E., et al. Risk of thrombotic complications in influenza versus COVID-19 hospitalized patients. Res. Pract. Thromb. Haemost. 2021;5:412–420. doi: 10.1002/RTH2.12496. [DOI] [PMC free article] [PubMed] [Google Scholar]
- 11.Porfidia A., Valeriani E., Pola R., Porreca E., Rutjes A.W.S., Di Nisio M. Venous thromboembolism in patients with COVID-19: Systematic review and meta-analysis. Thromb. Res. 2020;196:67–74. doi: 10.1016/J.THROMRES.2020.08.020. [DOI] [PMC free article] [PubMed] [Google Scholar]
- 12.The REMAP-CAP, A.-4a. A.I. Therapeutic Anticoagulation with Heparin in Critically Ill Patients with Covid-19. N. Engl. J. Med. 2021;385:777–789. doi: 10.1056/NEJMOA2103417. [DOI] [PMC free article] [PubMed] [Google Scholar]
- 13.The ATTACC, A.-4a. R.-C.I. Therapeutic Anticoagulation with Heparin in Noncritically Ill Patients with Covid-19. N. Engl. J. Med. 2021;385:790–802. doi: 10.1056/NEJMOA2105911. [DOI] [PMC free article] [PubMed] [Google Scholar]
- 14.Lopes R.D., de Barros E Silva P.G.M., Furtado R.H.M., Macedo A.V.S., Bronhara B., Damiani L.P., Barbosa L.M., de Aveiro Morata J., Ramacciotti E., de Aquino Martins P., et al. Therapeutic versus prophylactic anticoagulation for patients admitted to hospital with COVID-19 and elevated D-dimer concentration (ACTION): an open-label, multicentre, randomised, controlled trial. Lancet. 2021;397:2253–2263. doi: 10.1016/S0140-6736(21)01203-4. [DOI] [PMC free article] [PubMed] [Google Scholar]
- 15.INSPIRATION Investigators. Sadeghipour P., Talasaz A.H., Rashidi F., Sharif-Kashani B., Beigmohammadi M.T., Farrokhpour M., Sezavar S.H., Payandemehr P., Dabbagh A., et al. Effect of Intermediate-Dose vs Standard-Dose Prophylactic Anticoagulation on Thrombotic Events, Extracorporeal Membrane Oxygenation Treatment, or Mortality Among Patients With COVID-19 Admitted to the Intensive Care Unit: The INSPIRATION Randomized Clinical Trial. JAMA. 2021;325:1620–1630. doi: 10.1001/JAMA.2021.4152. [DOI] [PMC free article] [PubMed] [Google Scholar]
- 16.Fraser D.D., Patterson E.K., Slessarev M., Gill S.E., Martin C., Daley M., Miller M.R., Patel M.A., dos Santos C.C., Bosma K.J., et al. Endothelial Injury and Glycocalyx Degradation in Critically Ill Coronavirus Disease 2019 Patients: Implications for Microvascular Platelet Aggregation. Crit. Care Explor. 2020;2 doi: 10.1097/CCE.0000000000000194. [DOI] [PMC free article] [PubMed] [Google Scholar]
- 17.Goshua G., Pine A.B., Meizlish M.L., Chang C.-H., Zhang H., Bahel P., Baluha A., Bar N., Bona R.D., Burns A.J., et al. Endotheliopathy in COVID-19-associated coagulopathy: evidence from a single-centre, cross-sectional study. Lancet. Haematol. 2020;7:e575–e582. doi: 10.1016/S2352-3026(20)30216-7. [DOI] [PMC free article] [PubMed] [Google Scholar]
- 18.Rovas A., Osiaevi I., Buscher K., Sackarnd J., Tepasse P.-R., Fobker M., Kühn J., Braune S., Göbel U., Thölking G., et al. Microvascular dysfunction in COVID-19: the MYSTIC study. Angiogenesis. 2020;24:145–157. doi: 10.1007/S10456-020-09753-7. [DOI] [PMC free article] [PubMed] [Google Scholar]
- 19.Vassiliou A.G., Keskinidou C., Jahaj E., Gallos P., Dimopoulou I., Kotanidou A., Orfanos S.E. ICU Admission Levels of Endothelial Biomarkers as Predictors of Mortality in Critically Ill COVID-19 Patients. Cells. 2021;10:186. doi: 10.3390/CELLS10010186. [DOI] [PMC free article] [PubMed] [Google Scholar]
- 20.Taus F., Salvagno G., Canè S., Fava C., Mazzaferri F., Carrara E., Petrova V., Barouni R.M., Dima F., Dalbeni A., et al. Platelets Promote Thromboinflammation in SARS-CoV-2 Pneumonia. Arterioscler. Thromb. Vasc. Biol. 2020;40:2975–2989. doi: 10.1161/ATVBAHA.120.315175. [DOI] [PMC free article] [PubMed] [Google Scholar]
- 21.Manne B.K., Denorme F., Middleton E.A., Portier I., Rowley J.W., Stubben C., Petrey A.C., Tolley N.D., Guo L., Cody M., et al. Platelet gene expression and function in patients with COVID-19. Blood. 2020;136:1317–1329. doi: 10.1182/BLOOD.2020007214. [DOI] [PMC free article] [PubMed] [Google Scholar]
- 22.Hottz E.D., Azevedo-Quintanilha I.G., Palhinha L., Teixeira L., Barreto E.A., Pão C.R.R., Righy C., Franco S., Souza T.M.L., Kurtz P., et al. Platelet activation and platelet-monocyte aggregate formation trigger tissue factor expression in patients with severe COVID-19. Blood. 2020;136:1330–1341. doi: 10.1182/BLOOD.2020007252. [DOI] [PMC free article] [PubMed] [Google Scholar]
- 23.Léopold V., Pereverzeva L., Schuurman A.R., Reijnders T.D.Y., Saris A., de Brabander J., van Linge C.C.A., Douma R.A., Chouchane O., Nieuwland R., et al. Platelets are Hyperactivated but Show Reduced Glycoprotein VI Reactivity in COVID-19 Patients. Thromb. Haemost. 2021;121:1258–1262. doi: 10.1055/A-1347-5555. [DOI] [PubMed] [Google Scholar]
- 24.Combes A.J., Courau T., Kuhn N.F., Hu K.H., Ray A., Chen W.S., Chew N.W., Cleary S.J., Kushnoor D., Reeder G.C., et al. Global absence and targeting of protective immune states in severe COVID-19. Nature. 2021;591:124–130. doi: 10.1038/s41586-021-03234-7. [DOI] [PMC free article] [PubMed] [Google Scholar]
- 25.Goshua G., Butt A., Lee A.I. Immunothrombosis: a COVID-19 concerto. Br. J. Haematol. 2021;194:491–493. doi: 10.1111/BJH.17666. [DOI] [PubMed] [Google Scholar]
- 26.Li H., Deng Y., Li Z., Dorken Gallastegi A., Mantzoros C.S., Frydman G.H., Karniadakis G.E. Multiphysics and multiscale modeling of microthrombosis in COVID-19. PLoS Comput. Biol. 2022;18 doi: 10.1371/journal.pcbi.1009892. [DOI] [PMC free article] [PubMed] [Google Scholar]
- 27.Finsterbusch M., Schrottmaier W.C., Kral-Pointner J.B., Salzmann M., Assinger A. Measuring and interpreting platelet-leukocyte aggregates. Platelets. 2018;29:677–685. doi: 10.1080/09537104.2018.1430358. [DOI] [PMC free article] [PubMed] [Google Scholar]
- 28.Irving P.M., Macey M.G., Feakins R.M., Knowles C.H., Frye J.N., Liyanage S.H., Dorudi S., Williams N.S., Rampton D.S. Platelet-leucocyte aggregates form in the mesenteric vasculature in patients with ulcerative colitis. Eur. J. Gastroenterol. Hepatol. 2008;20:283–289. doi: 10.1097/MEG.0B013E3282F246C2. [DOI] [PubMed] [Google Scholar]
- 29.Zachem C.R., Alpers C.E., Way W., Shankland S.J., Couser W.G., Johnson R.J. A role for P-selectin in neutrophil and platelet infiltration in immune complex glomerulonephritis. J. Am. Soc. Nephrol. 1997;8:1838–1844. doi: 10.1681/ASN.V8121838. [DOI] [PubMed] [Google Scholar]
- 30.Swanepoel A.C., Pretorius E. Erythrocyte–Platelet Interaction in Uncomplicated Pregnancy. Microsc. Microanal. 2014;20:1848–1860. doi: 10.1017/S1431927614013518. [DOI] [PubMed] [Google Scholar]
- 31.Wun T., Paglieroni T., Tablin F., Welborn J., Nelson K., Cheung A. Platelet activation and platelet-erythrocyte aggregates in patients with sickle cell anemia. J. Lab. Clin. Med. 1997;129:507–516. doi: 10.1016/S0022-2143(97)90005-6. [DOI] [PubMed] [Google Scholar]
- 32.Vallés J., Santos M.T., Aznar J., Martínez M., Moscardó A., Piñón M., Broekman M.J., Marcus A.J. Platelet-erythrocyte interactions enhance αIIbβ3 integrin receptor activation and P-selectin expression during platelet recruitment: down-regulation by aspirin ex vivo. Blood. 2002;99:3978–3984. doi: 10.1182/BLOOD.V99.11.3978. [DOI] [PubMed] [Google Scholar]
- 33.Beck Z., Jagodzinski L.L., Eller M.A., Thelian D., Matyas G.R., Kunz A.N., Alving C.R. Platelets and Erythrocyte-Bound Platelets Bind Infectious HIV-1 in Plasma of Chronically Infected Patients. PLoS One. 2013;8 doi: 10.1371/JOURNAL.PONE.0081002. [DOI] [PMC free article] [PubMed] [Google Scholar]
- 34.Pretini V., Koenen M.H., Kaestner L., Fens M.H.A.M., Schiffelers R.M., Bartels M., Van Wijk R. Red Blood Cells: Chasing Interactions. Front. Physiol. 2019;10:945. doi: 10.3389/FPHYS.2019.00945. [DOI] [PMC free article] [PubMed] [Google Scholar]
- 35.Puhr-Westerheide D., Schink S.J., Fabritius M., Mittmann L., Hessenauer M.E.T., Pircher J., Zuchtriegel G., Uhl B., Holzer M., Massberg S., et al. Neutrophils promote venular thrombosis by shaping the rheological environment for platelet aggregation. Sci. Rep. 2019;9:15932–16013. doi: 10.1038/s41598-019-52041-8. [DOI] [PMC free article] [PubMed] [Google Scholar]
- 36.Rapkiewicz A.V., Mai X., Carsons S.E., Pittaluga S., Kleiner D.E., Berger J.S., Thomas S., Adler N.M., Charytan D.M., Gasmi B., et al. Megakaryocytes and platelet-fibrin thrombi characterize multi-organ thrombosis at autopsy in COVID-19: A case series. EClinicalMedicine. 2020;24 doi: 10.1016/j.eclinm.2020.100434. [DOI] [PMC free article] [PubMed] [Google Scholar]
- 37.Kaplan M.J., Radic M. Neutrophil Extracellular Traps: Double-Edged Swords of Innate Immunity. J. Immunol. 2012;189:2689–2695. doi: 10.4049/JIMMUNOL.1201719. [DOI] [PMC free article] [PubMed] [Google Scholar]
- 38.Laridan E., Martinod K., De Meyer S. Neutrophil Extracellular Traps in Arterial and Venous Thrombosis. Semin. Thromb. Hemost. 2019;45:086–093. doi: 10.1055/S-0038-1677040. [DOI] [PubMed] [Google Scholar]
- 39.Jadhav S., Eggleton C.D., Konstantopoulos K. A 3-D Computational Model Predicts that Cell Deformation Affects Selectin-Mediated Leukocyte Rolling. Biophys. J. 2005;88:96–104. doi: 10.1529/biophysj.104.051029. [DOI] [PMC free article] [PubMed] [Google Scholar]
- 40.Zhelev D.V., Needham D., Hochmuth R.M. Role of the membrane cortex in neutrophil deformation in small pipets. Biophys. J. 1994;67:696–705. doi: 10.1016/S0006-3495(94)80529-6. [DOI] [PMC free article] [PubMed] [Google Scholar]
- 41.Abdulnour R.-E.E., Gunderson T., Barkas I., Timmons J.Y., Barnig C., Gong M., Kor D.J., Gajic O., Talmor D., Carter R.E., Levy B.D. Early Intravascular Events Are Associated with Development of Acute Respiratory Distress Syndrome. A Substudy of the LIPS-A Clinical Trial. Am. J. Respir. Crit. Care Med. 2018;197:1575–1585. doi: 10.1164/rccm.201712-2530OC. [DOI] [PMC free article] [PubMed] [Google Scholar]
- 42.Yuan Y., Alwis I., Wu M.C.L., Kaplan Z., Ashworth K., Bark D., Jr., Pham A., Mcfadyen J., Schoenwaelder S.M., Josefsson E.C., et al. Neutrophil macroaggregates promote widespread pulmonary thrombosis after gut ischemia. Sci. Transl. Med. 2017;9 doi: 10.1126/scitranslmed.aam5861. [DOI] [PubMed] [Google Scholar]
- 43.Yang S., Huang X., Liao J., Li Q., Chen S., Liu C., Ling L., Zhou J. Platelet-leukocyte aggregates - a predictor for acute kidney injury after cardiac surgery. Ren. Fail. 2021;43:1155–1162. doi: 10.1080/0886022X.2021.1948864. [DOI] [PMC free article] [PubMed] [Google Scholar]
- 44.Pamuk G.E., Vural Ö., Turgut B., Demir M., Ümit H., Tezel A. Increased circulating platelet–neutrophil, platelet–monocyte complexes, and platelet activation in patients with ulcerative colitis: A comparative study. Am. J. Hematol. 2006;81:753–759. doi: 10.1002/ajh.20655. [DOI] [PubMed] [Google Scholar]
- 45.Knight R., Walker V., Ip S., Cooper J.A., Bolton T., Keene S., Denholm R., Akbari A., Abbasizanjani H., Torabi F., et al. Association of COVID-19 With Major Arterial and Venous Thrombotic Diseases: A Population-Wide Cohort Study of 48 Million Adults in England and Wales. Circulation. 2022;146:892–906. doi: 10.1161/CIRCULATIONAHA.122.060785. [DOI] [PMC free article] [PubMed] [Google Scholar]
- 46.Fedosov D.A., Caswell B., Karniadakis G.E. Systematic coarse-graining of spectrin-level red blood cell models. Comput. Methods Appl. Mech. Eng. 2010;199:1937–1948. doi: 10.1016/j.cma.2010.02.001. [DOI] [PMC free article] [PubMed] [Google Scholar]
- 47.Yazdani A., Karniadakis G.E. Sub-cellular modeling of platelet transport in blood flow through microchannels with constriction. Soft Matter. 2016;12:4339–4351. doi: 10.1039/C6SM00154H. [DOI] [PMC free article] [PubMed] [Google Scholar]
- 48.Lei H., Karniadakis G.E. Probing vasoocclusion phenomena in sickle cell anemia via mesoscopic simulations. Proc. Natl. Acad. Sci. USA. 2013;110:11326–11330. doi: 10.1073/pnas.1221297110. [DOI] [PMC free article] [PubMed] [Google Scholar]
- 49.Chang H.-Y., Yazdani A., Li X., Douglas K.A.A., Mantzoros C.S., Karniadakis G.E. Quantifying Platelet Margination in Diabetic Blood Flow. Biophys. J. 2018;115:1371–1382. doi: 10.1016/j.bpj.2018.08.031. [DOI] [PMC free article] [PubMed] [Google Scholar]
- 50.Schmid-Schönbein G.W., Shih Y.Y., Chien S. Morphometry of Human Leukocytes. Blood. 1980;56:866–875. doi: 10.1182/blood.V56.5.866.866. [DOI] [PubMed] [Google Scholar]
- 51.Downey G.P., Doherty D.E., Schwab B., 3rd, Elson E.L., Henson P.M., Worthen G.S. Retention of leukocytes in capillaries: role of cell size and deformability. J. Appl. Physiol. 1990;69:1767–1778. doi: 10.1152/jappl.1990.69.5.1767. [DOI] [PubMed] [Google Scholar]
- 52.Deng Y., Papageorgiou D.P., Li X., Perakakis N., Mantzoros C.S., Dao M., Karniadakis G.E. Quantifying Fibrinogen-Dependent Aggregation of Red Blood Cells in Type 2 Diabetes Mellitus. Biophys. J. 2020;119:900–912. doi: 10.1016/j.bpj.2020.07.026. [DOI] [PMC free article] [PubMed] [Google Scholar]
- 53.Reglin B., Pries A.R. Metabolic Control of Microvascular Networks: Oxygen Sensing and Beyond. J. Vasc. Res. 2014;51:376–392. doi: 10.1159/000369460. [DOI] [PubMed] [Google Scholar]
- 54.Balogh P., Bagchi P. Direct Numerical Simulation of Cellular-Scale Blood Flow in 3D Microvascular Networks. Biophys. J. 2017;113:2815–2826. doi: 10.1016/j.bpj.2017.10.020. [DOI] [PMC free article] [PubMed] [Google Scholar]
- 55.Sherman T.F. On connecting large vessels to small. The meaning of Murray’s law. J. Gen. Physiol. 1981;78:431–453. doi: 10.1085/jgp.78.4.431. [DOI] [PMC free article] [PubMed] [Google Scholar]
- 56.Pries A.R., Secomb T.W., Gaehtgens P. Structural adaptation and stability of microvascular networks: theory and simulations. Am. J. Physiol. 1998;275:H349–H360. doi: 10.1152/ajpheart.1998.275.2.H349. [DOI] [PubMed] [Google Scholar]
- 57.Lipowsky H.H., Kovalcheck S., Zweifach B.W. The Distribution of Blood Rheological Parameters in the Microvasculature of Cat Mesentery. Circ. Res. 1978;43:738–749. doi: 10.1161/01.RES.43.5.738. [DOI] [PubMed] [Google Scholar]
- 58.Newson R. Confidence Intervals for Rank Statistics: Somers’ D and Extensions. STATA J. 2006;6:309–334. doi: 10.1177/1536867X0600600302. [DOI] [Google Scholar]
Associated Data
This section collects any data citations, data availability statements, or supplementary materials included in this article.
Supplementary Materials
Data Availability Statement
-
•
Data collected for this study includes confidential protected health information and therefore cannot be uploaded to a public repository. To request access, contact Galit H Frydman, DVM ScD (gfrydman@mit.edu).
-
•
All original code is available in Data S1/Methods S1 (supplemental material 4).
-
•
Any additional information required to reanalyze the data reported in this paper is available from the lead contact upon request.