

SUMMARY
Gap junction channels (GJCs) mediate intercellular communication and are gated by numerous conditions such as pH. The electron cryomicroscopy (cryo-EM) structure of Cx26 GJC at physiological pH recapitulates previous GJC structures in lipid bilayers. At pH 6.4, we identify two conformational states, one resembling the open physiological-pH structure and a closed conformation that displays six threads of density, that join to form a pore-occluding density. Crosslinking and hydrogen-deuterium exchange mass spectrometry reveal closer association between the N-terminal (NT) domains and the cytoplasmic loops (CL) at acidic pH. Previous electrophysiologic studies suggest an association between NT residue N14 and H100 near M2, which may trigger the observed movement of M2 toward M1 in our cryo-EM maps, thereby accounting for additional NT-CL crosslinks at acidic pH. We propose that these pH-induced interactions and conformational changes result in extension, ordering, and association of the acetylated NT domains to form a hexameric “ball-and-chain” gating particle.
Graphical Abstract

In Brief
During tissue injury, acidic pH blocks gap junction channel intercellular communication. Khan et al. use cryo-EM and mass spectrometry to show that acidification causes extension, ordering, and association of the N-terminal domains to form a hexameric gating particle that sterically occludes the human Cx26 gap junction channel pore.
INTRODUCTION
Connexins (Cxs) are a family of integral membrane proteins found in all vertebrate organisms. All Cx isoforms share a common topology with four α-helical transmembrane (TM) domains (M1–M4), two extracellular loops (E1 and E2), a cytoplasmic (CL) M2–M3 loop, and cytoplasmic amino-tail (NT) and car-boxy-tail (CT) domains. The M1–M4 and E1–E2 domains are the most conserved among Cxs, whereas the sequences of flexible CL, NT, and CT domains are highly variable. Cxs assemble to form hexameric connexons or hemichannels, which form do-decameric gap junction channels (GJCs) by end-to-end docking of the hemichannels from adjacent cells. The E1 and E2 loops form the extracellular domain that mediates docking between hemichannels (Abascal and Zardoya, 2013; Bao et al., 2004; Foote et al., 1998; Sosinsky and Nicholson, 2005; Yeager, 2009; Yeager and Harris, 2007; Yeager and Nicholson, 1996).
GJCs have ~15-Å diameter aqueous pore that enables intercellular communication within tissues (Bennett et al., 2016; Fleishman et al., 2004; Maeda et al., 2009; Oshima et al., 2007, 2011; Unger et al., 1999) that is indispensable to the functioning of many physiological processes (Harris, 2018; Lo, 1996). GJCs enable direct cell-to-cell exchange of small molecules, such as hydrated ions (e.g., Ca2+), second messengers (e.g., cAMP and IP3), intracellular metabolites (e.g., glucose and ATP), and small peptides (Evans and Martin, 2002; Gossman and Zhao, 2008; Harris, 2001; Kanaporis et al., 2008; Majumder et al., 2010; Nielsen et al., 2012). In addition to mediating chemical coupling, GJCs connect cells electrically by functioning as high conductance ion channels (Bennett and Zukin, 2004). GJCs are regulated by TM potential (Vm gating) (Bukauskas and Verselis, 2004), transjunctional voltage (Vj gating) (Bukauskas and Verselis, 2004), pH (Nielsen et al., 2012), phosphorylation (Johnstone et al., 2009), membrane lipids and membrane-active agents (Locke and Harris, 2009), and divalent cations, such as Ca2+, Zn2+, and Mg2+ (Iwatsuki and Petersen, 1977; Palacios-Prado et al., 2014; Sun et al., 2009).
Acidic pH decreases junctional conductance (Iwatsuki and Petersen, 1979; Spray et al., 1981; Turin and Warner, 1980) in glial, lens, and neuronal GJCs (Connors et al., 1984; Schuetze and Goodenough, 1982) and decreases electrical coupling between cells in the working myocardium and in Purkinje fibers (Burt, 1987; Noma and Tsuboi, 1987; Reber and Weingart, 1982; Spray and Burt, 1990). GJCs are believed to undergo a “ball-and-chain” mechanism of closure similar to that of voltage-gated Na+ and K+ channels (Armstrong and Bezanilla, 1977; Zagotta et al., 1990). This hypothesis was first established in studies of Cx43 where C-terminal truncation at residue 257 (Liu et al., 1993) eliminated uncoupling induced at acidic pH. Uncoupling between GJCs was restored by coexpression of the CT as a separate peptide (Ek-Vitorín et al., 1996). However, truncation of the Cx26 CT does not affect pH gating (Locke and Harris, 2009). Because Cx26 is highly sensitive to pH (Francis et al., 1999; Liu et al., 1993) and has been extensively studied by us and others, we chose this isoform as our model system to study the molecular determinants of pH regulation in GJCs. Evidence for a particle receptor model of Cx26 gating was first suggested by electron cryocrystallography of 2D crystals of the M34A mutant of Cx26, which revealed a prominent density in the pore, ascribed to the NT domains (Oshima et al., 2007). Our studies using electron cryomicroscopy (cryo-EM) and mass spectrometry revealed that acidic pH causes extension, ordering, and association of the acetylated N-terminal domains to form a hexameric ball-and-chain gating particle within each hemichannel of the human Cx26 GJC. These results will be relevant for the pursuit of GJCs as therapeutic targets in tissue injury, wound healing, and oncology (Laird and Lampe, 2018).
RESULTS
Acidic pH Stabilizes a Conformation of the Cx26 GJC with a Pore Occlusion
The 3D crystallization trials of Cx26 GJCs at acidic pH using previous conditions for examining Ca2+-mediated gating (Bennett et al., 2016) yielded poorly diffracting crystals. Hence, we pursued single-particle cryo-EM and image analysis of Cx26 GJCs solubilized in the membrane mimetic amphipol A8–35 at pH 7.5 (Table S1). A 3D reconstruction with applied D6 symmetry had an overall resolution of 4 Å by using the gold-standard Fourier Shell Correlation (FSC) (Figures 1A, 1B, and S1G). The local resolution within the TM and extracellular domains was ~3.5 Å, and amino acid side chains were well defined (Figures 1A, 1B, S1E, and S1F). Lower map resolution in the cytoplasmic regions suggested conformational flexibility. In general, the cryo-EM structure recapitulated that of the Cx43 channel in native lipid bilayers (Fleishman et al., 2004; Unger et al., 1999; Figures 1A, 1B, and S2A–S2F) and previous Cx26 GJC X-ray structures (Figures 1A, 1B, and S2G–S2I; Bennett et al., 2016; Maeda et al., 2009).
Figure 1. Cryo-EM Structures of the Human Recombinant Cx26 GJC in Amphipol A8–35.
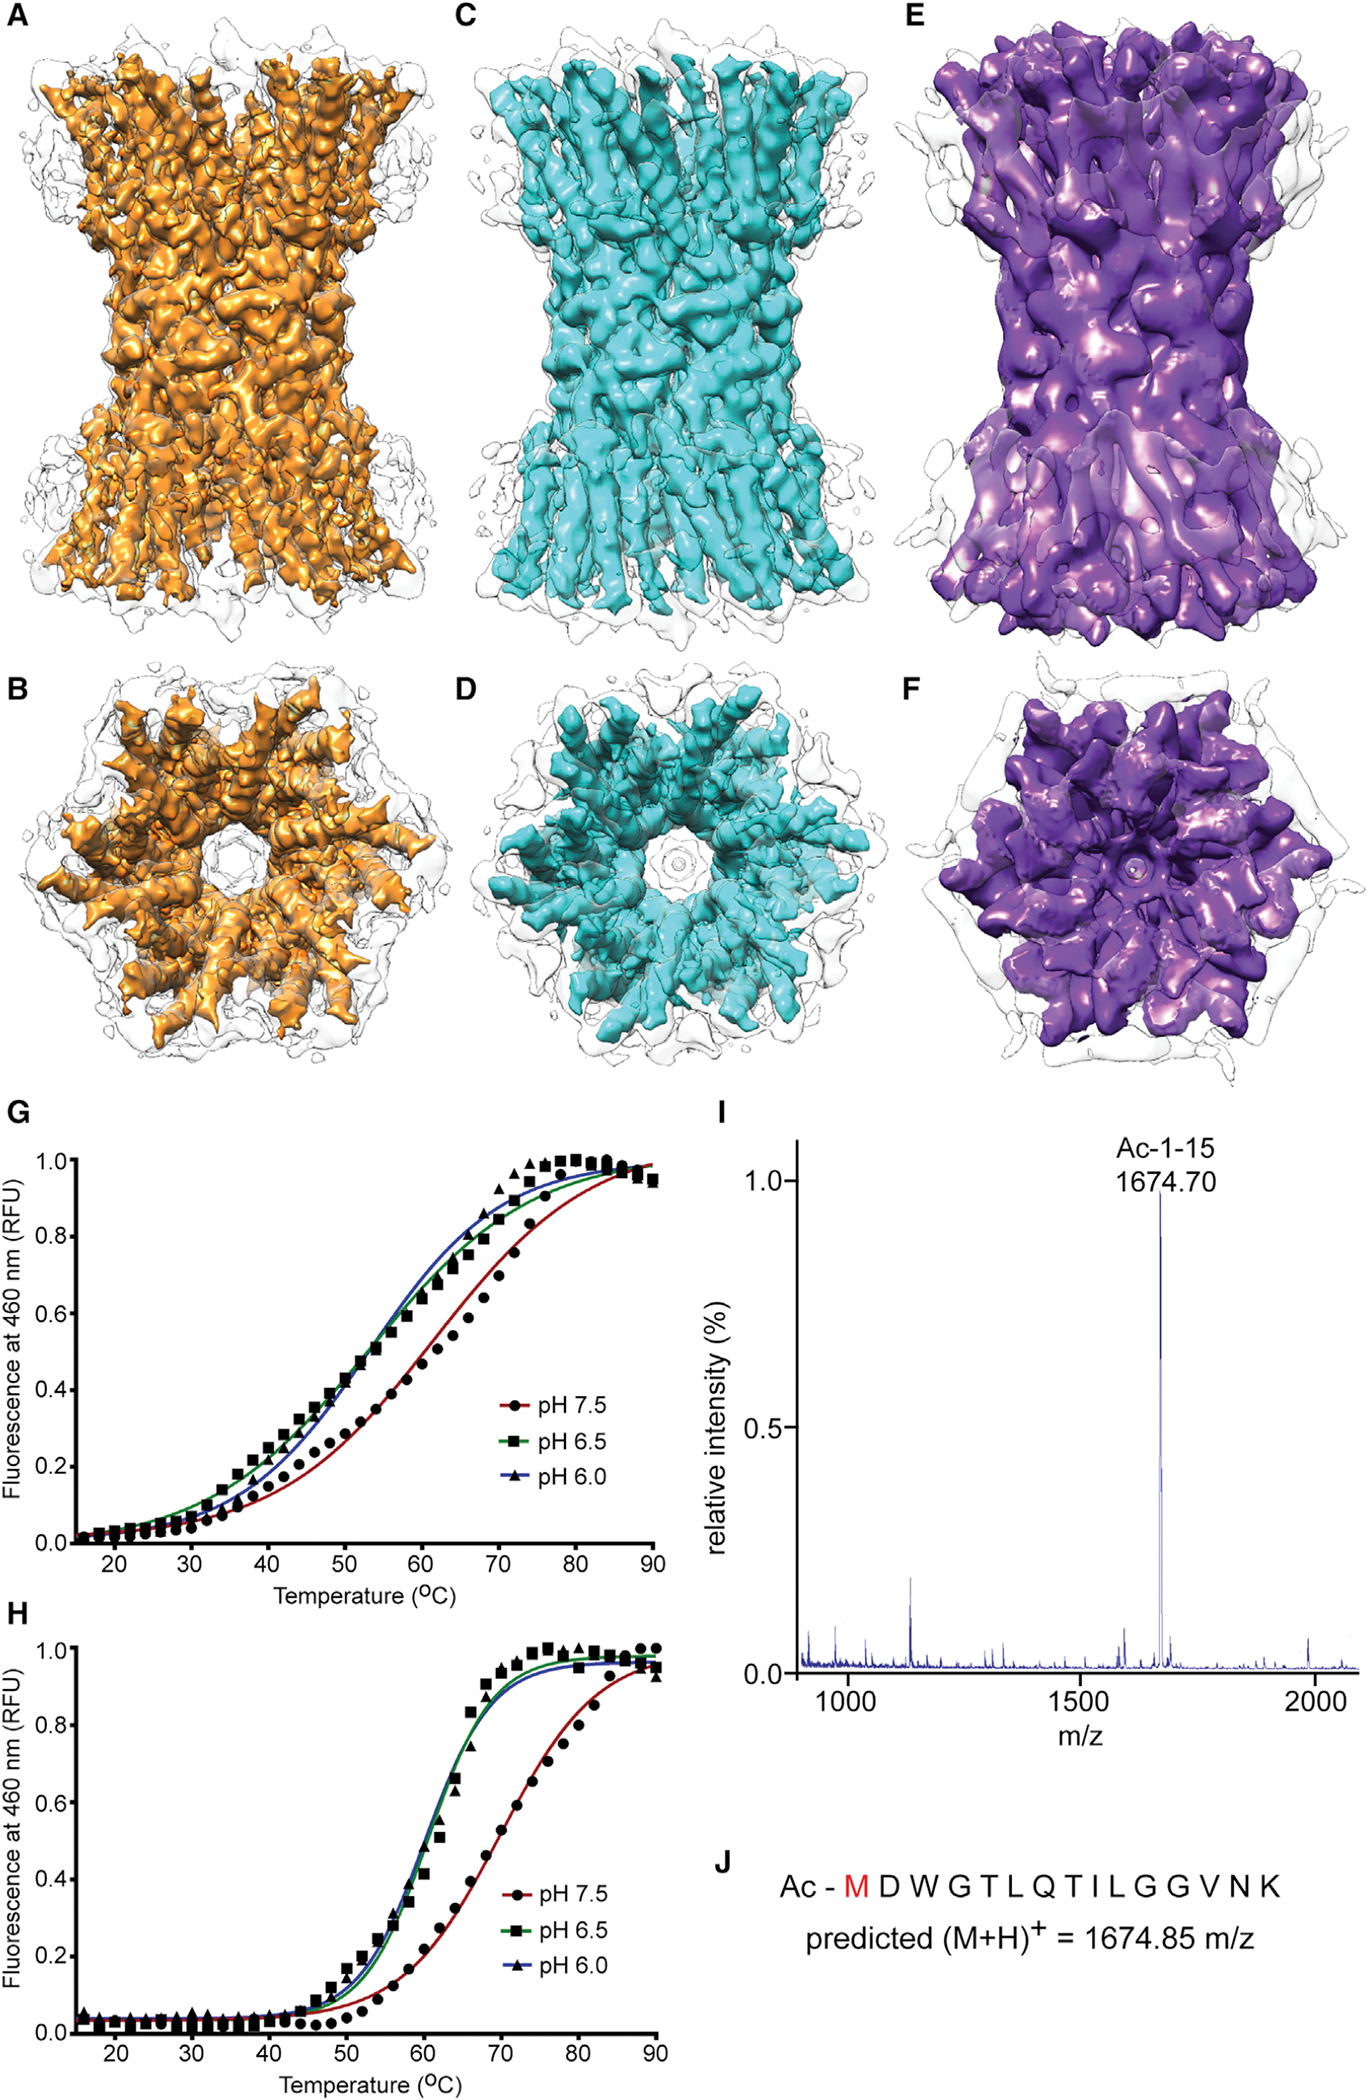
(A–F) Side view (parallel to the membrane) and cytoplasmic view of the open physiologic pH structure (A and B), open acidic pH structure (C and D), and occluded acidic pH structure (E and F). Colored maps (A–D) represent sharpened densities, whereas colored maps (E) and (F) were not subjected to sharpening. Amphipol density (gray contours) was removed from all colored maps. In maps (B) and (D), uncolored broken densities in the center of the pore presumably result from partial occupancy of the NTs in the pore-occluding density.
(G and H) Fluorescent thermal stability assay shows that the human Cx26 GJC is more stable at pH 7.5 than acidic pH. Thermal stability of Cx26 GJCs was measured by the fluorescence of a cysteine-reactive, coumarin-based dye (CPM) over a temperature gradient (15°C to 90°C). The Tm was calculated from the Boltzmann fit of each curve. (G) Stability in DDM (n-Dodecyl-b-D-Maltopyranoside): Tm = 60°C (pH 7.5), 52°C (pH 6.5), and 52°C (pH 6.0). (H) Stability in amphipol A8–35: Tm = 69°C (pH 7.5), 60°C (pH 6.5), and 59°C (pH 6.0).
(I) Mass spectrometry analysis of the trypsin-digested human Cx26 GJC indicating that the N-terminal residue is acetylated.
(J) Observed mass of the N-terminal peptide (1,674.70 m/z) is nearly identical to the predicted mass of the acetylated N-terminal peptide (1,674.85 m/z).
We also performed EM analysis of Cx26 at pH 6.4, which is sufficiently acidic to induce channel closure (Locke et al., 2011; Sanchez et al., 2014). A 3D reconstruction from negatively stained Cx26 GJCs revealed a central density within the pore of each hemichannel (Figures S3C and S3E). Cryo-EM of Cx26 GJCs incubated at pH 6.4 prior to vitrification yielded both open and closed conformations, in equally populated 3D classes (Figures 1C–1F and S3M). The open conformation refined to an overall resolution of 4.2 Å (Figures 1C, 1D, and S3N) and closely resembled the physiological-pH structure (compare Figures 1A and 1B with Figures 1C and 1D). The closed conformation refined to a resolution of 7.5 Å (Figures 1E, 1F, and S3N). The lower resolution at acidic pH is consistent with reduced thermos-stability compared with physiological pH (melting temperature [Tm] of 69° at pH 7.5 versus 60° at pH 6.5) (Figures 1G and 1H). This is consistent with observed sample aggregation with prolonged incubation at pH 6.4. Hence, the incubation time was adjusted to have a sufficient number of particles for image analysis (Figures 1C–1F and S3G). This likely accounts for the presence of open and closed conformations in the same specimen. Our models display a good fit into their corresponding densities in the regions covering helices M1 through M4 and extracellular loops E1 and E2. These regions are the best resolved, and sidechain densities were readily interpreted in the open conformations at pH 7.5 (Figures 2A–2D) and pH 6.4 (Figures 2E–2H). The lower resolution of the closed, low pH structure only allowed threading of the density on the basis of the higher resolution maps (Figures 2I–2L).
Figure 2. Analysis of Human Cx26 Cryo-EM Maps and Atomic Models at Physiologic and Acidic pH.
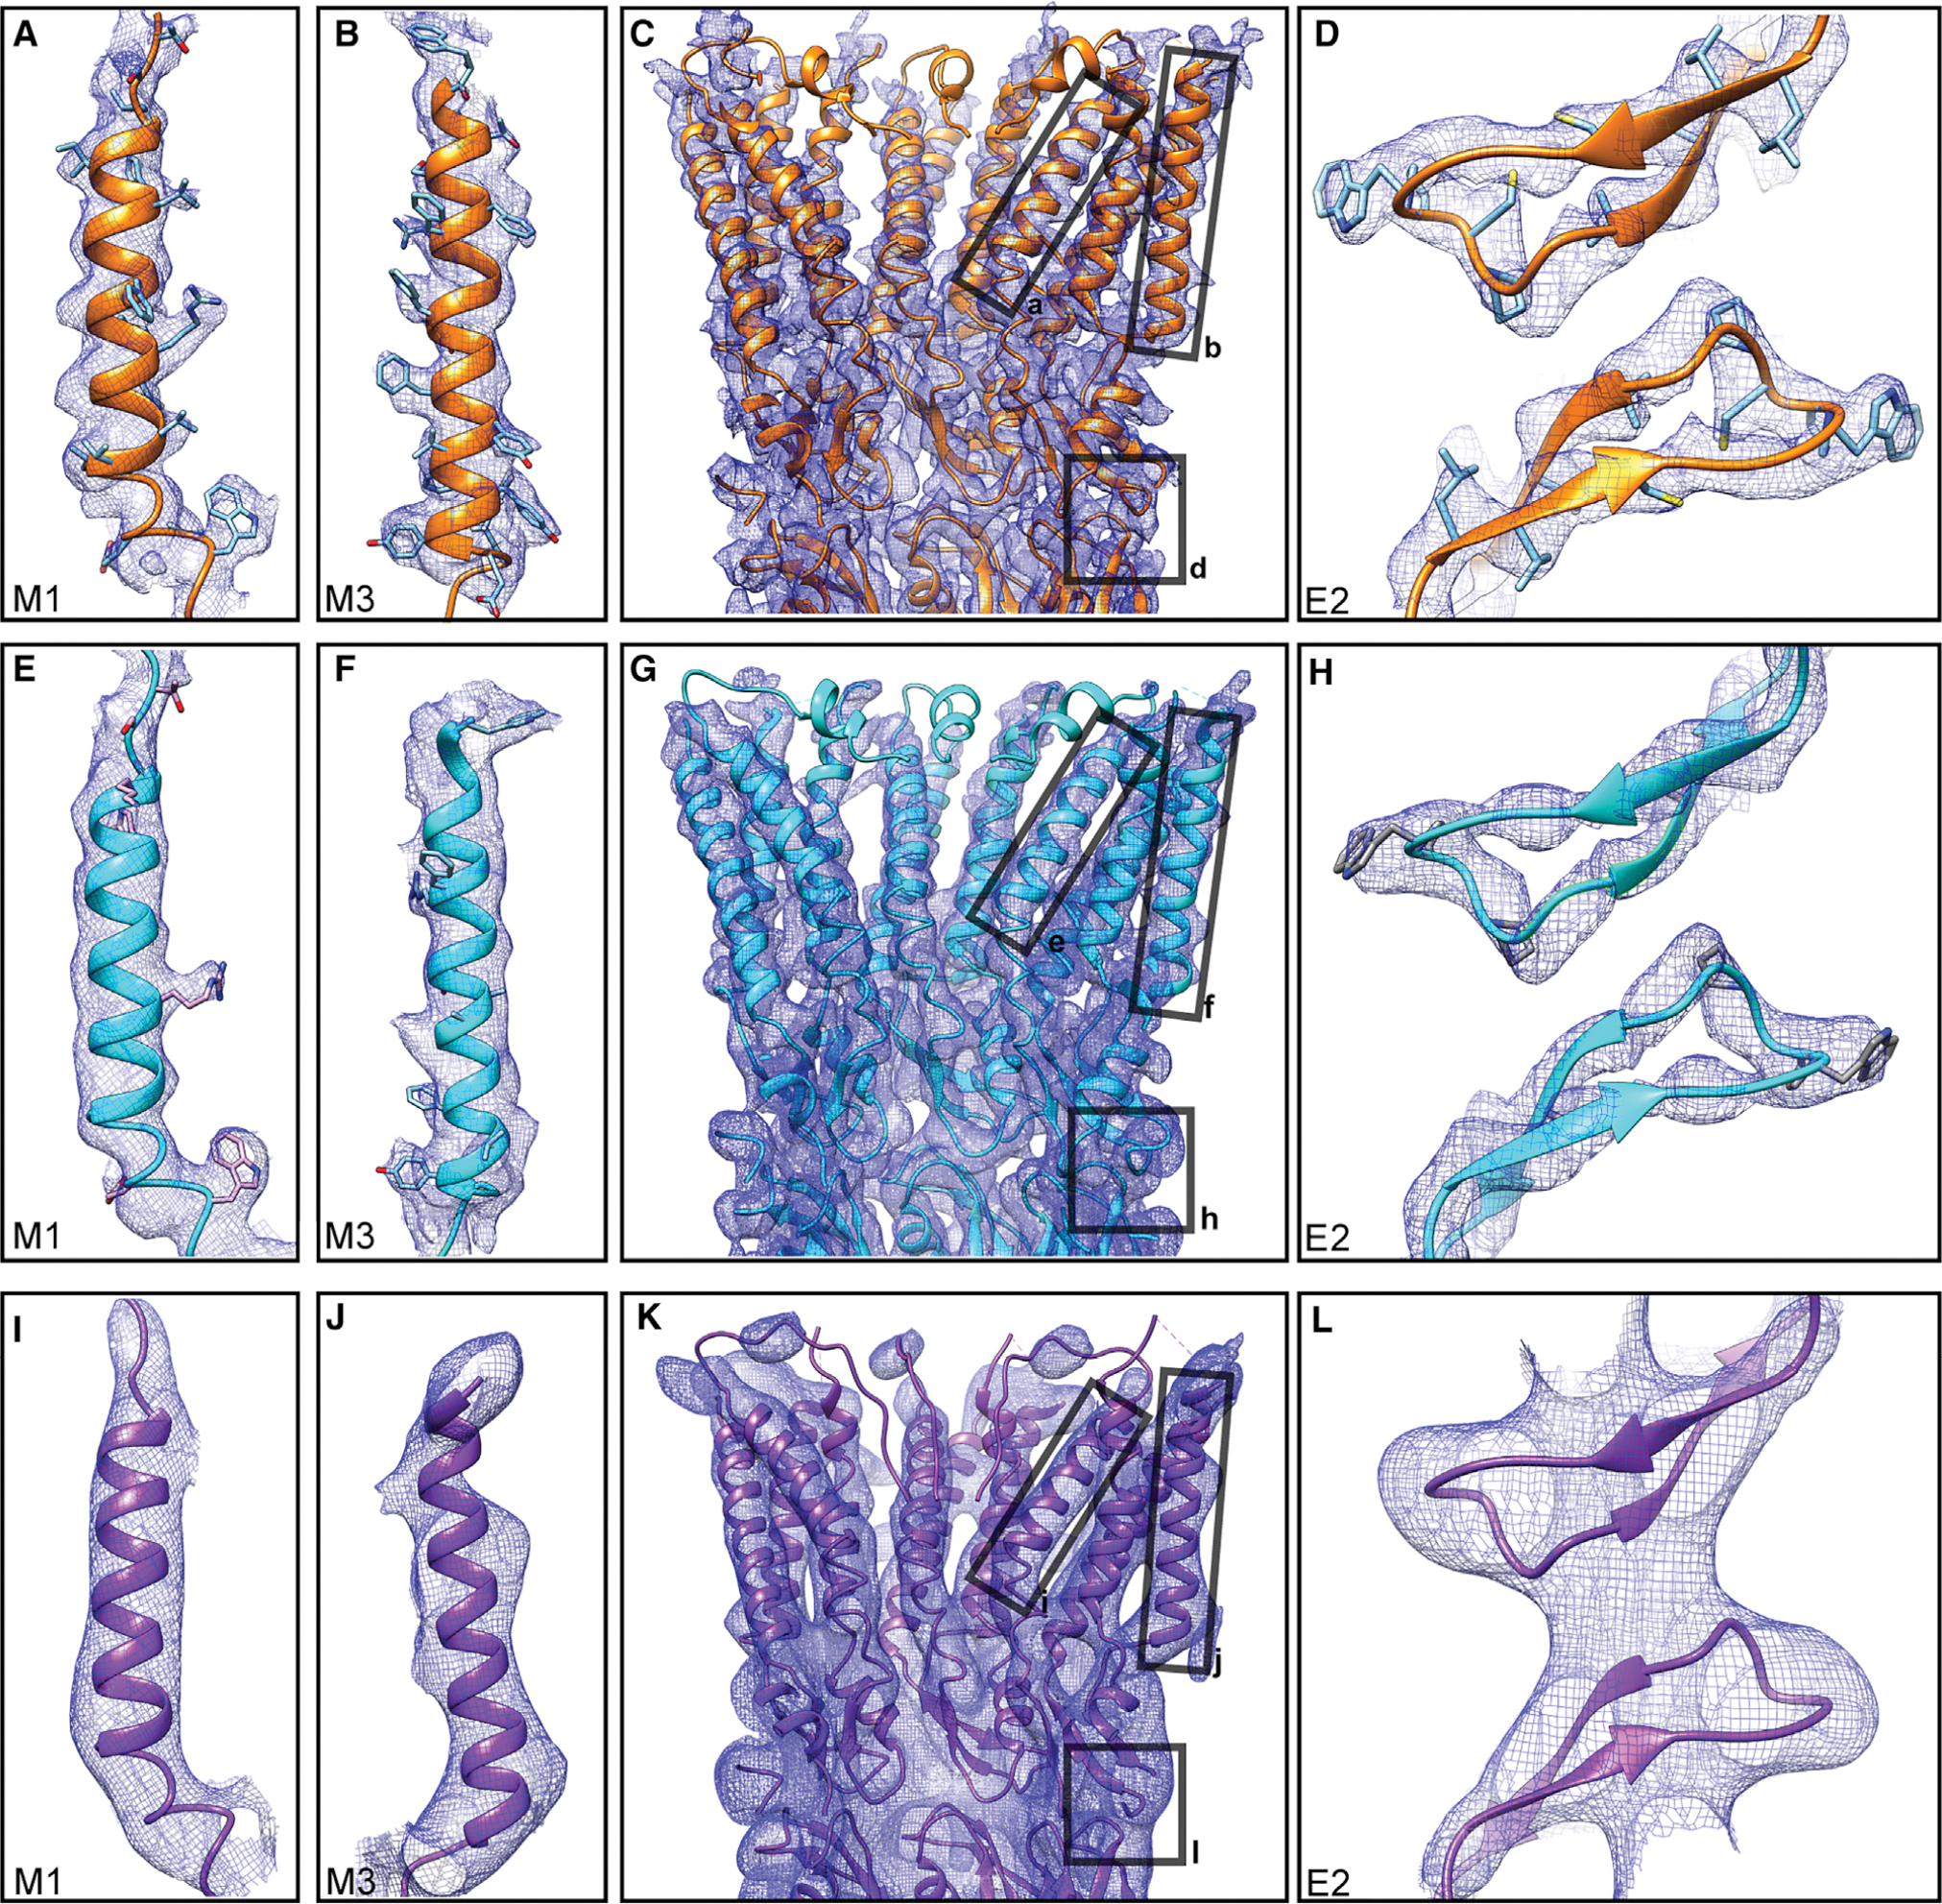
(A–D) Analysis of physiologic pH open GJC structure at 4-Å overall resolution. Cross-sectional view (C); a subsection of the extracellular gap region, showing E2 domains from two monomers from two apposed hemichannels (D); a close-up of M1 helix (A) and M3 helix (B).
(E–L) Analogous views of the acidic pH open GJC structure at 4.2-Å resolution (E, M1; F, M3; G, cross-sectional; H, E2) and the acidic pH closed GJC structure at 7.5-Å resolution (I, M1; J, M3; K, cross-sectional; L, E2). Contour levels adjusted individually on a per-image basis. Masking and sharpening procedures were applied to physiologic pH and acidic pH open maps. Amino-acid side chains in (D), (H), and (I) are shown for visual purposes only and are not uniquely defined in a map at 7.5-Å resolution.
We assign discrete tubular densities residing adjacent to the M1 helices within the pore of the open structures at pH 7.5 (Figures 3A and 3D) and pH 6.4 (Figures 3B and 3E) as the α-helical region of the NT domains. These features are retained in maps calculated at the lower resolution of the closed conformation (7.5 Å) (compare Figures 3A, 3B, 3D, and 3E with S5A, S5B, S5D, and S5E). These helices are replaced by extended threads of density at pH 6.4 (Figures 3C and 3F). We discerned that the threads of density are not α helical because the N tails need to be fully extended to conform to the full length of the threads of density. In addition, the six threads terminate in a pore-occluding, globular density. The lower resolution of the map at acidic pH precludes unambiguous assignment of amino acid residues within the threads and globular domains. Nevertheless, we can exclude both the CL and CT. The CTs ending with polyhistidine tags in our Cx26 construct are too short to occupy the thread and gating particle. In addition, we expect that the polyhistidine tags would cause repulsion between the CTs, preventing association to form the pore-occluding density. The CL is long enough to accommodate the occlusion, but in such a scenario, we would expect to observe 12 connecting densities, but our model only shows 6 threads that are too narrow to accommodate more than a single polypeptide chain (Figure 3F). Another possibility is that only three CLs participate in gating, but the application of D6 symmetry to the map would weaken the signal of the threads rather than strengthen them, as we observe.
Figure 3. Analysis of Cryo-EM Maps and Models Showing pH Gating of the Human Cx26 GJC Is Mediated Sterically by Association of the NT Domains.

End-on views of Cx26 hemichannel from the cytoplasmic side extending to the end of transmembrane helices at the extracellular gap; pH 7.5 open structure (A), pH 6.4 open structure (B), and pH 6.4 occluded structure (C). Tilted cross-section views of Cx26 hemichannel showing the organization of three monomers; pH 7.5 open structure (D), pH 6.4 open structure (E), and pH 6.4 occluded structure (F). Shown are M1 helix (red), M2 helix (green), M3 helix (blue), M4 helix (yellow), NT domain 1–15 amino acid (aa) (orange), cryo-EM densities (transparent light gray), and NT densities (transparent orange). To aid in interpretation, helices M1 and M4 of the central monomer in (G) were not colored. Maps are displayed at 4 σ and are shown without masking or sharpening, at resolutions of 4.4 Å (pH 7.5 open), 4.5 Å (pH 6.4 open), and 7.5 Å (pH 6.4 closed). (G) C6 symmetry refinement shows the “ball-and-chain” densities (gray) in both hemichannels. D2 (H), D3 (I), and D6 (J) refinements show six chains attached to the ball. Dotted lines roughly demarcate the symmetry axis, and the red asterisk (*) specifies each chain density within a single asymmetric unit of the plug. The D2 symmetry axis is parallel with the page.
To examine the effect of imposed D6 symmetry, we refined the occluded structure by using C6, D2, and D3 symmetry (Figures 3G–3I). Refinement with C6 symmetry, in which the 2-fold symmetry axis parallel to the membrane is removed, revealed a pore-occluding density in both hemichannels (compare Figures 3C, 3F, and 3J with 3G). Maps calculated with D2 and D3 symmetry still displayed six connecting threads of density with a central occlusion in each hemichannel (compare Figures 3C, 3F, and 3J with 3H and 3I). Therefore, it is unlikely that the observed pore-occluding density is an artifact of the applied D6 symmetry. Our interpretation is that all six subunits of each hemichannel contribute to the pore-occluding density.
Trypsin digestion and tandem mass spectrometry (MS/MS) demonstrated that the NT is acetylated (Figures 1I and 1J). On the basis of a partial specific volume of 0.74 cm3/g, the expected volume of six acetylated NTs (residues 1–14) is ~11 × 103 Å3. At a contour level of 4σ, the six connecting threads and pore-occluding density in the closed structure at pH 6.4 has a volume of ~8.4 × 10³ Å3. This volume is too large to represent the amphipol membrane mimetic (9 kDa) or any buffer components but is in good agreement with the predicted volume of six NTs. The connecting threads and occluding plug of density are, thus, most likely comprised of six NTs.
Hydrogen Deuterium Exchange (HDX) and the cryo-EM Maps Reveal Dynamic NTs
As noted, the channels are more unstable at acidic pH (Figures 1G and 1H), and consequently, the overall resolution of the map of the closed conformation (7.5 Å) was substantially lower than the open conformation (4 Å). Likewise, the density that we assign to the N tails, as well as the CL and CT domains, was not resolved at high resolution (Figures 1A–1F, 2, and 3). Consequently, we used HDX and cross-linking mass spectrometry as an independent approach to examine pH-dependent conformational changes of these regions. HDX mass spectrometry showed that several regions of Cx26 displayed decreased exchange with deuterium at acidic pH. Interestingly, M1/E1 residues 37–50 and M3/CL residues 121–132 displayed the most significant decrease in exchange, presumably due to tighter protein-protein interactions in the closed conformation of the channel. We ascribe the reduced exchange in NT residues 7–28 to a closer association of the NTs in forming the pore-occluding density (Figure 4A). Although more hydrogens would be available on unfolding of the NT α-helix, occlusion of the pore would prevent access of deuterium to these regions. The dynamic nature of the NTs was also assessed by examination of EX1 kinetics, which occurs when interconversion between folded and unfolded states is slower than the timescale of the HDX experiments. The NTs exhibited EX1 kinetics at physiological pH, but not at acidic pH (Figure 4B), suggesting that the NTs sample multiple discrete conformations in the open state. The HDX and EX1 results indicate that the NTs adopt multiple conformations at a physiological pH, whereas they are more ordered, with NT-CL interactions at acidic pH. Interestingly, the E1-M2 boundary displays a significant increase in dynamics at acidic pH (purple in Figure 4B), which may facilitate the movement of M2 toward M1 described below.
Figure 4. Comparison of the Dynamics of the Human Cx26 GJC between pH 7.5 and 6.0 by using HDX Mass Spectrometry.

(A) The change in the deuterium uptake at pH 6.0 compared to pH 7.5 was adjusted to that predicted at pH 7.5. The topology model shows three peptides with reduced deuterium uptake at pH 6.0. The numbers next to each peptide shows the percent change in the deuterium uptake change and the associated standard deviation.
(B) A topology model illustrating EX1 kinetics of deuterium exchange. Detection of EX1 kinetics is indicative of transient conformational transitions of a given segment of a protein, faster for the more unfolded conformer, and slower for the more folded conformer.
In the open structures at both physiological pH (Figures 3A and 3D) and acidic pH (Figures 3B and 3E), there are discontinuous rings of density with roughly the same diameter and in the same location as the pore-occluding density observed at acidic pH. Our interpretation is that the rings of density arise from partial occupancy of the occluded conformation by the NTs, which is supported by the observed EX1 kinetics in the NT at physiological pH (orange residues in Figure 4B).
Increased NT-CL Association at Acidic pH
Conformational flexibility of the CL and CT domains precluded their visualization in the open and occluded structures. The CL domain is known to be dynamic (Müller et al., 2002), which is also supported by the lack of well-defined CL density in the X-ray and cryo-EM maps. To elucidate the conformational relationships between the cytoplasmic domains, we performed lysine crosslinking using bis(sulfosuccinimidyl)suberate (BS3), followed by pepsin proteolysis and MS/MS (Figure 5; Tables S3 and S4; Gould et al., 2008; Schmidt and Robinson, 2014; Shi et al., 2017; Zhao et al., 2013). This approach takes advantage of the lysine residues in the NT, CL, and CT (2, 8, and 3 residues, respectively). During the time course of the experiment, crosslinking did not cause aggregation, as would occur with interparticle crosslinks (Figures 5 and S7). In addition, the ~11-Å linker length precluded crosslinks between the cytoplasmic domains of apposed hemichannels. Although gel electrophoresis (Figures 5 and S7) does indicate formation of intermolecular covalent bonds, we realize that this method cannot distinguish intermolecular and intramolecular crosslinks. Heatmaps were used to convey the abundance of detected crosslinks at pH 7.5 (Figure 5A) and pH 6.0 (Figure 5B), and the observed crosslinks were mapped onto the Cx26 topology model (Figures 5C–5E). We note that no NT-CT crosslinks were detected, as expected from the known periluminal and external locations of the M1 and M4 helices, respectively (Bennett et al., 2016; Maeda et al., 2009).
Figure 5. Mapping of Lysine-Lysine Crosslinks Showing Increased NT-CL Crosslinking at Acidic pH.

(A and B) The heatmaps show crosslinking efficiency at pH 7.5 (A) and pH 6.0 (B) according to the indicated color bar. Squares denoted with (*) are low-confidence crosslinks, not included in the analysis. Squares denoted with (**) are low-scored crosslinks with E2 residue lysine 168 (indicating crosslinking between hemichannels) and are not analyzed.
(C) Crosslinks between the NT and CL domains.
(D) Crosslinks within the CL domain.
(E) Crosslinks between the CL and CT domains.
Three groups of crosslinks were detected:
CL-CT (Figure 5E)
The most abundant crosslinks were between the CL (residues 981–29) and CT (residues 217–235). All three lysines in the CT (221, 223 and 224) crosslinked with every lysine in CL. While the CT is too short to form the gating particle, CL-CT interactions have been previously reported to be pH-dependent (Locke et al., 2011). The observed pH-dependent changes involve K224, exclusively, which forms unique crosslinks with K102 and K105 at pH 7.5 and with K112 at pH 6.0. The remainder of the K224 crosslinks were detected in both pH conditions. Given the proximity of K223 and K221 to K224 and their unchanged crosslinking pattern, the subtle changes in K224 crosslinking do not allow for a definitive interpretation of the pH effect on CL-CT interactions.
CL-CL (Figure 5D)
The second most numerous group of crosslinks were located within the CL (residues 98–129), which is not surprising given the proximity of the M2 and M3 α helices. Almost every lysine in this lysine-rich domain (8 residues out of 15 total in Cx26) was crosslinked with every other lysine in that region. No differences were detected between the pH 7.5 and pH 6.0 samples.
NT-CL and M1-CL (Figure 5C)
The largest number of pH-dependent changes in crosslinking occurred between the NT and CL and M1 and CL. Under acidic conditions, K22 in the M1 helix formed crosslinks with K102 and K105, and K15 in the NT formed crosslinks with K105, K108, and K112. The only unique crosslink at physiological pH was between K15 and K103. Ten crosslinks were identified between the NT (residues 1–15) and CL (residues 98–129). Interestingly, five of the crosslinks were unique to pH 6.0: K22 in M1 with K102 and K105 and K15 in the NT with K105, K108, and K112. The only unique crosslink at physiological pH was between K15 and K103 (Figure 5C). Both K22 (M1) and K15 (NT) crosslinked in a different manner under acidic conditions. Several NT-CL crosslinks were only detected at pH 6.0: K22-K102, K22-K105, K15-K105, K15-K108, and K15-K112.
Acidic pH Induces Movement of the M2 Helix toward M1
We observe no constriction of the TM helices in the low pH closed structure (compare Figures 1F with 1B and 1D), which argues against a steric “camera-iris”-type of mechanism for low pH gating (Unwin and Ennis, 1984). However, upon acidification, the M2 helix does shift toward the M1 helix within the same subunit (Figure 6). The M2 conformational change is apparent from distance changes between reference residues. For example, the A92 Cα atom on the M2 helix shifts ~5 Å toward the Cα atom of K22 on M1 in the occluded structure (Figures 6D and 6E). The M2 movement may be enabled by flexibility of the cytoplasmic ends of M2, which is suggested by M2 having the shortest cytoplasmic extension compared with the other helices.
Figure 6. Helix M2 Moves ~5 Å toward M1 during pH-Induced Gating.

Ribbon coloring is as follows: pH 6.4 open structure (cyan) and pH 6.4 closed structure (violet).
(A) Top view of a Cx26 GJC hemichannel from pH 6.4 open and closed structures.
(B) A side view of superposed Cx26 monomers from pH 6.4 open and closed structures.
(C) An end-on view of superposed Cx26 monomers from pH 6.4 open and closed structures.
(D) An end-on view of a Cx26 monomer from the cytoplasmic side showing distances between Cα atoms of Lys22 (M1) and Ala92 (M2) and Ile140 (M3) and Glu209 (M4) in the pH 6.4 open structure.
(E) The same view of a Cx26 monomer but shown for the pH 6.4 closed structure.
DISCUSSION
Cooperativity in pH Gating of Cx26 GJCs
Previous electrophysiologic studies have shown that pH-mediated block of Cx26 GJCs requires electrostatic interaction between residues N14 in M1 and H100 in the CL (see Figure 5C for residue locations), which is abrogated by substituting a positively charged amino acid in position 14 and rescued by mutating residue 100 to one without charge (Sanchez et al., 2016). Our observations from cryo-EM and mass spectrometry are consistent with these mutagenesis and electrophysiologic results. The N14-H100 interaction may trigger the observed movement of M2 toward M1 within the same subunit, thereby resulting in additional crosslinks at acidic pH (Figure 5C). The M2 to M1 movement is also accompanied by the appearance of density that connects the M2 helix with the NT (Figures 3C and 3F) of the adjacent subunit, suggesting cooperativity between Cx26 subunits within the same hemichannel. Such cooperativity is consistent with the appearance of six threads of density at acidic pH, and the participation of all six NTs would generate the largest occluding particle to obstruct the ~15 Å-diameter pore. Support for intersubunit interactions is provided by the recent electrophysiological and computational analysis of the N14K Cx26 mutant that results in deafness and skin diseases (Valdez Capuccino et al., 2019).
Evidence for Ball-and-Chain Gating of Cx26 GJCs
Evidence for a particle receptor model of gating was first suggested by electron cryocrystallography of 2D crystals of the M34A mutant of Cx26 at pH 5.8. However, we note that the maps at 10 Å resolution in the membrane plane and 14 Å perpendicular to the membrane did not show any connecting threads of density (i.e., the “chains”), and the resolution was too low to discern conformational changes of the helices within the protein subunits. In addition to studying a defective M34A mutant, we also note that the buffer contained several GJC inhibitors (Ca2+, Mg2+, carbenoxolone, and aminosulfonates) (Oshima et al., 2007). The identity of the occluding particle was, therefore, unclear from these studies because the resolution was too low for unambiguous polypeptide assignment and there were no threads of density connecting the occluding plug with the Cx subunits. However, follow-up studies with an NT deletion (residue 2–7) revealed a reduction in the size of the occluding density (Oshima et al., 2011), supporting the notion of the NT domain playing the role of a physical plug. Mutations in the NT domain have also been shown to either remove or diminish the effect of low pH on Cx26 hemichannels (Sanchez et al., 2016).
Our goal was to examine the ball-and-chain mechanism at a higher resolution under conditions where a reduction in pH was the only variable. In addition to cryo-EM and image analysis, we used HDX and lysine crosslinking coupled with mass spectrometry to examine pH-induced conformational changes. To summarize, the cryo-EM, HDX-MS, and EX1 kinetic results indicate that the NTs adopt multiple conformations at physiologic pH, including a more ordered helical region adjacent to M1 (Figures 3A and 3D; Maeda et al., 2009; Purnick et al., 2000). At acidic pH, the equilibrium shifts toward extension and association of the NTs to form the pore-occluding density (Figures 3C and 3F), accompanied by reduced H/D exchange (Figure 4A). The cryoEM maps show movement of the M2 helix toward the M1 helix at acidic pH (Figure 6), which may facilitate the increased NT-CL and M1-CL crosslinking at acidic pH (Figure 5C).
Reinforcement of the threads of density in our map with D6 symmetry implies that the NTs of all 6 subunits participate cooperatively in forming the occluding ball (Figure 7B). Participation of all six NTs in forming the pore-occluding ball contrasts with previous studies on concatemeric pannexin1 channels, in which C-terminal gating can be achieved by participation of three to four subunits (Chiu et al., 2017).
Figure 7. Gap Junction Channel Block Associated with Ca2+ Overload and Acidic pH during Tissue Injury.

(A) Binding of 12 Ca2+ ions makes the channel pore electropositive, resulting in electrostatic block of positively charged species.
(B) Simultaneously, acidic pH results in steric block of the channel pore by a ball-and-chain mechanism.
Comparison with Ball-and-Chain Regulation of Voltage-Gated Channels
Our study of N-terminal pH gating of human Cx26 GJCs reveals a complete ball-and-chain gating particle comprised of six continuous chains of density and a hexameric ball, which is supported by HDX and crosslinking MS experiments. Although different from the fast inactivation of Na+ and K+ channels, several properties of pH gating of GJCs are consistent with these ball-and-chain mechanisms. First, in shaker K+ channels, the ball-and-chain is formed by the terminal end of the N terminus. On the basis of the X-ray crystal structures of the KcsA K+ channel in the presence of tetrabutylammonium (TBA) and tetrabutylantimony (TBSb), Zhou et al. (2001) proposed that gating requires extension of the N terminus so that it can enter and block the pore. Our structure is consistent with this finding because the N terminus appears to be fully extended to the acetylated cap of the Cx26 NT to fit the ball-and-chain density (Figure 7B). Second, Na+ and K+ channels only receive the ball-and-chain in the open state. The occluding particle of Cx26 also blocks an open pore conformation. This characteristic makes the ball-and-chain mechanism complementary to the electrostatic block induced by Ca2+ binding, which also maintains an open channel conformation (Bennett et al., 2016; Figure 7A). Indeed, in the context of tissue injury, the cell is simultaneously in a state of Ca2+ overload and decreased intracellular pH (Kalogeris et al., 2012; Noble and Noble, 2006). Although Ca2+ block is limited to positively charged ions and metabolites, pH occlusion would, in addition, inhibit the permeation of neutral and negatively charges molecules. The electropositive surface induced by Ca2+ binding may also explain why the GJC ball-and-chain is formed by acetylated NTs rather than a positively charged amino-terminus because the latter would likely be repelled in the case of simultaneous Ca2+ inhibition. Last, both HDX EX1 kinetic measurement and cryo-EM reveal inherent conformational flexibility of the NTs at physiologic pH, whereas the NT threads and pore-occluding density are visualized in our low-pH structure, albeit at a lower overall resolution than the open state. We note that the open and occluded states existed in the same vitrified sample, confirming that the lower resolution in the occluded structure is due to conformational flexibility within the TM helices rather than systematic errors induced by specimen preparation and/or imaging. The moderate resolution may be a result of the heterogeneity that arises from this relatively disordered state, which is also consistent with reduced thermal stability at acidic pH. Fortunately, the ability of single-particle cryo-EM to resolve heterogeneous particle states was essential for us to simultaneously visualize the open and occluded states.
STAR⋆METHODS
Detailed methods are provided in the online version of this paper and include the following:
LEAD CONTACT AND MATERIALS AVAILABILITY
Further information and requests for resources and reagents should be directed to and will be fulfilled by the Lead Contact, Mark Yeager (yeager@virginia.edu). This study did not generate new unique reagents.
EXPERIMENTAL MODEL AND SUBJECT DETAILS
Full-length Cx26 C211S, C218S was fused to a C-terminal hexahistidine tag and expressed in Spodoptera frugiperda (Sf9) insect cells obtained by ATCC using recombinant baculovirus as previously described in Bennett et al. (2016).
METHOD DETAILS
Protein expression and purification
Protein expression and purification were performed as described in Bennett et al., (2016). For MS/MS and HDX experiments, Cx26 was exchanged into buffer containing 50 mM HEPES pH 7.5, 500 mM NaCl, 0.025% n-dodecyl-β-D-maltopyranoside (DDM; Ana-trace). Samples for EM experiments and the thermal stability assay were exchanged into a buffer containing 50 mM HEPES pH 7.5, 1 M NaCl, 2.5% glycerol (v/v), 0.025% DDM. The final eluate from the desalting column was concentrated to 4.0–5.5 mg/ml (150–210 μM) using a 0.5 mL or 4 mL concentrator (100 kDa MWCO; Millipore).
In order to increase protein stability (Figures 1G and 1H) and particle contrast (Figures S1A and S3G) for cryoEM, detergent was exchanged to the amphipathic surfactant Amphipol A8–35. The protein sample at ~5 mg/ml was mixed with amphipol (10 mg/ml stock in 50 mM HEPES pH 7.5, 1 M NaCl, 2.5% glycerol (v/v), 0.025% DDM buffer) at a ratio of 1:3 (w/w), diluting the protein to ~2 mg/ml. The sample was incubated for 4 h at 4°C with gentle mixing. The detergent was removed by addition of Bio-Beads SM-2 (BioRad) to 30 mg/ml and overnight incubation at 4°C with gentle mixing. Bio-beads were removed by flowing the solution through a fritted 0.5 mL disposable column. The sample solution was subjected to centrifugation for 10 min (16,000 × g) at 4°C to remove insoluble components and purified further on a Superdex 200 10/300 column using an elution buffer composed of 50 mM HEPES pH 7.5, 1 M NaCl. The peak corresponding to dodecameric Cx26 channels was collected and concentrated to ~2 mg/ml using a 4 mL concentrator (100 kDa MWCO; Millipore).
Negative-stain EM analysis
For EM of negatively stained samples, a 3.0 μL drop of protein sample at 0.01 mg/ml was incubated on a glow-discharged, carbon-coated copper grid for 60 s. The grid was washed with three drops of distilled, deionized water followed by staining with a drop of 2% uranyl acetate pH 4.5 for 60 s. Between sample application, washing, and staining steps, the grid was blotted with filter paper to remove excess solution. EM data acquisition was performed using a Tecnai G2 F20 electron microscope (FEI, Hillsboro, OR) equipped with a field-emission electron source, operating at 120 keV. Low electron dose images (~15 e−/Å2) were recorded on a 4K × 4K pixel CCD camera (Gatan, Pleasanton, CA) at 62,000 × magnification (1.8 Å pixel size) with a 1 s exposure time at an underfocus value of approximately −1.5 μm. Image processing was performed using EMAN v2.05 software (Tang et al., 2007). To facilitate particle visualization, micrographs were subjected to high- and low-pass Gaussian filtering at 100 and 10 Å, respectively. A total of ~3,400 particles were picked manually and extracted with a box size of 230 Å2. Corrections to the contrast transfer function (CTF) were performed using the program e2ctf.py. All picked particles were then screened visually, and nonsensical particles were removed interactively, leaving ~3,100 particles. Particles were sorted into 23 class averages using reference-free 2D class averaging, and particles belonging to minimally occupied or outlier classes were removed, resulting in a dataset of ~3,000 particles. A set of 12 initial 3D maps with imposed D6 symmetry was derived using e2initialmodel.py over 10 iterations. The best map, as judged by the presence of continuous density and a measured volume corresponding to the Cx26 GJC, was subsequently refined with D6 symmetry.
CryoEM Sample Preparation
Purified Cx26 (~2 mg/mL in 50 mM HEPES pH 7.5, 1 M NaCl, amphipol (A8–35)) was diluted to 0.4 mg/mL with a final buffer composition of 50 mM HEPES pH 7.5, 200 mM NaCl. An aliquot (3.5 μL) of sample was then immediately applied to a C-flat holey carbon grid (copper, 2 μM/2 μM hole size/hole space) glow-discharged in an atmosphere of amylamine, manually blotted with Whatman no. 1 filter paper for ~3–5 s, and plunge-frozen in liquid ethane cooled by liquid nitrogen. For the low pH sample, purified Cx26 (~2.5 mg/mL) was diluted 1:3 (v/v) with a 50 mM MES pH 6 solution to make a 0.63 mg/mL Cx26 protein solution in a buffer containing 12.5 mM HEPES, 37.5 mM MES pH 6.4, 125 mM NaCl. After incubation for 2–5 min on ice, 3 μL of sample was applied to a glow-discharged C-flat holey carbon grid, blotted with Whatman no. 1 filter paperand plunge-frozen in liquid ethane cooled by liquid nitrogen using a Vitrobot (FEI company) (4 s blotting time, blot force of 3, and 100% humidity at 22°C).
CryoEM Data Acquisition
Datasets were collected at the Electron Bio-Imaging Centre (eBIC) at the Diamond Light Source (Didcot, United Kingdom) on a Titan Krios electron cryomicroscope, operated at 300 kV, equipped with a Quantum Energy Filter (Gatan, Inc.) operated in zero-energy-loss mode with a slit-width of 20 eV and a K2 Summit direct electron detector (Gatan, Inc.). Images were collected using the automated procedure in EPU (FEI) at a 130,000 × nominal magnification, corresponding to a 1.06 Å physical pixel size. Images for pH the 7.5 sample were recorded in counting mode as a 20-frame movie with an exposure time of 8 s and dose rate of 5.62 e−/Å2/s (total dose 45 e−/Å2). Low pH images were recorded in super resolution mode (0.53 Å super resolution pixel size) as a 25-frame movie with an exposure time and dose rate of 10 s and 4.5 e−/Å2/s (total dose 45 e−/Å2), respectively.
CryoEM Data Processing
For physiological pH, all movie frames were motion-corrected and integrated using MOTIONCORR (Li et al., 2013) while applying an inverse B-factor of −150 pixel2 and frame offset of 5. The contrast transfer function (CTF) was estimated on each integrated image using CTFFIND4 (Rohou and Grigorieff, 2015) on the first 94 recorded images. By the use of RELION (Fernandez-Leiro and Scheres, 2017; Kimanius et al., 2016; Scheres, 2012), 2D class averages calculated from 745 manually picked particles were used as an input for template-based auto picking. By the use of EMAN2 (Tang et al., 2007), 2D class averages of the auto-picked particles were calculated and used to generate a de novo D6 symmetric initial model. On the full dataset, the CTF of each integrated micrograph was estimated using Gctf (Zhang, 2016). 2D class averages generated from the previous auto-picked particles were used as templates for automated picking on the full dataset using Gautomatch software provided by Kai Zhang. Per the resolution limits provided by Gctf, all micrographs lower than 3.3-Å resolution were discarded, and the remainder of the processing was performed in RELION v2. 2D class averages were calculated, and particles from class averages containing α-helical features (Figure S1B) were subjected to 3D classification (with D6 symmetry) using the EMAN2-generated initial model. All initial models used in 3D class averaging and refinement mentioned herein were lowpass filtered to 50-Å resolution. Approximately 60% of the particles were assigned to a 3D class containing apparent secondary structure and were used for subsequent 3D auto-refinement (with D6 symmetry), that resulted in a gold-standard FSC resolution of 4.5 Å. Beam-induced motion correction and radiation-damage weighting implemented in the RELION particle polishing procedure were used to improve the signal-to-noise ratio of individual particles (Scheres, 2014). Refinement with the “polished” particles improved the resolution to 4.3 Å (Figures S1C, S1D, and S1G). In the RELION post-processing procedure, application of a soft mask that excluded the low-resolution signal from the amphipol and cytoplasmic domains and performing automated B-factor sharpening (Rosenthal and Henderson, 2003) improved the resolution to 4.0 Å (Figures S1E, S1F, and S1G).
For acidic pH, all super-resolution movie frames were motion-corrected and integrated using MOTIONCORR while applying an inverse B-factor of −150 pixel2 and a frame offset of 6. CTF estimation was performed with Gctf, and summed micrographs with a resolution limit lower than 3.75 Å were discarded. By the use of RELION, a 3D reference map was generated from 2D class averages derived from 1,008 manually picked particles, and back-projections were used as templates for auto-picking on all micrographs. 2D class averages were calculated from 2x down-scaled particles from 234 micrographs, which were used to sort particles from all the micrographs based on the difference between the particle and its aligned reference. The top ~50% of particles were subjected to two consecutive rounds of 2D classification, selecting particles in 2D class averages displaying α helices after each round. In EMAN2, 2D class averages of the remaining particles were then calculated and used to generate a de novo D6-symmetric initial model. Particles were then subjected to two rounds of 3D class averaging with C1 symmetry and one round of 3D class averaging with D6 symmetry to remove bad particles and further improve the initial model. Between each round of 3D class averaging, particles and density from a 3D class that displayed α-helical structure were chosen as inputs for the next round. After generation of the initial model, we performed image processing on summed micrographs with a resolution limit higher than 3.75 Å. 2D class averaging was performed on 4x down-scaled particles, and particles in secondary structure containing class averages were subject to two rounds of 3D class averaging with C1 symmetry. Particles were then used to generate a de novo D6 symmetric initial model in cryoSPARC (Punjani et al., 2017) and subjected to a round of 3D classification with D6 symmetry. Particles from the best 3D class average were re-extracted from the micrographs, down-scaled 2x, and subjected to another round of 3D classification with D6 symmetry. Subsequent 3D auto-refinement with D6 symmetry resulted in a map at 6.1-Å resolution, which improved to 4.7-Å (gold-standard FSC) with particle polishing (Figure S4A). 3D classification was then performed on the “polished” particles increasing the angular sampling incrementally from 7.5° to 0.9°. From the resulting three 3D classes (Figures S4B–S4D), particles in two of the classes were subjected to 3D refinement, resulting in a map of the occluded state at 7.5-Å resolution (Figure S4E). Refinement of the remaining class resulted in a map of the open state at 4.4-Å, which improved to 4.2-Å resolution (Figure S3N) with post-processing (Figure S4F).
Model Building
Both pH 7.5 and pH 6.4 open models were built following the same procedure. The X-ray structure of Cx26 (PDB: 5ERA; Bennett et al., 2016) was used as a starting model. The model was rigid-body fitted into the cryoEM density map using UCSF Chimera (Pettersen et al., 2004), and the new coordinates for the model were saved with respect to the map. The real space refinement tool in Phenix (Adams et al., 2010) was used to refine the model to the B-factor sharpened cryoEM map with secondary structure restraints, reference model restraints, using electron scattering table options (Yonekura and Maki-Yonekura, 2016). WinCoot (Emsley et al., 2010) was used to perform local real-space refinement on selected fragments of the structure, as well as to improve the fit of bulky side chains to the density. Amino acid assignment was confirmed based on the clearly defined side chains of bulky residues (Phe, Tyr, Trp, Arg, Lys, and Met). Residues 214 and 215 were deleted from the cytoplasmic end of the M4 helix due to insufficient density, and amino acids 17 and 134 were added to the cytoplasmic ends of M1 and M3 based on additional density in these regions. The lower-resolution cytoplasmic interface, containing the ends of helices M1-M4, required contouring at decreased sigma levels compared to the majority of the TM M1-M4 helical regions. Amino acids 85–96 in the M2 helix had the most incomplete density coverage. As was the case with the X-ray structure, the CL residues 97–133 and CT residues 214–235 were missing from the cryoEM maps. The highest-resolution extracellular gap region retained its structural organization from the starting X-ray structure and allowed for an unambiguous assignment of most side chains. The unsharpened map was used in assigning the N-terminal domain from another Cx26 X-ray structure (PDB: 2ZW3; Maeda et al., 2009) into a stretch of density lining the channel pore, proximal to the M1 helix. The NT fragment corresponding to amino acids 2–15 was extracted from the reference structure in WinCoot and manually docked into the unsharpened map. Residues M1 and H16 were added, and the NT fragment was connected to the M1 helix. The loop connecting the M1 helix to the helical part of NT, consisting of residues 12–18, as well as the end of NT with residues 1–4, were refined using the real space refine and regularize zone tools in WinCoot. The α-helical part of the NT domain, residues 5–11, was left unmodified.
The acidic pH occluded model was based on the same starting structure as the other two models. After real-space refinement in Phenix, the backbone of the M1-M4 helices was adjusted in WinCoot. Structural manipulations were limited to the Cα and main chain atoms, as the resolution did not allow for assignment of amino acid side chains. N-terminal resides 1–17 were added, rigidly docked into the density, and refined to improve the fit. The refinement resulted in loss of helical structure for residues 5–11, which became part of the thread of density extending into the occluding density in the channel pore.
Fluorescent Thermal Stability Assay
Thermal stability of Cx26 in DDM and in amphipol A8–35 was measured by the fluorescence of the cysteine-reactive dye 7-diethylamino-3-(4’-maleimidylphenyl)-4-methylcoumarin (CPM) over a temperature gradient (Alexandrov et al., 2008). The Cx26 construct used for cryoEM (Bennett et al., 2016) has only one free cysteine at position 202, in the middle of M4. Upon increasing the temperature, Cx26 unfolds, and the dye binds to the C202 thiol and emits fluorescence at 463 nm. For experiments on Cx26 in DDM at pH 7.5, the buffer consisted of 50 mM HEPES pH 7.5, 500 mM NaCl, 2.5% glycerol (v/v) and 0.025% DDM. Experiments at lower pH were performed in MES-based buffer at pH of 6.5 or 6.0. For Cx26 samples in amphipol A8–35, no detergent was added to the buffers. An aliquot of CPM dye (Invitrogen) at 10 mM in dimethylformamide was diluted 1:150 into either a sample of protein at ~300 μg/ml or a buffer-only control. Following a 15-min incubation on ice, the sample was transferred into a 1.5 mm path-length quartz spectrofluorometer cuvette (Hellma Analytics, Müllheim, Germany), which was inserted into a FluoroMax-3 spectrofluorometer (Horiba Jobin-Yvon, Edison, NJ). The excitation and emission wavelengths were set to 387 nm and 463 nm, respectively. The sample was heated from 6–96°C at a rate of 2°C/min, and the fluorescence was recorded every 1 min. The fluorescence versus temperature profile was analyzed as described in Alexandrov et al., (2008).
Hydrogen-Deuterium Exchange (HDX) and Data Analysis
The Cx26 sample in HDX buffer (50 mM HEPES pH 7.5, 500 mM NaCl and 0.025% DDM) was concentrated to ~5.2 mg/ml (200 μM), frozen in liquid nitrogen, and stored at −80°C. For all HDX experiments the temperature was maintained at 4°C. Initially, tandem mass spectrometry (MS/MS) was used to optimize protein concentration, protease digestion times, and quench conditions for maximum protein sequence coverage with recovered peptides. MS/MS data were acquired separately from the HDX data, in experiments with a 60 min gradient column. Data-dependent MS/MS was performed in the absence of exposure to deuterium. The amino acid sequence of each peptide used in the HDX peptide set were designated as confirmed if they had a MASCOT score of 20 or greater and had no ambiguous hits using a decoy (reverse) database. A post-translational modification (PTM) of the methionine 1 residue with an acetyl cap (Ac-Met) of the 1–7 peptide was included in the MASCOT search (Perkins et al., 1999). The best condition yielded 74% sequence coverage of the protein. Shortly before HDX experiments, the sample was thawed on ice and diluted 1:3 (v/v) to ~50 μM Cx26 in either HDX buffer pH 7.5 (50 mM HEPES pH 7.5, 500 mM NaCl and 0.025% DDM) or pH 6 (50 mM MES pH 6, 500 mM NaCl and 0.025% DDM). Solution-phase amide HDX was carried out with a fully automated system as described previously (Chalmers et al., 2006) with slight modifications. The automation system (CTC HTS PAL, LEAP Technologies, Carrboro, NC, USA) was housed inside a chromatography cabinet maintained at 4°C. For each HDX reaction, 5 μL of 50 μM Cx26 at pH 7.5 or 6.0 was diluted to 25 μL with D2O-containing HDX buffer (either pH 7.5 or pH 6.0) and incubated at 4°C for 10, 30, 60, 900, or 3,600 s. Following exchange, unwanted forward or back exchange was minimized, and the protein was denatured by dilution to 50 μL with 0.1% (vol/vol) Trifluoroacetic acid (TFA) in 3 M urea, 20 mM TCEP and 0.025% DDM. Samples were then passed over an immobilized pepsin column (prepared in house; Busby et al., 2007) at 50 μL/min (0.1% vol/vol TFA, 15°C), and the resulting peptides were retrieved on a C8 trap cartridge (Hypersil Gold, Thermo Fisher). By use of a 1 mm × 50 mm C18 HPLC column (Hypersil Gold, Thermo Fisher), the peptides were eluted over 5 min at 4°C using a gradient of 4%–40% (w/v) CH3CN in 0.3% (wt/vol) formic acid. The eluted peptides were then subjected to electrospray ionization directly coupled to a high resolution (60,000) Orbitrap mass spectrometer (LTQ Orbitrap XL with ETD, Thermo Fisher). For on-exchange experiments, the intensity-weighted average m/z value (centroid) of each peptide’s isotopic envelope was calculated using software developed in-house (Pascal et al., 2012). For back-exchange corrections, an estimate of 70% recovery was applied to each peptide (West et al., 2013). To measure the difference in exchange rates between experiments conducted at pH 7.5 and 6.0, we calculated the average percent deuterium uptake for peptides from both samples following 10, 30, 60, 900, and 3,600 s of on-exchange. The intrinsic exchange rate (Kch) at pH 6.0 was converted to pH 7.5 using an equation describing the temperature and pH dependence of the amide hydrogen exchange rate (Coales et al., 2010). After normalization, time points of ~10 and ~30 s were used to calculate the average percent HD exchange in Cx26 at pH 7.5 and pH 6.0 (Figures S6A and S6B).
Measurement of EX1 kinetics
If a refolding event occurs sufficiently slow to allow complete deuterium exchange of backbone amide hydrogens within the unfolding region, then EX1 kinetics are observed. Under EX1 conditions, if an opening or unfolding event involves more than one slow exchanging amide hydrogen, then deuterium exchange occurs simultaneously at these amides. Therefore, a bimodal distribution occurs via a correlated exchange pattern, in which the lower mass envelope corresponds to molecules that have not yet exchanged (not yet unfolded), and the higher mass envelope corresponds to molecules that have undergone exchange (molecules that have unfolded. The region undergoing EX1 kinetics may represent a mixture of unfolded and folded conformers in the same unfolding event. In contrast, EX2 kinetics takes place if the refolding rate is much faster than the intrinsic exchange rate of the amide hydrogens, resulting in one isotopic envelope throughout the labeling time of the experiment.
Protein crosslinking and MS/MS analysis
We performed lysine proximity crosslinking at pH 7.5 and 6.0 using bis(sulfosuccinimidyl)suberate (BS3). SDS-PAGE gel analysis demonstrated that BS3-crosslinked Cx26 migrated as a ladder of oligomers compared with uncrosslinked Cx26 (Figure S7). Optimal conditions for crosslinking were 1 mM BS3 (diluted from freshly made 100 mM BS3 in distilled, deionized H2O) and incubation with Cx26 for 1 h at 4°C in 0.025% DDM containing 500 mM NaCl. For crosslinking, protein samples were diluted three-fold to ~1.2 mg/ml with either pH 7.5 (50 mM HEPES) or 6.0 (50 mM MES) buffer. At the end of the reaction time, excess BS3 was quenched with 1M Tris pH 7.5 added to a final concentration of 50 mM. Samples were then exchanged into pH 7.5 buffer in preparation for trypsin digestion. A desalting column (GE Healthcare, G-25) was equilibrated with 4 × 1 mL of ice-cold pH 7.5 buffer, and the sample volume was increased to 0.5 mL for loading onto the column. The protein was eluted from the desalting column with 1 mL of ice-cold pH 7.5 buffer. The collected eluate was then concentrated to ~2 mg/ml (~80 μM) using a 0.5 mL or 4 mL concentrator (100 kDa MWCO; Millipore) at a speed of ~1000 × g at 4°C. The samples were flash-frozen in liquid N2 and stored at −80°C until digestion. Trypsin digestion was performed at 37°C for 12 hr. Tandem mass spectrometry (MS/MS) was used to separate resulting peptides and crosslinked peptide pairs. MS/MS analysis was performed as described in Schmidt and Robinson (2014). MassMatrix software (Xu and Freitas, 2009) was used to identify detected peptides. All detected lysine crosslinks were organized on separate heatmaps, with color intensity indicating crosslinking efficiency. The crosslinks were then evaluated based on their PP and PPtag scores (both statistical) and color tag number, which are indicative of the quality of a peptide match, with higher values indicating higher confidence in the match. Low-confidence crosslinks were not analyzed further and neither were the low-scored crosslinks with E2 residue lysine 168, which were interpreted as occurring between different hemichannels in the GJC. The remaining crosslinks could be assigned into three groups, based on where in the cytoplasmic domains the crosslinking reaction occurred: NT-CL, CL-CL and CL-CT. MS also confirmed the presence of the acetylated N-terminal peptide of Cx26 (residues 1–150) in the trypsin digest.
QUANTIFICATION AND STATISTICAL ANALYSIS
Statistics and graphs were generated by using OriginPro 7.5 and GraphPad Prism 6 software. For HDX experiments, exchange rates are averages taken at every time point, and the ranges given represent ± 1 standard deviation from the mean. For crosslinking experiments, matches with PP > 2.4 and PPtag > 1.3 were considered significant.
DATA AND CODE AVAILABILITY
The accession codes for the three maps reported in this paper are physiologic pH (open conformation): PDB: 6UVR, EMDB: EMD-20914; acidic pH (open conformation): PDB: 6UVS, EMDB: EMD-20915 and acidic pH (closed conformation): PDB: 6UVT, EMDB: EMD-20916.
Supplementary Material
KEY RESOURCES TABLE.
| REAGENT or RESOURCE | SOURCE | IDENTIFIER |
|---|---|---|
|
| ||
| Chemicals, Peptides, and Recombinant Proteins | ||
|
| ||
| n-Dodecyl-b-D-Maltopyranoside (DDM) | Anatrace | D310 |
| Amphipol A8–35 | Anatrace | A835 |
| Bis(sulfosuccinimidyl)suberate (BS3) | ThermoFisher | 21580 |
| 7-Diethylamino-3-(4’-Maleimidylphenyl)-4-Methylcoumarin (CPM) | ThermoFisher | D346 |
|
| ||
| Deposited Data | ||
|
| ||
| Neutral pH structure | This paper | PDB: 6UVR |
| Neutral pH map | This paper | EMDB: 20914 |
| Low pH structure – open conformation | This paper | PDB: 6UVS |
| Low pH map – open conformation | This paper | EMDB: 20915 |
| Low pH structure – closed conformation | This paper | PDB: 6UVT |
| Low pH map – closed conformation | This paper | EMDB: 20916 |
| Cx26 X-ray structure N-terminal domain | Maeda et al., 2009 | PDB: 2ZW3 |
| Cx26 X-ray structure | Bennett et al., 2016 | PDB: 5ERA |
|
| ||
| Experimental Models: Cell Lines | ||
|
| ||
| S. frugiperda Sf9 cells | ATCC | Cat# CRL-1711; RRID: CVCL_0549 |
|
| ||
| Software and Algorithms | ||
|
| ||
| Relion v2 | Fernandez-Leiro and Scheres, 2017 | https://www3.mrc-lmb.cam.ac.uk/relion/index.php/Main_Page |
| CryoSPARC | Punjani et al., 2017 | https://cryosparc.com/ |
| EMAN2 v2.05 | Tang et al., 2007 | https://blake.bcm.edu/emanwiki/EMAN2 |
| Phenix | Adams et al., 2010 | https://www.phenix-online.org/documentation/index.html |
| WinCoot | Emsley et al., 2010 | https://bernhardcl.github.io/coot/ |
| UCSF Chimera | Pettersen et al., 2004 | https://www.cgl.ucsf.edu/chimera/ |
| MASCOT | Perkins et al., 1999 | http://www.matrixscience.com/search_form_select.html |
| HDX Workbench | Pascal et al., 2012 | http://hdxworkbench.com/ |
| MassMatrix | Xu and Freitas, 2009 | https://massmatrix.bio/ |
|
| ||
| Other | ||
|
| ||
| Solution-phase amide HDX methodology | Chalmers et al., 2006 | N/A |
| Intrinsic HDX rate conversion | Coales et al., 2010 | N/A |
| MS/MS analysis methodology | Schmidt and Robinson, 2014 | N/A |
| Carbon-coated copper grids | EMS | FCF300-Cu |
| C-flat R2/2 200 mesh Cu holey carbon grids | EMS | CF-222C |
Highlights.
pH gating of human Cx26 gap junction channels occurs through a “ball-and-chain” mechanism
Gating involves cooperation of all subunits within each hexamer of the junctional channel
In acidic pH, acetylated N termini favor an extended conformation that occludes the pore
ACKNOWLEDGMENTS
Cryo-EM data were primarily collected at the University of Virginia Molecular Electron Microscopy Core and the Electron Bio-Imaging Centre (eBIC) at the Diamond Light Source, Didcot, UK. This work was supported by the National Institutes of Health (NIH) grant R01 HL48908 (M.Y.). A.K.K. was supported by NIH grant F30 HL129792. Some molecular graphics and analyses were performed with the University of California, San Francisco Chimera package. Chimera is developed by the Resource for Biocomputing, Visualization, and Informatics at the University of California, San Francisco (supported by the National Institute of General Medical Sciences grant P41 GM103311).
Footnotes
DECLARATION OF INTERESTS
The authors declare that they have no competing interests.
SUPPLEMENTAL INFORMATION
Supplemental Information can be found online at https://doi.org/10.1016/j.celrep.2020.03.046.
REFERENCES
- Abascal F, and Zardoya R (2013). Evolutionary analyses of gap junction protein families. Biochim. Biophys. Acta 1828, 4–14. [DOI] [PubMed] [Google Scholar]
- Adams PD, Afonine PV, Bunkóczi G, Chen VB, Davis IW, Echols N, Headd JJ, Hung LW, Kapral GJ, Grosse-Kunstleve RW, et al. (2010). PHENIX: a comprehensive Python-based system for macromolecular structure solution. Acta Crystallogr. D Biol. Crystallogr 66, 213–221. [DOI] [PMC free article] [PubMed] [Google Scholar]
- Alexandrov AI, Mileni M, Chien EY, Hanson MA, and Stevens RC (2008). Microscale fluorescent thermal stability assay for membrane proteins. Structure 16, 351–359. [DOI] [PubMed] [Google Scholar]
- Armstrong CM, and Bezanilla F (1977). Inactivation of the sodium channel. II. Gating current experiments. J. Gen. Physiol. 70, 567–590. [DOI] [PMC free article] [PubMed] [Google Scholar]
- Bao X, Chen Y, Reuss L, and Altenberg GA (2004). Functional expression in Xenopus oocytes of gap-junctional hemichannels formed by a cysteine-less connexin 43. J. Biol. Chem. 279, 9689–9692. [DOI] [PubMed] [Google Scholar]
- Bennett MV, and Zukin RS (2004). Electrical coupling and neuronal synchronization in the Mammalian brain. Neuron 41, 495–511. [DOI] [PubMed] [Google Scholar]
- Bennett BC, Purdy MD, Baker KA, Acharya C, McIntire WE, Stevens RC, Zhang Q, Harris AL, Abagyan R, and Yeager M (2016). An electrostatic mechanism for Ca2+-mediated regulation of gap junction channels. Nat. Commun. 7, 8770. [DOI] [PMC free article] [PubMed] [Google Scholar]
- Bukauskas FF, and Verselis VK (2004). Gap junction channel gating. Biochim. Biophys. Acta 1662, 42–60. [DOI] [PMC free article] [PubMed] [Google Scholar]
- Burt JM (1987). Block of intercellular communication: interaction of intracellular H+ and Ca2+. Am. J. Physiol. 253, C607–C612. [DOI] [PubMed] [Google Scholar]
- Busby SA, Chalmers MJ, and Griffin PR (2007). Improving digestion efficiency under H/D exchange conditions with activated pepsinogen coupled columns. Int. J. Mass Spectrom. 259, 130–139. [Google Scholar]
- Chalmers MJ, Busby SA, Pascal BD, He Y, Hendrickson CL, Marshall AG, and Griffin PR (2006). Probing protein ligand interactions by automated hydrogen/deuterium exchange mass spectrometry. Anal. Chem. 78, 1005–1014. [DOI] [PubMed] [Google Scholar]
- Chiu YH, Jin X, Medina CB, Leonhardt SA, Kiessling V, Bennett BC, Shu S, Tamm LK, Yeager M, Ravichandran KS, and Bayliss DA (2017). A quantized mechanism for activation of pannexin channels. Nat. Commun. 8, 14324. [DOI] [PMC free article] [PubMed] [Google Scholar]
- Coales SJ, E, S.Y., Lee JE, Ma A, Morrow JA, and Hamuro Y (2010). Expansion of time window for mass spectrometric measurement of amide hydrogen/deuterium exchange reactions. Rapid Commun. Mass Spectrom. 24, 3585–3592. [DOI] [PubMed] [Google Scholar]
- Connors BW, Benardo LS, and Prince DA (1984). Carbon dioxide sensitivity of dye coupling among glia and neurons of the neocortex. J. Neurosci. 4, 1324–1330. [DOI] [PMC free article] [PubMed] [Google Scholar]
- Ek-Vitorín JF, Calero G, Morley GE, Coombs W, Taffet SM, and Delmar M (1996). PH regulation of connexin43: molecular analysis of the gating particle. Biophys. J. 71, 1273–1284. [DOI] [PMC free article] [PubMed] [Google Scholar]
- Emsley P, Lohkamp B, Scott WG, and Cowtan K (2010). Features and development of Coot. Acta Crystallogr. D Biol. Crystallogr 66, 486–501. [DOI] [PMC free article] [PubMed] [Google Scholar]
- Evans WH, and Martin PEM (2002). Gap junctions: structure and function (Review). Mol. Membr. Biol. 19, 121–136. [DOI] [PubMed] [Google Scholar]
- Fernandez-Leiro R, and Scheres SHW (2017). A pipeline approach to single-particle processing in RELION. Acta Crystallogr. D Struct. Biol. 73, 496–502. [DOI] [PMC free article] [PubMed] [Google Scholar]
- Fleishman SJ, Unger VM, Yeager M, and Ben-Tal N (2004). A Cα model for the transmembrane α helices of gap junction intercellular channels. Mol. Cell 15, 879–888. [DOI] [PubMed] [Google Scholar]
- Foote CI, Zhou L, Zhu X, and Nicholson BJ (1998). The pattern of disulfide linkages in the extracellular loop regions of connexin 32 suggests a model for the docking interface of gap junctions. J. Cell Biol. 140, 1187–1197. [DOI] [PMC free article] [PubMed] [Google Scholar]
- Francis D, Stergiopoulos K, Ek-Vitorín JF, Cao FL, Taffet SM, and Delmar M (1999). Connexin diversity and gap junction regulation by pHi. Dev. Genet. 24, 123–136. [DOI] [PubMed] [Google Scholar]
- Gossman DG, and Zhao HB (2008). Hemichannel-mediated inositol 1,4,5-trisphosphate (IP3) release in the cochlea: a novel mechanism of IP3 intercellular signaling. Cell Commun. Adhes. 15, 305–315. [DOI] [PMC free article] [PubMed] [Google Scholar]
- Gould TD, O’Donnell KC, Dow ER, Du J, Chen G, and Manji HK (2008). Involvement of AMPA receptors in the antidepressant-like effects of lithium in the mouse tail suspension test and forced swim test. Neuropharmacology 54, 577–587. [DOI] [PMC free article] [PubMed] [Google Scholar]
- Harris AL (2001). Emerging issues of connexin channels: biophysics fills the gap. Q. Rev. Biophys. 34, 325–472. [DOI] [PubMed] [Google Scholar]
- Harris AL (2018). Electrical coupling and its channels. J. Gen. Physiol. 150, 1606–1639. [DOI] [PMC free article] [PubMed] [Google Scholar]
- Iwatsuki N, and Petersen OH (1977). Acetylcholine-like effects of intracellular calcium application in pancreatic acinar cells. Nature 268, 147–149. [DOI] [PubMed] [Google Scholar]
- Iwatsuki N, and Petersen OH (1979). Pancreatic acinar cells: the effect of carbon dioxide, ammonium chloride and acetylcholine on intercellular communication. J. Physiol. 291, 317–326. [DOI] [PMC free article] [PubMed] [Google Scholar]
- Johnstone S, Isakson B, and Locke D (2009). Biological and biophysical properties of vascular connexin channels. Int. Rev. Cell Mol. Biol. 278, 69–118. [DOI] [PMC free article] [PubMed] [Google Scholar]
- Kalogeris T, Baines CP, Krenz M, and Korthuis RJ (2012). Cell biology of ischemia/reperfusion injury. Int. Rev. Cell Mol. Biol. 298, 229–317. [DOI] [PMC free article] [PubMed] [Google Scholar]
- Kanaporis G, Mese G, Valiuniene L, White TW, Brink PR, and Valiunas V (2008). Gap junction channels exhibit connexin-specific permeability to cyclic nucleotides. J. Gen. Physiol. 131, 293–305. [DOI] [PMC free article] [PubMed] [Google Scholar]
- Kimanius D, Forsberg BO, Scheres SH, and Lindahl E (2016). Accelerated cryo-EM structure determination with parallelisation using GPUs in RELION-2. eLife 5, e18722. [DOI] [PMC free article] [PubMed] [Google Scholar]
- Laird DW, and Lampe PD (2018). Therapeutic strategies targeting connexins. Nat. Rev. Drug Discov. 17, 905–921. [DOI] [PMC free article] [PubMed] [Google Scholar]
- Li X, Mooney P, Zheng S, Booth CR, Braunfeld MB, Gubbens S, Agard DA, and Cheng Y (2013). Electron counting and beam-induced motion correction enable near-atomic-resolution single-particle cryo-EM. Nat. Methods 10, 584–590. [DOI] [PMC free article] [PubMed] [Google Scholar]
- Liu S, Taffet S, Stoner L, Delmar M, Vallano ML, and Jalife J (1993). A structural basis for the unequal sensitivity of the major cardiac and liver gap junctions to intracellular acidification: the carboxyl tail length. Biophys. J. 64, 1422–1433. [DOI] [PMC free article] [PubMed] [Google Scholar]
- Lo CW (1996). The role of gap junction membrane channels in development. J. Bioenerg. Biomembr. 28, 379–385. [DOI] [PubMed] [Google Scholar]
- Locke D, and Harris AL (2009). Connexin channels and phospholipids: association and modulation. BMC Biol. 7, 52. [DOI] [PMC free article] [PubMed] [Google Scholar]
- Locke D, Kieken F, Tao L, Sorgen PL, and Harris AL (2011). Mechanism for modulation of gating of connexin26-containing channels by taurine. J. Gen. Physiol. 138, 321–339. [DOI] [PMC free article] [PubMed] [Google Scholar]
- Maeda S, Nakagawa S, Suga M, Yamashita E, Oshima A, Fujiyoshi Y, and Tsukihara T (2009). Structure of the connexin 26 gap junction channel at 3.5 Å resolution. Nature 458, 597–602. [DOI] [PubMed] [Google Scholar]
- Majumder P, Crispino G, Rodriguez L, Ciubotaru CD, Anselmi F, Piazza V, Bortolozzi M, and Mammano F (2010). ATP-mediated cell-cell signaling in the organ of Corti: the role of connexin channels. Purinergic Signal. 6, 167–187. [DOI] [PMC free article] [PubMed] [Google Scholar]
- Müller DJ, Hand GM, Engel A, and Sosinsky GE (2002). Conformational changes in surface structures of isolated connexin 26 gap junctions. EMBO J. 21, 3598–3607. [DOI] [PMC free article] [PubMed] [Google Scholar]
- Nielsen MS, Axelsen LN, Sorgen PL, Verma V, Delmar M, and Holstein-Rathlou NH (2012). Gap junctions. Compr. Physiol. 2, 1981–2035. [DOI] [PMC free article] [PubMed] [Google Scholar]
- Noble D, and Noble PJ (2006). Late sodium current in the pathophysiology of cardiovascular disease: consequences of sodium-calcium overload. Heart 92, iv1–iv5. [DOI] [PMC free article] [PubMed] [Google Scholar]
- Noma A, and Tsuboi N (1987). Dependence of junctional conductance on proton, calcium and magnesium ions in cardiac paired cells of guinea-pig. J. Physiol. 382, 193–211. [DOI] [PMC free article] [PubMed] [Google Scholar]
- Oshima A, Tani K, Hiroaki Y, Fujiyoshi Y, and Sosinsky GE (2007). Three-dimensional structure of a human connexin26 gap junction channel reveals a plug in the vestibule. Proc. Natl. Acad. Sci. USA 104, 10034–10039. [DOI] [PMC free article] [PubMed] [Google Scholar]
- Oshima A, Tani K, Toloue MM, Hiroaki Y, Smock A, Inukai S, Cone A, Nicholson BJ, Sosinsky GE, and Fujiyoshi Y (2011). Asymmetric configurations and N-terminal rearrangements in connexin26 gap junction channels. J. Mol. Biol. 405, 724–735. [DOI] [PMC free article] [PubMed] [Google Scholar]
- Palacios-Prado N, Chapuis S, Panjkovich A, Fregeac J, Nagy JI, and Bukauskas FF (2014). Molecular determinants of magnesium-dependent synaptic plasticity at electrical synapses formed by connexin36. Nat. Commun. 5, 4667. [DOI] [PMC free article] [PubMed] [Google Scholar]
- Pascal BD, Willis S, Lauer JL, Landgraf RR, West GM, Marciano D, Novick S, Goswami D, Chalmers MJ, and Griffin PR (2012). HDX workbench: software for the analysis of H/D exchange MS data. J. Am. Soc. Mass Spectrom. 23, 1512–1521. [DOI] [PMC free article] [PubMed] [Google Scholar]
- Perkins DN, Pappin DJ, Creasy DM, and Cottrell JS (1999). Probability-based protein identification by searching sequence databases using mass spectrometry data. Electrophoresis 20, 3551–3567. [DOI] [PubMed] [Google Scholar]
- Pettersen EF, Goddard TD, Huang CC, Couch GS, Greenblatt DM, Meng EC, and Ferrin TE (2004). UCSF Chimera–a visualization system for exploratory research and analysis. J. Comput. Chem. 25, 1605–1612. [DOI] [PubMed] [Google Scholar]
- Punjani A, Rubinstein JL, Fleet DJ, and Brubaker MA (2017). cryo-SPARC: algorithms for rapid unsupervised cryo-EM structure determination. Nat. Methods 14, 290–296. [DOI] [PubMed] [Google Scholar]
- Purnick PE, Benjamin DC, Verselis VK, Bargiello TA, and Dowd TL (2000). Structure of the amino terminus of a gap junction protein. Arch. Biochem. Biophys. 381, 181–190. [DOI] [PubMed] [Google Scholar]
- Reber WR, and Weingart R (1982). Ungulate cardiac purkinje fibres: the influence of intracellular pH on the electrical cell-to-cell coupling. J. Physiol. 328, 87–104. [DOI] [PMC free article] [PubMed] [Google Scholar]
- Rohou A, and Grigorieff N (2015). CTFFIND4: Fast and accurate defocus estimation from electron micrographs. J. Struct. Biol. 192, 216–221. [DOI] [PMC free article] [PubMed] [Google Scholar]
- Rosenthal PB, and Henderson R (2003). Optimal determination of particle orientation, absolute hand, and contrast loss in single-particle electron cryomicroscopy. J. Mol. Biol. 333, 721–745. [DOI] [PubMed] [Google Scholar]
- Sanchez HA, Bienkowski R, Slavi N, Srinivas M, and Verselis VK (2014). Altered inhibition of Cx26 hemichannels by pH and Zn2+ in the A40V mutation associated with keratitis-ichthyosis-deafness syndrome. J. Biol. Chem. 289, 21519–21532. [DOI] [PMC free article] [PubMed] [Google Scholar]
- Sanchez HA, Slavi N, Srinivas M, and Verselis VK (2016). Syndromic deafness mutations at Asn 14 differentially alter the open stability of Cx26 hemichannels. J. Gen. Physiol. 148, 25–42. [DOI] [PMC free article] [PubMed] [Google Scholar]
- Scheres SH (2012). RELION: implementation of a Bayesian approach to cryo-EM structure determination. J. Struct. Biol. 180, 519–530. [DOI] [PMC free article] [PubMed] [Google Scholar]
- Scheres SH (2014). Beam-induced motion correction for sub-megadalton cryo-EM particles. eLife 3, e03665. [DOI] [PMC free article] [PubMed] [Google Scholar]
- Schmidt C, and Robinson CV (2014). A comparative cross-linking strategy to probe conformational changes in protein complexes. Nat. Protoc. 9, 2224–2236. [DOI] [PMC free article] [PubMed] [Google Scholar]
- Schuetze SM, and Goodenough DA (1982). Dye transfer between cells of the embryonic chick lens becomes less sensitive to CO2 treatment with development. J. Cell Biol. 92, 694–705. [DOI] [PMC free article] [PubMed] [Google Scholar]
- Shi JM, Pei J, Liu EQ, and Zhang L (2017). Bis(sulfosuccinimidyl) suberate (BS3) crosslinking analysis of the behavior of amyloid-b peptide in solution and in phospholipid membranes. PLoS One 12, e0173871. [DOI] [PMC free article] [PubMed] [Google Scholar]
- Sosinsky GE, and Nicholson BJ (2005). Structural organization of gap junction channels. Biochim. Biophys. Acta 1711, 99–125. [DOI] [PubMed] [Google Scholar]
- Spray DC, and Burt JM (1990). Structure-activity relations of the cardiac gap junction channel. Am. J. Physiol. 258, C195–C205. [DOI] [PubMed] [Google Scholar]
- Spray DC, Harris AL, and Bennett MV (1981). Gap junctional conductance is a simple and sensitive function of intracellular pH. Science 211, 712–715. [DOI] [PubMed] [Google Scholar]
- Sun Z, Zhang DQ, and McMahon DG (2009). Zinc modulation of hemi-gap-junction channel currents in retinal horizontal cells. J. Neurophysiol. 101, 1774–1780. [DOI] [PMC free article] [PubMed] [Google Scholar]
- Tang G, Peng L, Baldwin PR, Mann DS, Jiang W, Rees I, and Ludtke SJ (2007). EMAN2: an extensible image processing suite for electron microscopy. J. Struct. Biol. 157, 38–46. [DOI] [PubMed] [Google Scholar]
- Turin L, and Warner AE (1980). Intracellular pH in early Xenopus embryos: its effect on current flow between blastomeres. J. Physiol. 300, 489–504. [DOI] [PMC free article] [PubMed] [Google Scholar]
- Unger VM, Kumar NM, Gilula NB, and Yeager M (1999). Three-dimensional structure of a recombinant gap junction membrane channel. Science 283, 1176–1180. [DOI] [PubMed] [Google Scholar]
- Unwin PN, and Ennis PD (1984). Two configurations of a channel-forming membrane protein. Nature 307, 609–613. [DOI] [PubMed] [Google Scholar]
- Valdez Capuccino JM, Chatterjee P, Garcia IE, Botello-Smith WM, Zhang H, Harris AL, Luo Y, and Contreras JE (2019). The connexin26 human mutation N14K disrupts cytosolic intersubunit interactions and promotes channel opening. J. Gen. Physiol. 151, 328–341. [DOI] [PMC free article] [PubMed] [Google Scholar]
- West GM, Pascal BD, Ng LM, Soon FF, Melcher K, Xu HE, Chalmers MJ, and Griffin PR (2013). Protein conformation ensembles monitored by HDX reveal a structural rationale for abscisic acid signaling protein affinities and activities. Structure 21, 229–235. [DOI] [PMC free article] [PubMed] [Google Scholar]
- Xu H, and Freitas MA (2009). MassMatrix: a database search program for rapid characterization of proteins and peptides from tandem mass spectrometry data. Proteomics 9, 1548–1555. [DOI] [PMC free article] [PubMed] [Google Scholar]
- Yeager M (2009). Gap Junction Channel Structure. In Connexins, Guide A, Harris AL, and Locke D, eds. (Humana-Springer; ), pp. 27–75. [Google Scholar]
- Yeager M, and Harris AL (2007). Gap junction channel structure in the early 21st century: facts and fantasies. Curr. Opin. Cell Biol. 19, 521–528. [DOI] [PMC free article] [PubMed] [Google Scholar]
- Yeager M, and Nicholson BJ (1996). Structure of gap junction intercellular channels. Curr. Opin. Struct. Biol. 6, 183–192. [DOI] [PubMed] [Google Scholar]
- Yonekura K, and Maki-Yonekura S (2016). Refinement of cryo-EM structures using scattering factors of charged atoms. J. Appl. Cryst. 49, 1517–1523. [Google Scholar]
- Zagotta WN, Hoshi T, and Aldrich RW (1990). Restoration of inactivation in mutants of Shaker potassium channels by a peptide derived from ShB. Science 250, 568–571. [DOI] [PubMed] [Google Scholar]
- Zhang K (2016). Gctf: Real-time CTF determination and correction. J. Struct. Biol. 193, 1–12. [DOI] [PMC free article] [PubMed] [Google Scholar]
- Zhao A, Hao G, and Gu J (2013). Chemical crosslinking and mass spectrometric identification of interaction sites within soluble aggregate of protein therapeutics. J. Pharm. Biomed. Anal. 73, 99–102. [DOI] [PubMed] [Google Scholar]
- Zhou M, Morais-Cabral JH, Mann S, and MacKinnon R (2001). Potassium channel receptor site for the inactivation gate and quaternary amine inhibitors. Nature 411, 657–661. [DOI] [PubMed] [Google Scholar]
Associated Data
This section collects any data citations, data availability statements, or supplementary materials included in this article.
Supplementary Materials
Data Availability Statement
The accession codes for the three maps reported in this paper are physiologic pH (open conformation): PDB: 6UVR, EMDB: EMD-20914; acidic pH (open conformation): PDB: 6UVS, EMDB: EMD-20915 and acidic pH (closed conformation): PDB: 6UVT, EMDB: EMD-20916.