

Abstract
Human pluripotent stem cells (hPSCs) are a promising source of somatic cells for clinical applications and disease modelling. However, during culture they accumulate genetic aberrations such as amplification of 20q11.21 which occurs in approximately 20% of extensively cultured hPSC lines and confers a BCL2L1-mediated survival advantage. During the production of the large number of cells required for transplantation and therapy these aberrations may become unavoidable which has important safety implications for therapies and may also impact upon disease modelling. Presently, these risks are poorly understood; whilst it is apparent that large-scale genetic aberrations can pose an oncogenic risk, the risks associated with smaller, more insidious changes have not been fully explored.
In this report, the effects of engraftment of human embryonic stem cells (hESCs) and hESC-derived hepatocyte-like cells (HLCs) with and without amplification of the 20q11.21 minimal amplicon and isochromosome 20q (i20q) in SCID-beige mice are presented. The cells were tracked in vivo using a luminescent reporter over a period of approximately four months. Intrasplenic injection of hESCs showed greater engraftment potential and the formation of more severely disruptive lesions in the liver and spleen of animals injected with cells containing 20q11.21 compared with i20q and wild type. HLCs with 20q11.21 engrafted more successfully and formed more severely disruptive lesions than wild type cells or cells with i20q. These results reinforce the notion that karyotyping of therapeutic hPSC is required for transplant, and suggest that screening for known common aberrations is necessary. Further work to identify commonly arising genetic aberrations should be performed and routine screening for hPSCs intended for therapeutic use should be used.
Keywords: Stem cell, Tumorigenicity, Amplicon 20q11.21
Introduction
Demand for donor organs outstrips supply, consequently, there have been recent efforts to find alternate sources of cells and tissue for transplant. Human pluripotent stem cells (hPSCs), both embryonic (ESCs) and induced (iPSCs), offer a potentially unlimited source of cells for this purpose. However, the risks associated with the use of hPSC for transplant are incompletely understood. There are concerns regarding the tumorigenic potential of hPSC-derived therapies that could contain residual undifferentiated cells, which have the inherent ability to form teratomas in vivo, but also regarding the more insidious genetic changes, which occur during isolation and prolonged culture that these cells experience.
During culture, hPSCs are maintained in a highly proliferative state and subjected to selective forces which drive culture adaptation. For example, frequent passaging, growth in typically high-glucose medium and so on [1]. As genetic mutations accumulate randomly during culture, advantageous adaptations, for example those that increase the rate of proliferation, will naturally become selected. For example, trisomy 12 occurs commonly in hPSCs, and confers a survival advantage by increasing proliferation rate, and changing the cellular expression profile to be more like a germ cell cancer [2–3]. In addition, amplification of 20q11.21 is present in up to 20% of hPSC lines after prolonged culture and confers a survival advantage[3]. Recurrent amplification in the 20q region has been observed for over 15 years in hESCs[4–5] and longer in pancreatic cancer[6] and is associated with an increase in the rate of proliferation. HESCs containing amplifications in 20q showed increased capacity to initiate teratomas in vivo without increased tendency to produce malignant teratocarcinomas[7]. The 20q11.21 minimal amplicon is approximately 0.55Mb long and encodes HM13, ID1, BCL2L1, KIF3B and an immature form of miR-1825. Although ID1 is also a potential oncogene, it is BCL2L1 that confers a survival advantage in carrier cells[8–9]. BCL2L1 encodes BCL-XL and BCL-XS as splice variants, however, BCL-XS is undetectable at the protein level in ESCs[8]. BCL-XL exerts an anti-apoptotic effect by regulating mitochondrial release of cytochrome c. Although BCL-XL overexpression, as a consequence of amplification of 20q11.21, confers resistance to cell death associated with single-cell passaging in vitro[8], the oncogenic risk in vivo remains to be established. Therefore, in vivo modelling is required.
The functional engraftment of hPSC-derived hepatocyte-like cells (HLCs) in murine liver has been demonstrated previously[10]. Additionally, undifferentiated hPSCs with known aberrations have been used in vivo to demonstrate enhanced tumorigenicity [2]. The aim of the study was to combine these approaches, luminescent hESCs both with and without 20q variants were differentiated into HLCs and injected intrasplenically into SCID-beige mice whose livers had been acutely damaged with carbon tetrachloride (CCk) to facilitate engraftment. The engraftment of these cells into the liver was tracked using in vivo luminescence imaging for approximately 4 months and the formation of malignancies was assessed.
Materials and methods
Production of the pCAG-LUC plasmid
pCAG Firefly Luciferase-2A-Puro was constructed by removing the EGFP-IRES-puromycin cassette from pCAG-EGFP using Xho1 and Nsi1 restriction enzymes. Firefly luciferase linked to puromycin by a P2A motif was amplified from pEF6 firefly Luciferase-2A-Puro and ligated into pCAG (Figure 1A). The plasmid was sequenced prior to use (Source Bioscience, Rochdale UK).
Figure 1. Transfection of undifferentiated hESCs with a luciferase construct and identification of appropriate dosage of CCl4 for consistent induction of acute liver injury in SCID-beige mice. (A) pCAG Firefly Luciferase-2A-Puro map (B) Haematoxylin and eosin staining of the liver of SCID-beige mice 24 or 72 hours after a single dose of CCl4 (0.2 or 0.4 mL/kg) or olive oil. Both doses of CCl4 induced severe coagulative necrosis of the centrilobular hepatocytes with or without the presence of acute haemorrhages (black arrows). After 72 hours, both groups showed a decreased degree of damage and a narrowing of the area of coagulative necrosis around the central vein with a continuous rim of hyper-basophilic regenerating hepatocytes and an increased number of mitotically active hepatocytes within the intervening healthy parenchyma. Olive oil did not elicit appreciable morphological degeneration of the hepatic parenchyma. (C) Mean hepatocellular damage score according to Thoolen et al. [19]. n=4 per condition (D) ALT activation in SCID-beige mice 24 and 72 hours after injection with CCl4. Data are displayed as U/L and show the mean, error bars show standard deviation. Significance was assessed using a paired two-tailed t-test, asterisks denote significance (*** = p≤0.001).

Derivation of hESCs
Derivation of the MS7 and MS8 cell lines was performed as described previously[11,12]. Briefly, derivation was performed at the Stem Cell Derivation Facility at the Centre for Stem Cell Biology, University of Sheffield, under HFEA licence R0115-8-A (Centre 0191) and HTA licence 22510, in a clean room setting, following standard operating procedures. The embryos used to derive MS7 (frozen) and MS8 (fresh) were donated from different Assisted Conception Units, following informed consent, with no financial benefit to the donors, and were surplus or unsuitable for their IVF treatment. Briefly, the embryos, were cultured using standard IVF culture media (Medicult), to the blastocyst stage. Following removal of the trophectoderm using a dissection laser the embryos were explanted whole onto mitotically inactivated human neonatal fibroblasts (human feeders) in KOSR/KODMEM medium (Life Technologies). Cell lines were initially maintained at 37°C under 5% O2/5% CO2, until the lines were established, after which maintenance switched 5% CO2 in air at 37°C. Cultures were passaged by cutting selected colonies under a dissection microscope at an average split ratio of 1:2 every 7 days. Both cell lines have been deposited at the UK Stem Cell bank (https://www.nibsc.org/ukstemcellbank) as accordance with the HFEA licence. From these clinically derived lines, four research grade versions were generated: MS7 (-20q11.21), a clonal cell line, karyotyped as 46XY and diploid for BCL2L1 by FISH. MS7 CNV (MS720q11.211, +20q11.21), was also a clonal cell line from the same heterogeneous starting population of MS7 QC6.2 (a research bank) and shown by FISH to have triplicate copies of BCL2L1, but otherwise karyotyped as 46XY. The breakpoint of the CNV was shown to be after the XKR7 (31,968,002) gene by qPCR using the method of Laing et. al[13].
Cloning was performed by single cell deposition of a heterogeneous starting population of MS7 (QC6.2) at P5+8+2 using a FACSJazz flow cytometer (Becton Dickinson) into 96 well plates with human feeder cells, Nutristem hPSC XF medium (Biological Industries) and Y-27632 [14]. After 24 hours the medium was changed to remove Y-27632 and the clones were expanded for 2 weeks before manual picking and culture. Seed banks were frozen from each clone at P5+8+5 (a ‘+’ in the passage number refers to a thaw from a cell bank), and material taken for detection of variants by qPCR[15], karyotyping and FISH. Once the genotypes were confirmed the clonal lines were thawed and were transferred to the University of Liverpool at passage P5+8+5+8 (MS7) and +9 (MS720q1121).
MS8 (-20q11.21) was a non-clonal culture originating from a research bank of MS8 (QC3.2) frozen at passage P2+9+5, and karyotyped as 46XY (normal), and were thawed and passaged a further 5 times (P2+9+5+5) before transfer to the University of Liverpool. MS8i20q (isochromosome 20q, i20q) originated from a different research bank (MS8 QC2), which was frozen at P2+9+5+9 and was shown by karyotype to be 46XY. This was confirmed shortly after thaw at P2+9+5+9+4 but following further culture at P2+9+5+9+17 (13 passages later) it developed a spontaneous i20q mutation in ~90% of the culture. These cells were frozen as a research cell bank (QC2.1 Abnormal) at passage P2+9+5+9+19 and then thawed and transferred to the University of Liverpool three passages later (P2+9+5+9+19+3).
hESC culture
hESCs were cultured in NutriStem hPSC XF medium on laminin-521 (ln-521) and passaged approximately every 5-6 days or when approaching confluence. Cells were passaged non-enzymatically using EDTA. Culture medium was removed, and cells were washed twice with phosphate buffered saline without calcium or magnesium (PBS). Cells were incubated in prewarmed 0.5 mM EDTA at 37°C until detachment was observed, typically within 5 minutes. Once detachment was observed, EDTA was removed, and cells were washed into culture medium and agitated by pipetting to disrupt large clusters before plating onto ln-521 coated tissue culture plates.
Transfection of hESC with pCAG-LUC plasmid
Plasmid DNA was prepared using the Qiagen Plasmid Maxi kit (Qiagen, UK) following the manufacturer’s protocol. Prior to transfection, hESCs were detached in the same manner as described for passaging and 2.5 x 10⁶ cells were aliquoted to each transfection or control. The cells were pelleted by centrifugation and resuspended in 100 pL of nucleofector solution 2 (Lonza, UK) and 6pg DNA. The suspension was transferred to an electroporation cuvette and single pulse at 1600 V, 20 ms was applied using an Amaxa Nucleofector II. The suspension was transferred to ln-521-coated 6-well plates and incubated under standard tissue culture conditions.
After 24h, the medium was removed and cells were washed with PBS and incubated with luciferin (150 pg/mL in PBS) in darkness for 5 minutes and bioluminescence was measured using an IVIS Spectrum (Perkin Elmer, UK). Cells were washed with PBS and NutriStem hPSC XF medium was added. Puromycin was added to the transfected cells 48 hours after transfection with the concentration of 0.7, 0.5, 0.1 and 0.4 pg/mL for MS8, MS8i20q, MS7 and MS720q11,21, respectively (based on a killing curve). Day 12 post-transfection, single clones were selected and transferred to ln-521-coated 96-well plates. Thirty clones were selected from each cell line and the ten with the greatest bioluminescence signal were expanded and cryopreserved. Clones were tested for amplicon 20q11.21 and karyotyped to check for chromosomal abnormalities. Next, the two clones with the strongest luminescent signal were selected and used for all subsequent experiments. Luminescence was periodically assessed after transfection to ensure that it was stably maintained, this was performed as described above.
Hepatocyte-like cell differentiation
hESCs were differentiated as previously described [16] and adapted according to protocol described by Siller et al.[17]. Prior to differentiation, hESCs were grown to 30-60% confluency on ln-521-coated plates in NutriStem hPSC XF medium. On day 1, medium was changed to RPMI-1640 medium supplemented with 100 ng/mL activin A (Peprotech, UK) and 50 ng/mL wnt3a (R&D Systems, UK) and changed daily for 3 days. On day 4, medium was changed to Knockout DMEM supplemented with 20% (v/v) KnockOut Serum Replacement, 1% (v/v) GlutaMAX, 100 pM MEM Non-Essential Amino Acids, 200 pM 2-mercaptoethanol (all Thermo Fisher Scientific), and 1% (v/v) DMSO (Sigma Aldrich) and changed every other day for 5 days. On day 9, the medium was changed to Leibovitz’s L-15 supplemented with 8.3% (v/v) tryptose phosphate broth, 8.3% (v/v) embryonic stem-cell FBS, 1% (v/v) GlutaMAX (all Thermo Fisher Scientific), 50 ng/mL sodium-L-ascorbate, 10 pM hydrocortisone 21-hemisuccinate, 1 pM insulin (bovine pancreas), 100 nM dexamethasone (all Sigma Aldrich), 20 ng/mL oncostatin M and 10 ng/mL hepatocyte growth factor (both Peprotech) and changed daily until day 12. All growth factors and other heat labile components were added immediately prior to use.
HepG2 cells were included as a positive control of an aggressively engrafting liver cancer cell type. They were cultured under standard tissue culture conditions in DMEM, supplemented with 10% FBS, 1% penicillin/streptomycin, 1% GlutaMAX. HepG2 cells were treated identically to HLCs at later stages with regard to cell number and injection method.
Flow cytometry
To assess differentiation efficiency of hESCs, flow cytometry was performed on cells at day 8 during the differentiation protocol. Cells were washed with PBS and detached using pre-warmed Accutase (STEMCELL Technologies, UK). Accutase was removed by centrifugation (1000 x g, 10 minutes) and cells were washed twice in PBS. Cells were fixed in 2% PFA (Sigma Aldrich) in PBS at room temperature (RT) for 30 minutes, washed with PBS and permeabilised in 0.1% (v/v) triton X-100 (Sigma Aldrich) at RT for 20 minutes. Cells were washed in PBS and blocked in 2.5% (v/v) normal donkey serum (NDS) (Abcam, UK) for 30 minutes at RT. Cells were washed again in PBS and resuspended in antibody diluent (0.5% (v/v) NDS, 0.05% sodium azide in PBS) with rabbit anti-human HNF4a (Santa Cruz) 1:50 overnight at 4°C. After primary incubation cells were washed 3 times in PBS and resuspended in anti-donkey AlexaFluor 488 (Life Technologies) 1:750 in antibody diluent and incubated for 2 hours at RT in darkness. Cells were washed once in PBS before resuspension in 1mL PBS with 1pM DAPI and subjected to flow cytometric analysis using a FACS Canto II (BD Biosciences).
Animal experiments
All animal experiments were conducted according to the UK Animals (Scientific Procedures) Act 1986 and approved by the University of Liverpool Animal Welfare Committee. 8-10-week-old SCID-beige mice (Charles River Laboratories, UK) were housed in a 12 h dark/light cycle in a temperature and humidity controlled, specific pathogen-free environment. Mice were fed CRM (P) diet (Special Diets Services) ad-libitum. Mice were acclimatised for seven days upon arrival.
CCl4 dose determination
The dose for CCl4 in SCID-beige mice has not previously been reported and was determined experimentally. A single dose of 1 mL/kg (10.33 mmol/kg), 0.4 mL/kg (4.14 mmol/kg) and 0.2 mL/kg (2.07 mmol/kg) of CCl4 was administered intraperitoneally and animals were monitored for recovery. Animals were sacrificed 24 and 72 hours later and liver damage was examined by H&E staining of liver tissue and ALT measurement as described below.
Cell engraftment
Animals received 0.2 mL/kg single dose of CCl4 diluted in olive oil (Sigma Aldrich) intraperitoneally (IP) to produce acute liver injury. After 24 hours, 75 pL of blood was collected by tail bleed to confirm the presence of liver injury. After 72 hours, animals were anaesthetised, and a laparotomy was performed to inject 1 x 10⁶ of either normal or abnormal undifferentiated hESCs (n=4 per cell line), HLCs (n=7 per cell line) or HepG2 cells (n=7) into the spleen [18]. For undifferentiated hESCs, animals were kept for 4 weeks and imaged weekly or fortnightly. The weights of the animals were monitored 3 times a week. Animals that received hepatocyte-like cells, were kept for up to 4 months and were imaged weekly or fortnightly. Animals receiving HepG2 cells were kept for up to 7 weeks before sacrifice and were imaged weekly. Twenty out of 74 (20/74) animals were excluded from the study for health reasons
At the end of the experiment, following bioluminescence imaging (see below), animals were culled via exposure to rising CO2 concentration. Livers and spleens were imaged ex vivo. For each animal, the right half of the liver median lobe and kidneys were flash frozen. The other half of median lobe was fixed in 4% PFA for histological examination. Blood was collected via cardiac puncture and allowed to clot for 30 min at room temperature before serum was isolated via centrifugation.
These experiments were planned and carried out in compliance with the ARRIVE guidelines.
Alanine aminotransferase assay
Serum ALT levels were measured using Infinity ALT Liquid Stable Reagent (Thermo Fisher Scientific), using the manufacturer’s protocol.
Bioluminescence imaging
SCID-beige mice received luciferase-labelled cells and were imaged using an IVIS Spectrum under anaesthesia with isoflurane. Prior to imaging, animals were injected IP with 150 mg/kg D-luciferin (Promega). Data were collected and analysed using Living Image software (Xenogen) according to the manufacturer’s instructions. Quantification of luminescence signals was achieved using the Region of Interest (ROI) function within Living Image software. Within a single experiment, an area was drawn around the broadest signal and used for all other animals in that experiment. Total flux within the ROI was considered as the signal intensity. For ex vivo imaging, mice were injected a second time with luciferin, culled, tissues excised and analysed using the IVIS platform. For quantification of ex vivo luminescence signals, an area was drawn around the dish containing the tissue.
qPCR for the presence of amplicon 20q11.21
The presence or absence of the 20q amplicon was checked regularly. Quantitative real-time PCR was performed for BCL2L2 with RELL1 as a reference gene following the protocol published by Baker et al. [15].
Human Albumin ELISA
Human albumin was quantified in serum taken from mice by cardiac puncture after sacrifice using a Human 72 Albumin Quantitation Set (Bethyl Laboratories, TX, USA) following the manufacturer’s protocol.
Histology and immunohistochemistry
Liver tissues were fixed in PFA for 24-48 hours, were trimmed and routinely embedded in paraffin wax. Consecutive 4 pm thick sections were prepared and routinely stained with haematoxylin and eosin (H&E). Individual selected cases were further examined with both histochemistry (PAS and Alcian-PAS) or subjected to immunohistochemical labelling. For the latter technique, a Dako Autostainer Link 48 was used. Following paraffin removal and re-hydration, EnVisionTM FLEX Peroxidase Blocking Reagent was used to quench endogenous peroxides. Before addition of the primary antibodies [against Vimentin (clone V9, Dako, 1:500), Pan-Cytokeratin (clones AE1/AE3, Dako, 1:200) and GFAP (Dako, Z 0334, 1:1000)], goat serum and Fab Fragment (unconjugated affinity purified Fab fragments goat anti-mouse IgG, Stratech Scientific) blocking steps were serially applied. Following this, slides were incubated with the EnVisionTM anti-mouse FLEX/HRP labelled polymer for 20 minutes, rinsed and then incubated with the EnVisionTM FLEX DAB + Substrate Chromogen System. Slides were counterstained with EnVisionTM FLEX Haematoxylin, then rehydrated and mounted as per routine histology. All histological and immunohistochemical specimens were examined by a veterinary pathologist (ER) who was blinded to the treatment of the animals. Samples were scored according to Thoolen et al. [19], these scores are a standard nomenclature to classify proliferative and non-proliferative lesions of the hepatobiliary system in rats, and were applied to mouse tissue in this case.
Statistical analysis
Statistical analyses were performed using several software packages including R, GraphPad and Microsoft Excel. Histology scores were tested using the Kruskal-Wallis rank sum test, all other statistical tests were two-tailed, unpaired student’s t-tests.
Results
SCID-beige mice are highly sensitive to acute carbon tetrachloride toxicity
With 10.33 and 4.14 mmol/kg CCI4, animals exceeded severity limits before reaching time points. Using 2.07 mmol/kg of CCl4 demonstrated a substantial degree of liver damage (Figure 1B, C) and ALT elevation (Figure 1D) at 24 and 72 hours after injection. Therefore, for subsequent experiments 2.07 mmol/kg was used.
Effects of variant 20q on teratoma formation
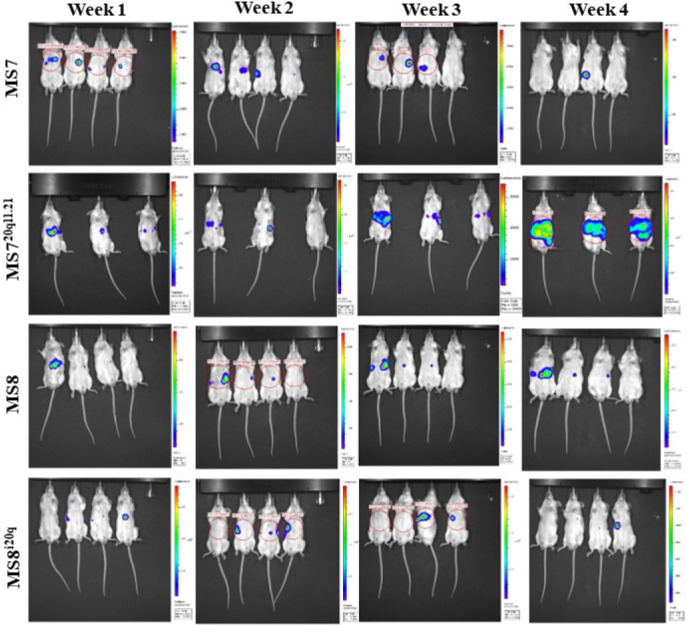
Luminescent cell lines were produced and each hESC line showed similar luminescence in vitro (Supplementary Figure 2B). Undifferentiated hESCs (MS7 1, MS8 1, MS720q11.21 1 and MS8i20q 1) were injected intrasplenically into SCID-beige mice (n = 4/line). In the first week, 14/15 animals showed a bioluminescent signal which increased over time (Figure 2A & B, Supplementary Figure 1). Luminescence intensity was significantly higher in MS720q11.21 compared to all other lines in both liver and spleen when imaged ex vivo (MS7 versus MS720q11.21, p = 0.0152). In addition, there was no significant difference in the luminescence intensity between MS8 and MS8 i20q in either tissue (MS8 versus MS8i20q, p = 0.1482) (Figure 2C). During ex vivo imaging, 14/15 livers and 4/15 spleens exhibited a luminescent signal in addition to macroscopically observable cystic lesions.
Figure 2. Undifferentiated hESCs with 20q11.21 amplicon induce extensive immature teratoma and teratocarcinoma in the murine liver. SCID-beige mice were injected with 1×10⁶ of undifferentiated MS7N, MS720211.21, MS8N or MS8i20q into the spleen and sacrificed after 28 days. (A) In vivo and ex vivo (liver and spleen) bioluminescence imaging of representative mice from each group after 28 days. See Supplementary Figure 1 for data from all mice. (B) Bioluminescence over time in vivo grouped by cell line. Values are plotted as mean total flux, error bars show SEM. (C) Mean bioluminescence of different cell lines imaged in livers and spleens ex vivo. Values are plotted as mean total flux, error bars show SEM. Differences were assessed using a two-tailed unpaired student’s t-test, asterisks denote the p-value (* = p ≤ 0.05, *** = p ≤ 0.001). Where no asterisks are shown no statistically significant difference was observed. (D) Haematoxylin and eosin staining of a representative liver tissue after injection with undifferentiated hESCs. Black arrows indicate immature teratoma, white arrows denote carcinomatous features (E) Grading of liver and spleen tissue from animals with intrasplenic injection of undifferentiated cells and grading system used to score liver and spleen tissues. Scoring was performed by a veterinary histopathologist according to Thoolen et al.[19]. (F) Representative IHC staining of liver and spleen tissue for vimentin and pan-cytokeratin to confirm the presence of teratoma.

In H&E staining, all cell lines demonstrated immature teratoma in at least one animal (Figure 2D, black arrows) with frequent observation of neuroepithelial tubules and carcinomatous features in MS8i20q (Figure 2D, white arrow). The frequency and severity of immature teratoma was greater in animals injected with MS720q11.21 compared with other lines, animals injected with MS720q11.21 were grade 5 in liver and spleen. All other lines were grade 0 in spleen and grade 0-3 in liver. A summary of the grading system is also given (Figure 2E)[19] and high-magnification H&E images are presented in Supplementary Figure 2A. Vimentin and pan-cytokeratin were expressed in liver and spleen of neoplastic tissues (Figure 2F).
Effects of variant 20q on tumorigenicity of HLCs
Differentiation efficiency of hESCs to HLCs using the protocol described in Figure 3A was assessed. After 8 days of differentiation, the percentage of HNF4a-positive cells was 90.7% (MS7 1), 87.6% (MS720q11.21), 96.3% (MS8) and 80.4% (MS8i20q) (Figure 3B).
Figure 3. Differentiation protocol and differentiation efficiency in MasterShef ESCs. (A) Overview of the differentiation protocol used, adapted from published protocols[16,17]. The top bar represents the day of the differentiation procedure and the medium and supplements used are shown underneath. Full details of the differentiation protocol can be found in the methods section. (B) Differentiation efficiency towards hepatocyte-like cells shown by HNF4a-positivity using flow cytometry. Cells were stained for HNF4a as a marker of differentiation and DAPI was used as a nuclear stain. Differentiation proportion is shown in white for each line.

One million hepatocyte-like cells from each line were intrasplenically injected into SCID-beige mice 72 hours after CCL4 injection and imaged as described in the methods section (n=7/line). Several animals showed poor health after injection of HLCs and were sacrificed early. The animals’ health deteriorated after approximately 4 months and the experiment was ended. SCID mice are prone to thymic lymphoma, indeed 6 thymus tumours were observed after the experiment was concluded and these animals were excluded from analysis. Animals injected with HepG2 cells were sacrificed after 7 weeks due to saturated luminescent signal and poor health.
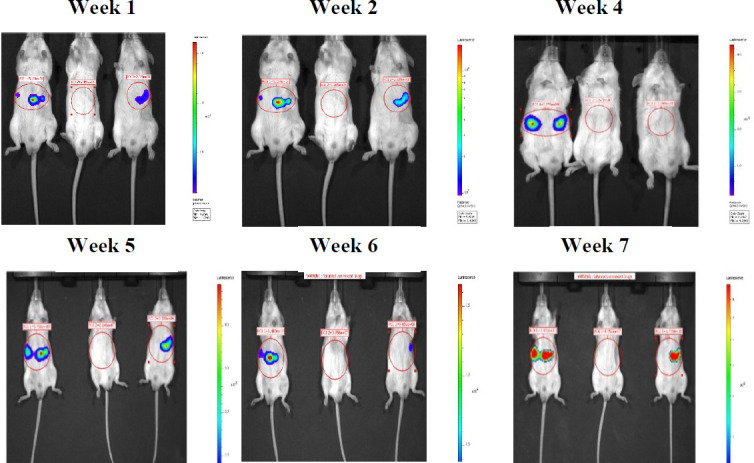
In vivo luminescence was observed in the livers and spleen of 3 animals injected with MS8i20q 1 and MS8i20q 2 after injection of HLCs (Figure 4A & B, Supplementary Figure 4) and was measured over the course of the experiment in each line (Figure 4B). Luminescent signals were observed briefly or not at all after injection with HLCs from other lines (Supplementary Figures 5-7). Figure 4B shows an increase in mean luminescent signal over time from HLCs derived from MS8i20q 2 and from MS8i20q 1 to a lesser extent. The luminescent signal from other lines was low and did not increase over time in culture. Due to high inter-animal variation (supplementary figures 4-7), the luminescent signals are not significantly different when tested at peak luminescence (two-tailed, unpaired student’s t-test, p=0.17-0.25). HepG2 cells expressing the same luciferase reporter were used as a positive control of a hepatic cancer cell type. A strong luminescent signal developed rapidly and became saturated after 5 weeks (Figure 4B, Supplementary Figure 3).
Figure 4. MasterShef Fluc HLCs sporadically luminesce in vivo and increase liver tissue histology scores (A) Representative luminescence images of SCID beige mice 6 weeks after intrasplenic injection with MS HLCs or HepG2 cells. Luminescence is displayed in the coloured overlay where warmer colours indicate higher luminescence intensity. (B) Luminescence over time for each MS HLC line or HepG2 cells. Values are plotted as mean total flux and error bars show SEM. (C) Mean histology scores for liver and spleen tissues separated by tissue and amplicon status. Tissues were scored by a veterinary histopathologist according to [19]. Horizontal black bars indicate the mean and SEM. Statistical analysis (Kruskal-Wallis rank sum test) showed no significant differences in histology score in liver (p= 0.06865) and spleen (p=1) based on amplicon 20q11.21 status (D) Haematoxylin and eosin staining of mouse liver after injection with MS HLCs. The line injected and the grade assigned to the imaged tissue is noted. Moving left to right, beginning with the top row, the images show 1) distended central veins in normal tissue, 2) large single nodular mass made of stellate mesenchymal cells suspended in a light eosinophilic matrix 3) normal tissue, mild central vein distension 4) moderate leukocyte infiltration in portal space and around biliary ducts and 5) a large neoplastic mass with scattered cyst-like areas (both acinuslike and distended vascular spaces). All images are 20× except for HepG2 which is 10×. Scale bars are 100 μm.
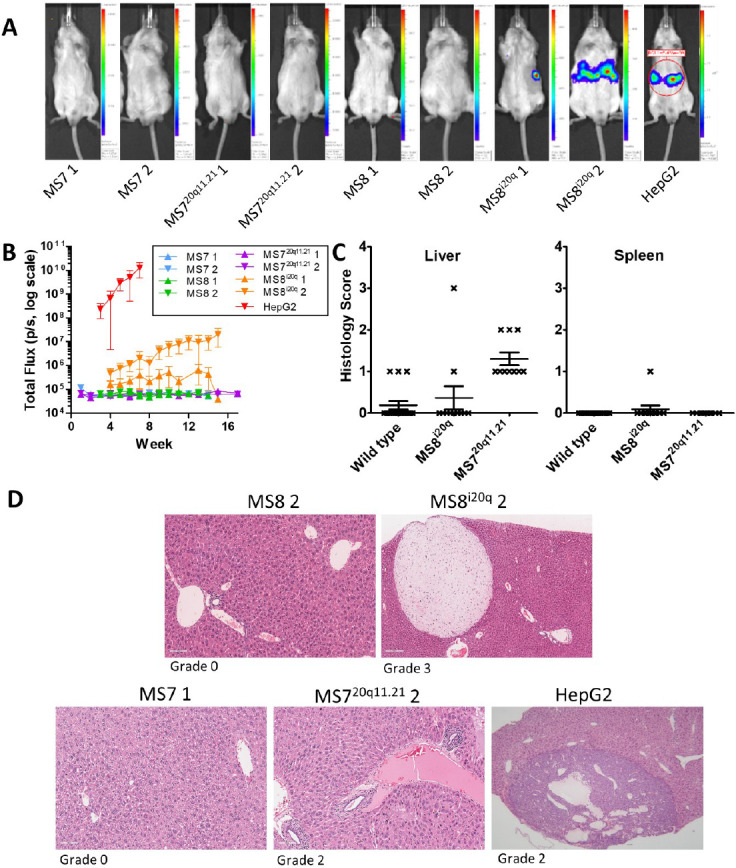
Histological sections of the liver and spleen of each animal were scored by a veterinary pathologist according to Thoolen et al [19](Figure 4C). Scores are based on several factors including the size of necrotic lesions in the hepatic lobule and increased scores denote greater severity of the lesion (Figure 2E). Mean liver and spleen histology scores were not significantly changed under any condition but trended higher in animals treated with MS720q11.21 (mean liver histology score was 0.36 with MS8i20q, 1.30 with MS720q11.21 and 0.19 in wild type, p=0.069 using the Kruskal-Wallis rank sum test, mean spleen histology score was 0.01 with MS8i20q 0.00 with MS720q11.21, 0.00 in wild type, p=1.00 using the Kruskal-Wallis rank sum test) (Figure 4C).
Haematoxylin and eosin staining was performed for the liver and spleen of each animal after sacrifice and scored according to Thoolen et al. [19]. Representative images of liver tissue sections are shown in Figure 4D, and the effects of each line are shown, the grade of the tissue pictured is noted beneath each image. In MS8 2, apart from congestive distension of veins, occasional periportal small infiltrates of inflammatory cells and a single cluster of mineralized parenchyma, no further changes were detected. In MS8i20q 2, the parenchyma appeared diffusely more compact as an effect of slightly more basophilic cytoplasm with homogenous appearance. Numerous and variably sized well demarcated masses, at the edges of tissue sections, composed of stellate or fusiform cells interspersed within an abundant pale eosinophilic matrix were present (benign mesenchymal neoplasms). In MS7 1, apart from the presence of small and rare aggregates of neutrophils and pigment granulomata, no further changes were observed. Occasional patchy areas of hydropic degeneration are also present. In MS720q11.21 2, there were multiple foci of perivascular lymphoplasmacytic infiltration, sparse Kupffer cells containing granular gold-stained material and numerous small aggregates of round cells (extramedullary haematopoiesis). In HepG2, the liver was multifocally distended and distorted by the expansion of highly cellular, well-demarcated and expansile neoplastic masses composed of cells arranged in large acini, papillae and large solid coalescing nests in association with moderate vascular stroma. Cells had a cuboidal profile, moderate amount of light eosinophilic cytoplasm and central round nuclei with finely stippled chromatin and large eosinophilic nucleoli. The mitotic index is elevated (18 x 10HPFs) with bizarre mitosis. Cellular atypia is mild. Cystic cavities containing pale eosinophilic fluid and sloughed necrotic neoplastic cells were observed. The remaining parenchyma presents numerous areas of mineralization.
Human albumin was detected in MS8i20q 1 at extremely low concentration compared to animals injected with HepG2 cells and was not detected in animals injected with other cell lines (data not shown).
Discussion
A major concern over the use of hPSC-derived cell therapies is the perceived risk of tumorigenicity. This is highlighted by reports of tumour formation several years after stem cell transplantation[20,21]. For example, a tumour was detected four years after foetal neural stem cell transplantation for ataxia telangiectasia[20] and a mucosal-like mass was reported eight years after treatment of a spinal injury with olfactory mucosal cells[21]. Undifferentiated PSCs can cause benign teratomas or potentially malignant teratocarcinomas, indeed teratoma formation can be used to examine the pluripotency of iPSCs[22]. The safety of cell therapies to their recipients is essential and the risks of teratoma from undifferentiated cells and the tumorigenic risk from genetic changes in transplanted cells must be managed[23]. With current 2D cell culture techniques, the accumulation of genetic aberrations appears to be unavoidable and even though some culture conformations reduce the rate of mutations[24], they do not eliminate them completely. Therefore, more data is required on which common genetic aberrations predispose hPSCs and their progeny to tumorigenesis, and which are relatively benign. With this information, a pragmatic position on which genetic changes are acceptable in hPSCs intended for clinical applications could be adopted[25]. This study may serve as a proof-of-concept that differences in in vivo tumorigenicity related to such abnormalities can be tested in this manner.
The 20q11.21 amplicon contains potential oncogenes including BCL2L2, ID1 and TPX2 and confers a survival advantage in vitro mediated by BCL2L2 overexpression[8,9]. However, it was not clear if this advantage would operate in vivo via the same mechanism, or at all. We hypothesised that cells containing the 20q11.21 amplification or i20q would show greater tumour-forming potential in vivo than wild type cells which would manifest as increased luminescence in vivo.
To facilitate engraftment, a single dose of CCl4 was used to damage liver and improve stem cell implantation based on the work described by Payne et al.[18] Although chronic treatment with CCl4 can lead to hepatic malignancies, we are not aware of any report on development of such a malignancy following a single dose of CCl4.
In the injection of undifferentiated hESCs, MS720q11.21 engrafted more readily than other cell types and produced the greatest disruption to tissue with higher histology scores in both liver and spleen. In undifferentiated cells the detection of vimentin and pan-cytokeratin in liver and spleen is noteworthy. Vimentin is the first intermediate filament expressed in the cytoplasm of foetal cells during development, before being replaced by cytokeratins in epithelial tissues during increasing cell differentiation. Therefore, coupled with the biphasic pattern of morphological differentiation of the neoplastic cells (Figure 2F), the observation of specific cytokeratin labelling in structures resembling large acini supports the hypothesis that initial epithelial commitment of a proportion of the neoplastic cells is well-established. Therefore, both mesenchymal and epithelial differentiations are present within most of the neoplastic masses.
After differentiation, MS720q11.21-derived HLCs tended to result in increased histology scoring, similar to their increased propensity to engraft aggressively when undifferentiated. MS8i20q showed increased luminescent signal in vivo, but without substantially increased mean histology scores. In addition, MS8i20q was the only cell type with detectable human albumin after 4 months, albeit at very low levels. The increased luminescence of MS8i20q could be explained by the lower proportion of differentiated cells. Hepatic differentiation was assessed by HNF4a expression, an established marker for this purpose[26]. It is not clear whether i20q itself hinders hepatic differentiation, the proportion of HNF4a-positive cells was lower than other lines but was deemed acceptable since the proportion of HNF4a-positive cells tends to increase after the timepoint measured in this study (unpublished observations) and ultimately did not result in teratoma formation in vivo.
In most animals, the engraftment of undifferentiated cells could be detected by a luminescent signal. However, in most animals injected with differentiated cells, a signal was observed only briefly or not at all. The loss of luminescent signal and lack of human albumin expression in most lines suggests a failure to engraft or survive in vivo. However, since the animal from which albumin was detected showed no luminescent signal it is also possible that the luminescent reporter was silenced, furthermore MS720q11.21-derived HLCs tended to result in increased histology scoring without luminescence, suggesting long-term survival in vivo. It is also possible that the signals observed are derived from undifferentiated or poorly differentiated cells that have persisted through differentiation.
Dedifferentiation of cells after injection has been reported previously[18] and is possible in this case. However, other reports using similar protocols have observed long-term survival of engrafted cells in vivo[27]. There were minor differences in the differentiation protocol, strain of mice and cell lines used, that may have prevented integration of HLCs in this study. In animals injected with HepG2 cells there were detectable quantities of human albumin indicating successful engraftment as demonstrated elsewhere [28]. However, the animals injected with HepG2 cells were measured at an earlier time point than those injected with HLCs, potentially explaining the lack of human albumin expression in most lines.
It is surprising that HLCs derived from MS8i20q behaved similarly to wild type given the survival advantage conferred by 20q amplification in vitro. Cells containing the amplicon are protected against cell death when reduced to a single cell suspension such as during single cell passaging and whilst an analogous process does not occur in vivo; the cells were injected in suspension and the same mechanism may have allowed a greater number of cells to survive and engraft after this process. However, why this advantage should not also apply to cells with i20q is unclear. Crucially, these results suggest that survival advantage in vitro does not necessarily translate to an increased propensity to form tumours in vivo and that the situation is more nuanced. Within the timeframe of this experiment, it is not possible to reject the notion that although no effects for i20q were observed after differentiation, the amplification may represent a ‘hit’ in the progression towards a cancerous phenotype.
In vivo imaging was used to track the fate of luminescent cells non-destructively allowing for the use of fewer animals than would otherwise have been necessary, in line with the key tenets of the 3R’s. Moreover, it was possible to track the progression of engraftment over time and to rapidly determine the success of engraftment based on the presence of luminescence. However, there were also limitations to this approach; imaging in this manner produces a 2D view of the luminescent signal, necessitating imaging from multiple angles to triangulate the source of the signal. Moreover, is it possible that weaker signals were attenuated by the animal’s body. Future studies may consider the use of emerging luminescence imaging techniques [29,30] with increased tissue penetration and sensitivity. Also lack of long term sustainability of bioluminescence of engrafted stem cells is a known limitation [31]. Using two step transcriptional amplification can boost bioluminescence signals in vivo[32]. Future studies could consider the use of more complete humanisation models e.g. TK-NOG or fah(-/-) mice, where survival of the animal is contingent upon engraftment, or a longer-lived immunocompromised mouse, such as a NOD-SCID gamma mouse, which would provide more certainty of the survival of the engrafting cells and their long-term effects, respectively.
In summary, these results show engraftment of differentiated cells into an animal model and demonstration of an improved engraftment or survival phenotype in vivo in differentiated cells with 20q11.21 amplification. However, the i20q minimal amplicon behaved similarly to wild-type cells once differentiated. Future studies should take place to screen lines known to harbour common amplicons when they are being considered for use in transplant. These results suggest that the 20q11.21 minimal amplicon indeed poses a tumorogenic risk in vivo and that use of cells containing it should be excluded from future therapeutic and in vivo studies.
Funding
This work was funded by UK Regenerative Medicine Platform
Competing interests’ statement
The authors declare no conflicts of interest.
Supplementary Information
Supplemental Figure 1. Representative bioluminescence images of SCID beige mice intrasplenically injected with undifferentiated hESCs - Images show luminescence over time from side and front elevations. Red circles show regions of interest used to determine luminescence intensity, in this case showing radiance, though total flux was also recorded. Luminescence intensity is represented by the coloured overlays with warmer colour indicating greater intensity. Each scale bar applies only to the image to its immediate left. The order of animals is consistent between images.
Supplemental Figure 2. A. High magnification histology - Haematoxylin and eosin staining of representative livers 4 weeks after injection with undifferentiated hESCs with different magnifications. B. Luminescence of undifferentiated MS lines in vitro. Values are photons/second (p/s) from a confluent well of a 24-well plate.

Supplemental Figure 3. Representative bioluminescence images of SCID beige mice intrasplenically injected with HepG2_Fluc - Images show luminescence over time from side and front elevations. Red circles show regions of interest used to determine luminescence intensity, in this case showing radiance, though total flux was also recorded. Luminescence intensity is represented by the coloured overlays with warmer colour indicating greater intensity. Each scale bar applies only to the image to its immediate left. The order of animals is consistent between images.
Supplemental Figure 4. Representative bioluminescence images of SCID beige mice intrasplenically injected with MS8l20q 1 (left) & 2 (right) hESC-HLCs Images show luminescence over time from side and front elevations. Red circles show regions of interest used to determine luminescence intensity, in this case showing radiance, though total flux was also recorded. Luminescence intensity is represented by the coloured overlays with warmer colour indicating greater intensity. Each scale bar applies only to the image to its immediate left. The order of animals is consistent between images, after week 6, at 4 weeks, animal 2 and 3 were mis-placed. Some animals were excluded due to thymic lymphoma discovered at the end of the experiment and are indicated with an asterisk (*).

Supplemental Figure 5. Representative bioluminescence images of SCID beige mice intrasplenically injected with MS8 1 (left) & 2 (right) hESC-HLCs - Images show luminescence over time from side and front elevations. Red circles show regions of interest used to determine luminescence intensity, in this case showing radiance, though total flux was also recorded. Luminescence intensity is represented by the coloured overlays with warmer colour indicating greater intensity. Each scale bar applies only to the image to its immediate left. The order of animals is consistent between images. Some animals were excluded due to thymic lymphoma discovered at the end of the experiment and are indicated with an asterisk (*).

Supplemental Figure 6. Representative bioluminescence images of SCID beige mice intrasplenically injected with MS720qIL211 (left) & 2 (right) hESC-HLCs - Images show luminescence over time from front elevations. Red circles show regions of interest used to determine luminescence intensity, in this case showing radiance, though total flux was also recorded. Luminescence intensity is represented by the coloured overlays with warmer colour indicating greater intensity. Each scale bar applies only to the image to its immediate left. The order of animals is consistent between images. In MS720q11.211 after week 4, one animal was sacrificed due to poor health and the remaining animal is that on the furthest right of the remaining images. Some animals were excluded due to thymic lymphoma discovered at the end of the experiment and are indicated with an asterisk (*).

Supplemental Figure 7. Representative bioluminescence images of SCID beige mice intrasplenically injected with MS7 1 (left) & 2 (right) hESC-HLCs - Images show luminescence over time from front elevations. Red circles show regions of interest used to determine luminescence intensity, in this case showing radiance, though total flux was also recorded. Luminescence intensity is represented by the coloured overlays with warmer colour indicating greater intensity. Each scale bar applies only to the image to its immediate left. The order of animals is consistent between images. Some animals were excluded due to thymic lymphoma discovered at the end of the experiment and are either not shown or indicated with an asterisk In MS7 2, after week 1, the animals in the second row are the two animals to the furthest right in subsequent images.

References
- 1.Harrison NJ, Baker D, Andrews PW. Advances in Stem Cell Research. Stem Cell Biology and Regenerative Medicine. Humana Press; Totowa, NJ: 2012. The Significance of Culture Adaptation of Embryonic Stem Cells for Regenerative Medicine. pp. 17–27. [DOI] [Google Scholar]
- 2.Ben-David U, Arad G, Weissbein U, Mandefro B, Maimon A, Golan-Lev T, Narwani K, Clark AT, Andrews PW, Benvenisty N, Carlos Biancotti J. Aneuploidy induces profound changes in gene expression, proliferation and tumorigenicity of human pluripotent stem cells. Nat Commun. 2014;5:4825. doi: 10.1038/ncomms5825. [DOI] [PubMed] [Google Scholar]
- 3.International Stem Cell Initiative. Amps K, Andrews PW et al. Screening ethnically diverse human embryonic stem cells identifies a chromosome 20 minimal amplicon conferring growth advantage. Nat Biotechnol. 2011;29((12)):1132–44. doi: 10.1038/nbt.2051. [DOI] [PMC free article] [PubMed] [Google Scholar]
- 4.Spits C, Mateizel I, Geens M, Mertzanidou A, Staessen C, Vandeskelde Y, Van der Elst J, Liebaers I, Sermon K. Recurrent chromosomal abnormalities in human embryonic stem cells. Nat Biotechnol. 2008;26((12)):1361–3. doi: 10.1038/nbt.1510. [DOI] [PubMed] [Google Scholar]
- 5.Maitra A, Arking DE, Shivapurkar N, Ikeda M, Stastny V, Kassauei K, Sui G, Cutler DJ, Liu Y, Brimble SN, Noaksson K, Hyllner J, Schulz TC, Zeng X, Freed WJ, Crook J, Abraham S, Colman A, Sartipy P, Matsui S, Carpenter M, Gazdar AF, Rao M, Chakravarti A. Genomic alterations in cultured human embryonic stem cells. Nat Genet. 2005;37((10)):1099–103. doi: 10.1038/ng1631. [DOI] [PubMed] [Google Scholar]
- 6.Mahlamaki EH, Barlund M, Tanner M, Gorunova L, Hoglund M, Karhu R, Kallioniemi A. Frequent amplification of 8q24, 11q, 17q, and 20q-specific genes in pancreatic cancer. Genes Chromosomes Cancer. 2002;35((4)):353–8. doi: 10.1002/gcc.10122. [DOI] [PubMed] [Google Scholar]
- 7.Werbowetski-Ogilvie TE, Bosse M, Stewart M, Schnerch A, Ramos-Mejia V, Rouleau A, Wynder T, Smith MJ, Dingwall S, Carter T, Williams C, Harris C, Dolling J, Wynder C, Boreham D, Bhatia M. Characterization of human embryonic stem cells with features of neoplastic progression. Nat Biotechnol. 2009;27((1)):91–7. doi: 10.1038/nbt.1516. [DOI] [PubMed] [Google Scholar]
- 8.Nguyen HT, Geens M, Mertzanidou A, Jacobs K, Heirman C, Breckpot K, Spits C. Gain of 20q11.21 in human embryonic stem cells improves cell survival by increased expression of Bcl-xL. Mol Hum Reprod. 2014;20((2)):168–77. doi: 10.1093/molehr/gat077. [DOI] [PubMed] [Google Scholar]
- 9.Avery S, Hirst AJ, Baker D, Lim CY, Alagaratnam S, Skotheim RI, Lothe RA, Pera MF, Colman A, Robson P, Andrews PW, Knowles BB. BCL-XL mediates the strong selective advantage of a 20q11.21 amplification commonly found in human embryonic stem cell cultures. Stem Cell Reports. 2013;1((5)):379–86. doi: 10.1016/j.stemcr.2013.10.005. [DOI] [PMC free article] [PubMed] [Google Scholar]
- 10.Asgari S, Moslem M, Bagheri-Lankarani K, Pournasr B, Miryounesi M, Baharvand H. Differentiation and transplantation of human induced pluripotent stem cell-derived hepatocyte-like cells. Stem Cell Rev Rep. 2013;9((4)):493–504. doi: 10.1007/s12015-011-9330-y. [DOI] [PubMed] [Google Scholar]
- 11.Frith TJR, Gogolou A, Hackland JOS, Hewitt ZA, Moore HD, Barbaric I, Thapar N, Burns AJ, Andrews PW, Tsakiridis A, McCann CJ. Retinoic Acid Accelerates the Specification of Enteric Neural Progenitors from In-Vitro-Derived Neural Crest. Stem Cell Reports. 2020;15((3)):557–565. doi: 10.1016/j.stemcr.2020.07.024. [DOI] [PMC free article] [PubMed] [Google Scholar]
- 12.Vitillo L, Durance C, Hewitt Z, Moore H, Smith A, Vallier L. GMP-grade neural progenitor derivation and differentiation from clinical-grade human embryonic stem cells. Stem Cell Res Ther. 2020;11((1)):406. doi: 10.1186/s13287-020-01915-0. [DOI] [PMC free article] [PubMed] [Google Scholar]
- 13.Laing O, Halliwell J, Barbaric I. Rapid PCR Assay for Detecting Common Genetic Variants Arising in Human Pluripotent Stem Cell Cultures. Curr Protoc Stem Cell Biol. 2019;49((1)):e83. doi: 10.1002/cpsc.83. [DOI] [PubMed] [Google Scholar]
- 14.Watanabe K, Ueno M, Kamiya D, Nishiyama A, Matsumura M, Wataya T, Takahashi JB, Nishikawa S, Nishikawa S, Muguruma K, Sasai Y. A ROCK inhibitor permits survival of dissociated human embryonic stem cells. Nat Biotechnol. 2007;25((6)):681–6. doi: 10.1038/nbt1310. [DOI] [PubMed] [Google Scholar]
- 15.Baker D, Hirst AJ, Gokhale PJ, Juarez MA, Williams S, Wheeler M, Bean K, Allison TF, Moore HD, Andrews PW, Barbaric I. Detecting Genetic Mosaicism in Cultures of Human Pluripotent Stem Cells. Stem Cell Reports. 2016 Nov 8;7((5)):998–1012. doi: 10.1016/j.stemcr.2016.10.003. [DOI] [PMC free article] [PubMed] [Google Scholar]
- 16.Medine CN, Lucendo-Villarin B, Zhou W, West CC, Hay DC. Robust generation of hepatocyte-like cells from human embryonic stem cell populations. J Vis Exp. 2011. p. e2969. [DOI] [PMC free article] [PubMed]
- 17.Siller R, Greenhough S, Naumovska E, Sullivan GJ. Small-molecule-driven hepatocyte differentiation of human pluripotent stem cells. Stem Cell Reports. 2015;4((5)):939–52. doi: 10.1016/j.stemcr.2015.04.001. [DOI] [PMC free article] [PubMed] [Google Scholar]
- 18.Payne CM, Samuel K, Pryde A, King J, Brownstein D, Schrader J, Medine CN, Forbes SJ, Iredale JP, Newsome PN, Hay DC. Persistence of functional hepatocyte-like cells in immune-compromised mice. Liver Int. 2011;31((2)):254–62. doi: 10.1111/j.1478-3231.2010.02414.x. [DOI] [PubMed] [Google Scholar]
- 19.Thoolen B, Maronpot RR, Harada T, Nyska A, Rousseaux C, Nolte T, Malarkey DE, Kaufmann W, Kuttler K, Deschl U, Nakae D, Gregson R, Vinlove MP, Brix AE, Singh B, Belpoggi F, Ward JM. Proliferative and nonproliferative lesions of the rat and mouse hepatobiliary system. Toxicol Pathol. 2010;38((7 Suppl)):5S–81S. doi: 10.1177/0192623310386499. [DOI] [PubMed] [Google Scholar]
- 20.Amariglio N, Hirshberg A, Scheithauer BW, Cohen Y, Loewenthal R, Trakhtenbrot L, Paz N, Koren-Michowitz M, Waldman D, Leider-Trejo L, Toren A, Constantini S, Rechavi G. Donor-derived brain tumor following neural stem cell transplantation in an ataxia telangiectasia patient. PLoS Med. 2009;6((2)):e1000029. doi: 10.1371/journal.pmed.1000029. [DOI] [PMC free article] [PubMed] [Google Scholar]
- 21.Dlouhy BJ, Awe O, Rao RC, Kirby PA, Hitchon PW. Autograft-derived spinal cord mass following olfactory mucosal cell transplantation in a spinal cord injury patient: Case report. J Neurosurg Spine. 2014;21((4)):618–22. doi: 10.3171/2014.5.SPINE13992. [DOI] [PubMed] [Google Scholar]
- 22.International Stem Cell Initiative. Assessment of established techniques to determine developmental and malignant potential of human pluripotent stem cells. Nat Commun. 2018;9((1)):1925. doi: 10.1038/s41467-018-04011-3. [DOI] [PMC free article] [PubMed] [Google Scholar]
- 23.Nicolas CT, Hickey RD, Chen HS, Mao SA, Lopera Higuita M, Wang Y, Nyberg SL. Concise Review: Liver Regenerative Medicine: From Hepatocyte Transplantation to Bioartificial Livers and Bioengineered Grafts. Stem Cells. 2017;35((1)):42–50. doi: 10.1002/stem.2500. [DOI] [PMC free article] [PubMed] [Google Scholar]
- 24.Huch M, Gehart H, van Boxtel R, Hamer K, Blokzijl F, Verstegen MM, Ellis E, van Wenum M, Fuchs SA, de Ligt J, van de Wetering M, Sasaki N, Boers SJ, Kemperman H, de Jonge J, Ijzermans JN, Nieuwenhuis EE, Hoekstra R, Strom S, Vries RR, van der Laan LJ, Cuppen E, Clevers H. Long-term culture of genome-stable bipotent stem cells from adult human liver. Cell. 2015;160((1–2)):299–312. doi: 10.1016/j.cell.2014.11.050. [DOI] [PMC free article] [PubMed] [Google Scholar]
- 25.Andrews PW et al. International Stem Cell Banking Initiative (ISCBI). Regen Med. 2015;10((2 Suppl)):1–44. doi: 10.2217/rme.14.93. [DOI] [PubMed] [Google Scholar]
- 26.DeLaForest A, Nagaoka M, Si-Tayeb K, Noto FK, Konopka G, Battle MA, Duncan SA. HNF4A is essential for specification of hepatic progenitors from human pluripotent stem cells. Development. 2011;138((19)):4143–53. doi: 10.1242/dev.062547. [DOI] [PMC free article] [PubMed] [Google Scholar]
- 27.Takayama K, Akita N, Mimura N, Akahira R, Taniguchi Y, Ikeda M, Sakurai F, Ohara O, Morio T, Sekiguchi K, Mizuguchi H. Generation of safe and therapeutically effective human induced pluripotent stem cell-derived hepatocyte-like cells for regenerative medicine. Hepatol Commun. 2017;1((10)):1058–1069. doi: 10.1002/hep4.1111. [DOI] [PMC free article] [PubMed] [Google Scholar]
- 28.Hasegawa M, Kawai K, Mitsui T, Taniguchi K, Monnai M, Wakui M, Ito M, Suematsu M, Peltz G, Nakamura M, Suemizu H. The reconstituted 'humanized liver' in TK-NOG mice is mature and functional. Biochem Biophys Res Commun. 2011;405((3)):405–10. doi: 10.1016/j.bbrc.2011.01.042. [DOI] [PMC free article] [PubMed] [Google Scholar]
- 29.Yeh HW, Karmach O, Ji A, Carter D, Martins-Green MM, Ai HW. Red-shifted luciferase-luciferin pairs for enhanced bioluminescence imaging. Nat Methods. 2017;14((10)):971–974. doi: 10.1038/nmeth.4400. [DOI] [PMC free article] [PubMed] [Google Scholar]
- 30.Iwano S, Sugiyama M, Hama H, Watakabe A, Hasegawa N, Kuchimaru T, Tanaka KZ, Takahashi M, Ishida Y, Hata J, Shimozono S, Namiki K, Fukano T, Kiyama M, Okano H, Kizaka-Kondoh S, McHugh TJ, Yamamori T, Hioki H, Maki S, Miyawaki A. Single-cell bioluminescence imaging of deep tissue in freely moving animals. Science. 2018;359((6378)):935–939. doi: 10.1126/science.aaq1067. [DOI] [PubMed] [Google Scholar]
- 31.Eun Kim J, Ahn BC, Won Lee H, Hwang MH, Hyun Shin S, Woo Lee S, Kwan Sung Y, Lee J. In vivo monitoring of survival and proliferation of hair stem cells in a hair follicle generation animal model. Mol Imaging. 2013;12((5)):310–7. [PubMed] [Google Scholar]
- 32.Madsen SD, Giler MK, Bunnell BA, O'Connor KC. Illuminating the Regenerative Properties of Stem Cells In Vivo with Bioluminescence Imaging. Biotechnol J. 2021 Mar;16((3)):e2000248. doi: 10.1002/biot.202000248. [DOI] [PubMed] [Google Scholar]