

Abstract
Background
This study aimed to describe the trends in incidence, mortality, and burden of tracheal, bronchial and lung (TBL) cancer in Asia from 2010 through 2019 and compare with global and other continental data.
Methods
We collected TBL cancer data from the 2019 Global Burden of Disease (GBD) study from 2010 to 2019 in 49 countries and territories in Asia. For all locations, annual case data and age‐standardized rates (ASRs) were used to investigate the incidence, prevalence, mortality, and disability‐adjusted life‐years (DALYs) of TBL from 2010 to 2019. The relative difference (%) between years was used to show comparative variations of ASRs for the indicators studied.
Results
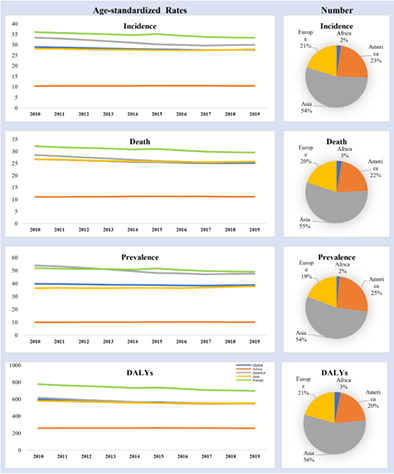
In 2019, more than 55% of TBL cancer cases and deaths occurred in Asian countries. A total of 57% of lung cancer patients lived in Asia and almost 60% of the global burden of lung cancer was imposed on Asian countries. From 2010 to 2019, incidences, deaths, prevalence cases, and DALYs number of TBL cancer increased over 1.34‐, 1.31‐, 1.31‐, and 1.26‐fold, in Asia. During this period, the age‐standardized incidence rate (ASIR), the age‐standardized death rate (ASDR), the age‐standardized prevalence rate (ASPR), and the age‐standardized DALYs rate (DALYs ASR) of TBL cancer decreased by 1, 3, 4, and 4%, respectively. While at the same time, the decreasing trend of these rates globally and in America and in Europe happened faster. In 2019, age‐specific incidence, death, prevalence, and DALY cases of TBL cancer were peaking at 65–74, 70–74, 65–69, and 65–69 years, respectively. In 2019, the highest ASIR, ASDR, and DALYs ASR of TBL cancer was observed in East Asia countries and the highest ASPR in high‐income Asia Pacific countries. Central Asia and high‐income Asia Pacific countries experienced a decreasing trend in ASIR and ASDR, and the South Asia countries experienced the highest increasing trend from 2010 to 2019. ASPR only decreased in Central Asia, and DALYs ASR only increased in South Asia. In 2019, among high sociodemographic index (SDI) Asian countries, Brunei Darussalam had the highest ASIR, ASDR, and DALYs ASR and the Republic of Korea had the highest ASPR. Among high‐middle SDIs, Turkey and Georgia; among middle SDIs, China and Armenia; among low‐middle SDIs, Mongolia and the Democratic People's Republic of Korea had the highest ASIR, ASDR, ASPR, and DALY ASR of TBL cancer. Among low SDI Asian countries, Pakistan had the highest ASIR, ASDR, ASPR, and DALY ASR of TBL cancer.
Conclusion
Most of the global burden of lung cancer occurs in Asian countries, and the decreasing trend of incidence, death, prevalence, and burden of this cancer in these countries is slower than in other regions. Therefore, the implementation of necessary measures in order to reduce the process of this cancer is considered urgent.
Keywords: Asia, bronchus, burden, incidence, Lungl, mortality, prevalence
In 2019, more than 55% of tracheal, bronchus, and lung (TBL) cancer cases and deaths occurred in Asian countries. A total of 57% of lung cancer patients lived in Asia and almost 60% of the global burden of TBL cancer was imposed on Asian countries. From 2010 to 2019, the age‐standardized incidence rate (ASIR), age‐standardized death rate (ASDR), age‐standardized death rate (ASDR), and age‐standardized DALYs rate (DALYs ASR) of TBL cancer decreased by 1, 3, 4, and 4%, respectively. While at the same time, the decreasing trend of these rates globally and in America and in Europe happened faster.
INTRODUCTION
One of the worldwide leading causes of death is cancer and its burden is not consistent. 1 Particularly between developing and developed countries, the incidence, mortality, and disability‐adjusted life year (DALY) burden of cancer vary considerably across countries and regions. 2 , 3 , 4 , 5
Globally, TBL cancers are among important public health issues and the burden of these cancers varies in different countries. 6 , 7 In the past few decades, lung cancer has been the most common malignancy and cause of cancer deaths. 8 Furthermore, lung cancer remains the leading cause of cancer‐related deaths in men and women 9 and an important public health issue due to a 5‐year survival rate of 17.8% 10 and a high fatality rate. 11
According to the latest GLOBOCAN estimates of cancer incidence and mortality in 2020, a total of 2 206 771 new cases were estimated, accounting for 11.4% of all new cancer diagnoses. 12 In addition, according to the Global Cancer Observatory: Cancer Today statistics by the International Agency for Research on Cancer (IARC), after breast and prostate cancer, lung cancer had the third highest incidence and mortality in Asia in 2020. 13 In 2020, the Global Burden of Disease (GBD) study reported that the worldwide healthcare burden and costs attributed to lung cancer are significant. 14 In males and females, the age‐standardized cumulative lifetime risk of lung cancer diagnosis is 3.8% and 1.77%, respectively. 7 , 13 In Asia, the highest age‐standardized rate has been shown in Turkey and the lowest age‐standardized rate in Saudi Arabia. 15 , 16
Lung cancer has several risk factors. Nonmodifiable risk factors include; age, gender, family history and race/ethnicity, and modifiable risk factors include; tobacco smoking, cannabis smoking, asbestos, radon, arsenic, air pollution, infection, and chronic obstructive pulmonary diseases. 17 Lung cancer is more prevalent among men, individuals >60 years old, African Americans, and people with a positive family history. 17 Tobacco smoking is the most important risk factor for lung cancer, and 81.7% of lung cancer cases and 81.3% of lung cancer deaths are closely related to cigarette smoking. 18 In smokers, the relative risk of lung cancer is about 20‐fold higher than in nonsmokers. 19 On the other hand, the worldwide incidence of lung cancer is on the rise with increased industrialization. 20 In this study, the trends of incidence, mortality, and burden of TBL cancer in Asia from 2010 through 2019 based on the sociodemographic index (SDI) are described and these data compared with the trend in global and other continents.
METHODS
Source data
The annual data for 49 Asian countries and territories and six GBD regions, global and continents in the context of incidence, prevalence, death, and the burden imposed by TBL cancer were extracted from the GBD 2019. The GBD 2019 were accessed via the online data source Global Health Data Exchange (GHDx) query tool (http://ghdx.healthdata.org/gbd-results-tool) based on the International Classification of Diseases 10 (ICD‐10) (code [C56.9] for TBL cancer). GBD estimates all available epidemiological data (incidence, mortality, prevalence, year of life lost [YLL], years lived with disability [YLD], and disability‐adjusted life years [DALY]) by time, location, gender, and age group for the comparative assessment of health loss due to 364 diseases and injuries across 204 countries and territories from 1990 to 2019. 21 , 22
In this study, data were extracted for various classifications of Asian countries on the basis of a sociodemographic index (SDI), and six GBD regions of Asia from 2010 to 2019 and compared with worldwide and other continental data. Specifically, we used data for North Africa and the Middle East, given that 15 out of 21 GBD countries in North Africa and the Middle East belong to West Asia. In Southeast Asian countries, two were also from Africa.
GBD has developed a standardized international form of quality‐adjusted life year (QALY), known as the DALY, and is defined as a wasted year of healthy living as a result of premature death and years with a disability of specific severity and duration. "Premature" death is a death that occurs at an age when a person's death is not expected. The expected age at death for a person is calculated based on the predicted death for a certain age in a population standardized to the population of Japan, which has the longest life expectancy at birth in the world. The total number of DALYs for a given condition within a population is equal to the sum of years of life lost (YLLs) and years of disability of known severity and duration (YLDs). 23 , 24
The SDI is the geometric average of three indicators: (1) lag‐distributed income per capita, (2) average educational attainment of people aged 15 years and older, and (3) the total fertility rate (in people aged <25 years). 25 The SDI is the reflection of levels of social and economic conditions that can affect health outcomes in a given location. Countries and territories were categorized into five groups based on SDI values: low SDI (<0.45), low‐middle SDI (≥0.45 and <0.61), middle SDI (≥0.61 and <0.69), high‐middle SDI (≥0.69 and <0.80), and high SDI (≥0.80). 26 , 27
An age‐standardized rate (ASR) is a weighted average of the age‐specific rates per 100 000 persons, where the weights are the proportions of people within the corresponding age groups of the WHO standard population. Age‐standardized rates take into account differences in the age distribution of the population by applying the rates for each population to a standardized population. 28
Ethical considerations
The study was approved by the Ethics Committee of the Jahrom University of Medical Sciences in Iran (IR.JUMS.REC.1401.094). Informed consent was not necessary due to the use of the anonymous online dataset.
Statistical analysis
To remove the influence of the composition of different age groups within populations, incidence, prevalence, deaths, DALY and age‐standardized rates are expressed per 100 000 population. The data are reported as values with 95% confidence intervals (CI). Selected epidemiological indicators are presented separately for each classification system. To show comparative changes in incidence, prevalence, mortality, and age‐standardized rates, the relative difference (%) between years was used. The relative difference was calculated by dividing the value of the absolute difference by the value of the year of origin, which was then multiplied by 100. 29 The definition of what was used can be accessed via https://www.healthdata.org/terms-defined and https://www.healthdata.org/gbd/.
RESULTS
Morbidity of TBL cancer in Asia
Compared with global data and continents
In Asia, the number of TBL cancer incidences increased from 975 361 (95% CI: 909 679–1 037 802) in 2010 to 1 305 525 (95% CI: 1 150 171–1 455 350) in 2019, which is over a 1.34‐fold increase. In 2019 approximately 58% (1 305 525/2 259 998) of TBL cancer cases happened in Asian countries. During this period, the ASIR of TBL cancer with a 1% change, decreased from 28.08 (95% CI: 26.16–29.89) per 100 000 in 2010 to 27.82 (95% CI: 24.56–30.95) per 100 000 in 2019, while in the same time, this rate globally decreased by 5%, in America by 10%, and in Europe by 7% (Figure 1 and Table 1).
FIGURE 1.
Temporal trend of incidence, prevalence, death and DALYs age standard rates (per 100 000 population) of TBL cancer in ASIA comparison with global data and other continents from 1990 to 2019.
TABLE 1.
Comparison of the incidence, death, prevalence, and burden rates of TBL cancer in Asian countries in 2010 and 2019 and the temporal trends between 2010 and 2019 (both sexes).
| Location | Incidence | Death | ||||||||
|---|---|---|---|---|---|---|---|---|---|---|
| 2010 | 2019 | % change 2010–2019 | 2010 | 2019 | % change 2010–2019 | |||||
| Number | ASR per 100 000 | Number | ASR per 100 000 | Number | ASR per 100 000 | Number | ASR per 100 000 | |||
| (95% CI) | (95% CI) | (95% CI) | (95% CI) | (95% CI) | (95% CI) | (95% CI) | (95% CI) | (95% CI) | (95% CI) | |
|
Global |
1 832 625 | 28.99 | 2 259 998 | 27.66 | ‐0.05 | 1 670 745 | 26.70 | 2 042 640 | 25.18 | ‐0.06 |
| (1 747 456–1 909 105) | (27.58–30.18) | (2 067 316–2 451 832) | (25.28–29.99) | (‐0.13–0.03) | (1 592 451–1 737 302) | (25.29–27.77) | (1 879 241–2 193 269) | (23.16–27.01) | (‐0.13–0.02) | |
| Continents | ||||||||||
|
Africa |
47 663 | 10.39 | 63 899 | 10.46 | 0.01 | 49 125 | 11.07 | 65 621 | 11.15 | 0.01 |
| (42 695–54 096) | (9.34–11.73) | (57 033–71 562) | (9.4–11.63) | (‐0.08–0.11) | (44 347–55 559) | (10–12.43) | (58 557–74 115) | (9.99–12.4) | (‐0.08–0.1) | |
|
America |
331 037 | 33.45 | 385 406 | 29.96 | ‐0.10 | 282 630 | 28.49 | 331 172 | 25.67 | ‐0.10 |
| (316 473–339 397) | (32.01–34.28) | (345 604–429 508) | (26.86–33.37) | (‐0.19–‐0.01) | (268 084–290 210) | (27.07–29.23) | (309 812–345 847) | (24.05–26.8) | (‐0.13–‐0.07) | |
|
Asia |
975 361 | 28.08 | 1 305 525 | 27.82 | ‐0.01 | 906 650 | 26.66 | 1 190 516 | 25.76 | ‐0.03 |
| (909 679–1 037 802) | (26.16–29.89) | (1 150 171–1 455 350) | (24.56–30.95) | (‐0.13–0.12) | (846 561–964 850) | (24.77–28.33) | (1 052 836–1 330 529) | (22.79–28.72) | (‐0.15–0.09) | |
| Europe | 476 813 | 36.07 | 503 130 | 33.37 | ‐0.07 | 430 658 | 32.16 | 453 373 | 29.55 | ‐0.08 |
| (459 978–486 467) | (34.9–36.76) | (455 166–552 462) | (30.25–36.73) | (‐0.16–0.02) | (413 701–440 000) | (31.01–32.82) | (426 326–476 093) | (27.88–31.01) | (‐0.12–‐0.04) | |
| Countries by geographical location | ||||||||||
|
Central Asia |
11 934 | 20.23 | 14 342 | 18.91 | ‐0.07 | 11 820 | 20.47 | 13 990 | 19.04 | ‐0.07 |
| (11 487–12 356) | (19.45–20.94) | (12 983–15 870) | (17.14–20.76) | (‐0.15–0.03) | (11 373–12 240) | (19.68–21.2) | (12 661–15 452) | (17.29–20.86) | (‐0.15–0.02) | |
|
East Asia |
628 151 | 41.17 | 854 582 | 41.31 | 0.00 | 594 187 | 39.99 | 778 387 | 38.38 | ‐0.04 |
| (575 530–685 242) | (37.73–44.79) | (721 022–1 002 044) | (35.03–48.11) | (‐0.17–0.19) | (541 920–645 351) | (36.53–43.35) | (658 108–907 254) | (32.72–44.57) | (‐0.19–0.14) | |
|
High‐income Asia Pacific |
131 569 | 34.89 | 150 900 | 31.57 | ‐0.10 | 95 867 | 24.78 | 110 970 | 22.17 | ‐0.11 |
| (119 593–138 366) | (32.07–36.51) | (126 657–173 088) | (26.96–36.26) | (‐0.2–0.02) | (85 867–101 050) | (22.5–25.98) | (96 055–119 283) | (19.73–23.56) | (‐0.13–‐0.08) | |
|
North Africa and Middle East |
52 191 | 16.66 | 71 681 | 16.83 | 0.01 | 53 176 | 17.44 | 72 510 | 17.55 | 0.01 |
| (48 178–56 416) | (15.33–17.98) | (63 424–81 049) | (14.91–19.02) | (‐0.1–0.14) | (48 971–57 366) | (16.03–18.79) | (64 112–81 925) | (15.56–19.82) | (‐0.1–0.13) | |
|
South Asia |
80 950 | 7.84 | 117 195 | 8.36 | 0.07 | 82 457 | 8.25 | 119 644 | 8.75 | 0.06 |
| (74 897–86 782) | (7.24–8.41) | (100 085–133 943) | (7.14–9.52) | (‐0.09–0.22) | (76 287–88 125) | (7.61–8.85) | (101 195–137 368) | (7.44–10.05) | (‐0.09–0.21) | |
|
Southeast Asia |
96 767 | 21.48 | 132 529 | 21.99 | 0.02 | 98 814 | 22.62 | 134 566 | 23.00 | 0.02 |
| (87 575–106 118) | (19.42–23.5) | (110 981–153 557) | (18.43–25.41) | (‐0.1–0.16) | (90 026–107 961) | (20.57–24.72) | (112 781–155 885) | (19.25–26.63) | (‐0.1–0.14) | |
| Location | Prevalence | DALY | ||||||||
|---|---|---|---|---|---|---|---|---|---|---|
| 2010 | 2019 | % change 2010–2019 | 2010 | 2019 | % change 2010–2019 | |||||
| Number | ASR per 100 000 | Number | ASR per 100 000 | Number | ASR per 100 000 | Number | ASR per 100 000 | |||
| (95% CI) | (95% CI) | (95% CI) | (95% CI) | (95% CI) | (95% CI) | (95% CI) | (95% CI) | (95% CI) | (95% CI) | |
|
Global |
2 557 647 | 39.76 | 3 212 307 | 38.84 | ‐0.02 | 38 816 797 | 595.08 | 45 857 963 | 551.58 | ‐0.07 |
| (2 451 258–2 653 706) | (38.02–41.26) | (2 937 037–3 488 346) | (35.49–42.16) | (‐0.1–0.05) | (37 161 595–40 409 438) | (569.46–619.44) | (42 297 425–49 339 876) | (508.97–593.12) | (‐0.15–0) | |
| Continents | ||||||||||
|
Africa |
48 619 | 9.97 | 66 194 | 10.14 | 0.02 | 1 297 006 | 258.89 | 1 724 110 | 257.28 | ‐0.01 |
| (43 488–55 370) | (8.93–11.32) | (58 602–74 477) | (9.06–11.34) | (‐0.07–0.12) | (1 157 918–1 478 946) | (232.57–293.8) | (1 518 047–1 970 898) | (228.41–292.12) | (‐0.1–0.1) | |
|
America |
532 344 | 53.91 | 609 633 | 47.55 | ‐0.12 | 6 111 998 | 616.56 | 6 982 073 | 548.34 | ‐0.11 |
| (512 813–546 055) | (51.96–55.3) | (542 652–684 277) | (42.33–53.36) | (‐0.22–‐0.01) | (5 919 808–6 223 069) | (597.39–627.78) | (6 655 043–7 266 920) | (522.67–570.79) | (‐0.14–‐0.08) | |
|
Asia |
1 308 776 | 36.35 | 1 820 539 | 37.81 | 0.04 | 21 516 974 | 579.16 | 27 120 537 | 553.68 | ‐0.04 |
| (1 225 459–1 392 332) | (34.01–38.67) | (1 605 530–2 034 496) | (33.46–42.14) | (‐0.09–0.17) | (20 162 682–22 913 727) | (543.52–616.66) | (23 951 875–30 414 194) | (488.57–619.78) | (‐0.16–0.09) | |
| Europe | 665 767 | 51.86 | 713 441 | 49.08 | ‐0.05 | 9 853 259 | 776.31 | 9 988 808 | 698.29 | ‐0.10 |
| (644 824–680 187) | (50.39–52.93) | (642 607–790 401) | (44.21–54.34) | (‐0.15–0.05) | (9 590 547–10 021 168) | (758.05–789.01) | (9 442 180–10 489 803) | (660.78–732.91) | (‐0.14–‐0.06) | |
| Countries by geographical location | ||||||||||
|
Central Asia |
13 055 | 21.17 | 16 240 | 20.13 | ‐0.05 | 327 135 | 520.66 | 387 448 | 473.70 | ‐0.09 |
| (12 554–13 538) | (20.33–21.93) | (14 651–18 053) | (18.23–22.19) | (‐0.14–0.05) | (315 044–338 748) | (500.81–539.35) | (349 153–429 746) | (428.64–523.63) | (‐0.18–0.01) | |
|
East Asia |
783 584 | 49.06 | 1 163 481 | 54.46 | 0.11 | 14 113 044 | 872.01 | 17 614 063 | 825.81 | ‐0.05 |
| (715 846–857 024) | (44.9–53.51) | (976 059–1 369 145) | (45.82–63.97) | (‐0.09–0.33) | (12 887 293–15 406 968) | (797.95–948.78) | (14 810 292–20 721 521) | (696.85–969.46) | (‐0.21–0.14) | |
|
High‐income Asia Pacific |
288 182 | 80.42 | 326 643 | 74.32 | ‐0.08 | 1 745 570 | 494.73 | 1 830 128 | 427.39 | ‐0.14 |
| (267 010–304 566) | (75.25–84.6) | (276 230–376 769) | (63.96–85.75) | (‐0.19–0.06) | (1 622 311–1 810 575) | (464.58–510.51) | (1 654 973–1 933 641) | (395.68–448.33) | (‐0.16–‐0.11) | |
|
North Africa and Middle East |
55 161 | 16.74 | 77 317 | 17.17 | 0.03 | 1 389 718 | 412.53 | 1 870 025 | 406.65 | ‐0.01 |
| (50 926–59 688) | (15.46–18.13) | (68 022–87 610) | (15.15–19.45) | (‐0.09–0.16) | (1 283 476–1 507 225) | (380.92–447.32) | (1 648 815–2 118 436) | (359.1–459.46) | (‐0.13–0.11) | |
|
South Asia |
84 029 | 7.72 | 121 387 | 8.31 | 0.08 | 2 207 925 | 198.52 | 3 089 930 | 208.53 | 0.05 |
| (77 729–90 153) | (7.13–8.27) | (103 595–139 072) | (7.1–9.5) | (‐0.08–0.24) | (2 042 685–2 363 198) | (183.68–212.2) | (2 617 375–3 550 873) | (176.65–239.62) | (‐0.11–0.21) | |
|
Southeast Asia |
102 121 | 21.45 | 141 713 | 22.31 | 0.04 | 2 580 293 | 530.60 | 3 429 720 | 532.93 | 0.00 |
| (92 437–112 157) | (19.46–23.5) | (118 238–165 160) | (18.65–25.86) | (‐0.09–0.18) | (2 343 315–2 826 856) | (483.12–580.93) | (2 859 905–3 965 337) | (445.89–615.84) | (‐0.12–0.13) | |
Abbreviations: CI, confidence interval; TBL, tracheal, bronchial and lung.
In Asian men, the number of TBL cancer incidences increased from 695 259 (95% CI: 643 022–750 702) in 2010 to 906 593 (95% CI: 771 042–1 049 246) in 2019, which is over a 1.3‐fold increase. In 2019 approximately 69.4% of Asia TBL cancer new cases, occurred in Asian men which included 59.5% (906 593/1 522 773) of global male TBL cancer incidence cases. During this period, the ASIR of TBL cancer with a 3% change, decreased from 42.54 (95% CI: 39.28–45.84) per 100 000 in 2010 to 41.16 (95% CI: 35.32–47.32) per 100 000 in 2019, while in the same time, this rate globally decreased by 7%, in America and Europe by 12% (Table 2).
TABLE 2.
Comparison of the incidence, death, prevalence and burden rates of TBL cancer in Asian countries in 2010 and 2019 and the temporal trends between 2010 and 2019 (males).
| Location | Incidence | Death | ||||||||
|---|---|---|---|---|---|---|---|---|---|---|
| 2010 | 2019 | % change 2010–2019 | 2010 | 2019 | % change 2010–2019 | |||||
| Number | ASR per 100 000 | Number | ASR per 100 000 | Number | ASR per 100 000 | Number | ASR per 100 000 | |||
| (95% CI) | (95% CI) | (95% CI) | (95% CI) | (95% CI) | (95% CI) | (95% CI) | (95% CI) | (95% CI) | (95% CI) | |
| Global | 1 266 190 | 43.69 | 1 522 773 | 40.44 | ‐0.07 | 1 164 258 | 40.94 | 1 386 094 | 37.38 | ‐0.09 |
| (1 202 565–1 326 841) | (41.45–45.77) | (1 373 842–1 676 681) | (36.55–44.42) | (‐0.17–0.02) | (1 108 350–1 215 596) | (38.85–42.68) | (1 260 237–1 513 800) | (34.09–40.74) | (‐0.17–0) | |
| Continents | ||||||||||
|
Africa |
36 549 | 16.38 | 47 159 | 16.09 | ‐0.02 | 37 728 | 17.53 | 48 544 | 17.21 | ‐0.02 |
| (32 136–42 571) | (14.45–18.97) | (41 687–53 671) | (14.27–18.13) | (‐0.12–0.1) | (33 410–43 751) | (15.57–20.2) | (42 915–55 500) | (15.31–19.47) | (‐0.11–0.09) | |
|
America |
186 025 | 41.78 | 214 269 | 36.70 | ‐0.12 | 162 602 | 36.77 | 188 270 | 32.43 | ‐0.12 |
| (179 186–189 993) | (40.16–42.72) | (186 646–245 610) | (31.99–42.07) | (‐0.23–0) | (156 145–166 234) | (35.23–37.65) | (178 831–195 807) | (30.74–33.75) | (‐0.14–‐0.09) | |
|
Asia |
695 259 | 42.54 | 906 593 | 41.16 | ‐0.03 | 646 099 | 40.66 | 825 738 | 38.30 | ‐0.06 |
| (643 022–750 702) | (39.28–45.84) | (771 042–1 049 246) | (35.32–47.32) | (‐0.18–0.12) | (599 147–694 710) | (37.75–43.57) | (706 207–949 796) | (33–43.79) | (‐0.19–0.09) | |
| Europe | 347 179 | 60.89 | 353 424 | 53.32 | ‐0.12 | 316 705 | 55.64 | 322 275 | 48.46 | ‐0.13 |
| (337 249–353 973) | (59.11–62.1) | (320 472–389 686) | (48.36–58.75) | (‐0.21–‐0.03) | (306 915–322 902) | (53.81–56.78) | (303 139–339 418) | (45.56–51.06) | (‐0.17–‐0.09) | |
| Countries by geographical location | ||||||||||
|
Central Asia |
9537 | 37.59 | 11 253 | 34.44 | ‐0.08 | 9420 | 38.30 | 10 955 | 34.98 | ‐0.09 |
| (9122–9950) | (35.97–39.22) | (9979–12 553) | (30.72–38.1) | (‐0.17–0.02) | (9018–9823) | (36.71–39.94) | (9718–12 201) | (31.18–38.66) | (‐0.18–0.01) | |
|
East Asia |
442 614 | 61.68 | 590 047 | 61.06 | ‐0.01 | 418 526 | 60.80 | 536 789 | 57.50 | ‐0.05 |
| (394 667–493 908) | (55.3–68.47) | (467 100–722 744) | (48.89–73.86) | (‐0.22–0.24) | (376 929–464 328) | (55.06–66.96) | (427 357–661 038) | (46.25–69.74) | (‐0.25–0.17) | |
|
High‐income Asia Pacific |
95 187 | 58.88 | 105 806 | 50.61 | ‐0.14 | 68 875 | 42.74 | 76 809 | 36.15 | ‐0.15 |
| (88 757–99 228) | (54.81–61.39) | (89 324–125 121) | (42.87–59.61) | (‐0.26–0.01) | (63 689–71 709) | (39.41–44.55) | (69 027–81 528) | (32.76–38.31) | (‐0.18–‐0.13) | |
|
North Africa and Middle East |
42 203 | 26.63 | 55 843 | 25.77 | ‐0.03 | 43 261 | 28.02 | 57 114 | 27.16 | ‐0.03 |
| (38 782–45 960) | (24.42–28.91) | (49 149–63 493) | (22.74–29.16) | (‐0.15–0.1) | (39 698–46 972) | (25.64–30.39) | (50 323–64 674) | (24.02–30.62) | (‐0.14–0.1) | |
| South Asia | 63 332 | 12.38 | 85 412 | 12.42 | 0.00 | 64 539 | 13.05 | 87 160 | 13.03 | 0.00 |
| (57 745–69 047) | (11.25–13.47) | (69 746–101 658) | (10.19–14.74) | (‐0.18–0.2) | (58 846–70 169) | (11.88–14.19) | (71 240–102 821) | (10.68–15.32) | (‐0.18–0.18) | |
|
Southeast Asia |
67 604 | 32.97 | 91 221 | 33.20 | 0.01 | 68 978 | 34.96 | 92 416 | 34.97 | 0.00 |
| (62 062–73 776) | (30.32–35.86) | (76 900–106 089) | (28.16–38.38) | (‐0.13–0.16) | (63 777–74 766) | (32.35–37.91) | (78 453–106 933) | (29.78–40.37) | (‐0.13–0.14) | |
| Location | Prevalence | DALY | ||||||||
|---|---|---|---|---|---|---|---|---|---|---|
| 2010 | 2019 | % change 2010–2019 | 2010 | 2019 | % change 2010–2019 | |||||
| Number | ASR per 100 000 | Number | ASR per 100 000 | Number | ASR per 100 000 | Number | ASR per 100 000 | |||
| (95% CI) | (95% CI) | (95% CI) | (95% CI) | (95% CI) | (95% CI) | (95% CI) | (95% CI) | (95% CI) | (95% CI) | |
| Global | 1 716 379 | 57.22 | 2 109 409 | 54.52 | ‐0.05 | 27 443 591 | 891.68 | 31 582 258 | 802.86 | ‐0.10 |
| (1 639 042–1 795 082) | (54.61–59.84) | (1 895 836–2 337 805) | (49.05–60.18) | (‐0.14–0.05) | (26 238 635–28 695 342) | (851.85–931.53) | (28 622 120–34 681 701) | (727.6–879.76) | (‐0.19–0) | |
| Continents | ||||||||||
|
Africa |
37 211 | 15.64 | 48 599 | 15.49 | ‐0.01 | 996 182 | 407.65 | 1 273 661 | 395.57 | ‐0.03 |
| (32 606–43 427) | (13.77–18.18) | (42 835–55 456) | (13.7–17.58) | (‐0.11–0.11) | (874 751–1 168 008) | (360.63–474.74) | (1 115 235–1 475 387) | (348.98–453.39) | (‐0.13–0.09) | |
|
America |
280 546 | 62.13 | 318 385 | 53.95 | ‐0.13 | 3 578 682 | 782.87 | 4 019 140 | 681.21 | ‐0.13 |
| (271 942–287 853) | (60.11–63.8) | (274 446–370 922) | (46.52–62.82) | (‐0.25–0.01) | (3 486 125–3 640 976) | (761.01–796.82) | (3 866 967–4 175 479) | (654.95–707.55) | (‐0.16–‐0.1) | |
|
Asia |
928 147 | 54.01 | 1 257 715 | 54.94 | 0.02 | 15 471 795 | 862.61 | 19 032 930 | 806.43 | ‐0.07 |
| (861 104–1 000 537) | (50.08–58.12) | (1 069 513–1 462 350) | (46.96–63.32) | (‐0.13–0.18) | (14 340 748–16 696 371) | (800.85–929.03) | (16 188 395–21 991 610) | (688.15–928.33) | (‐0.21–0.1) | |
| Europe | 469 031 | 82.35 | 483 071 | 73.66 | ‐0.11 | 7 371 434 | 1296.88 | 7 228 445 | 1112.90 | ‐0.14 |
| (456 266–479 691) | (80.06–84.24) | (434 425–538 524) | (66.24–82.02) | (‐0.2–‐0.01) | (7 210 498–7 495 109) | (1268.24–1318.81) | (6 786 085–7 659 648) | (1044.81–1178.58) | (‐0.19–‐0.09) | |
| Countries by geographical location | ||||||||||
|
Central Asia |
10 445 | 38.69 | 12 747 | 35.93 | ‐0.07 | 262 480 | 950.54 | 305 280 | 845.18 | ‐0.11 |
| (9966–10 916) | (36.98–40.34) | (11 269–14 251) | (31.94–39.9) | (‐0.17–0.03) | (250 744–274 008) | (909.87–992.11) | (269 545–342 706) | (750.29–941.04) | (‐0.2–‐0.01) | |
|
East Asia |
549 320 | 71.26 | 798 517 | 78.03 | 0.09 | 10 022 616 | 1276.56 | 12 285 616 | 1195.54 | ‐0.06 |
| (489 021–614 703) | (63.72–79.36) | (623 900–988 417) | (61.43–95.66) | (‐0.14–0.39) | (8 962 494–11 190 274) | (1148.68–1419.36) | (970 2712–15 269 024) | (949.99–1478.03) | (‐0.27–0.18) | |
|
High‐income Asia Pacific |
207 771 | 129.02 | 229 777 | 114.22 | ‐0.11 | 1 293 998 | 813.32 | 1 318 234 | 670.81 | ‐0.18 |
| (194 401–219 959) | (121.06–136.58) | (191 569–273 165) | (95.69–135.71) | (‐0.26–0.06) | (1 225 352–1 335 843) | (770.31–839.29) | (1 219 937–1 388 347) | (624.48–704.7) | (‐0.21–‐0.15) | |
|
North Africa and Middle East |
43 906 | 26.37 | 58 612 | 25.59 | ‐0.03 | 1 129 551 | 663.37 | 1 471 977 | 629.27 | ‐0.05 |
| (40 334–47 853) | (24.21–28.71) | (51 424–66 749) | (22.48–29.12) | (‐0.15–0.11) | (1 037 014–1 231 394) | (609.93–724.26) | (1 292 740–1 675 771) | (554.11–713.7) | (‐0.17–0.09) | |
| South Asia | 65 683 | 12.12 | 88 383 | 12.28 | 0.01 | 1 720 712 | 310.76 | 2 242 983 | 306.69 | ‐0.01 |
| (59 942–71 764) | (11.06–13.21) | (72 063–105 442) | (10.04–14.62) | (‐0.17–0.22) | (1 574 121–1 878 619) | (283.66–338.27) | (1 835 005–2 652 810) | (251.04–361.99) | (‐0.2–0.18) | |
|
Southeast Asia |
71 517 | 32.53 | 97 906 | 33.25 | 0.02 | 1 810 079 | 804.60 | 2 378 099 | 795.16 | ‐0.01 |
| (65 595–78 128) | (29.89–35.41) | (81 821–114 685) | (27.99–38.75) | (‐0.13–0.19) | (1 666 282–1 968 106) | (742.9–872.82) | (1 995 969–2 766 343) | (672.65–921.59) | (‐0.15–0.14) | |
Abbreviations: CI, confidence interval; TBL, tracheal, bronchial and lung.
In Asian women, the number of TBL cancer incidences increased from 280 101 (95% CI: 256 006–302 969) in 2010 to 398 932 (95% CI: 339 662–464 457) in 2019, which is over a 1.42‐fold increase. In 2019 approximately 30.6% of Asia TBL cancer new cases, occurred in Asian women which included 54.1% (398 932/737 225) of global female TBL cancer incidence cases. During this period, the ASIR of TBL cancer with a 5% change, increased from 15.48 (95% CI: 14.07–16.76) per 100 000 in 2010 to 16.21 (95% CI: 13.74–18.85) per 100 000 in 2019, while in the same time, this rate globally increased by 1%, in Africa by 12%, and in Europe by 3%, and in American countries decreased by 8% (Table 3).
TABLE 3.
Comparison of the incidence, death, prevalence and burden rates of TBL cancer in Asian countries in 2010 and 2019 and the temporal trends between 2010 and 2019 (females).
| Location | Incidence | Death | ||||||||
|---|---|---|---|---|---|---|---|---|---|---|
| 2010 | 2019 | % change 2010–2019 | 2010 | 2019 | % change 2010–2019 | |||||
| Number | ASR per 100 000 | Number | ASR per 100 000 | Number | ASR per 100 000 | Number | ASR per 100 000 | |||
| (95% CI) | (95% CI) | (95% CI) | (95% CI) | (95% CI) | (95% CI) | (95% CI) | (95% CI) | (95% CI) | (95% CI) | |
| Global | 566 435 | 16.68 | 737 225 | 16.84 | 0.01 | 506 487 | 14.97 | 656 546 | 14.99 | 0.00 |
| (531 214–594 093) | (15.62–17.5) | (658 040–813 972) | (15.03–18.59) | (‐0.08–0.1) | (472 370–533 707) | (13.92–15.76) | (590 247–718 975) | (13.48–16.41) | (‐0.08–0.09) | |
| Continents | ||||||||||
| Africa | 11 114 | 4.73 | 16 740 | 5.29 | 0.12 | 11 397 | 5.04 | 17 076 | 5.62 | 0.12 |
| (10 146–12 213) | (4.32–5.18) | (14 748–18 781) | (4.68–5.89) | (0–0.22) | (10 387–12 508) | (4.58–5.52) | (14 976–19 279) | (4.97–6.28) | (0–0.23) | |
| America | 145 012 | 26.71 | 171 137 | 24.45 | ‐0.08 | 120 028 | 21.83 | 142 902 | 20.17 | ‐0.08 |
| (136 453–149 964) | (25.31–27.57) | (146 572–197 699) | (20.96–28.29) | (‐0.21–0.05) | (111 881–124 413) | (20.5–22.58) | (130 834–152 666) | (18.57–21.51) | (‐0.12–‐0.03) | |
| Asia | 280 101 | 15.48 | 398 932 | 16.21 | 0.05 | 260 550 | 14.67 | 364 778 | 14.98 | 0.02 |
| (256 006–302 969) | (14.07–16.76) | (339 662–464 457) | (13.74–18.85) | (‐0.1–0.22) | (238 233–282 526) | (13.35–15.92) | (312 089–421 085) | (12.81–17.27) | (‐0.12–0.17) | |
| Europe | 129 633 | 17.28 | 149 706 | 17.72 | 0.03 | 113 953 | 14.74 | 131 099 | 14.98 | 0.02 |
| (122 363–133 692) | (16.47–17.75) | (133 119–167 334) | (15.85–19.87) | (‐0.07–0.14) | (106 426–117 617) | (13.94–15.15) | (120 753–138 421) | (13.94–15.79) | (‐0.02–0.06) | |
| Countries by geographical location | ||||||||||
| Central Asia | 2397 | 7.22 | 3089 | 7.45 | 0.03 | 2400 | 7.38 | 3035 | 7.54 | 0.02 |
| (2310–2491) | (6.94–7.52) | (2767–3451) | (6.7–8.27) | (‐0.07–0.14) | (2307–2496) | (7.08–7.67) | (2724–3375) | (6.81–8.35) | (‐0.08–0.13) | |
| East Asia | 185 537 | 23.56 | 264 535 | 24.55 | 0.04 | 175 661 | 22.78 | 241 598 | 22.70 | 0.00 |
| (165 513–205 184) | (21.05–26.05) | (213 472–322 034) | (19.85–29.85) | (‐0.16–0.3) | (156 904–194 255) | (20.41–25.12) | (196 028–289 422) | (18.46–27.15) | (‐0.2–0.22) | |
| High‐income Asia Pacific | 36 382 | 16.86 | 45 094 | 16.45 | ‐0.02 | 26 992 | 11.76 | 34 161 | 11.37 | ‐0.03 |
| (30 613–39 687) | (14.74–18.09) | (35 652–53 403) | (13.64–19.2) | (‐0.15–0.12) | (22 018–29 634) | (10.03–12.69) | (27 113–38 231) | (9.6–12.41) | (‐0.07–0) | |
| North Africa and Middle East | 9987 | 6.46 | 15 838 | 7.62 | 0.18 | 9915 | 6.65 | 15 396 | 7.68 | 0.15 |
| (9196–10 762) | (5.93–6.97) | (13 642–18 196) | (6.56–8.74) | (0.03–0.32) | (9104–10 671) | (6.08–7.16) | (13 258–17 676) | (6.59–8.77) | (0.01–0.29) | |
| South Asia | 17 618 | 3.40 | 31 783 | 4.47 | 0.32 | 17 918 | 3.58 | 32 485 | 4.69 | 0.31 |
| (15 685–19 518) | (3.01–3.8) | (25 999–38 175) | (3.67–5.37) | (0.06–0.61) | (15 757–19 848) | (3.12–4) | (26 638–39 104) | (3.86–5.64) | (0.05–0.6) | |
| Southeast Asia | 29 163 | 11.99 | 41 308 | 12.78 | 0.07 | 29 836 | 12.61 | 42 151 | 13.36 | 0.06 |
| (24 280–34 189) | (10.03–14) | (316 31–51 823) | (9.8–15.93) | (‐0.08–0.22) | (24 900–34 975) | (10.55–14.7) | (32 050–52 566) | (10.19–16.57) | (‐0.09–0.21) | |
| Location | Prevalence | DALY | ||||||||
|---|---|---|---|---|---|---|---|---|---|---|
| 2010 | 2019 | % change 2010–2019 | 2010 | 2019 | % change 2010–2019 | |||||
| Number | ASR per 100 000 | Number | ASR per 100 000 | Number | ASR per 100 000 | Number | ASR per 100 000 | |||
| (95% CI) | (95% CI) | (95% CI) | (95% CI) | (95% CI) | (95% CI) | (95% CI) | (95% CI) | (95% CI) | (95% CI) | |
| Global | 841 268 | 24.67 | 1 102 899 | 25.22 | 0.02 | 11 373 206 | 331.74 | 14 275 706 | 327.57 | ‐0.01 |
| (796 537–877 004) | (23.35–25.72) | (989 626–1 214 657) | (22.65–27.78) | (‐0.07–0.12) | (10 770 628–11 958 278) | (314.19–348.96) | (13 000 079–15 704 795) | (298.53–360.45) | (‐0.1–0.08) | |
| Continents | ||||||||||
| Africa | 11 408 | 4.54 | 17 596 | 5.17 | 0.14 | 300 825 | 116.06 | 450 450 | 128.37 | 0.11 |
| (10 366–12 602) | (4.15–4.99) | (15 351–19 862) | (4.58–5.79) | (0.01–0.25) | (271 961–331 332) | (105.52–127.2) | (390 478–514 074) | (111.98–145.41) | (‐0.02–0.23) | |
| America | 251 798 | 47.23 | 291 248 | 42.31 | ‐0.10 | 2 533 317 | 474.98 | 2 962 933 | 434.89 | ‐0.08 |
| (240 507–260 562) | (45.24–48.84) | (246 138–341 703) | (35.74–49.7) | (‐0.24–0.05) | (2 428 813–2 599 251) | (456.25–486.94) | (2 776 613–3 144 654) | (408.17–460.97) | (‐0.13–‐0.03) | |
| Europe | 380 630 | 20.43 | 562 824 | 22.49 | 0.10 | 6 045 179 | 316.95 | 8 087 606 | 321.18 | 0.01 |
| (349 763–411 327) | (18.67–22.08) | (480 164–653 889) | (19.21–26.12) | (‐0.06–0.28) | (5 551 988–6 575 776) | (290.95–344.55) | (6 962 536–9 358 865) | (276.65–371.34) | (‐0.14–0.18) | |
| Asia | 196 736 | 27.82 | 230 370 | 29.17 | 0.05 | 2 481 824 | 355.87 | 2 760 363 | 354.87 | 0.00 |
| (187 564–203 168) | (26.7–28.66) | (205 639–257 874) | (25.99–32.68) | (‐0.06–0.18) | (2 377 313–2 540 942) | (343.94–363.58) | (2 583 575–2 917 832) | (334.93–374.7) | (‐0.05–0.05) | |
| Countries by geographical location | ||||||||||
| Central Asia | 2611 | 7.54 | 3492 | 7.98 | 0.06 | 64 655 | 183.44 | 82 168 | 185.27 | 0.01 |
| (2518–2720) | (7.28–7.86) | (3111–3917) | (7.15–8.91) | (‐0.05–0.18) | (62 448–67 272) | (176.8–191.03) | (73 024–92 405) | (165.25–207.53) | (‐0.1–0.13) | |
| East Asia | 234 264 | 28.75 | 364 964 | 33.32 | 0.16 | 4 090 428 | 497.71 | 5 328 447 | 489.73 | ‐0.02 |
| (208 597–260 494) | (25.64–31.99) | (293 511–447 082) | (26.81–40.82) | (‐0.08–0.45) | (3 645 348–4 549 759) | (442.89–552.1) | (4 314 330–6 510 671) | (396.14–597.18) | (‐0.23–0.22) | |
| High‐income Asia Pacific | 80 411 | 41.17 | 96 866 | 40.86 | ‐0.01 | 451 572 | 235.42 | 511 894 | 219.77 | ‐0.07 |
| (70 235–87 650) | (37.37–44.11) | (79 104–114 755) | (34.13–48.03) | (‐0.15–0.16) | (395 398–481 572) | (213.57–247.32) | (437 678–555 713) | (197.35–234.68) | (‐0.1–‐0.03) | |
| North Africa and Middle East | 11 255 | 6.83 | 18 705 | 8.43 | 0.23 | 260 168 | 153.63 | 398 048 | 174.91 | 0.14 |
| (10 374–12 083) | (6.29–7.34) | (16 152–21 456) | (7.27–9.65) | (0.07–0.39) | (240 453–279 924) | (141.58–165.39) | (343 405–459 210) | (151.1–201.59) | (‐0.01–0.28) | |
| South Asia | 18 346 | 3.35 | 33 004 | 4.46 | 0.33 | 487 213 | 86.82 | 846 947 | 112.79 | 0.30 |
| (16 385–20 206) | (2.98–3.71) | (26 751–39 840) | (3.64–5.38) | (0.07–0.64) | (435 355–537 136) | (77.13–95.86) | (692 032–1 029 549) | (92.18–136.92) | (0.04–0.6) | |
| Southeast Asia | 30 604 | 12.01 | 43 807 | 13.01 | 0.08 | 770 214 | 295.65 | 1 051 621 | 308.47 | 0.04 |
| (25 450–35 989) | (10.04–14.06) | (33 416–55 120) | (9.98–16.28) | (‐0.07–0.25) | (633 511–914 063) | (243.82–348.23) | (796 523–1 324 390) | (233.06–387.26) | (‐0.11–0.2) | |
Abbreviations: CI, confidence interval; TBL, tracheal, bronchial and lung.
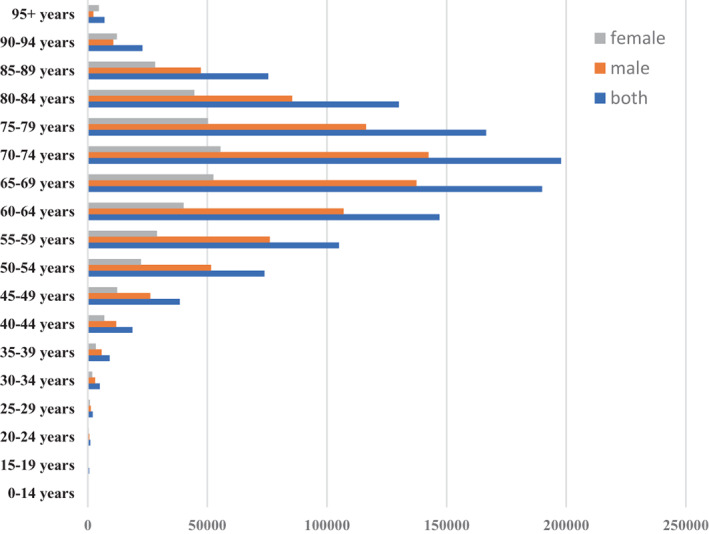
Age distribution
In 2019, age‐specific incidence cases of TBL cancer were generally peaking at 65–74 years, 65–69 years in males, and 70–74 years in females. In all age groups, the incidence cases of TBL cancer in males was higher, except in ages above 90 years which in females was higher (Figure 2).
FIGURE 2.
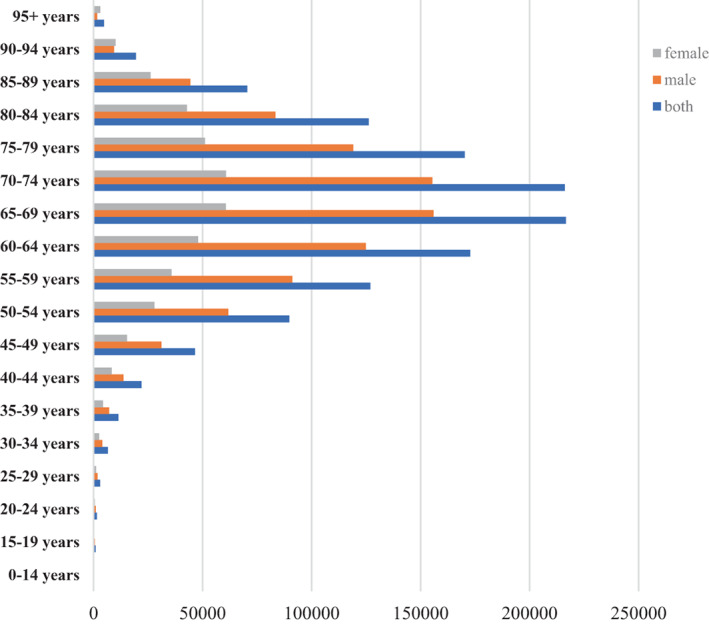
Age specific incidence cases of TBL cancer among sexes in Asia, 2019.
Within Asian regions
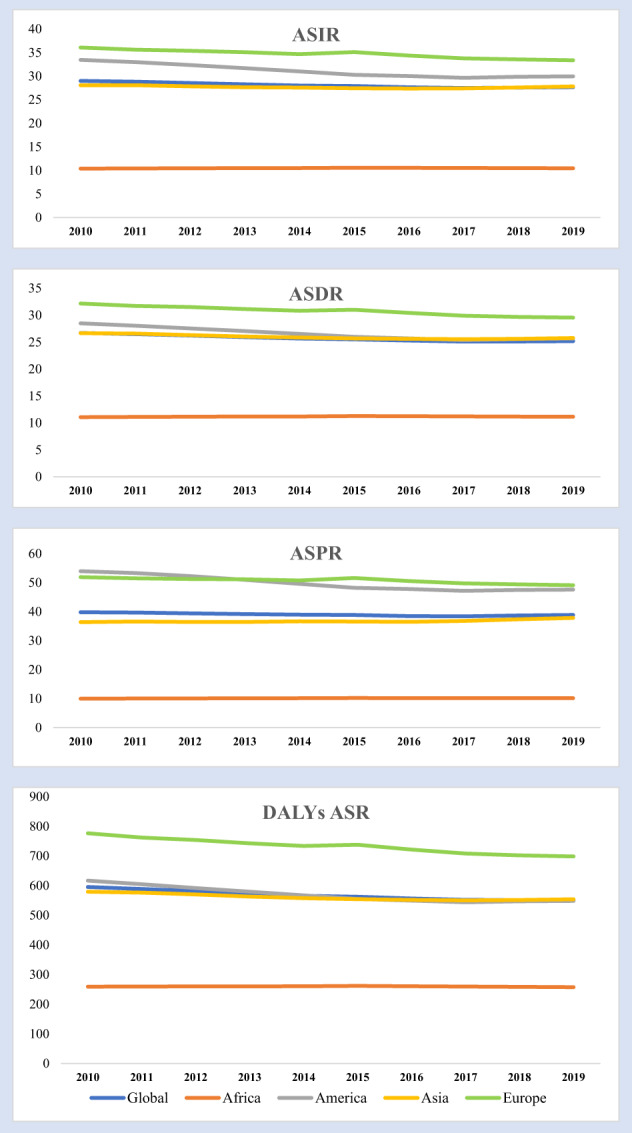
In 2019, the highest ASIR of TBL was observed in East Asian countries (41.31 [95% CI: 35.03–48.11]); without any changes compared with 2010. While the Central Asia and high‐income Asia Pacific countries experienced a decreasing trend of 10% and 7%, respectively; the South Asian countries experienced the highest increasing trend from 2010 to 2019 (by 7%) (Figure 3).
FIGURE 3.
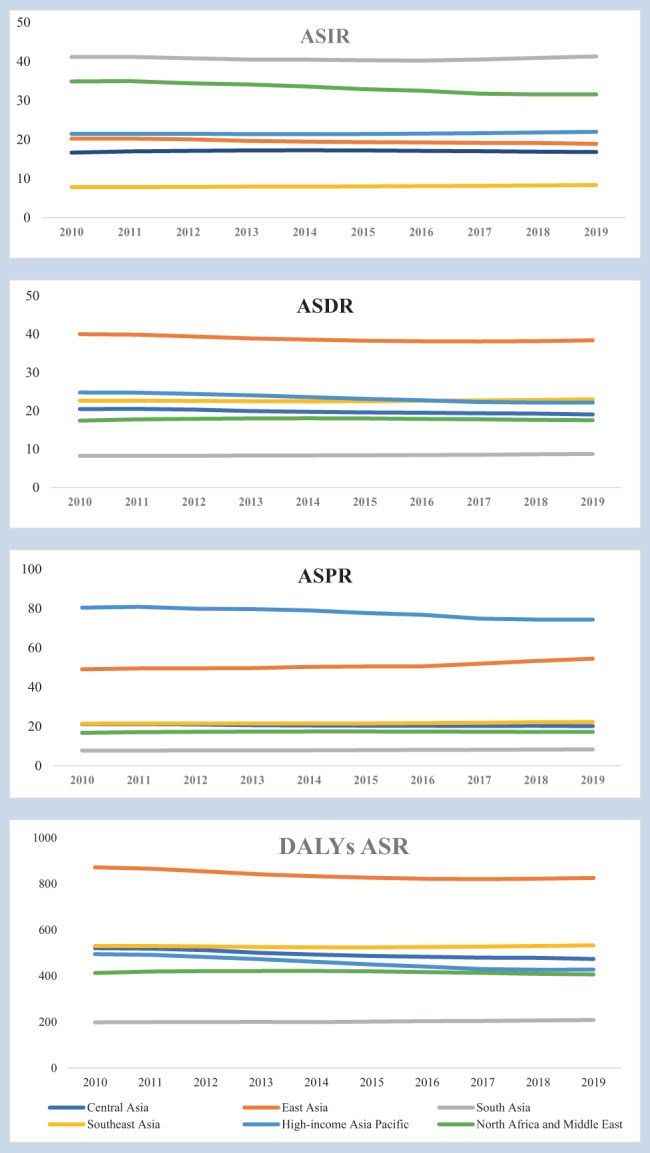
Temporal trend of incidence, prevalence, death and DALYs age standard rates (per 100 000 population) of TBL cancer in Asian regions from 1990 to 2019.
In men, the highest ASIR of TBL was observed in East Asian countries (61.06 [95% CI: 48.89–73.86]); with a 1% decrease compared with 2010. While the Central Asia and high‐income Asia Pacific countries experienced a decreasing trend of 8% and 14%, respectively; the Southeast Asia countries experienced an increasing trend from 2010 to 2019 by 1%.
In women, the highest ASIR of TBL was observed in East Asian countries (24.55 [95% CI: 19.85–29.85]) in 2019, these countries and other countries experienced an increasing trend from 2010 to 2019 except high‐income Asia Pacific countries that experienced a decreasing trend by 2%. South Asia countries experienced the highest increasing trend from 2010 to 2019 (by 32%).
Among high SDI Asian countries, Brunei Darussalam (46.15) and the Republic of Korea (35.61) had the highest ASIR of TBL, and Saudi Arabia (8.77) had the lowest rate.
Based on SDI
Among high SDI Asian countries, Brunei Darussalam (45.16) and the Republic of Korea (35.61) had the highest ASIR of TBL, and Saudi Arabia (8.77) had the lowest rate. Among high‐middle SDI Asian countries, Turkey (33.08) and Georgia (31.14) had the highest ASIR of TBL, and Sri Lanka (9.71) had the lowest rate. Among middle SDI Asian countries, China (41.71) and Armenia (33.81) had the highest ASIR of TBL, and Turkmenistan (9.90) had the lowest rate. Among low‐middle SDI Asian countries, Mongolia (31.19) and the Democratic People's Republic of Korea (27.87) had the highest ASIR of TBL, and Bangladesh (7.43) had the lowest rate. Among low SDI Asian countries, Pakistan (16.43) had the highest ASIR of TBL, and Nepal (8.03) had the lowest rate. Further details are presented in Table 4.
TABLE 4.
Incidence distribution of TBL cancer in Asian countries in 2010 and 2019 and the temporal trends between 2010 and 2019, by geographical region and SDI.
| Both | Male | Female | ||||||||||||||
|---|---|---|---|---|---|---|---|---|---|---|---|---|---|---|---|---|
| 2010 | 2019 | % change 2010‐2010 | 2010 | 2019 | % change 2010‐2019 | 2010 | 2019 | % change 2010‐2019 | ||||||||
| Location | SDI 2019 lower | Number | ASR per 100 000 | Number | ASR per 100 000 | Number | ASR per 100 000 | Number | ASR per 100 000 | Number | ASR per 100 000 | Number | ASR per 100 000 | |||
| (95% CI) | (95% CI) | (95% CI) | (95% CI) | (95% CI) | (95% CI) | (95% CI) | (95% CI) | (95% CI) | (95% CI) | (95% CI) | (95% CI) | (95% CI) | (95% CI) | (95% CI) | ||
| High SDI | ||||||||||||||||
| Brunei Darussalam | 0.823 | 75 | 46.27 | 116 | 46.15 | 0.00 | 42 | 60.33 | 63 | 61.02 | 0.01 | 33 | 36.25 | 53 | 37.94 | 0.05 |
| (69–82) | (42.48–50.29) | (102–130) | (40.91–51.83) | (‐0.13–0.13) | (38–47) | (53.39–67.93) | (52–75) | (51.36–71.21) | (‐0.16–0.21) | (29–37) | (32.03–40.41) | (44–63) | (32.3–44.03) | (‐0.13–0.25) | ||
| Cyprus | 0.841 | 402 | 28.10 | 514 | 26.03 | ‐0.07 | 314 | 48.19 | 398 | 42.31 | ‐0.12 | 88 | 11.61 | 116 | 11.39 | ‐0.02 |
| (374–430) | (26.17–30) | (444–592) | (22.56–30.01) | (‐0.21–0.08) | (289–339) | (44.52–51.86) | (330–469) | (35.14–49.85) | (‐0.28–0.05) | (79–98) | (10.48–12.77) | (95–138) | (9.37–13.59) | (‐0.2–0.17) | ||
| Israel | 0.803 | 2177 | 25.06 | 2670 | 23.37 | ‐0.07 | 1454 | 37.13 | 1752 | 33.44 | ‐0.10 | 722 | 14.94 | 918 | 14.64 | ‐0.02 |
| (2059–2270) | (23.75–26.11) | (2088–3391) | (18.1–29.71) | (‐0.27–0.18) | (1379–1533) | (35.22–39.1) | (1347–2241) | (25.75–42.7) | (‐0.31–0.15) | (664–771) | (13.82–15.89) | (724–1168) | (11.54–18.64) | (‐0.22–0.24) | ||
| Japan | 0.87 | 107 228 | 34.48 | 116 798 | 30.66 | ‐0.11 | 77 692 | 57.88 | 81 717 | 49.05 | ‐0.15 | 29 535 | 16.57 | 35 081 | 15.94 | ‐0.04 |
| (96 325–113 274) | (31.52–36.12) | (95 776–136 541) | (25.55–36) | (‐0.24–0.04) | (71 790–81 155) | (53.74–60.37) | (66 731–99 572) | (40–59.9) | (‐0.3–0.03) | (24 210–32 466) | (14.34–17.85) | (26 628–42 644) | (12.55–19.49) | (‐0.2–0.16) | ||
| Kuwait | 0.851 | 129 | 10.02 | 225 | 10.10 | ‐0.18 | 98 | 12.48 | 173 | 13.28 | 0.06 | 31 | 5.92 | 53 | 5.18 | ‐0.12 |
| (119–137) | (9.15–10.72) | (185–272) | (8.19–12.19) | (‐0.3–‐0.04) | (90–105) | (11.35–13.45) | (133–216) | (10.29–16.6) | (‐0.17–0.34) | (28–34) | (5.24–6.53) | (41–66) | (4.08–6.47) | (‐0.3–0.09) | ||
| Qatar | 0.83 | 69 | 21.90 | 125 | 18.78 | 0.02 | 58 | 26.31 | 103 | 21.19 | ‐0.19 | 11 | 12.28 | 21 | 11.80 | ‐0.04 |
| (55–85) | (18.02–26.44) | (89–174) | (14.38–23.88) | (‐0.19–0.27) | (45–73) | (20.85–32.57) | (71–149) | (15.97–27.58) | (‐0.41–0.09) | (9–13) | (9.85–14.95) | (16–27) | (9.21–14.72) | (‐0.23–0.17) | ||
| Republic of Korea | 0.878 | 22 698 | 36.90 | 31 825 | 35.61 | ‐0.14 | 16 431 | 65.28 | 22 655 | 59.14 | ‐0.09 | 6266 | 17.78 | 9170 | 18.25 | 0.03 |
| (21 256–24 229) | (34.36–39.47) | (26 456–37 538) | (29.58–41.94) | (‐0.35–0.11) | (15 413–17 712) | (60.97–70.45) | (18 637–27 109) | (48.64–70.35) | (‐0.25–0.08) | (5647–6772) | (15.98–19.21) | (7492–10 916) | (14.97–21.76) | (‐0.14–0.21) | ||
| Saudi Arabia | 0.805 | 1032 | 9.13 | 1545 | 8.77 | ‐0.04 | 771 | 12.14 | 1115 | 10.94 | ‐0.10 | 261 | 5.08 | 429 | 5.46 | 0.07 |
| (909–1197) | (8.21–10.31) | (1187–1900) | (6.98–10.62) | (‐0.19–0.14) | (680–897) | (10.9–14.02) | (841–1392) | (8.54–13.69) | (‐0.29–0.11) | (225–299) | (4.44–5.78) | (321–551) | (4.16–6.88) | (‐0.17–0.35) | ||
| Singapore | 0.861 | 1568 | 33.19 | 2162 | 28.39 | ‐0.04 | 1021 | 48.41 | 1371 | 38.69 | ‐0.20 | 547 | 21.28 | 790 | 19.73 | ‐0.07 |
| (1463–1657) | (30.81–35.1) | (1724–2713) | (22.71–35.43) | (‐0.22–0.16) | (951–1085) | (44.94–51.53) | (1081–1724) | (30.75–48.3) | (‐0.37–0) | (498–592) | (19.27–23.06) | (627–991) | (15.65–24.76) | (‐0.25–0.15) | ||
| Taiwan (Province of China) | 0.868 | 10 295 | 34.33 | 12 618 | 31.88 | ‐0.07 | 6690 | 46.05 | 7802 | 42.62 | ‐0.07 | 3605 | 23.35 | 4815 | 22.78 | ‐0.02 |
| (9689–10 735) | (32.27–35.75) | (9963–16 206) | (25.21–40.93) | (‐0.27–0.18) | (6311–6979) | (43.42–48.07) | (6140–9885) | (33.46–54.21) | (‐0.27–0.19) | (3337–3813) | (21.55–24.72) | (3751–6185) | (17.78–29.35) | (‐0.23–0.25) | ||
| United Arab Emirates | 0.88 | 227 | 22.85 | 542 | 18.62 | ‐0.18 | 176 | 25.31 | 434 | 21.52 | ‐0.15 | 51 | 18.43 | 108 | 12.79 | ‐0.31 |
| (181–274) | (18.93–26.98) | (393–721) | (13.54–25.75) | (‐0.37–0.06) | (138–216) | (20.35–30.9) | (310–593) | (15.82–29.85) | (‐0.33–0.09) | (40–63) | (14.8–22.63) | (72–145) | (7.5–19.26) | (‐0.58–0.1) | ||
| High‐middle SDI | ||||||||||||||||
| Bahrain | 0.751 | 85 | 24.23 | 141 | 19.84 | ‐0.18 | 62 | 34.52 | 104 | 26.50 | ‐0.23 | 23 | 13.99 | 37 | 12.46 | ‐0.11 |
| (75–95) | (21.4–27.15) | (107–186) | (15.2–25.09) | (‐0.36–0.02) | (53–71) | (29.94–39.4) | (75–142) | (19.94–34.33) | (‐0.42–0) | (20–26) | (12.09–16.15) | (29–45) | (9.96–15.05) | (‐0.28–0.07) | ||
| Georgia | 0.702 | 1662 | 29.30 | 1784 | 31.14 | 0.06 | 1400 | 58.14 | 1515 | 62.13 | 0.07 | 261 | 7.81 | 269 | 8.03 | 0.03 |
| (1515–1810) | (26.6–31.96) | (1487–2108) | (25.89–36.87) | (‐0.13–0.29) | (1252–1545) | (52.05–64.25) | (1251–1796) | (51.46–73.5) | (‐0.13–0.3) | (235–290) | (7.01–8.66) | (224–322) | (6.65–9.7) | (‐0.18–0.26) | ||
| Jordan | 0.731 | 485 | 15.10 | 914 | 14.34 | ‐0.05 | 383 | 23.14 | 697 | 20.90 | ‐0.10 | 102 | 6.42 | 218 | 7.19 | 0.12 |
| (431–543) | (13.47–16.94) | (748–1110) | (11.86–17.36) | (‐0.23–0.14) | (336–437) | (20.32–26.46) | (537–882) | (16.3–26.2) | (‐0.3–0.14) | (87–117) | (5.51–7.41) | (171–277) | (5.69–9.03) | (‐0.11–0.4) | ||
| Kazakhstan | 0.723 | 3740 | 25.91 | 3829 | 21.36 | ‐0.14 | 3062 | 52.86 | 3047 | 41.77 | ‐0.21 | 678 | 8.02 | 782 | 7.67 | ‐0.04 |
| (3558–3945) | (24.65–27.24) | (3259–4406) | (18.36–24.44) | (‐0.31–0.06) | (2885–3267) | (49.82–56.14) | (2577–3559) | (35.53–48.48) | (‐0.33–‐0.08) | (641–718) | (7.58–8.48) | (656–915) | (6.46–8.97) | (‐0.21–0.13) | ||
| Lebanon | 0.708 | 1183 | 27.80 | 1421 | 27.29 | ‐0.07 | 841 | 41.03 | 914 | 38.92 | ‐0.05 | 342 | 15.58 | 507 | 17.75 | 0.14 |
| (1016–1518) | (23.82–35.74) | (1168–1868) | (22.42–35.83) | (‐0.18–0.06) | (699–1095) | (34.1–53.77) | (729–1203) | (30.94–51.44) | (‐0.2–0.13) | (284–441) | (12.95–20.1) | (375–703) | (13.08–24.52) | (‐0.14–0.39) | ||
| Malaysia | 0.737 | 3915 | 21.33 | 5165 | 19.78 | 0.03 | 2743 | 30.05 | 3642 | 28.00 | ‐0.07 | 1173 | 12.86 | 1523 | 11.70 | ‐0.09 |
| (3573–4318) | (19.34–23.57) | (3997–6561) | (15.37–25.12) | (‐0.16–0.25) | (2494–3026) | (27.12–33.41) | (2793–4631) | (21.62–35.55) | (‐0.28–0.18) | (1058–1301) | (11.53–14.41) | (1163–1934) | (8.98–14.81) | (‐0.29–0.14) | ||
| Oman | 0.783 | 119 | 11.97 | 147 | 9.86 | 0.14 | 88 | 16.17 | 102 | 12.86 | ‐0.21 | 31 | 6.96 | 45 | 6.72 | ‐0.03 |
| (109–131) | (10.89–13.07) | (117–192) | (8.16–11.94) | (‐0.1–0.41) | (79–98) | (14.56–17.97) | (76–145) | (10.25–16.55) | (‐0.37–0.04) | (27–36) | (6.02–7.98) | (33–54) | (5.08–8.06) | (‐0.26–0.17) | ||
| Sri Lanka | 0.69 | 1963 | 10.10 | 2507 | 9.71 | ‐0.04 | 1446 | 16.37 | 1731 | 15.00 | ‐0.08 | 517 | 4.97 | 775 | 5.51 | 0.11 |
| (1848–2087) | (9.5–10.73) | (1822–3414) | (7.08–13.11) | (‐0.29–0.3) | (1338–1549) | (15.11–17.54) | (1203–2446) | (10.53–20.91) | (‐0.34–0.29) | (472–567) | (4.56–5.46) | (571–1026) | (4.06–7.27) | (‐0.19–0.44) | ||
| Turkey | 0.748 | 23 266 | 34.31 | 29 511 | 33.08 | ‐0.04 | 19 710 | 61.72 | 24 326 | 57.70 | ‐0.07 | 3556 | 9.96 | 5185 | 11.13 | 0.12 |
| (20 540–26 279) | (30.29–38.64) | (23 370–36 799) | (26.25–41.11) | (‐0.25–0.25) | (17 304–22 401) | (54.28–70.08) | (19 210–30 440) | (45.57–72.04) | (‐0.28–0.22) | (3128–4031) | (8.77–11.28) | (4127–6459) | (8.87–13.83) | (‐0.13–0.43) | ||
| Middle SDI | ||||||||||||||||
| Armenia | 0.689 | 1316 | 35.13 | 1346 | 31.80 | ‐0.09 | 1085 | 67.75 | 1105 | 60.67 | ‐0.10 | 231 | 10.73 | 241 | 10.22 | ‐0.05 |
| (1260–1376) | (33.69–36.69) | (1130–1596) | (26.74–37.68) | (‐0.24–0.07) | (1035–1141) | (64.76–71.21) | (925–1317) | (50.99–72.07) | (‐0.25–0.06) | (216–246) | (10.07–11.45) | (201–285) | (8.49–12.07) | (‐0.22–0.14) | ||
| Azerbaijan | 0.683 | 1748 | 23.41 | 2375 | 23.47 | 0.00 | 1404 | 41.30 | 1922 | 41.36 | 0.00 | 344 | 8.69 | 454 | 8.92 | 0.03 |
| (1484–1986) | (19.89–26.53) | (1746–3042) | (17.37–29.48) | (‐0.19–0.23) | (1145–1636) | (33.91–48.1) | (1298–2561) | (28.35–54.1) | (‐0.23–0.28) | (298–401) | (7.43–10.1) | (350–577) | (6.97–11.37) | (‐0.18–0.29) | ||
| China | 0.686 | 610 140 | 41.51 | 832 922 | 41.71 | 0.00 | 430 691 | 62.27 | 576 186 | 61.74 | ‐0.01 | 179 449 | 23.73 | 256 736 | 24.76 | 0.04 |
| (557 957–666 933) | (38–45.26) | (700 293–981 632) | (35.22–48.8) | (‐0.17–0.2) | (383 493–481 118) | (55.7–69.25) | (451 396–709 265) | (48.93–75.2) | (‐0.22–0.25) | (159 280–199 243) | (21.12–26.3) | (205 684–314 159) | (19.89–30.26) | (‐0.17–0.3) | ||
| Indonesia | 0.66 | 34 906 | 21.37 | 48 199 | 22.87 | 0.07 | 24 046 | 31.51 | 32 897 | 33.24 | 0.05 | 10 860 | 12.55 | 15 302 | 13.85 | 0.10 |
| (27 783–40 662) | (17.15–24.9) | (35 266–59 309) | (16.78–28.04) | (‐0.12–0.28) | (19 581–29 530) | (26.13–37.98) | (24 544–43 307) | (25.13–42.84) | (‐0.18–0.33) | (6739–15 321) | (7.83–17.48) | (8548–22 850) | (7.74–20.59) | (‐0.14–0.39) | ||
| Iran (Islamic Republic of) | 0.67 | 5621 | 10.72 | 8705 | 12.24 | 0.14 | 4043 | 15.36 | 5878 | 16.58 | 0.08 | 1578 | 5.98 | 2827 | 7.94 | 0.33 |
| (5345–5896) | (10.12–11.25) | (8040–9366) | (11.26–13.16) | (0.07–0.22) | (3833–4244) | (14.51–16.12) | (5357–6411) | (15.1–18.09) | (0–0.17) | (1486–1666) | (5.59–6.33) | (2548–3081) | (7.13–8.68) | (0.19–0.45) | ||
| Iraq | 0.671 | 2395 | 15.50 | 4154 | 18.69 | 0.21 | 1808 | 24.40 | 2997 | 28.37 | 0.16 | 587 | 7.15 | 1157 | 9.79 | 0.37 |
| (1875–2958) | (12.28–18.91) | (3200–5129) | (14.53–22.68) | (0–0.46) | (1380–2283) | (18.91–30.38) | (2290–3678) | (21.98–34.02) | (‐0.05–0.45) | (447–756) | (5.5–9.09) | (880–1475) | (7.53–12.32) | (0.08–0.76) | ||
| Philippines | 0.623 | 9978 | 17.35 | 13 827 | 17.71 | 0.17 | 7244 | 27.40 | 9522 | 26.62 | ‐0.03 | 2734 | 8.93 | 4305 | 10.38 | 0.16 |
| (9081–11 179) | (15.83–19.4) | (11 026–17 100) | (14.24–21.75) | (‐0.03–0.38) | (6420–8373) | (24.42–31.58) | (7205–12 395) | (20.36–34.23) | (‐0.29–0.27) | (2428–3108) | (7.96–10.1) | (3199–5617) | (7.79–13.4) | (‐0.15–0.56) | ||
| Syrian Arab Republic | 0.619 | 1167 | 11.71 | 1372 | 11.09 | ‐0.05 | 873 | 16.49 | 991 | 15.37 | ‐0.07 | 294 | 6.40 | 382 | 6.61 | 0.03 |
| (954–1400) | (9.68–13.97) | (1007–1814) | (8.24–14.52) | (‐0.28–0.22) | (702–1070) | (13.34–20.1) | (720–1313) | (11.3–20.13) | (‐0.31–0.23) | (239–354) | (5.28–7.58) | (262–519) | (4.56–8.78) | (‐0.26–0.36) | ||
| Thailand | 0.687 | 17 710 | 24.56 | 22 545 | 22.24 | ‐0.09 | 11 686 | 35.60 | 14 701 | 31.98 | ‐0.10 | 6023 | 15.44 | 7845 | 14.17 | ‐0.08 |
| (15 447–19 944) | (21.44–27.57) | (17 018–29 560) | (16.78–29.04) | (‐0.33–0.2) | (9968–13 420) | (30.55–40.69) | (10 810–19 418) | (23.67–42.06) | (‐0.34–0.23) | (5229–6868) | (13.37–17.66) | (5967–10 297) | (10.77–18.62) | (‐0.33–0.22) | ||
| Turkmenistan | 0.67 | 262 | 8.51 | 413 | 9.90 | 0.16 | 197 | 14.51 | 311 | 16.65 | 0.15 | 66 | 3.86 | 102 | 4.57 | 0.19 |
| (248–276) | (8.04–8.97) | (326–521) | (7.84–12.37) | (‐0.08–0.46) | (184–209) | (13.58–15.43) | (242–395) | (13.16–20.87) | (‐0.1–0.44) | (59–72) | (3.49–4.27) | (79–130) | (3.56–5.83) | (‐0.06–0.48) | ||
| Uzbekistan | 0.631 | 1825 | 11.77 | 2771 | 12.67 | 0.08 | 1333 | 19.63 | 1992 | 20.46 | 0.04 | 493 | 5.81 | 779 | 6.73 | 0.16 |
| (1741–1915) | (11.25–12.31) | (2282–3324) | (10.65–14.92) | (‐0.1–0.27) | (1253–1414) | (18.57–20.78) | (1620–2421) | (17.03–24.28) | (‐0.14–0.24) | (464–523) | (5.47–6.2) | (638–942) | (5.58–7.99) | (‐0.04–0.39) | ||
| Vietnam | 0.617 | 17 235 | 24.83 | 25 550 | 26.72 | 0.08 | 12 590 | 42.65 | 18 528 | 44.80 | 0.05 | 4645 | 11.81 | 7022 | 13.29 | 0.13 |
| (15 159–19 723) | (22.04–28.24) | (19 741–32 387) | (20.83–33.51) | (‐0.13–0.3) | (11 087–14 260) | (38.09–47.93) | (14 064–23 736) | (34.83–56.18) | (‐0.15–0.28) | (3843–5618) | (9.79–14.37) | (5269–9137) | (9.98–17.24) | (‐0.12–0.41) | ||
| Low‐middle SDI | ||||||||||||||||
| Bangladesh | 0.483 | 6566 | 7.64 | 9652 | 7.43 | ‐0.03 | 5397 | 11.69 | 7502 | 11.08 | ‐0.05 | 1169 | 2.90 | 2150 | 3.43 | 0.18 |
| (4863–8976) | (5.7–10.28) | (6331–15 120) | (4.91–11.56) | (‐0.28–0.27) | (3987–7425) | (8.74–15.83) | (4817–12 048) | (7.15–17.71) | (‐0.33–0.26) | (801–1657) | (1.97–4.14) | (1422–3061) | (2.26–4.91) | (‐0.09–0.49) | ||
| Bhutan | 0.455 | 32 | 7.24 | 43 | 7.73 | 0.07 | 24 | 10.64 | 31 | 11.08 | 0.04 | 8 | 3.61 | 12 | 4.25 | 0.18 |
| (24–41) | (5.44–9.48) | (31–58) | (5.57–10.59) | (‐0.11–0.28) | (16–32) | (7.04–14.45) | (20–44) | (7.06–15.83) | (‐0.14–0.25) | (5–13) | (2.36–6.02) | (8–18) | (2.88–6.69) | (‐0.04–0.47) | ||
| Cambodia | 0.469 | 1943 | 23.27 | 2888 | 24.71 | 0.06 | 1444 | 42.72 | 2091 | 44.38 | 0.04 | 499 | 10.00 | 796 | 11.58 | 0.16 |
| (1615–2410) | (19.41–29.44) | (2267–3576) | (19.4–30.59) | (‐0.12–0.26) | (1172–1852) | (34.7–55.69) | (1607–2668) | (34.42–57.78) | (‐0.14–0.24) | (408–613) | (8.27–12.25) | (609–1018) | (8.95–14.76) | (‐0.06–0.41) | ||
| Democratic People's Republic of Korea | 0.558 | 7716 | 28.48 | 9042 | 27.88 | ‐0.02 | 5232 | 49.12 | 6058 | 45.66 | ‐0.07 | 2484 | 15.64 | 2984 | 15.88 | 0.02 |
| (5937–9904) | (22.28–36.22) | (7008–11 461) | (21.77–35.2) | (‐0.17–0.14) | (3767–7144) | (36.39–65.33) | (4408–8117) | (33.78–59.94) | (‐0.21–0.1) | (1904–3102) | (12.08–19.45) | (2144–3880) | (11.37–20.73) | (‐0.19–0.24) | ||
| India | 0.566 | 58 555 | 6.95 | 87 339 | 7.70 | 0.11 | 44 441 | 10.80 | 61 253 | 11.16 | 0.03 | 14 113 | 3.30 | 26 086 | 4.49 | 0.36 |
| (53 880–63 454) | (6.38–7.52) | (71 865–103 504) | (6.36–9.1) | (‐0.09–0.31) | (40 224–48 717) | (9.74–11.84) | (48 085–75 929) | (8.8–13.74) | (‐0.19–0.27) | (12 387–15 766) | (2.88–3.7) | (20 315–32 542) | (3.51–5.59) | (0.06–0.71) | ||
| Kyrgyzstan | 0.596 | 464 | 13.08 | 569 | 12.20 | 0.01 | 358 | 23.41 | 430 | 21.29 | ‐0.09 | 106 | 5.22 | 139 | 5.37 | 0.03 |
| (444–483) | (12.5–13.63) | (493–647) | (10.62–13.86) | (‐0.19–0.27) | (340–374) | (22.28–24.5) | (371–492) | (18.45–24.33) | (‐0.21–0.04) | (99–113) | (4.85–5.59) | (115–164) | (4.47–6.31) | (‐0.14–0.21) | ||
| Lao People's Democratic Republic | 0.49 | 714 | 22.07 | 973 | 22.78 | 0.01 | 539 | 35.53 | 713 | 35.30 | ‐0.01 | 174 | 10.05 | 260 | 11.45 | 0.14 |
| (549–920) | (17.04–28.22) | (718–1264) | (17.04–29.01) | (‐0.17–0.22) | (402–723) | (26.79–47.27) | (519–923) | (26.3–44.79) | (‐0.2–0.22) | (134–247) | (7.83–14.21) | (186–372) | (8.37–16.54) | (‐0.09–0.41) | ||
| Maldives | 0.562 | 18 | 9.88 | 26 | 9.58 | ‐0.02 | 14 | 14.24 | 20 | 13.74 | ‐0.04 | 4 | 4.54 | 6 | 4.83 | 0.06 |
| (16–20) | (8.82–11.02) | (22–32) | (7.88–11.42) | (‐0.17–0.14) | (12–16) | (12.47–16.19) | (17–24) | (11.12–16.56) | (‐0.22–0.18) | (3–4) | (3.88–5.24) | (5–8) | (3.86–5.91) | (‐0.14–0.31) | ||
| Mongolia | 0.606 | 436 | 30.80 | 662 | 31.19 | ‐0.07 | 342 | 56.92 | 521 | 58.13 | 0.02 | 94 | 12.49 | 141 | 12.53 | 0.00 |
| (360–520) | (25.83–36.06) | (512–863) | (24.67–39.68) | (‐0.27–0.16) | (280–412) | (47.51–67.06) | (391–686) | (44.99–74.31) | (‐0.21–0.29) | (77–115) | (10.34–15.05) | (109–182) | (9.93–15.84) | (‐0.22–0.28) | ||
| Myanmar | 0.521 | 7977 | 22.49 | 10 291 | 22.43 | ‐0.03 | 5560 | 35.70 | 6983 | 35.42 | ‐0.01 | 2417 | 12.20 | 3308 | 12.78 | 0.05 |
| (5874–11 118) | (16.61–31.11) | (7608–14 071) | (16.85–30.17) | (‐0.2–0.17) | (3740–8705) | (24.28–55.37) | (4957–10 306) | (25.24–51.86) | (‐0.2–0.23) | (1893–3145) | (9.51–16.02) | (2559–4360) | (9.87–16.75) | (‐0.13–0.27) | ||
| Palestine | 0.588 | 318 | 19.25 | 523 | 22.53 | ‐0.05 | 252 | 34.39 | 410 | 38.02 | 0.11 | 66 | 7.17 | 113 | 9.15 | 0.27 |
| (288–348) | (17.43–21.05) | (444–613) | (19.09–26.1) | (‐0.28–0.27) | (226–280) | (30.8–38.2) | (349–478) | (32.52–43.98) | (‐0.09–0.32) | (59–76) | (6.29–8.2) | (92–137) | (7.46–10.99) | (0.01–0.59) | ||
| Tajikistan | 0.539 | 481 | 12.86 | 593 | 11.98 | ‐0.07 | 355 | 19.54 | 411 | 17.78 | ‐0.09 | 125 | 6.50 | 182 | 6.80 | 0.05 |
| (415–555) | (11.02–14.91) | (479–740) | (9.76–14.83) | (‐0.27–0.17) | (300–416) | (16.35–22.98) | (323–527) | (14.3–22.37) | (‐0.29–0.16) | (108–145) | (5.59–7.55) | (146–229) | (5.48–8.49) | (‐0.18–0.32) | ||
| Timor‐Leste | 0.514 | 108 | 17.36 | 158 | 19.48 | 0.12 | 79 | 25.16 | 113 | 28.08 | 0.12 | 30 | 9.47 | 46 | 11.12 | 0.17 |
| (77–142) | (12.32–22.53) | (113–207) | (13.86–25.27) | (‐0.12–0.39) | (52–105) | (16.6–33.1) | (75–148) | (18.7–36.55) | (‐0.13–0.41) | (22–47) | (7.2–15.05) | (32–66) | (7.93–15.99) | (‐0.11–0.49) | ||
| Low SDI | ||||||||||||||||
| Afghanistan | 0.343 | 1102 | 11.67 | 1476 | 11.74 | 0.01 | 873 | 19.77 | 1111 | 19.22 | ‐0.03 | 229 | 4.29 | 365 | 5.10 | 0.19 |
| (622–1880) | (6.83–19.97) | (871–2335) | (7.33–18.53) | (‐0.17–0.27) | (458–1626) | (10.56–36.59) | (618–1928) | (11.28–33.01) | (‐0.2–0.24) | (158–330) | (3.13–6.1) | (237–524) | (3.62–7.06) | (‐0.08–0.53) | ||
| Nepal | 0.422 | 1176 | 7.04 | 1759 | 8.03 | 0.00 | 839 | 10.15 | 1202 | 11.51 | 0.13 | 337 | 3.97 | 557 | 4.84 | 0.22 |
| (862–1552) | (5.13–9.3) | (1263–2275) | (5.86–10.37) | (‐0.18–0.22) | (619–1110) | (7.53–13.39) | (873–1535) | (8.4–14.59) | (‐0.12–0.39) | (212–508) | (2.46–6.09) | (371–803) | (3.22–7.03) | (‐0.04–0.57) | ||
| Pakistan | 0.449 | 14 621 | 17.38 | 18 401 | 16.43 | ‐0.18 | 12 630 | 28.75 | 15 424 | 26.67 | ‐0.07 | 1991 | 4.94 | 2978 | 5.50 | 0.11 |
| (11 540–18 092) | (13.79–21.4) | (13 970–24 265) | (12.47–21.49) | (‐0.32–0.02) | (9607–16 079) | (22.1–36.25) | (11 224–21 011) | (19.52–36.05) | (‐0.34–0.29) | (1564–2433) | (3.86–6) | (2160–3927) | (4.05–7.16) | (‐0.17–0.5) | ||
| Yemen | 0.412 | 952 | 10.13 | 1302 | 9.95 | ‐0.02 | 766 | 16.44 | 1014 | 15.94 | ‐0.03 | 186 | 3.83 | 289 | 4.15 | 0.09 |
| (684–1373) | (7.29–14.61) | (885–1930) | (6.8–14.67) | (‐0.21–0.21) | (532–1136) | (11.48–24.16) | (658–1601) | (10.39–24.91) | (‐0.24–0.21) | (141–250) | (2.9–5.03) | (212–391) | (3.11–5.57) | (‐0.21–0.36) | ||
Abbreviations: CI, confidence interval; SDI, sociodemographic index; TBL, tracheal, bronchial and lung.
National comparison
Among Asian countries, 20 countries experienced an increasing trend in the TBL cancer morbidity rate between 2010 and 2019; the greatest increase was detected in Iraq (increase in ASIR = 0.21 [95% CI: 0–0.46]) and the greatest decrease was detected in the United Arab Emirates (decrease in ASIR = −0.18 [95% CI: −0.37–0.06]) (Figure 4).
FIGURE 4.
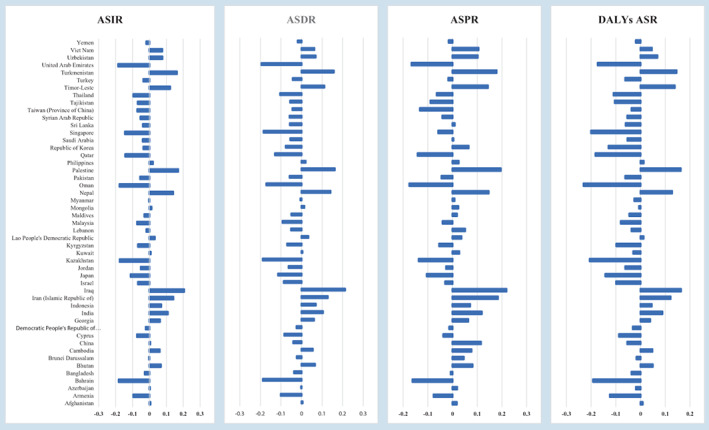
The relative change (%) in age‐standardized incidence rate (ASIR), age‐standardized death rate (ASMR), age‐standardized DALYs rate (DALYs ASR), and age‐standardized prevalence rate (ASPR) of TBL cancer in Asian countries from 1990 to 2019.
In 2019, the highest ASIR (per 100 000) of TBL cancer was reported in Brunei Darussalam (46.15), China (41.71), the Republic of Korea (35.61), Turkey (33.08), and Taiwan (Province of China) (31.88). The lowest ASIR of TBL cancer was reported in Bangladesh (7.43), India (7.7), Bhutan (7.73), Nepal (8.03), and Saudi Arabia (8.77). The national distribution of TBL cancer among men and women was the same as the overall distribution; however, men in Georgia had the highest ASIR rate (62.13). Detailed results are presented in Table 4.
Mortality of TBL cancer in Asia
Compared with global data and continents
In Asia, the number of TBL cancer deaths increased from 906 650 (95% CI: 846 561–964 850) in 2010 to 1 190 516 (95% CI: 1 052 836–1 330 529) in 2019, which is over a 1.31‐fold increase. In 2019 more than 58% (1 190 516/2 042 640) of TBL cancer deaths happened in Asian countries. During this period, the ASDR of TBL cancer with a 3% change, decreased from 26.66 (95% CI: 24.77–28.33) per 100 000 in 2010 to 25.76 (95% CI: 22.79–28.72) per 100 000 in 2019, while in the same time, this rate globally decreased by 6%, in America by 10%, and in Europe by 8% (Figure 1 and Table 1).
In Asian men, the number of TBL cancer deaths increased from 646 099 (95% CI: 599 147–694 710) in 2010 to 825 738 (95% CI: 706 207–949 796) in 2019, which is over a 1.28‐fold increase. In 2019 approximately 69.4% of Asian TBL cancer deaths occurred in Asian men which included 60% (825 738/1 386 094) of global male TBL cancer death cases. During this period, the ASDR of TBL cancer with a 6% change, decreased from 40.66 (95% CI: 37.75–43.57) per 100 000 in 2010 to 38.3 (95% CI: 33–43.79) per 100 000 in 2019, while in the same time, this rate globally decreased by 9%, in America by 12% and in Europe by 13% (Table 2).
In Asian women, the number of TBL cancer deaths increased from 260 550 (95% CI: 238 233–282 526) in 2010 to 364 778 (95% CI: 312 089–421 085) in 2019, which is over a 1.4‐fold increase. In 2019 approximately 30.6% of Asian TBL cancer deaths occurred in Asian women which included 55.6% (364 778 /656 546) of global female TBL cancer incidence cases. During this period, the age‐standardized incidence rate (ASIR) of TBL cancer with a 2% change, increased from 14.67 (95% CI: 13.35–15.92) per 100 000 in 2010 to 14.98 (95% CI: 12.81–17.27) per 100 000 in 2019, while in the same time, this rate globally experienced no changes, in Africa increased by 12%, and in Europe by 2%; while in American countries decreased by 8% (Table 3).
Age distribution
In 2019, age‐specific death cases of TBL cancer were peaking at 70–74 years generally, in males, and females. In all age groups, death cases of TBL cancer in males were higher than in females, except in ages above 90 years which in females was higher (Figure 5).
FIGURE 5.
Age specific death cases of TBL cancer among sexes in Asia, 2019.
Within Asian regions
In 2019, the highest ASDR of TBL was observed in East Asian countries (38.38 [95% CI: 32.72–44.57]); with a 4% decrease compared with 2010. While the Central Asia and high‐income Asia Pacific countries experienced a decreasing trend of 7% and 11%, respectively; the South Asian countries experienced the highest increasing trend from 2010 to 2019 (by 6%) (Figure 3 and Table 1).
In men, the highest ASDR of TBL was observed in East Asia countries (57.5 [95% CI: 46.25–69.74]); with a 5% decrease compared with 2010. While Central Asia, High‐income Asia Pacific, North Africa and Middle East countries experienced a decreasing trend of 9, 15, and 3%, respectively; the South Asian and Southeast Asian countries experienced a stable trend from 2010 to 2019 (Table 2).
In women, the highest ASDR of TBL was observed in Southeast Asian countries (13.36 [95% CI: 10.19–16.57]) in 2019; other countries experienced an increasing trend from 2010 to 2019, except high‐income Asia Pacific countries who experienced a decreasing trend by 3% from 2010 to 2019 and East Asia experienced a stable trend. Other countries experienced an increasing trend from 2% to 31%. South Asian countries experienced the highest increasing trend from 2010 to 2019 (by 31%) (Table 3).
Based on SDI
Among high SDI Asian countries, Brunei Darussalam (44.83) and Taiwan (Province of China) (30.35) had the highest ASDR of TBL, and Saudi Arabia (9.14) had the lowest rate. Among high‐middle SDI Asian countries, Turkey (33.77) and Georgia (30.57) had the highest ASDR of TBL, and Sri Lanka (9.78) had the lowest rate. Among middle SDI Asian countries, China (38.70) and Armenia (31.62) had the highest ASIR of TBL, and Turkmenistan (9.86) had the lowest rate. Among low‐middle SDI Asian countries, Mongolia (33.35) and the Democratic People's Republic of Korea (28.54) had the highest ASDR of TBL, and Bangladesh (7.81) had the lowest rate. Among low SDI Asian countries, Pakistan (17.16) had the highest ASDR of TBL, and Nepal (8.62) had the lowest rate. Further details are presented in Table 5.
TABLE 5.
The death distribution of TBL cancer in Asian countries in 2010 and 2019 and the temporal trends between 2010 and 2019, by geographical region and SDI.
| Both | Male | Female | ||||||||||||||
|---|---|---|---|---|---|---|---|---|---|---|---|---|---|---|---|---|
| Location | SDI 2019 | 2010 | 2019 | % change 2010–2010 | 2010 | 2019 | % change 2010–2019 | 2010 | 2019 | % change 2010–2019 | ||||||
| Number | ASR per 100 000 | Number | ASR per 100 000 | Number | ASR per 100 000 | Number | ASR per 100 000 | Number | ASR per 100 000 | number | ASR per 100 000 | |||||
| (95% CI) | (95% CI) | (95% CI) | (95% CI) | (95% CI) | (95% CI) | (95% CI) | (95% CI) | (95% CI) | (95% CI) | (95% CI) | (95% CI) | (95% CI) | (95% CI) | (95% CI) | ||
| High SDI | ||||||||||||||||
| Brunei Darussalam | 0.823 | 69 | 45.89 | 103 | 44.83 | ‐0.02 | 39 | 60.935874 | 57 | 61.11 | 0.00 | 30 | 35.25 | 47 | 5.76 | 0.02 |
| (63–76) | (41.83–49.96) | (92–116) | (39.66–50.19) | (‐0.14–0.11) | (35–44) | (53.69–68.48) | (47–67) | (51.96–71.14) | (‐0.16–0.18) | (27–33) | (31.44–39.05) | (40–54) | (4.23–7.59) | (‐0.13–0.2) | ||
| Cyprus | 0.841 | 362 | 25.56 | 462 | 23.42 | ‐0.08 | 283 | 44.832451 | 358 | 38.37 | ‐0.14 | 79 | 10.36 | 104 | 11.76 | ‐0.01 |
| (340–385) | (24–27.22) | (404–525) | (20.52–26.63) | (‐0.21–0.05) | (264–305) | (41.76–48.26) | (309–412) | (33.08–44.39) | (‐0.27–0) | (71–87) | (9.4–11.38) | (88–121) | (8.38–16.83) | (‐0.17–0.13) | ||
| Israel | 0.803 | 2084 | 23.74 | 2518 | 21.69 | ‐0.09 | 1391 | 35.486246 | 1651 | 31.35 | ‐0.12 | 692 | 14.02 | 867 | 13.53 | ‐0.04 |
| (1963–2166) | (22.44–24.64) | (2314–2684) | (20.04–23.1) | (‐0.14–‐0.03) | (1320–1451) | (33.69–37) | (1526–1769) | (29.01–33.63) | (‐0.17–‐0.05) | (633–735) | (12.95–14.82) | (769–953) | (10.5–17.71) | (‐0.12–0.04) | ||
| Japan | 0.87 | 77 446 | 23.94 | 86 001 | 21.21 | ‐0.11 | 55 542 | 41.086896 | 59 128 | 34.43 | ‐0.16 | 21 904 | 11.34 | 26 873 | 13.46 | ‐0.04 |
| (68 445–82 060) | (21.57–25.15) | (73 379–92 677) | (18.86–22.52) | (‐0.14–‐0.09) | (50 829–57 902) | (37.63–42.84) | (52 951–62 882) | (31.29–36.42) | (‐0.19–‐0.14) | (17 457–24 307) | (9.57–12.3) | (20 579–30 319) | (10.15–17.38) | (‐0.07–0) | ||
| Kuwait | 0.851 | 133 | 10.71 | 228 | 10.75 | 0.00 | 104 | 13.622346 | 181 | 14.51 | 0.07 | 29 | 5.86 | 47 | 7.64 | ‐0.15 |
| (123–142) | (9.82–11.46) | (185–275) | (8.72–12.98) | (‐0.18–0.21) | (95–112) | (12.47–14.67) | (140–225) | (11.28–18.13) | (‐0.16–0.34) | (26–32) | (5.19–6.45) | (37–59) | (6.43–8.89) | (‐0.32–0.04) | ||
| Qatar | 0.83 | 66 | 23.82 | 119 | 20.74 | ‐0.13 | 56 | 28.944687 | 101 | 23.78 | ‐0.18 | 10 | 12.55 | 18 | 6.89 | ‐0.06 |
| (53–81) | (19.57–28.75) | (85–165) | (16–26.07) | (‐0.32–0.11) | (44–71) | (23.08–35.69) | (70–144) | (18.07–30.42) | (‐0.39–0.1) | (8–12) | (10.07–15.24) | (14–23) | (5.75–8.14) | (‐0.24–0.16) | ||
| Republic of Korea | 0.878 | 17 173 | 28.48 | 23 300 | 26.30 | ‐0.08 | 12 516 | 51.709606 | 16 614 | 44.73 | ‐0.13 | 4658 | 13.36 | 6686 | 5.07 | ‐0.02 |
| (16 151–18 288) | (26.55–30.46) | (20 864–25 565) | (23.51–28.95) | (‐0.15–0) | (11 907–13 376) | (48.53–55.26) | (14 800–18 406) | (39.53–49.69) | (‐0.22–‐0.04) | (4138–5002) | (11.84–14.43) | (5681–7580) | (4.04–6.2) | (‐0.12–0.09) | ||
| Saudi Arabia | 0.805 | 1026 | 9.67 | 1492 | 9.14 | ‐0.05 | 779 | 13.087167 | 1110 | 11.67 | ‐0.11 | 247 | 5.16 | 382 | 16.51 | 0.03 |
| (911–1186) | (8.74–10.97) | (1146–1830) | (7.33–11.06) | (‐0.23–0.13) | (692–914) | (11.82–15.09) | (842–1380) | (9.15–14.5) | (‐0.29–0.1) | (215–283) | (4.51–5.86) | (286–493) | (12.14–22.82) | (‐0.21–0.29) | ||
| Singapore | 0.861 | 1180 | 25.62 | 1566 | 20.89 | ‐0.18 | 779 | 38.33246 | 1010 | 29.36 | ‐0.23 | 401 | 15.82 | 556 | 12.13 | ‐0.12 |
| (1106–1228) | (23.72–26.8) | (1414–1682) | (18.7–22.48) | (‐0.24–‐0.13) | (736–812) | (35.88–40.11) | (915–1087) | (26.4–31.74) | (‐0.3–‐0.18) | (363–430) | (14.22–16.98) | (476–621) | (9.35–15.37) | (‐0.21–‐0.03) | ||
| Taiwan (Province of China) | 0.868 | 9477 | 31.76 | 12 053 | 30.35 | ‐0.04 | 6275 | 43.334223 | 7526 | 41.31 | ‐0.05 | 3201 | 20.89 | 4527 | 5.15 | 0.01 |
| (8860–9886) | (29.66–33.13) | (9527–15 345) | (24.07–38.58) | (‐0.24–0.21) | (5890–6556) | (40.7–45.28) | (5915–9577) | (32.49–52.51) | (‐0.25–0.21) | (2911–3386) | (18.96–22.13) | (3521–5766) | (3.38–7.58) | (‐0.2–0.29) | ||
| United Arab Emirates | 0.88 | 221 | 25.27 | 523 | 20.35 | ‐0.19 | 172 | 28.051538 | 423 | 23.74 | ‐0.15 | 49 | 20.31 | 100 | 13.55 | ‐0.33 |
| (177–267) | (20.93–29.73) | (380–697) | (14.71–28.22) | (‐0.38–0.06) | (136–211) | (22.57–34.14) | (303–580) | (17.44–32.88) | (‐0.33–0.09) | (38–60) | (16.3–24.84) | (66–135) | (7.93–20.63) | (‐0.6–0.08) | ||
| High‐middle SDI | ||||||||||||||||
| Bahrain | 0.751 | 86 | 27.19 | 142 | 22.08 | ‐0.19 | 64 | 39.55 | 106 | 30.42 | ‐0.23 | 22 | 15.08 | 35 | 10.91 | ‐0.14 |
| (76–97) | (24–30.54) | (107–187) | (17.07–27.74) | (‐0.36–0.01) | (55–74) | (34.23–45.28) | (78–144) | (22.96–39.13) | (‐0.41–0) | (19–26) | (13.06–17.35) | (28–43) | (9.02–12) | (‐0.3–0.04) | ||
| Georgia | 0.702 | 1659 | 28.83 | 1770 | 30.57 | 0.06 | 1392 | 57.63 | 1496 | 61.47 | 0.07 | 267 | 7.74 | 274 | 12.19 | 0.03 |
| (1512–1806) | (26.19–31.44) | (1485–2080) | (25.58–36.05) | (‐0.13–0.28) | (1248–1533) | (51.79–63.61) | (1241–1764) | (51.26–72.48) | (‐0.13–0.29) | (242–293) | (7.01–8.52) | (230–329) | (9.55–15.44) | (‐0.17–0.25) | ||
| Jordan | 0.731 | 492 | 16.12 | 917 | 15.11 | ‐0.06 | 394 | 24.90 | 711 | 22.35 | ‐0.10 | 98 | 6.54 | 206 | 7.21 | 0.10 |
| (437–554) | (14.4–18.16) | (749–1110) | (12.47–18.25) | (‐0.24–0.14) | (347–451) | (21.91–28.36) | (551–897) | (17.53–27.92) | (‐0.3–0.13) | (84–113) | (5.61–7.63) | (163–261) | (5.7–9.09) | (‐0.12–0.4) | ||
| Kazakhstan | 0.723 | 3707 | 26.06 | 3717 | 21.14 | ‐0.19 | 3023 | 53.60 | 2949 | 41.77 | ‐0.22 | 684 | 8.18 | 768 | 9.16 | ‐0.07 |
| (3528–3903) | (24.81–27.42) | (3184–4261) | (18.19–24.13) | (‐0.31–‐0.06) | (2849–3222) | (50.5–56.9) | (2501–3441) | (35.55–48.3) | (‐0.34–‐0.09) | (644–724) | (7.72–8.65) | (646–894) | (7.1–11.7) | (‐0.22–0.1) | ||
| Lebanon | 0.708 | 1233 | 28.99 | 1433 | 27.51 | ‐0.05 | 901 | 43.86 | 961 | 40.95 | ‐0.07 | 332 | 15.21 | 472 | 13.69 | 0.09 |
| (1055–1587) | (24.77–37.45) | (1184–1898) | (22.67–36.43) | (‐0.19–0.1) | (750–1179) | (36.6–57.8) | (768–1281) | (32.73–54.66) | (‐0.21–0.11) | (278–431) | (12.73–19.7) | (347–656) | (10.94–17.28) | (‐0.17–0.3) | ||
| Malaysia | 0.737 | 3987 | 22.70 | 5221 | 20.60 | ‐0.09 | 2788 | 32.03 | 3689 | 29.23 | ‐0.09 | 1199 | 13.73 | 1532 | 12.07 | ‐0.12 |
| (3634–4394) | (20.65–25.05) | (4060–6639) | (16.01–25.95) | (‐0.29–0.13) | (2532–3082) | (28.86–35.47) | (2834–4679) | (22.62–37.18) | (‐0.29–0.15) | (1085–1335) | (12.35–15.43) | (1177–1946) | (8.92–17.44) | (‐0.31–0.1) | ||
| Oman | 0.783 | 120 | 12.61 | 144 | 10.45 | ‐0.17 | 90 | 17.49 | 103 | 14.17 | ‐0.19 | 30 | 6.91 | 42 | 13.13 | ‐0.04 |
| (109–131) | (11.49–13.75) | (115–187) | (8.67–12.59) | (‐0.31–0.02) | (81–100) | (15.76–19.37) | (77–143) | (11.41–18.04) | (‐0.36–0.04) | (26–34) | (5.96–7.91) | (30–50) | (11.21–14.86) | (‐0.26–0.15) | ||
| Sri Lanka | 0.69 | 1958 | 10.37 | 2478 | 9.78 | ‐0.06 | 1438 | 16.86 | 1704 | 15.17 | ‐0.10 | 520 | 5.14 | 774 | 11.80 | 0.08 |
| (1845–2082) | (9.75–11.02) | (1804–3369) | (7.17–13.16) | (‐0.3–0.26) | (1329–1540) | (15.56–18.17) | (1181–2405) | (10.71–20.97) | (‐0.36–0.25) | (475–570) | (4.7–5.64) | (570–1018) | (9.31–14.65) | (‐0.2–0.4) | ||
| Turkey | 0.748 | 23 677 | 35.27 | 29 832 | 33.77 | ‐0.04 | 20 121 | 64.00 | 24 781 | 59.69 | ‐0.07 | 3556 | 10.04 | 5051 | 6.60 | 0.09 |
| (20 919–26 663) | (31.17–39.67) | (23 752–37 028) | (26.89–41.8) | (‐0.25–0.23) | (17 682–22 813) | (56.28–72.42) | (19 591–30 951) | (47.29–74.06) | (‐0.28–0.21) | (3109–4051) | (8.77–11.45) | (4027–6271) | (4.98–7.96) | (‐0.15–0.39) | ||
| Middle SDI | ||||||||||||||||
| Armenia | 0.689 | 1318 | 35.17 | 1334 | 31.62 | ‐0.10 | 1084 | 68.17 | 1091 | 60.65 | ‐0.11 | 234 | 10.84 | 243 | 13.41 | ‐0.06 |
| (1259–1380) | (33.7–36.83) | (1122–1578) | (26.67–37.28) | (‐0.24–0.06) | (1035–1140) | (65.21–71.66) | (916–1296) | (51.04–71.69) | (‐0.25–0.05) | (219–249) | (10.16–11.57) | (202–285) | (11.96–14.7) | (‐0.22–0.12) | ||
| Azerbaijan | 0.683 | 1718 | 23.64 | 2296 | 23.58 | 0.00 | 1376 | 41.67 | 1852 | 41.55 | 0.00 | 342 | 8.96 | 444 | 5.58 | 0.02 |
| (1462–1949) | (20.17–26.79) | (1687–2921) | (17.54–29.65) | (‐0.19–0.22) | (1123–1599) | (34.32–48.26) | (1253–2449) | (28.54–53.95) | (‐0.23–0.27) | (295–398) | (7.6–10.43) | (346–567) | (4.12–7.34) | (‐0.18–0.27) | ||
| China | 0.686 | 576 914 | 40.32 | 757 171 | 38.70 | ‐0.04 | 407 013 | 61.44 | 523 192 | 58.10 | ‐0.05 | 169 901 | 22.95 | 233 980 | 13.86 | 0.00 |
| (525 378–627 888) | (36.72–43.74) | (638 741–887 752) | (32.8–45.03) | (‐0.2–0.14) | (364 221–453 597) | (55.4–67.89) | (413 189–647 410) | (46.53–70.89) | (‐0.25–0.18) | (151 510–187 913) | (20.52–25.38) | (189 176–282 754) | (11.9–15.47) | (‐0.21–0.23) | ||
| Indonesia | 0.66 | 35 895 | 22.85 | 49 437 | 24.43 | 0.07 | 24 808 | 34.01 | 33 792 | 35.81 | 0.05 | 11 086 | 13.29 | 15 645 | 3.62 | 0.11 |
| (29 166–41 844) | (18.64–26.48) | (36 066–61 105) | (17.87–30.22) | (‐0.12–0.25) | (20 169–30 290) | (28.07–40.5) | (24 844–44 220) | (27.13–45.72) | (‐0.18–0.34) | (6893–15 503) | (8.37–18.31) | (8696–23 612) | (2.36–5.2) | (‐0.13–0.37) | ||
| Iran (Islamic Republic of) | 0.67 | 5820 | 11.43 | 8923 | 12.88 | 0.13 | 4251 | 16.54 | 6155 | 17.78 | 0.07 | 1569 | 6.19 | 2768 | 10.93 | 0.30 |
| (5524–6094) | (10.75–11.99) | (8247–9595) | (11.86–13.89) | (0.06–0.21) | (4013–4451) | (15.54–17.35) | (5636–6725) | (16.23–19.41) | (0–0.16) | (1478–1653) | (5.77–6.54) | (2488–3018) | (8.44–13.91) | (0.16–0.42) | ||
| Iraq | 0.671 | 2439 | 16.40 | 4232 | 19.86 | 0.21 | 1862 | 26.22 | 3106 | 30.87 | 0.18 | 577 | 7.29 | 1125 | 16.34 | 0.36 |
| (1919–2991) | (13.04–19.86) | (3275–5190) | (15.62–23.82) | (0.01–0.46) | (1430–2338) | (20.5–32.43) | (2375–3782) | (24.16–36.78) | (‐0.03–0.46) | (441–738) | (5.65–9.2) | (861–1428) | (11.79–21.14) | (0.08–0.74) | ||
| Philippines | 0.623 | 10 071 | 18.10 | 13 964 | 18.47 | 0.02 | 7292 | 28.64 | 9574 | 27.81 | ‐0.03 | 2779 | 9.40 | 4391 | 36.09 | 0.16 |
| (9171–11 304) | (16.52–20.33) | (11 342–17 103) | (15.13–22.39) | (‐0.18–0.24) | (6473–8370) | (25.5–32.82) | (7259–12 342) | (21.32–35.44) | (‐0.26–0.25) | (2482–3134) | (8.41–10.6) | (3359–5627) | (30.48–41.95) | (‐0.13–0.53) | ||
| Syrian Arab Republic | 0.619 | 1163 | 12.34 | 1374 | 11.62 | ‐0.06 | 883 | 17.36 | 1007 | 16.16 | ‐0.07 | 280 | 6.69 | 368 | 5.33 | 0.02 |
| (951–1394) | (10.22–14.66) | (1011–1813) | (8.7–15.09) | (‐0.28–0.2) | (713–1080) | (14.13–21.12) | (735–1330) | (11.92–21.03) | (‐0.31–0.22) | (229–337) | (5.52–7.91) | (251–496) | (3.89–7.3) | (‐0.26–0.33) | ||
| Thailand | 0.687 | 18 077 | 25.63 | 23 109 | 22.96 | ‐0.10 | 11 877 | 37.26 | 14 984 | 33.14 | ‐0.11 | 6200 | 16.16 | 8125 | 4.70 | ‐0.09 |
| (15 773–20 299) | (22.28–28.73) | (17 523–30 148) | (17.39–29.79) | (‐0.33–0.18) | (10 169–13 616) | (31.81–42.52) | (11 049–19 714) | (24.72–43.49) | (‐0.35–0.21) | (5362–7096) | (13.93–18.5) | (6109–10 606) | (3.69–5.87) | (‐0.33–0.2) | ||
| Turkmenistan | 0.67 | 255 | 8.52 | 399 | 9.86 | 0.16 | 191 | 14.68 | 300 | 16.74 | 0.14 | 64 | 3.88 | 99 | 9.30 | 0.17 |
| (242–268) | (8.04–8.99) | (316–504) | (7.82–12.24) | (‐0.08–0.45) | (179–203) | (13.73–15.6) | (234–380) | (13.32–20.9) | (‐0.1–0.43) | (58–71) | (3.5–4.29) | (77–126) | (7.6–11.15) | (‐0.07–0.47) | ||
| Uzbekistan | 0.631 | 1777 | 12.10 | 2656 | 12.93 | 0.07 | 1299 | 20.34 | 1912 | 20.99 | 0.03 | 479 | 6.03 | 744 | 4.34 | 0.14 |
| (1697–1861) | (11.6–12.67) | (2189–3179) | (10.95–15.15) | (‐0.1–0.26) | (1220–1375) | (19.23–21.51) | (1564–2316) | (17.52–24.9) | (‐0.15–0.23) | (451–508) | (5.67–6.43) | (612–898) | (3.25–5.81) | (‐0.05–0.37) | ||
| Vietnam | 0.617 | 17 351 | 25.40 | 25 161 | 26.98 | 0.06 | 12 611 | 44.08 | 18 151 | 45.80 | 0.04 | 4741 | 12.13 | 7010 | 5.31 | 0.11 |
| (15 352–19 780) | (22.5–28.76) | (19 494–31 704) | (21.12–33.59) | (‐0.14–0.28) | (11 157–14 257) | (39.47–49.43) | (13 927–23 007) | (35.79–57.02) | (‐0.16–0.25) | (3943–5695) | (10.14–14.62) | (5288–9118) | (4.06–6.69) | (‐0.13–0.38) | ||
| Low‐middle SDI | ||||||||||||||||
| Bangladesh | 0.483 | 6743 | 8.11 | 9970 | 7.81 | ‐0.04 | 5553 | 12.39 | 7765 | 11.63 | ‐0.06 | 1190 | 3.09 | 2206 | 10.23 | 0.17 |
| (5015–9167) | (6.03–10.91) | (6569–15 550) | (5.19–12.13) | (‐0.29–0.26) | (4139–7591) | (9.3–16.69) | (5023–12 476) | (7.59–18.55) | (‐0.34–0.26) | (810–1679) | (2.07–4.43) | (1454–3162) | (8.52–12.03) | (‐0.09–0.46) | ||
| Bhutan | 0.455 | 33 | 7.75 | 44 | 8.26 | 0.07 | 25 | 11.44 | 33 | 11.87 | 0.04 | 8 | 3.84 | 12 | 8.03 | 0.17 |
| (25–43) | (5.8–10.14) | (32–61) | (5.99–11.35) | (‐0.11–0.27) | (17–34) | (7.51–15.45) | (21–46) | (7.58–16.84) | (‐0.14–0.25) | (5–13) | (2.53–6.37) | (8–19) | (7.19–8.8) | (‐0.04–0.46) | ||
| Cambodia | 0.469 | 2022 | 25.00 | 2985 | 26.38 | 0.05 | 1511 | 46.42 | 2169 | 47.99 | 0.03 | 510 | 10.54 | 816 | 9.90 | 0.16 |
| (1683–2527) | (20.87–31.72) | (2340–3699) | (20.84–32.64) | (‐0.12–0.25) | (1224–1953) | (37.87–61.36) | (1672–2792) | (37.23–62.64) | (‐0.14–0.24) | (420–626) | (8.75–12.92) | (629–1048) | (7.7–12.23) | (‐0.06–0.41) | ||
| Democratic People's Republic of Korea | 0.558 | 7796 | 29.26 | 9163 | 28.54 | ‐0.02 | 5238 | 51.31 | 6072 | 47.49 | ‐0.07 | 2558 | 16.21 | 3091 | 7.96 | 0.01 |
| (6038–9952) | (23.13–36.87) | (7158–11 540) | (22.5–35.77) | (‐0.16–0.14) | (3795–7105) | (38.38–67.9) | (4439–8075) | (35.33–61.49) | (‐0.21–0.09) | (1988–3187) | (12.68–20.03) | (2235–3985) | (6.61–9.56) | (‐0.19–0.22) | ||
| India | 0.566 | 59 637 | 7.31 | 89 242 | 8.07 | 0.10 | 45 272 | 11.38 | 62 544 | 11.73 | 0.03 | 14 365 | 3.47 | 26 698 | 22.86 | 0.35 |
| (55 118–64 928) | (6.72–7.96) | (73 675–105 403) | (6.65–9.49) | (‐0.09–0.3) | (40 946–50 024) | (10.27–12.56) | (49 134–76 427) | (9.25–14.32) | (‐0.19–0.27) | (12 383–16 094) | (2.97–3.93) | (20 990–33 532) | (18.52–27.52) | (0.04–0.7) | ||
| Kyrgyzstan | 0.596 | 463 | 13.28 | 560 | 12.35 | ‐0.07 | 354 | 23.76 | 422 | 21.60 | ‐0.09 | 108 | 5.40 | 139 | 10.21 | 0.02 |
| (443–481) | (12.7–13.83) | (486–636) | (10.8–14.02) | (‐0.19–0.05) | (337–370) | (22.63–24.86) | (364–483) | (18.79–24.65) | (‐0.21–0.04) | (101–116) | (5.03–5.78) | (115–163) | (8.66–11.83) | (‐0.15–0.2) | ||
| Lao People's Democratic Republic | 0.49 | 735 | 23.51 | 1000 | 24.28 | 0.03 | 558 | 38.21 | 736 | 37.99 | ‐0.01 | 177 | 10.56 | 264 | 4.55 | 0.14 |
| (567–944) | (18.32–29.96) | (742–1290) | (18.33–30.73) | (‐0.15–0.25) | (418–746) | (29.15–50.58) | (538–944) | (28.33–48.32) | (‐0.19–0.21) | (137–251) | (8.33–14.96) | (191–380) | (3.59–5.73) | (‐0.08–0.41) | ||
| Maldives | 0.562 | 19 | 10.71 | 27 | 10.19 | ‐0.05 | 15 | 15.42 | 21 | 14.67 | ‐0.05 | 4 | 4.86 | 6 | 14.71 | 0.04 |
| (17–21) | (9.55–11.95) | (22–32) | (8.37–12.12) | (‐0.22–0.14) | (13–17) | (13.54–17.52) | (17–25) | (11.9–17.69) | (‐0.23–0.16) | (3–5) | (4.14–5.62) | (5–8) | (8.21–21.61) | (‐0.16–0.3) | ||
| Mongolia | 0.606 | 444 | 32.91 | 672 | 33.35 | 0.01 | 346 | 61.58 | 525 | 62.75 | 0.02 | 98 | 13.68 | 146 | 14.65 | 0.00 |
| (368–528) | (27.71–38.32) | (523–869) | (26.47–41.97) | (‐0.19–0.25) | (284–415) | (51.74–72.13) | (397–686) | (49.16–79.39) | (‐0.2–0.28) | (81–120) | (11.37–16.36) | (114–188) | (11.02–19.14) | (‐0.21–0.26) | ||
| Myanmar | 0.521 | 8280 | 23.93 | 10 614 | 23.80 | ‐0.01 | 5780 | 38.31 | 7195 | 37.84 | ‐0.01 | 2500 | 12.90 | 3419 | 7.07 | 0.05 |
| (6111–11 662) | (17.77–33.42) | (7896–14 368) | (17.76–31.88) | (‐0.17–0.22) | (3900–9101) | (25.96–59.89) | (5113–10 591) | (27.01–55.32) | (‐0.19–0.22) | (1957–3185) | (10.04–16.86) | (2644–4499) | (5.71–8.81) | (‐0.13–0.29) | ||
| Palestine | 0.588 | 327 | 20.51 | 530 | 23.83 | 0.16 | 261 | 37.39 | 420 | 41.19 | 0.10 | 66 | 7.40 | 110 | 5.50 | 0.26 |
| (296–357) | (18.54–22.39) | (448–618) | (20.24–27.6) | (‐0.04–0.38) | (234–289) | (33.48–41.42) | (358–487) | (35.31–47.72) | (‐0.09–0.31) | (58–75) | (6.48–8.45) | (90–133) | (4.59–6.45) | (‐0.01–0.57) | ||
| Tajikistan | 0.539 | 480 | 13.31 | 586 | 12.57 | ‐0.06 | 355 | 20.32 | 408 | 18.83 | ‐0.07 | 124 | 6.72 | 178 | 4.96 | 0.05 |
| (414–554) | (11.39–15.41) | (476–732) | (10.27–15.51) | (‐0.25–0.19) | (300–416) | (16.96–23.89) | (322–522) | (15.17–23.47) | (‐0.28–0.18) | (108–145) | (5.76–7.81) | (143–224) | (3.95–6.14) | (‐0.17–0.32) | ||
| Timor‐Leste | 0.514 | 113 | 18.81 | 165 | 20.90 | 0.11 | 82 | 27.40 | 118 | 30.31 | 0.11 | 31 | 10.08 | 47 | 6.82 | 0.17 |
| (80–148) | (13.31–24.46) | (116–216) | (14.99–27.09) | (‐0.12–0.37) | (54–110) | (18.17–35.66) | (78–154) | (20.01–39.3) | (‐0.14–0.39) | (23–49) | (7.75–16.04) | (33–67) | (4.76–8.95) | (‐0.11–0.47) | ||
| Low SDI | ||||||||||||||||
| Afghanistan | 0.343 | 1136 | 12.46 | 1492 | 12.53 | 0.01 | 908 | 21.10 | 1133 | 20.59 | ‐0.02 | 228 | 4.48 | 359 | 13.04 | 0.19 |
| (652–1939) | (7.48–21.27) | (892–2356) | (7.99–19.7) | (‐0.17–0.27) | (482–1679) | (11.52–38.64) | (641–1954) | (12.25–34.99) | (‐0.19–0.24) | (160–326) | (3.3–6.35) | (238–512) | (10.45–15.76) | (‐0.08–0.53) | ||
| Nepal | 0.422 | 1225 | 7.55 | 1837 | 8.62 | 0.14 | 878 | 10.95 | 1263 | 12.43 | 0.13 | 347 | 4.22 | 574 | 4.50 | 0.22 |
| (897–1614) | (5.5–9.99) | (1334–2371) | (6.31–11.18) | (‐0.1–0.4) | (647–1161) | (8.12–14.42) | (917–1608) | (9.07–15.75) | (‐0.12–0.39) | (217–528) | (2.6–6.55) | (382–830) | (3.1–7.16) | (‐0.05–0.58) | ||
| Pakistan | 0.449 | 14 819 | 18.22 | 18 550 | 17.16 | ‐0.06 | 12 810 | 30.17 | 15 555 | 27.89 | ‐0.08 | 2009 | 5.18 | 2995 | 21.16 | 0.11 |
| (11 510–18 507) | (14.31–22.58) | (14 209–23 969) | (13.14–22.05) | (‐0.28–0.25) | (9608–16 488) | (22.98–38.53) | (11 375–20 942) | (20.64–37.13) | (‐0.33–0.27) | (1606–2463) | (4.14–6.31) | (2197–3983) | (16.49–27.08) | (‐0.16–0.49) | ||
| Yemen | 0.412 | 979 | 10.80 | 1336 | 10.61 | ‐0.02 | 792 | 17.69 | 1047 | 17.12 | ‐0.03 | 187 | 4.01 | 289 | 10.90 | 0.08 |
| (703–1412) | (7.75–15.53) | (912–1972) | (7.26–15.61) | (‐0.21–0.21) | (552–1167) | (12.37–26.05) | (681–1639) | (11.19–26.67) | (‐0.24–0.21) | (142–251) | (3.03–5.36) | (214–390) | (8.71–13.53) | (‐0.21–0.35) | ||
Abbreviations: CI, confidence interval; SDI, sociodemographic index; TBL, tracheal, bronchial and lung.
National comparison
Among Asian countries, 31 countries experienced a decreasing trend in the TBL cancer mortality rate between 2010 and 2019; the greatest increase was detected in Iraq (increase in ASDR = 0.21 [95% CI: 0.01–0.45]) and the greatest decrease was detected in the United Arab Emirates (decrease in ASDR = −0.18 [95% CI: −0.38–0.06]) (Figure 4).
In 2019, the highest ASDR (per 100 000) of TBL cancer was reported in Brunei Darussalam (44.83), China (38.7), Turkey (33.77), Mongolia (33.35), and Armenia (31.62). The lowest ASDR of TBL cancer was reported in Bangladesh (7.81), India (8.07), Bhutan (8.26), Nepal (8.62), and Saudi Arabia (9.14).
The national distribution of TBL cancer among men was the same as the overall distribution; however, men in Georgia had the second highest ASIR rate (61.47).
The national distribution of TBL cancer among women is different: the highest ASDR (per 100 000) of TBL cancer was reported in Brunei Darussalam (36.09), China (22.86), Taiwan (Province of China) (21.16), Lebanon (16.51), and Democratic People's Republic of Korea (16.34). The lowest ASDR (per 100 000) of TBL cancer was reported in Bangladesh (3.62), Yemen (4.34), Bhutan (4.5), Turkmenistan (4.55), and India (4.7). Detailed results are presented in Table 5.
Prevalence of TBL cancer in Asia
Compared with global data and continents
In Asia, the number of cases who lived with TBL cancer increased from 1 308 776 (95% CI: 1 225 459–1 392 332) in 2010 to 1 820 539 (95% CI: 1 605 530–2 034 496) in 2019, which is a 1.4‐fold increase. In 2019 approximately 57% (1 820 539/3 212 307) of TBL cancer prevalence happened in Asian countries. During this period, the ASPRof TBL cancer with a 4% change, increased from 36.35 (95% CI: 34.01–38.67) per 100 000 in 2010 to 37.81 (95% CI: 33.46–42.14) per 100 000 in 2019, while in the same time, this rate globally decreased by 2%, in America by 12%, and in Europe by 5% (Figure 1 and Table 1).
In Asian men, the number of TBL cancer prevalence increased from 928 147 (95% CI: 861 104–1 000 537) in 2010 to 1 257 715 (95% CI: 1 069 513–1 462 350) in 2019, which is over a 1.36‐fold increase. In 2019 approximately 69.1% of patients who lived with TBL cancer in Asia, were men which included 59.6% (1 257 715/2 109 409) of global male TBL cancer prevalence cases. During this period, the ASPR rate of TBL cancer with a 2% change, increased from 54.01 (95% CI: 50.08–58.12) per 100 000 in 2010 to 54.94 (95% CI: 46.96–63.32) per 100 000 in 2019, while in the same time, this rate globally decreased by 5%, in America by 11% and in Europe by 11% (Table 2).
In Asian women, the number of TBL cancer prevalence increased from 380 630 (95% CI: 349 763–411 327) in 2010 to 562 824 (95% CI: 480 164–653 889) in 2019, which is over a 1.48‐fold increase. In 2019 approximately 30.9% of patients who lived with TBL cancer in Asia, were women which included 51% (562 824/1 102 899) of global female TBL cancer prevalence cases. During this period, the ASPR of TBL cancer with a 10% change, increased from 20.43 (95% CI: 18.67–22.08) per 100 000 in 2010 to 22.49 (95% CI: 19.21–26.12) per 100 000 in 2019, while in the same time, this rate globally increased by 2%, in Africa by 14%, and in Europe by 5%; while in American countries decreased by 10% (Table 3).
Age distribution
In 2019, age‐specific prevalence cases of TBL cancer were peaking at 65–69 years generally, in males, and females. In all age groups, the prevalence cases of TBL cancer in males was higher than in females, except in ages above 95 years which in females was higher (Figure 6).
FIGURE 6.
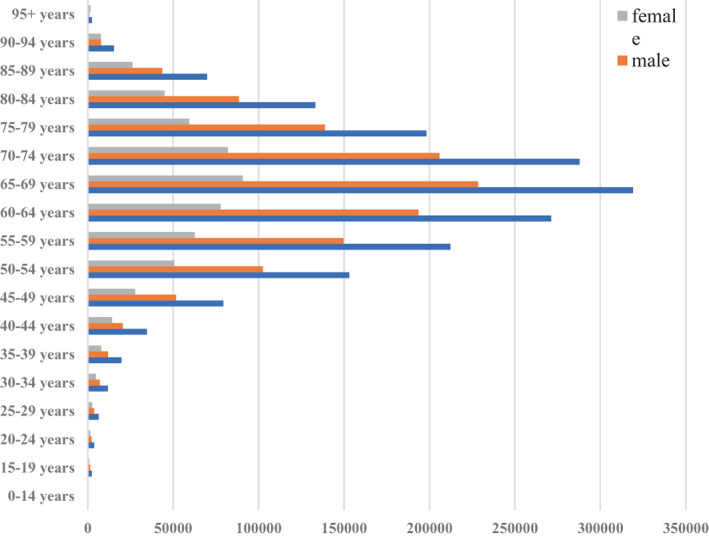
Age specific prevalence cases of TBL cancer among sexes in Asia, 2019.
Within Asian regions
In 2019, the highest ASPR of TBL was observed in high‐income Asia Pacific countries (74.32 [95% CI: 63.96–85.75]); with an 8% decrease compared with 2010. While these countries and Central Asia countries experienced a decreasing trend of 8% and 5%, respectively, other Asian countries experienced an increasing trend from 2010 to 2019 (by 3%–11%) (Figure 3).
In men, the highest ASPR of TBL was observed in High‐income Asia Pacific countries at (114.22 [95% CI: 95.69–135.71]); with an 11% decrease compared with 2010. While these countries, Central Asia, and North Africa and Middle East countries experienced a decreasing trend of 11, 7, and 3%, respectively, other Asian countries experienced an increasing trend from 2010 to 2019 (by 1%–9%) (Table 2).
In women, the highest ASPR of TBL was observed in high‐income Asia Pacific countries (40.86 [95% CI: 34.13–48.03]); with a 1% decrease compared with 2010. Other countries experienced an increasing trend from 2010 to 2019 (by 6%–33%). The highest increase was reported in South Asian countries (33%). (Table 3).
Based on SDI
Among high SDI Asian countries, the Republic of Korea (75.66) and Japan (74.49) had the highest ASPR of TBL, and Saudi Arabia (9.01) had the lowest rate. Among high‐middle SDI Asian countries, Turkey (34.95) and Georgia (34.83) had the highest ASPR of TBL, and Oman (9.74) had the lowest rate. Among middle SDI Asian countries, China (55.13) and Armenia (35.13) had the highest ASPR of TBL, and Turkmenistan (10.826) had the lowest rate. Among low‐middle SDI Asian countries, Mongolia (29.55) and the Democratic People's Republic of Korea (29.05) had the highest ASPR of TBL, and Bangladesh (7.40) had the lowest rate. Among low SDI Asian countries, Pakistan (16.44) had the highest ASPR of TBL, and Nepal (7.71) had the lowest rate. Further details are presented in Table 6.
TABLE 6.
The prevalence of TBL cancer in Asian countries in 2010 and 2019 and the temporal trends between 2010 and 2019, by geographical region and SDI.
| Both | Male | Female | ||||||||||||||
|---|---|---|---|---|---|---|---|---|---|---|---|---|---|---|---|---|
| 2010 | 2019 | % change 2010‐2010 | 2010 | 2019 | % change 2010‐2019 | 2010 | 2019 | % change 2010‐2019 | ||||||||
| Location | SDI 2019 | Number | ASR per 100 000 | Number | ASR per 100 000 | Number | ASR per 100 000 | Number | ASR per 100 000 | Number | ASR per 100 000 | Number | ASR per 100 000 | |||
| (95% CI) | (95% CI) | (95% CI) | (95% CI) | (95% CI) | (95% CI) | (95% CI) | (95% CI) | (95% CI) | (95% CI) | (95% CI) | (95% CI) | (95% CI) | (95% CI) | (95% CI) | ||
| High SDI | ||||||||||||||||
| Brunei Darussalam | 0.823 | 99 | 52.20 | 159 | 54.57 | 0.05 | 53 | 64.12 | 82 | 66.37 | 0.04 | 46 | 43.65 | 355 552 | 47.91 | 0.10 |
| (91–109) | (47.58–57.25) | (139–180) | (48.21–61.68) | (‐0.1–0.2) | (47–60) | (56.81–72.81) | (67–100) | (54.72–78.31) | (‐0.15–0.25) | (41–52) | (38.22–49.32) | (283 761–437 708) | (40.23–56.75) | (‐0.1–0.33) | ||
| Cyprus | 0.841 | 568 | 39.25 | 738 | 37.79 | ‐0.04 | 440 | 64.47 | 563 | 59.63 | ‐0.07 | 128 | 17.04 | 867 | 17.54 | 0.03 |
| (520–623) | (36.01–42.97) | (627–857) | (32.07–43.96) | (‐0.2–0.14) | (394–494) | (58.09–71.81) | (456–680) | (48.33–71.87) | (‐0.25–0.14) | (113–145) | (15.14–19.33) | (633–1147) | (14.41–21.44) | (‐0.17–0.26) | ||
| Israel | 0.803 | 2759 | 32.41 | 3480 | 31.44 | ‐0.03 | 1838 | 46.97 | 2277 | 44.02 | ‐0.06 | 921 | 19.86 | 153 | 20.29 | 0.02 |
| (2606–2927) | (30.62–34.39) | (2683–4484) | (24.12–40.59) | (‐0.26–0.25) | (1713–1977) | (43.77–50.44) | (1720–2947) | (33.08–56.83) | (‐0.29–0.23) | (846–1000) | (18.28–21.62) | (127–182) | (15.57–26.04) | (‐0.21–0.31) | ||
| Japan | 0.87 | 239 828 | 83.17 | 253 321 | 74.49 | ‐0.10 | 173 940 | 133.02 | 178 822 | 114.78 | ‐0.14 | 65 888 | 42.00 | 882 | 40.36 | ‐0.04 |
| (220 045–254 311) | (77.37–87.44) | (207 167–301 074) | (62.1–88.37) | (‐0.24–0.06) | (160 796–185 273) | (124.17–140.89) | (142 682–222 462) | (91.52–142.05) | (‐0.3–0.07) | (56 557–72 450) | (37.73–45.16) | (732–1039) | (32.04–49.65) | (‐0.21–0.17) | ||
| Kuwait | 0.851 | 140 | 10.05 | 259 | 10.32 | 0.03 | 100 | 11.92 | 181 | 12.72 | 0.07 | 40 | 6.93 | 1882 | 6.63 | ‐0.04 |
| (130–149) | (9.28–10.72) | (216–310) | (8.46–12.42) | (‐0.15–0.23) | (92–107) | (10.92–12.79) | (139–227) | (9.79–15.96) | (‐0.17–0.34) | (36–44) | (6.21–7.7) | (1457–2409) | (5.22–8.49) | (‐0.25–0.21) | ||
| Qatar | 0.83 | 83 | 20.42 | 153 | 17.54 | ‐0.14 | 68 | 23.84 | 120 | 18.97 | ‐0.20 | 15 | 13.06 | 74 499 | 13.47 | 0.03 |
| (67–102) | (16.78–24.68) | (107–213) | (13.23–22.69) | (‐0.36–0.14) | (52–86) | (18.86–29.61) | (81–174) | (14.08–25.29) | (‐0.43–0.09) | (12–19) | (10.4–16.04) | (56 948–92 097) | (10.35–16.86) | (‐0.19–0.28) | ||
| Republic of Korea | 0.878 | 45 010 | 71.02 | 68 345 | 75.66 | 0.07 | 31 756 | 117.33 | 47 936 | 118.34 | 0.01 | 13 254 | 37.40 | 1203 | 41.95 | 0.12 |
| (40 638–50 489) | (64.09–79.28) | (55 468–83 426) | (61.36–92.07) | (‐0.14–0.31) | (27 724–36 550) | (102.56–134.48) | (37 412–60 031) | (92.79–148.38) | (‐0.21–0.29) | (11 604–15 012) | (32.83–42.09) | (927–1536) | (33.8–50.7) | (‐0.09–0.38) | ||
| Saudi Arabia | 0.805 | 1156 | 8.97 | 1848 | 9.01 | 0.00 | 829 | 11.46 | 1239 | 10.62 | ‐0.07 | 327 | 5.54 | 609 | 6.53 | 0.18 |
| (1009–1359) | (8–10.18) | (1411–2305) | (7.13–10.91) | (‐0.2–0.21) | (725–981) | (10.24–13.39) | (928–1560) | (8.17–13.27) | (‐0.27–0.15) | (279–378) | (4.81–6.33) | (451–786) | (4.9–8.28) | (‐0.1–0.48) | ||
| Singapore | 0.861 | 3245 | 65.18 | 4818 | 61.39 | ‐0.06 | 2022 | 88.58 | 2936 | 78.05 | ‐0.12 | 1223 | 46.20 | 2247 | 46.90 | 0.02 |
| (2924–3587) | (58.54–72.18) | (3741–6168) | (48.02–78.24) | (‐0.26–0.2) | (1770–2314) | (77.32–101.94) | (2193–3842) | (58.72–101.45) | (‐0.33–0.14) | (1077–1384) | (40.58–52.49) | (1497–3209) | (36.25–59.99) | (‐0.21–0.29) | ||
| Taiwan (Province of China) | 0.868 | 14 224 | 46.92 | 16 026 | 40.73 | ‐0.13 | 8775 | 59.88 | 9654 | 52.09 | ‐0.13 | 5449 | 34.84 | 570 | 30.87 | ‐0.11 |
| (13 443–15 014) | (44.32–49.51) | (12 395–20 728) | (31.55–52.71) | (‐0.33–0.12) | (8230–9366) | (56.15–63.93) | (7375–12 486) | (39.87–66.95) | (‐0.34–0.13) | (4995–5896) | (31.93–37.68) | (382–817) | (24–40.24) | (‐0.31–0.15) | ||
| United Arab Emirates | 0.88 | 260 | 20.24 | 627 | 16.87 | ‐0.17 | 199 | 22.15 | 492 | 19.03 | ‐0.14 | 61 | 16.86 | 283 | 12.51 | ‐0.26 |
| (207–314) | (16.69–24.01) | (454–835) | (12.24–23.29) | (‐0.36–0.08) | (155–246) | (17.66–26.99) | (349–669) | (13.97–26.33) | (‐0.32–0.1) | (47–75) | (13.48–20.84) | (233–340) | (7.54–18.28) | (‐0.54–0.13) | ||
| High‐middle SDI | ||||||||||||||||
| Bahrain | 0.751 | 90 | 21.50 | 155 | 18.01 | ‐0.16 | 64 | 29.29 | 109 | 22.56 | ‐0.23 | 26 | 13.50 | 1649 | 12.83 | ‐0.05 |
| (79–101) | (19.05–24.08) | (117–205) | (13.69–22.9) | (‐0.34–0.05) | (55–74) | (25.45–33.36) | (79–152) | (16.86–29.66) | (‐0.42–0.01) | (22–30) | (11.69–15.61) | (1254–2116) | (10.19–15.62) | (‐0.24–0.15) | ||
| Georgia | 0.702 | 1802 | 32.75 | 1949 | 34.83 | 0.06 | 1527 | 63.97 | 1666 | 68.25 | 0.07 | 275 | 8.73 | 7808 | 8.96 | 0.03 |
| (1632–1969) | (29.65–35.86) | (1614–2329) | (28.85–41.54) | (‐0.14–0.3) | (1366–1689) | (57.15–70.75) | (1371–1996) | (56.18–81.57) | (‐0.14–0.31) | (248–306) | (7.86–9.71) | (5853–10 343) | (7.35–10.77) | (‐0.18–0.26) | ||
| Jordan | 0.731 | 522 | 14.97 | 1015 | 14.58 | ‐0.03 | 400 | 22.53 | 743 | 20.51 | ‐0.09 | 121 | 6.87 | 210 | 8.08 | 0.17 |
| (464–584) | (13.37–16.75) | (836–1233) | (12.05–17.57) | (‐0.21–0.18) | (349–459) | (19.73–25.71) | (571–943) | (15.91–25.81) | (‐0.3–0.16) | (104–140) | (5.9–7.96) | (166–264) | (6.35–10.25) | (‐0.07–0.48) | ||
| Kazakhstan | 0.723 | 4019 | 27.05 | 4337 | 23.34 | ‐0.14 | 3298 | 53.98 | 3455 | 44.44 | ‐0.18 | 721 | 8.37 | 406 | 8.47 | 0.01 |
| (3814–4251) | (25.66–28.49) | (3676–5019) | (19.84–26.85) | (‐0.27–0.01) | (3096–3536) | (50.82–57.63) | (2887–4068) | (37.5–51.78) | (‐0.31–‐0.04) | (681–768) | (7.92–8.91) | (252–594) | (7.05–9.98) | (‐0.17–0.2) | ||
| Lebanon | 0.708 | 1221 | 28.93 | 1577 | 30.40 | 0.05 | 815 | 40.36 | 920 | 39.26 | ‐0.03 | 406 | 18.48 | 657 | 23.13 | 0.25 |
| (1045–1542) | (24.76–36.28) | (1266–2051) | (24.38–39.49) | (‐0.12–0.24) | (675–1052) | (33.56–52.1) | (725–1213) | (30.94–51.72) | (‐0.19–0.16) | (336–515) | (15.29–23.43) | (477–898) | (16.79–31.66) | (‐0.06–0.56) | ||
| Malaysia | 0.737 | 4165 | 21.04 | 5544 | 20.20 | ‐0.04 | 2928 | 29.58 | 3896 | 28.42 | ‐0.04 | 1237 | 12.60 | 175 | 12.05 | ‐0.04 |
| (3815–4583) | (19.19–23.21) | (4258–7066) | (15.66–25.69) | (‐0.25–0.21) | (2660–3246) | (26.8–32.81) | (2979–4981) | (21.78–36.21) | (‐0.26–0.22) | (1118–1368) | (11.37–14.06) | (144–213) | (9.19–15.3) | (‐0.26–0.22) | ||
| Oman | 0.783 | 130 | 11.80 | 169 | 9.74 | ‐0.17 | 92 | 15.11 | 109 | 11.68 | ‐0.23 | 38 | 7.78 | 315 | 7.77 | 0.00 |
| (118–143) | (10.72–12.89) | (132–224) | (7.92–12.01) | (‐0.33–0.04) | (83–102) | (13.61–16.82) | (80–160) | (9.06–15.5) | (‐0.4–0.04) | (34–44) | (6.74–8.9) | (226–432) | (5.74–9.33) | (‐0.25–0.24) | ||
| Sri Lanka | 0.69 | 2170 | 10.63 | 2834 | 10.73 | 0.01 | 1604 | 17.10 | 1967 | 16.38 | ‐0.04 | 566 | 5.22 | 118 | 6.09 | 0.17 |
| (2037–2306) | (10–11.3) | (2039–3892) | (7.78–14.6) | (‐0.27–0.37) | (1481–1725) | (15.81–18.3) | (1359–2794) | (11.45–23.09) | (‐0.33–0.34) | (518–619) | (4.78–5.71) | (90–152) | (4.45–8.04) | (‐0.15–0.54) | ||
| Turkey | 0.748 | 24 613 | 35.56 | 31 740 | 34.95 | ‐0.02 | 20 625 | 62.65 | 25 592 | 59.00 | ‐0.06 | 3988 | 11.01 | 76 | 13.07 | 0.19 |
| (21 619–27 940) | (31.23–40.27) | (25 031–39 550) | (27.58–43.51) | (‐0.24–0.29) | (18 045–23 490) | (54.81–71.26) | (20 163–32 173) | (46.56–73.95) | (‐0.27–0.24) | (3478–4545) | (9.61–12.58) | (62–92) | (10.33–16.36) | (‐0.08–0.53) | ||
| Middle SDI | ||||||||||||||||
| Armenia | 0.689 | 1420 | 38.05 | 1490 | 35.13 | ‐0.08 | 1174 | 72.41 | 1227 | 66.05 | ‐0.09 | 246 | 11.65 | 6372 | 11.36 | ‐0.03 |
| (1357–1486) | (36.45–39.78) | (1240–1771) | (29.38–41.81) | (‐0.23–0.1) | (1116–1233) | (68.91–76) | (1018–1473) | (55–79.09) | (‐0.24–0.09) | (230–263) | (10.91–12.43) | (4949–8313) | (9.34–13.51) | (‐0.21–0.17) | ||
| Azerbaijan | 0.683 | 1956 | 24.88 | 2746 | 25.34 | 0.02 | 1577 | 43.69 | 2230 | 44.41 | 0.02 | 379 | 9.04 | 3039 | 9.42 | 0.04 |
| (1658–2237) | (21.13–28.3) | (2011–3522) | (18.71–32.12) | (‐0.18–0.26) | (1287–1849) | (35.73–51.1) | (1504–3000) | (30.16–58.78) | (‐0.22–0.31) | (329–441) | (7.78–10.43) | (2158–4033) | (7.32–12) | (‐0.18–0.32) | ||
| China | 0.686 | 761 233 | 49.44 | 1 137 880 | 55.13 | 0.12 | 534 950 | 71.85 | 782 328 | 79.00 | 0.10 | 226 282 | 28.91 | 273 | 33.69 | 0.17 |
| (693 273–835 137) | (45.12–54.12) | (950 548–1 344 733) | (46.21–64.95) | (‐0.09–0.34) | (475 301–600 750) | (64.16–80.29) | (606 195–970 479) | (61.77–97.4) | (‐0.14–0.41) | (200 660–252 832) | (25.66–32.31) | (193–392) | (26.89–41.45) | (‐0.08–0.47) | ||
| Indonesia | 0.66 | 36 236 | 20.76 | 50 234 | 22.23 | 0.07 | 24 946 | 30.21 | 34 308 | 31.89 | 0.06 | 11 290 | 12.27 | 8375 | 13.55 | 0.10 |
| (28 719–42 387) | (16.56–24.13) | (36 773–62 098) | (16.26–27.3) | (‐0.13–0.3) | (20 103–30 912) | (24.77–36.89) | (25 370–45 680) | (23.94–41.65) | (‐0.19–0.36) | (6970–16 045) | (7.6–17.29) | (6254–11 048) | (7.59–20.19) | (‐0.15–0.42) | ||
| Iran (Islamic Republic of) | 0.67 | 5867 | 10.58 | 9366 | 12.53 | 0.18 | 4071 | 14.81 | 6029 | 16.26 | 0.10 | 1796 | 6.32 | 142 | 8.84 | 0.40 |
| (5631–6141) | (10.1–11.08) | (8689–10 053) | (11.58–13.47) | (0.1–0.27) | (3887–4277) | (14.06–15.55) | (5484–6596) | (14.83–17.72) | (0.01–0.19) | (1704–1898) | (5.94–6.68) | (110–186) | (7.96–9.68) | (0.25–0.53) | ||
| Iraq | 0.671 | 2546 | 15.40 | 4484 | 18.76 | 0.22 | 1883 | 23.61 | 3125 | 27.36 | 0.16 | 664 | 7.54 | 20 410 | 10.70 | 0.42 |
| (1976–3165) | (12.07–18.97) | (3428–5629) | (14.44–23.11) | (0–0.48) | (1428–2390) | (18.02–29.65) | (2383–3910) | (20.93–33.27) | (‐0.06–0.46) | (501–862) | (5.76–9.73) | (16 337–24 713) | (8.13–13.75) | (0.11–0.84) | ||
| Philippines | 0.623 | 10 548 | 17.23 | 14 616 | 17.65 | 0.02 | 7667 | 26.95 | 10 100 | 26.23 | ‐0.03 | 2881 | 8.85 | 3165 | 10.34 | 0.17 |
| (9593–11 828) | (15.69–19.3) | (11 581–18 202) | (14.07–21.88) | (‐0.19–0.28) | (6777–8908) | (23.87–31.2) | (7602–13 221) | (19.91–34.02) | (‐0.3–0.28) | (2560–3274) | (7.87–10.02) | (2280–4193) | (7.66–13.54) | (‐0.15–0.59) | ||
| Syrian Arab Republic | 0.619 | 1303 | 11.86 | 1509 | 11.37 | ‐0.04 | 944 | 16.54 | 1052 | 15.43 | ‐0.07 | 360 | 6.73 | 6147 | 7.14 | 0.06 |
| (1064–1562) | (9.74–14.19) | (1100–2011) | (8.39–15.01) | (‐0.28–0.25) | (757–1162) | (13.27–20.34) | (759–1405) | (11.28–20.4) | (‐0.32–0.25) | (290–436) | (5.5–8.03) | (4867–7714) | (4.89–9.67) | (‐0.25–0.41) | ||
| Thailand | 0.687 | 19 013 | 25.39 | 24 361 | 23.76 | ‐0.06 | 12 622 | 36.50 | 15 986 | 33.82 | ‐0.07 | 6391 | 15.94 | 12 | 15.19 | ‐0.05 |
| (16 557–21 431) | (22.19–28.6) | (18 211–32 138) | (17.79–31.24) | (‐0.31–0.26) | (10 739–14 550) | (31.19–42.01) | (11 712–21 314) | (24.81–44.92) | (‐0.33–0.27) | (5578–7259) | (13.9–18.15) | (8–19) | (11.31–20.08) | (‐0.31–0.29) | ||
| Turkmenistan | 0.67 | 301 | 9.18 | 478 | 10.82 | 0.18 | 226 | 15.40 | 361 | 17.86 | 0.16 | 75 | 4.17 | 1359 | 5.06 | 0.21 |
| (285–316) | (8.68–9.69) | (376–606) | (8.57–13.61) | (‐0.07–0.49) | (211–240) | (14.45–16.38) | (279–461) | (13.98–22.45) | (‐0.09–0.47) | (68–82) | (3.78–4.6) | (1018–1763) | (3.92–6.45) | (‐0.05–0.53) | ||
| Uzbekistan | 0.631 | 2079 | 12.03 | 3247 | 13.26 | 0.10 | 1510 | 19.67 | 2321 | 21.02 | 0.07 | 569 | 5.95 | 27 010 | 7.10 | 0.19 |
| (1979–2184) | (11.48–12.6) | (2682–3914) | (11.04–15.75) | (‐0.08–0.31) | (1414–1608) | (18.51–20.86) | (1882–2825) | (17.42–25.08) | (‐0.12–0.28) | (536–606) | (5.6–6.33) | (20 873–33 809) | (5.9–8.47) | (‐0.02–0.44) | ||
| Vietnam | 0.617 | 18 774 | 26.15 | 28 987 | 28.89 | 0.11 | 13 812 | 44.07 | 21 179 | 47.41 | 0.08 | 4962 | 12.42 | 458 | 14.36 | 0.16 |
| (16 310–21 668) | (22.88–30.02) | (22 215–37 389) | (22.25–36.69) | (‐0.12–0.35) | (12 031–15 833) | (38.94–50.04) | (15 882–27 265) | (36.26–59.99) | (‐0.14–0.33) | (4043–6080) | (10.18–15.27) | (314–632) | (10.77–18.76) | (‐0.1–0.45) | ||
| Low‐middle SDI | ||||||||||||||||
| Bangladesh | 0.483 | 6760 | 7.45 | 9890 | 7.40 | ‐0.01 | 5531 | 11.41 | 7643 | 11.06 | ‐0.03 | 1229 | 2.84 | 7 | 3.43 | 0.21 |
| (4985–9276) | (5.55–10.1) | (6398–15 551) | (4.82–11.58) | (‐0.27–0.3) | (4064–7715) | (8.47–15.67) | (4841–12 420) | (7.05–17.81) | (‐0.32–0.3) | (857–1743) | (1.95–4.01) | (6–8) | (2.27–4.9) | (‐0.07–0.53) | ||
| Bhutan | 0.455 | 32 | 7.01 | 43 | 7.58 | 0.08 | 24 | 10.23 | 31 | 10.78 | 0.05 | 8 | 3.54 | 3388 | 4.23 | 0.20 |
| (24–42) | (5.3–9.16) | (31–60) | (5.44–10.45) | (‐0.1–0.3) | (16–33) | (6.84–13.92) | (20–45) | (6.92–15.38) | (‐0.13–0.28) | (5–13) | (2.29–5.85) | (2596–4487) | (2.82–6.66) | (‐0.02–0.5) | ||
| Cambodia | 0.469 | 1971 | 22.25 | 2962 | 23.96 | 0.08 | 1455 | 40.19 | 2137 | 42.08 | 0.05 | 516 | 9.79 | 15 925 | 11.46 | 0.17 |
| (1633–2416) | (18.43–27.5) | (2290–3681) | (18.86–29.67) | (‐0.11–0.28) | (1170–1825) | (32.6–51.57) | (1642–2702) | (32.44–53.93) | (‐0.14–0.26) | (418–635) | (8–12.06) | (8875–24 064) | (8.75–14.68) | (‐0.06–0.44) | ||
| Democratic People's Republic of Korea | 0.558 | 8127 | 29.44 | 9574 | 29.05 | ‐0.01 | 5595 | 49.09 | 6535 | 46.15 | ‐0.06 | 2532 | 16.01 | 47 | 16.48 | 0.03 |
| (6172–10 588) | (22.51–38.09) | (7289–12 305) | (22.14–37.09) | (‐0.16–0.16) | (3941–7719) | (35.39–66.33) | (4626–8930) | (33.51–61.61) | (‐0.21–0.12) | (1892–3212) | (12–20.27) | (33–67) | (11.68–22.04) | (‐0.18–0.27) | ||
| India | 0.566 | 60 661 | 6.82 | 90 058 | 7.63 | 0.12 | 45 985 | 10.53 | 63 048 | 10.95 | 0.04 | 14 676 | 3.25 | 4516 | 4.48 | 0.38 |
| (55 822–65 774) | (6.28–7.4) | (73 919–106 987) | (6.27–9.05) | (‐0.08–0.32) | (41 696–50 441) | (9.53–11.55) | (49 324–78 677) | (8.6–13.6) | (‐0.19–0.28) | (12 940–16 350) | (2.85–3.63) | (3333–5976) | (3.48–5.61) | (0.06–0.75) | ||
| Kyrgyzstan | 0.596 | 503 | 13.66 | 636 | 12.91 | ‐0.05 | 390 | 24.23 | 483 | 22.29 | ‐0.08 | 112 | 5.37 | 136 | 5.67 | 0.05 |
| (480–524) | (13.04–14.25) | (550–726) | (11.21–14.63) | (‐0.18–0.08) | (370–409) | (23.06–25.39) | (415–552) | (19.31–25.41) | (‐0.21–0.06) | (105–120) | (4.98–5.76) | (92–181) | (4.7–6.72) | (‐0.12–0.25) | ||
| Lao People's Democratic Republic | 0.49 | 732 | 21.23 | 1007 | 22.00 | 0.04 | 549 | 33.70 | 734 | 33.61 | 0.00 | 182 | 9.86 | 516 | 11.27 | 0.14 |
| (557–952) | (16.27–27.23) | (730–1330) | (16.25–28.49) | (‐0.16–0.27) | (404–737) | (25.05–45.08) | (525–963) | (24.54–43.13) | (‐0.2–0.24) | (137–258) | (7.58–13.9) | (396–657) | (8.1–16.21) | (‐0.09–0.4) | ||
| Maldives | 0.562 | 19 | 9.55 | 29 | 9.72 | 0.02 | 14 | 13.80 | 22 | 13.78 | 0.00 | 4 | 4.52 | 925 | 5.02 | 0.11 |
| (17–21) | (8.55–10.63) | (24–35) | (7.95–11.65) | (‐0.16–0.22) | (13–16) | (12.08–15.7) | (18–27) | (11.12–16.7) | (‐0.2–0.23) | (4–5) | (3.89–5.22) | (757–1123) | (4.03–6.19) | (‐0.11–0.38) | ||
| Mongolia | 0.606 | 446 | 28.88 | 691 | 29.55 | 0.02 | 354 | 52.33 | 549 | 54.16 | 0.03 | 92 | 11.31 | 263 | 11.58 | 0.02 |
| (368–535) | (23.89–34.11) | (532–911) | (23.23–38.17) | (‐0.19–0.3) | (288–429) | (43.3–62.07) | (405–733) | (40.88–70.52) | (‐0.2–0.33) | (75–113) | (9.3–13.77) | (216–312) | (9.1–14.83) | (‐0.21–0.3) | ||
| Myanmar | 0.521 | 8067 | 21.71 | 10 552 | 21.88 | 0.01 | 5616 | 34.02 | 7165 | 34.08 | 0.00 | 2451 | 11.87 | 78 | 12.56 | 0.06 |
| (5843–11 322) | (15.91–30.39) | (7740–14 581) | (16.11–29.98) | (‐0.18–0.25) | (3737–8825) | (22.84–53.25) | (5031–10 664) | (24.19–50.42) | (‐0.2–0.26) | (1918–3172) | (9.29–15.44) | (60–101) | (9.67–16.55) | (‐0.13–0.3) | ||
| Palestine | 0.588 | 333 | 18.77 | 568 | 22.43 | 0.20 | 259 | 32.36 | 435 | 36.28 | 0.12 | 74 | 7.45 | 3337 | 9.88 | 0.33 |
| (302–365) | (17.05–20.53) | (481–667) | (18.96–26.21) | (‐0.01–0.42) | (232–287) | (29.01–35.86) | (368–510) | (30.96–42.04) | (‐0.08–0.34) | (65–85) | (6.53–8.49) | (3012–3652) | (8.01–11.96) | (0.04–0.66) | ||
| Tajikistan | 0.539 | 529 | 13.10 | 665 | 11.93 | ‐0.09 | 389 | 19.76 | 455 | 17.39 | ‐0.12 | 140 | 6.65 | 59 | 6.96 | 0.05 |
| (458–611) | (11.24–15.21) | (532–838) | (9.67–14.81) | (‐0.28–0.16) | (330–455) | (16.62–23.22) | (358–584) | (13.86–22.12) | (‐0.32–0.13) | (121–163) | (5.73–7.73) | (43–72) | (5.58–8.72) | (‐0.18–0.34) | ||
| Timor‐Leste | 0.514 | 109 | 16.46 | 160 | 18.82 | 0.14 | 79 | 23.77 | 113 | 26.88 | 0.13 | 30 | 9.12 | 134 | 10.93 | 0.20 |
| (77–144) | (11.77–21.54) | (113–209) | (13.4–24.66) | (‐0.11–0.44) | (51–106) | (15.59–31.87) | (75–150) | (17.96–35.27) | (‐0.13–0.45) | (22–48) | (6.77–14.42) | (109–161) | (7.71–15.61) | (‐0.09–0.55) | ||
| Low SDI | ||||||||||||||||
| Afghanistan | 0.343 | 1112 | 11.06 | 1576 | 11.25 | 0.02 | 868 | 18.75 | 1170 | 18.26 | ‐0.03 | 245 | 4.22 | 825 | 5.05 | 0.20 |
| (610–1900) | (6.25–19.01) | (895–2505) | (6.78–17.88) | (‐0.17–0.3) | (441–1624) | (9.67–35.17) | (633–2054) | (10.39–31.65) | (‐0.21–0.26) | (163–360) | (2.97–6.03) | (626–1063) | (3.43–7.12) | (‐0.07–0.55) | ||
| Nepal | 0.422 | 1184 | 6.72 | 1764 | 7.71 | 0.15 | 839 | 9.64 | 1194 | 10.97 | 0.14 | 345 | 3.83 | 45 | 4.71 | 0.23 |
| (862–1570) | (4.92–8.88) | (1267–2294) | (5.53–9.98) | (‐0.1–0.43) | (613–1115) | (7.09–12.76) | (856–1545) | (7.94–14.04) | (‐0.11–0.41) | (220–516) | (2.42–5.77) | (35–56) | (3.16–6.76) | (‐0.03–0.6) | ||
| Pakistan | 0.449 | 15 392 | 17.22 | 19 632 | 16.44 | ‐0.05 | 13 304 | 28.50 | 16 467 | 26.68 | ‐0.06 | 2088 | 4.82 | 33 | 5.43 | 0.13 |
| (12 086–19 136) | (13.56–21.3) | (14 826–26 083) | (12.48–21.7) | (‐0.29–0.3) | (10 044–16 978) | (21.72–36.19) | (11 900–22 596) | (19.42–36.34) | (‐0.34–0.33) | (1631–2574) | (3.78–5.88) | (24–43) | (3.96–7.12) | (‐0.17–0.55) | ||
| Yemen | 0.412 | 977 | 9.72 | 1345 | 9.57 | ‐0.02 | 776 | 15.56 | 1030 | 15.12 | ‐0.03 | 201 | 3.81 | 271 | 4.18 | 0.10 |
| (695–1409) | (7–14) | (909–2008) | (6.56–14.22) | (‐0.21–0.22) | (535–1165) | (10.83–23.11) | (669–1639) | (9.8–23.75) | (‐0.24–0.23) | (149–274) | (2.88–5.11) | (210–348) | (3.08–5.65) | (‐0.2–0.39) | ||
Abbreviations: CI, confidence interval; DALYs, disability‐adjusted life‐years; SDI, sociodemographic index; TBL, tracheal, bronchial and lung.
National comparison
Among Asian countries, 22 countries experienced a decreasing trend in the TBL cancer mortality rate between 2010 and 2019; the greatest increase was detected in Iraq (increase in ASPR = 0.22 [95% CI: 0–0.48]) and the greatest decrease was detected in Oman (decrease in ASPR = −0.17 [95% CI: −0.33–0.04]) (Figure 4).
In 2019, the highest ASPR (per 100 000) of TBL cancer was reported in the Republic of Korea (75.66), Japan (74.49), Singapore (61.39), China (55.13), and Brunei Darussalam (54.57). The lowest ASPR of TBL cancer was reported in Bangladesh (7.4), Bhutan (7.58), India (7.63), Nepal (7.71), and Saudi Arabia (9.01).
In Asian men, the highest ASPR (per 100 000) of TBL cancer was reported among men Republic of Korea (118.34), Japan (114.78), China (79), Singapore (78.05), and Georgia (68.25). The lowest ASPR (per 100 000) of TBL cancer was reported in Saudi Arabia (10.62), Bhutan (10.78), India (10.95), Nepal (10.97), and Bangladesh (11.06).
In women, the highest ASPR (per 100 000) of TBL cancer was reported in Brunei Darussalam (47.91), Singapore (46.9), the Republic of Korea (41.95), Japan (40.36), and China (33.69). The lowest ASPR (per 100 000) of TBL cancer was reported in Bangladesh (3.43), Yemen (4.18), Bhutan (4.23), India (4.48), and Nepal (4.71). Detailed results are presented in Table 6.
Burden of TBL cancer in Asia
Comparison with global data and continents
In Asia, the number of TBL cancer DALYs increased from 21 516 974 (95% CI: 20 162 682–22 913 727) in 2010 to 27 120 537 (95% CI: 23 951 875–30 414 194) in 2019, which is a 1.26‐fold increase. In 2019 more than 59% (27 120 537/45 857 963) of TBL cancer DALYs happened in Asian countries. During this period, the age‐standardized DALYs rate (DALYs ASR) of TBL cancer with a 4% change, decreased from 579.16 (95% CI: 543.52–616.66) per 100 000 in 2010 to 553.68 (95% CI: 488.57–619.78) per 100 000 in 2019, in the same period, this rate globally decreased by 7%, in America by 11%, and in Europe by 510%, Africa by 1% (Figure 1 and Table 1).
In Asian men, the number of TBL cancer DALYs increased from 15 471 795 (95% CI: 14 340 748–16 696 371) in 2010 to 19 032 930 (95% CI: 16 188 395–21 991 610) in 2019, which is over a 1.23‐fold increase. In 2019 approximately 70.2% of TBL cancer DALYs in Asia, occurred in men which included 60.3% (19 032 930/31 582 258) of global male TBL cancer DALYs cases. During this period, the DALYs ASR rate of TBL cancer with a 7% change, decreased from 862.61 (95% CI: 800.85–929.03) per 100 000 in 2010 to 806.43 (95% CI: 688.15–928.33) per 100 000 in 2019, in the same period, this rate globally decreased by 10%, in America by 13%, in Europe by 14%, and Africa by 3% (Table 2).
In Asian women, the number of TBL cancer DALYs increased from 6 045 179 (95% CI: 5 551 988–6 575 776) in 2010 to 8 087 606 (95% CI: 6 962 536–9 358 865) in 2019, which is over a 1.34‐fold increase. In 2019, approximately 29.8% of DALYs related to TBL cancer in Asia were women which included 56.6% (8 087 606/14 275 706) of global female TBL cancer DALYs cases. During this period, the DALYs ASR rate of TBL cancer with a 1% change, increased from 316.95 (95% CI: 290.95–344.55) per 100 000 in 2010 to 321.18 (95% CI: 276.65–371.34) per 100 000 in 2019, while in the same time, this rate globally decreased by 1%, and in American countries decreased by 10%. European countries experienced a stable trend and African countries experienced an increasing trend of 11% (Table 3).
Age distribution
In 2019, age‐specific DALYs cases of TBL cancer peaked at 65–69 years generally, in males, and females. In all age groups, DALYs cases of TBL cancer in males were higher than in females, except in ages above 90 years which in females was higher (Figure 7).
FIGURE 7.
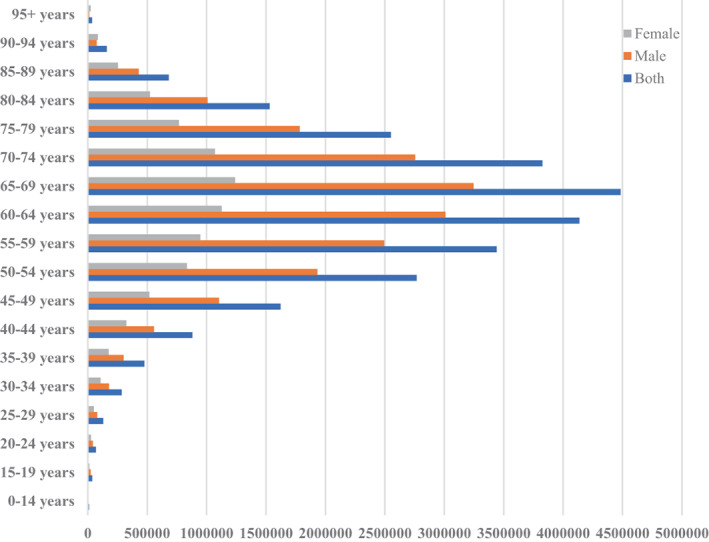
Age specific DALYs cases of TBL cancer among sexes in Asia, 2019.
Within Asian regions
In 2019, the highest DALYs ASR of TBL was observed in East Asian countries (825.81 [95% CI: 696.85–969.46]); with a 5% decrease compared with 2010. Southeast Asian countries experienced a stable trend and South Asian countries experienced an increasing trend of 5%; other Asian countries experienced a decreasing trend from 2010 to 2019 (by 1%–14%) (Figure 3 and Table 1).
In men, the highest DALYs ASR of TBL was observed in East Asian countries (1195.54 [95% CI: 949.99–1478.03]); with a 6% decrease compared with 2010. Also, other Asian countries experienced a decreasing trend from 2010 to 2019 (by 1%–18%). High‐income Asia Pacific countries experienced the highest decrease (Table 2).
In women, the highest DALYs ASR of TBL was observed in East Asian countries (489.73 [95% CI: 396.14–597.18]); with a 2% decrease compared with 2010. Also, high‐income Asia Pacific countries experienced a decreasing trend from 2010 to 2019 by 7%. Other Asian countries experienced an increasing trend from 2010 to 2019 (by 1%–30%). South Asian countries experienced the highest decrease (Table 3).
Based on SDI
In 2019, among high SDI Asian countries, Brunei Darussalam (867.69) and Taiwan (Province of China) (638.74) had the highest DALYs ASR of TBL, and Saudi Arabia (208.01) had the lowest rate. Among high‐middle SDI Asian countries, Georgia (828.59) and Turkey (814.58) had the highest DALYs ASR of TBL, and Oman (211.73) had the lowest rate. In middle SDI Asian countries, China (831.27) and Armenia (772.08) had the highest DALYs ASR of TBL, and Turkmenistan (265.85) had the lowest rate. Among low‐middle SDI Asian countries, Mongolia (727.67) and the Democratic People's Republic of Korea (712.30) had the highest ASPR of TBL, and Bangladesh (181.71) had the lowest rate.
Among low SDI Asian countries, Pakistan (425.72) had the highest DALYs ASR of TBL, and Nepal (195.08) had the lowest rate. More details are presented in Table 7.
TABLE 7.
The DALYs of TBL cancer in Asian countries in 2010 and 2019 and the temporal trends between 2010 and 2019, by geographical region and SDI.
| Both | Male | ||||||||||
|---|---|---|---|---|---|---|---|---|---|---|---|
| 2010 | 2019 | % change 2010–2010 | 2010 | 2019 | % change 2010‐2019 | ||||||
| Location | SDI 2019 | Number | ASR per 100 000 | Number | ASR per 100 000 | Number | ASR per 100 000 | Number | ASR per 100 000 | ||
| lower | (95% CI) | (95% CI) | (95% CI) | (95% CI) | (95% CI) | (95% CI) | (95% CI) | (95% CI) | (95% CI) | (95% CI) | |
| High SDI | |||||||||||
| Brunei Darussalam | 0.823 | 1736 | 881.93 | 2578 | 867.69 | ‐0.02 | 964 | 1117.64 | 1402 | 1086.94 | ‐0.03 |
| (1579–1914) | (806.29–967.48) | (2268–2923) | (768.53–975.37) | (‐0.14–0.13) | (852–1089) | (990.1–1251.24) | (1163–1666) | (917.83–1259.12) | (‐0.19–0.15) | ||
| Cyprus | 0.841 | 7851 | 543.85 | 9677 | 496.50 | ‐0.09 | 6146 | 905.87 | 7498 | 796.91 | ‐0.12 |
| (7365–8373) | (511.28–580.29) | (8511–10 948) | (437.29–562.21) | (‐0.2–0.03) | (5717–6629) | (844.61–975.76) | (6527–8559) | (695.12–911.42) | (‐0.24–0.01) | ||
| Israel | 0.803 | 45 045 | 530.55 | 52 637 | 478.11 | ‐0.10 | 30 992 | 792.34 | 35 769 | 694.47 | ‐0.12 |
| (43 220–46 601) | (509.75–548.41) | (49 095–55 907) | (446.69–507.47) | (‐0.16–‐0.04) | (29 743–32 194) | (761.06–823.47) | (33 302–38 347) | (646.72–745.22) | (‐0.18–‐0.06) | ||
| Japan | 0.87 | 1 354 942 | 475.84 | 1 347 365 | 408.04 | ‐0.14 | 1 005 355 | 778.59 | 966 169 | 638.55 | ‐0.18 |
| (1 244 988–1 409 971) | (445.3–491.42) | (1 211 168–1 426 790) | (378.67–427.43) | (‐0.17–‐0.12) | (945 825–1 037 352) | (737.05–801.79) | (890 896–1 017 886) | (595.3–669.43) | (‐0.21–‐0.15) | ||
| Kuwait | 0.851 | 3187 | 221.34 | 5541 | 214.80 | ‐0.03 | 2429 | 278.57 | 4263 | 287.61 | 0.03 |
| (2983–3386) | (205.84–235.27) | (4539–6683) | (174.68–260.68) | (‐0.21–0.18) | (2244–2610) | (257.37–298.19) | (3277–5348) | (222.72–360.28) | (‐0.19–0.3) | ||
| Qatar | 0.83 | 2037 | 457.40 | 3497 | 373.88 | ‐0.13 | 1742 | 555.43 | 2925 | 426.90 | ‐0.23 |
| (1638–2534) | (373.58–556.09) | (2442–4860) | (279.21–491.27) | (‐0.2–‐0.05) | (1339–2214) | (440.05–691.03) | (1985–4180) | (315.74–572.97) | (‐0.45–0.06) | ||
| Republic of Korea | 0.878 | 363 214 | 572.49 | 448 177 | 498.37 | ‐0.05 | 270 501 | 989.99 | 329 780 | 812.08 | ‐0.18 |
| (345 908–385 465) | (543.45–608.08) | (407 150–489 987) | (452.28–545.03) | (‐0.24–0.15) | (258 260–289 258) | (942.81–1057.22) | (295 922–365 420) | (726.93–896.9) | (‐0.26–‐0.09) | ||
| Saudi Arabia | 0.805 | 30 004 | 219.72 | 45 488 | 208.01 | ‐0.06 | 22 272 | 288.97 | 32 838 | 260.49 | ‐0.10 |
| (26 190–34 824) | (196.73–251.56) | (34 469–57 172) | (162.62–253.25) | (‐0.32–0.27) | (19 367–26 307) | (258.76–338.48) | (24 493–41 864) | (199.92–324.97) | (‐0.29–0.12) | ||
| Singapore | 0.861 | 25 678 | 508.08 | 32 008 | 406.24 | ‐0.05 | 17 179 | 732.85 | 20 883 | 549.33 | ‐0.25 |
| (24 501–26 642) | (481.56–527.39) | (29 533–34 271) | (373.24–435.04) | (‐0.29–0.24) | (16 388–17 912) | (694.31–763.13) | (19 024–22 407) | (499.22–590.64) | (‐0.32–‐0.19) | ||
| Taiwan (Province of China) | 0.868 | 201 116 | 663.19 | 250 042 | 638.74 | ‐0.11 | 130 642 | 889.24 | 156 142 | 847.27 | ‐0.05 |
| (191 569–208 015) | (630.62–686.06) | (195 264–323 024) | (500.04–824.72) | (‐0.35–0.2) | (124 689–135 612) | (847.68–923.17) | (122 385–204 204) | (665.16–1101.66) | (‐0.26–0.24) | ||
| United Arab Emirates | 0.88 | 7069 | 491.67 | 16 698 | 406.46 | 0.07 | 5564 | 549.42 | 13 406 | 468.70 | ‐0.15 |
| (5634–8636) | (404.44–584.94) | (12 066–22 166) | (295.09–559.14) | (‐0.11–0.27) | (4352–6903) | (438.29–669.67) | (9528–18 308) | (343.4–645.66) | (‐0.33–0.09) | ||
| High‐middle SDI | |||||||||||
| Bahrain | 0.751 | 2162 | 485.53 | 3546 | 392.08 | ‐0.19 | 1618 | 687.65 | 2677 | 518.94 | ‐0.25 |
| (1898–2450) | (429.2–542.66) | (2675–4751) | (294.96–503.78) | (‐0.37–0.02) | (1383–1865) | (596.79–783.11) | (1931–3710) | (386.88–684.76) | (‐0.43–‐0.01) | ||
| Georgia | 0.702 | 43 531 | 797.62 | 45 743 | 828.59 | 0.04 | 37 079 | 1556.10 | 39 358 | 1623.55 | 0.04 |
| (39 541–47 494) | (724.62–872.98) | (37 925–54 188) | (684.05–980.38) | (‐0.16–0.26) | (33 184–40 916) | (1385.03–1718.34) | (32 601–46 938) | (1343.63–1925.24) | (‐0.16–0.28) | ||
| Jordan | 0.731 | 12 952 | 360.35 | 24 231 | 338.02 | ‐0.06 | 10 217 | 556.96 | 18 653 | 497.83 | ‐0.11 |
| (11 485–14 706) | (321.08–405.56) | (19 817–29 413) | (276.61–409.77) | (‐0.25–0.14) | (8916–11 730) | (488.61–636.3) | (14 277–23 721) | (385.83–628.29) | (‐0.32–0.14) | ||
| Kazakhstan | 0.723 | 100 157 | 667.21 | 99 098 | 529.99 | ‐0.21 | 82 595 | 1331.23 | 79 489 | 1011.22 | ‐0.24 |
| (95 150–105 761) | (633.87–703.56) | (84 119–114 547) | (452.01–608.74) | (‐0.33–‐0.07) | (77 609–88 472) | (1252.99–1420.47) | (66 646–93 305) | (856.32–1179.95) | (‐0.36–‐0.11) | ||
| Lebanon | 0.708 | 27 614 | 653.49 | 32 712 | 629.57 | ‐0.04 | 19 893 | 985.74 | 21 762 | 926.00 | ‐0.06 |
| (23 464–34 891) | (555.91–825.18) | (26 403–42 585) | (507.29–817.1) | (‐0.19–0.13) | (16 580–25 367) | (824.21–1255.03) | (17 023–28 494) | (725.13–1215.38) | (‐0.21–0.11) | ||
| Malaysia | 0.737 | 99 296 | 492.31 | 125 454 | 452.95 | ‐0.08 | 70 051 | 694.58 | 88 682 | 640.66 | ‐0.08 |
| (91 031–108 913) | (449.62–541.33) | (95 772–158 721) | (349.01–573.29) | (‐0.29–0.16) | (63 605–77 170) | (630.74–767.54) | (67 490–113 258) | (490.41–816.72) | (‐0.29–0.17) | ||
| Oman | 0.783 | 3145 | 275.24 | 3876 | 211.73 | ‐0.06 | 2343 | 369.58 | 2755 | 274.30 | ‐0.26 |
| (2856–3450) | (250.81–302.08) | (3002–5245) | (170.66–267.77) | (‐0.3–0.27) | (2108–2612) | (332.63–411.06) | (2018–4078) | (211.84–366.38) | (‐0.42–0.01) | ||
| Sri Lanka | 0.69 | 50 700 | 246.24 | 61 125 | 231.39 | ‐0.04 | 37 667 | 397.26 | 42 870 | 355.96 | ‐0.10 |
| (47 614–53 917) | (231.9–261.63) | (44 055–83 501) | (167.54–315.61) | (‐0.25–0.24) | (34 739–40 500) | (368.42–425.46) | (29 685–60 571) | (248.38–498.89) | (‐0.37–0.25) | ||
| Turkey | 0.748 | 606 723 | 868.40 | 743 637 | 814.58 | 0.15 | 521 564 | 1564.61 | 625 682 | 1431.86 | ‐0.08 |
| (535 329–685 649) | (766.16–982.9) | (585 408–929 199) | (643.77–1017) | (‐0.1–0.45) | (455 485–593 194) | (1372.32–1780.42) | (493 490–787 341) | (1132.21–1796.08) | (‐0.3–0.2) | ||
| Middle SID | |||||||||||
| Armenia | 0.689 | 32 931 | 881.64 | 32 530 | 772.08 | ‐0.12 | 27 383 | 1679.98 | 26 989 | 1456.82 | ‐0.13 |
| (31 610–34 420) | (847.73–919.95) | (27 097–38 700) | (644.04–919.53) | (‐0.27–0.05) | (26 166–28 753) | (1607.69–1765.83) | (22 437–32 354) | (1215.4–1753.28) | (‐0.28–0.04) | ||
| Azerbaijan | 0.683 | 50 528 | 627.24 | 67 384 | 615.53 | ‐0.02 | 40 885 | 1103.50 | 55 020 | 1083.21 | ‐0.02 |
| (42 848–57 711) | (531.96–712.77) | (49 096–86 484) | (453.49–778.51) | (‐0.21–0.21) | (33 344–47 893) | (905.06–1286.31) | (37 056–73 911) | (739–1437.01) | (‐0.25–0.27) | ||
| China | 0.686 | 13 706 787 | 878.34 | 17 128 584 | 831.27 | ‐0.05 | 9 750 174 | 1285.67 | 11 967 767 | 1203.78 | ‐0.06 |
| (12 490 817–14 986 265) | (802.07–956.93) | (14 340 491–20 231 342) | (699.11–979.99) | (‐0.22–0.14) | (8 652 617–10 933 563) | (1148.32–1434.13) | (9 374 367–14 952 335) | (950.19–1495.1) | (‐0.27–0.19) | ||
| Indonesia | 0.66 | 951 020 | 531.75 | 1 279 981 | 555.79 | 0.05 | 652 011 | 771.88 | 872 361 | 795.96 | 0.03 |
| (768 970–1 118 598) | (432.67–622.97) | (927 626–1 596 040) | (404.21–685.35) | (‐0.15–0.26) | (522 694–808 743) | (627.82–940.17) | (632 434–1 170 979) | (584.55–1045.61) | (‐0.21–0.33) | ||
| Iran (Islamic Republic of) | 0.67 | 145 184 | 255.72 | 218 990 | 286.82 | 0.12 | 104 036 | 369.43 | 150 337 | 396.94 | 0.07 |
| (139 547–151 340) | (244.38–266.88) | (203 461–234 523) | (266.09–307.6) | (0.05–0.2) | (99 266–108 916) | (351.11–387.4) | (137 471–164 431) | (364.05–434.82) | (‐0.01–0.17) | ||
| Iraq | 0.671 | 66 028 | 388.14 | 110 712 | 451.59 | 0.16 | 49 430 | 600.79 | 79 463 | 675.57 | 0.12 |
| (51 003–82 497) | (303.02–480.89) | (84 178–139 887) | (346.04–557.52) | (‐0.05–0.42) | (37 525–62 971) | (458.88–759.13) | (60 517–100 726) | (516.66–825.13) | (‐0.09–0.41) | ||
| Philippines | 0.623 | 274 077 | 438.06 | 373 177 | 443.59 | ‐0.18 | 201 099 | 684.08 | 258 071 | 658.20 | ‐0.04 |
| (249 033–307 840) | (398.81–491.29) | (300 745–458 874) | (359.55–543.86) | (‐0.39–0.08) | (176 964–228 943) | (609.27–784.78) | (194 607–334 686) | (499.78–848.85) | (‐0.28–0.25) | ||
| Syrian Arab Republic | 0.619 | 32 840 | 289.91 | 36 951 | 274.37 | ‐0.10 | 24 536 | 418.24 | 26 803 | 389.30 | ‐0.07 |
| (26 864–39 516) | (236.81–347.76) | (26 937–49 538) | (202.98–363.54) | (‐0.3–0.14) | (19 591–30 237) | (335.64–513.89) | (19 320–36 087) | (283.36–517.06) | (‐0.32–0.25) | ||
| Thailand | 0.687 | 437 879 | 575.84 | 524 356 | 512.94 | 0.14 | 292 638 | 830.38 | 348 203 | 735.77 | ‐0.11 |
| (381 744–495 015) | (503.63–649.94) | (389 891–698 681) | (382.75–681.94) | (‐0.11–0.45) | (249 564–336 188) | (709.5–953.68) | (253 961–465 752) | (538.38–977.94) | (‐0.36–0.22) | ||
| Turkmenistan | 0.67 | 7793 | 232.03 | 11 915 | 265.85 | ‐0.17 | 5868 | 387.83 | 9035 | 438.57 | 0.13 |
| (7379–8188) | (220.21–244.35) | (9357–15 098) | (209.71–336.07) | (‐0.36–0.07) | (5479–6243) | (363.74–411.91) | (7009–11 546) | (343.74–552.56) | (‐0.12–0.44) | ||
| Uzbekistan | 0.631 | 53 638 | 300.38 | 80 570 | 320.85 | 0.05 | 38 995 | 490.90 | 57 824 | 510.33 | 0.04 |
| (51 091–56 334) | (286.41–314.34) | (66 295–96 841) | (266.53–380.72) | (‐0.16–0.28) | (36 607–41 509) | (462.79–520.87) | (47 028–70 213) | (421.64–610.42) | (‐0.15–0.26) | ||
| Vietnam | 0.617 | 468 294 | 639.58 | 676 894 | 668.83 | ‐0.20 | 347 144 | 1079.86 | 498 965 | 1102.40 | 0.02 |
| (40 6280–541 940) | (557.93–736.21) | (514 966–873 765) | (512.02–853.16) | (‐0.25–‐0.15) | (300 374–398 441) | (950.74–1229.85) | (374 943–644 026) | (837.95–1402.61) | (‐0.19–0.26) | ||
| Low‐middle SDI | |||||||||||
| Bangladesh | 0.483 | 175 070 | 188.69 | 245 789 | 181.71 | ‐0.04 | 142 318 | 288.19 | 188 736 | 271.23 | ‐0.06 |
| (128 455–241 803) | (139.99–257.39) | (158 426–385 218) | (117.75–284.34) | (‐0.29–0.26) | (103 834–198 827) | (212.87–398.06) | (119 496–309 965) | (172.15–441.53) | (‐0.34–0.26) | ||
| Bhutan | 0.455 | 814 | 175.54 | 1072 | 184.25 | 0.05 | 612 | 254.70 | 774 | 261.11 | 0.03 |
| (615–1067) | (132.78–230.05) | (764–1474) | (132.46–253.15) | (‐0.13–0.27) | (416–836) | (171.66–346.08) | (504–1094) | (167.93–370.95) | (‐0.16–0.24) | ||
| Cambodia | 0.469 | 52 251 | 579.09 | 76 026 | 606.82 | 0.05 | 38 540 | 1042.53 | 54 880 | 1062.37 | 0.02 |
| (43 259–63 797) | (482.12–712.77) | (58 767–94 334) | (473.95–750.69) | (‐0.14–0.25) | (30 944–48 299) | (846.07–1334.54) | (42 147–69 438) | (817.66–1358.8) | (‐0.17–0.23) | ||
| Democratic People's Republic of Korea | 0.558 | 205 141 | 735.45 | 235 437 | 712.30 | ‐0.03 | 141 800 | 1220.58 | 161 707 | 1126.86 | ‐0.08 |
| (15 4525–270 707) | (556.37–962.31) | (177 717–306 193) | (539.32–920.19) | (‐0.18–0.15) | (99 397–197 104) | (876.92–1666.88) | (113 816–221 451) | (815.69–1514.4) | (‐0.22–0.1) | ||
| India | 0.566 | 1 584 205 | 174.72 | 2 275 225 | 190.16 | 0.09 | 1 196 732 | 268.48 | 1 586 070 | 271.30 | 0.01 |
| (1 461 551–1 723 380) | (161.5–190.55) | (1 871 750–2 691 295) | (156.64–224.66) | (‐0.1–0.28) | (1 083 500–1 322 202) | (242.68–296.34) | (1 233 846–1 950 175) | (211.91–331.81) | (‐0.21–0.26) | ||
| Kyrgyzstan | 0.596 | 12 824 | 341.57 | 15 377 | 308.12 | ‐0.10 | 9999 | 606.25 | 11 721 | 532.34 | ‐0.12 |
| (12 251–13 377) | (326.42–356.36) | (13 279–17 539) | (266.83–350.84) | (‐0.22–0.03) | (9501–10 474) | (576.85–634.81) | (10 038–13 425) | (460.12–608.84) | (‐0.25–0.01) | ||
| Lao People's Democratic Republic | 0.49 | 19 739 | 559.56 | 26 518 | 566.50 | 0.01 | 14 738 | 883.09 | 19 216 | 861.29 | ‐0.02 |
| (14 969–25 758) | (428.19–720.42) | (19 142–35 092) | (418.1–736.93) | (‐0.18–0.24) | (10 766–19 870) | (657.67–1187.77) | (13 684–25 262) | (624.09–1112.8) | (‐0.22–0.21) | ||
| Maldives | 0.562 | 416 | 208.86 | 620 | 199.38 | ‐0.05 | 322 | 302.61 | 478 | 283.47 | ‐0.06 |
| (373–462) | (186.77–232.2) | (511–742) | (163.94–237.7) | (‐0.22–0.15) | (283–365) | (266.27–343.46) | (389–577) | (229.69–342) | (‐0.25–0.14) | ||
| Mongolia | 0.606 | 11 716 | 732.13 | 17 529 | 727.67 | ‐0.03 | 9349 | 1325.52 | 14 013 | 1335.28 | 0.01 |
| (9652–14 055) | (605.83–866.62) | (13 389–23 176) | (568.02–941.27) | (‐0.2–0.21) | (7605–11 305) | (1092.98–1580.67) | (10 355–18 720) | (1008.65–1737.42) | (‐0.22–0.3) | ||
| Myanmar | 0.521 | 216 064 | 570.40 | 271 546 | 556.09 | 0.13 | 150 353 | 892.47 | 184 512 | 864.98 | ‐0.03 |
| (156 726–309 983) | (419.32–806.31) | (199 769–374 583) | (409.15–761.85) | (‐0.12–0.41) | (99 360–240 211) | (598.49–1412.17) | (129 789–274 994) | (613.93–1280.98) | (‐0.22–0.23) | ||
| Palestine | 0.588 | 8584 | 469.81 | 14 203 | 546.36 | 0.01 | 6760 | 814.71 | 11 162 | 901.55 | 0.11 |
| (7778–9410) | (426.36–513.68) | (12 043–16 667) | (462.77–639.36) | (‐0.19–0.24) | (6054–7507) | (731.68–903.57) | (9466–13 136) | (768.02–1046.3) | (‐0.09–0.33) | ||
| Tajikistan | 0.539 | 14 017 | 335.26 | 17 302 | 300.28 | ‐0.01 | 10 326 | 505.89 | 11 831 | 436.74 | ‐0.14 |
| (12 126–16 132) | (288.52–387.58) | (13 763–21 772) | (243.87–374.01) | (‐0.22–0.27) | (8779–12 028) | (428.03–593.24) | (9318–15 154) | (347–555.17) | (‐0.34–0.11) | ||
| Timor‐Leste | 0.514 | 2822 | 421.11 | 4104 | 479.52 | ‐0.06 | 2027 | 606.06 | 2894 | 682.80 | 0.13 |
| (1958–3735) | (297.78–553.99) | (2888–5397) | (341.33–629.51) | (‐0.27–0.23) | (1311–2748) | (395.2–815.78) | (1898–3902) | (456.42–904.17) | (‐0.13–0.45) | ||
| Low SDI | |||||||||||
| Afghanistan | 0.343 | 31 563 | 299.90 | 44 553 | 302.57 | 0.01 | 24 344 | 504.01 | 32 821 | 485.96 | ‐0.04 |
| (17 036–53 762) | (167.68–511.88) | (25 083–71 319) | (179.92–481.25) | (‐0.18–0.3) | (12 063–45 437) | (257.6–947.67) | (17 512–57 862) | (274.05–844.56) | (‐0.21–0.25) | ||
| Nepal | 0.422 | 30 976 | 172.98 | 45 196 | 195.08 | ‐0.23 | 21 828 | 247.11 | 30 434 | 277.16 | 0.12 |
| (22 476–41 114) | (126.4–228.16) | (32 343–59 231) | (139.51–253.47) | (‐0.38–0) | (15 924–29 084) | (181.42–327.39) | (21 678–39 516) | (198.22–357.17) | (‐0.13–0.39) | ||
| Pakistan | 0.449 | 416 861 | 453.80 | 522 648 | 425.72 | 0.16 | 359 222 | 749.59 | 436 968 | 689.89 | ‐0.08 |
| (321 808–524 148) | (350.78–567.63) | (400 317–680 663) | (327.1–550.78) | (‐0.04–0.38) | (267 008–467 611) | (559.17–968.14) | (318 323–591 600) | (504.54–928) | (‐0.35–0.3) | ||
| Yemen | 0.412 | 26 197 | 253.64 | 36 208 | 248.83 | ‐0.02 | 20 790 | 405.89 | 27 748 | 393.94 | ‐0.03 |
| (18 556–37 800) | (182.15–366.57) | (24 430–53 799) | (169.31–368.91) | (‐0.21–0.22) | (14 324–31 221) | (281.88–605.7) | (17 997–44 272) | (254.61–622.7) | (‐0.24–0.22) | ||
| Female | ||||||
|---|---|---|---|---|---|---|
| 2010 | 2019 | % change 2010–2019 | ||||
| Location | SDI 2019 | Number | ASR per 100 000 | Number | ASR per 100 000 | |
| lower | (95% CI) | (95% CI) | (95% CI) | (95% CI) | (95% CI) | |
| High SDI | ||||||
| Brunei Darussalam | 0.823 | 772 | 706.37 | 1176 | 730.80 | 0.03 |
| (688–860) | (632.31–784.18) | (980–1385) | (618.67–850.63) | (‐0.13–0.21) | ||
| Cyprus | 0.841 | 1705 | 227.50 | 2178 | 219.18 | ‐0.04 |
| (1557–1871) | (208.32–250.03) | (1844–2524) | (186.62–253.94) | (‐0.19–0.12) | ||
| Israel | 0.803 | 14 052 | 304.03 | 16 867 | 285.32 | ‐0.06 |
| (13 208–14 792) | (286.9–319.84) | (15 241–18 355) | (258.62–310.37) | (‐0.14–0.03) | ||
| Japan | 0.87 | 349 587 | 225.99 | 381 197 | 210.56 | ‐0.07 |
| (300 800–376 526) | (203.81–238.07) | (315 576–418 629) | (186.69–225.92) | (‐0.11–‐0.03) | ||
| Kuwait | 0.851 | 758 | 125.97 | 1278 | 104.23 | ‐0.17 |
| (688–827) | (113.8–137.54) | (989–1618) | (82.26–130.24) | (‐0.34–0.03) | ||
| Qatar | 0.83 | 295 | 241.22 | 572 | 220.52 | ‐0.09 |
| (233–366) | (193.55–293.68) | (421–734) | (170.71–275.17) | (‐0.27–0.13) | ||
| Republic of Korea | 0.878 | 92 714 | 263.26 | 118 396 | 245.25 | ‐0.07 |
| (85 603–98 182) | (242.92–278.73) | (104 054–131 119) | (216.78–270.42) | (‐0.15–0.02) | ||
| Saudi Arabia | 0.805 | 7733 | 123.21 | 12 650 | 127.19 | 0.03 |
| (6645–8978) | (107.08–140.84) | (9344–16 468) | (95.79–162.81) | (‐0.2–0.31) | ||
| Singapore | 0.861 | 8499 | 318.79 | 11 125 | 277.03 | ‐0.13 |
| (7891–9022) | (295.34–338.85) | (9748–12 390) | (242.91–308.51) | (‐0.22–‐0.04) | ||
| Taiwan (Province of China) | 0.868 | 70 474 | 451.64 | 93 900 | 457.18 | 0.01 |
| (65 968–73 910) | (421.7–473.69) | (73 474–120 865) | (355.86–591.97) | (‐0.21–0.31) | ||
| United Arab Emirates | 0.88 | 1505 | 383.78 | 3292 | 274.87 | ‐0.28 |
| (1167–1859) | (305.93–468.78) | (2254–4366) | (164.71–396.5) | (‐0.54–0.08) | ||
| High‐middle SDI | ||||||
| Bahrain | 0.751 | 544 | 272.77 | 869 | 238.46 | ‐0.13 |
| (472–629) | (237.79–315.2) | (682–1070) | (189.98–289.87) | (‐0.3–0.06) | ||
| Georgia | 0.702 | 6452 | 208.47 | 6385 | 207.18 | ‐0.01 |
| (5824–7120) | (187.61–230.63) | (5261–7673) | (170.33–250.11) | (‐0.2–0.23) | ||
| Jordan | 0.731 | 2735 | 149.93 | 5578 | 161.92 | 0.08 |
| (2345–3161) | (128.73–173.63) | (4366–7137) | (128.25–205.65) | (‐0.15–0.37) | ||
| Kazakhstan | 0.723 | 17 562 | 202.47 | 19 608 | 187.71 | ‐0.07 |
| (16 578–18 646) | (191.3–214.83) | (16 256–23 097) | (156.51–220.87) | (‐0.24–0.1) | ||
| Lebanon | 0.708 | 7722 | 350.95 | 10 949 | 384.97 | 0.10 |
| (6511–9720) | (296.83–442.46) | (8038–14 776) | (281.37–520.49) | (‐0.16–0.34) | ||
| Malaysia | 0.737 | 29 244 | 291.69 | 36 772 | 266.48 | ‐0.09 |
| (26 440–32 255) | (263.54–322.87) | (28 061–47 106) | (203.45–339.35) | (‐0.29–0.16) | ||
| Oman | 0.783 | 803 | 157.82 | 1121 | 141.83 | ‐0.10 |
| (704–913) | (137.42–180.41) | (800–1377) | (104.09–169.59) | (‐0.33–0.12) | ||
| Sri Lanka | 0.69 | 13 033 | 119.16 | 18 254 | 128.58 | 0.08 |
| (11 992–14 229) | (109.67–129.9) | (13 292–24 267) | (94.22–170.76) | (‐0.21–0.43) | ||
| Turkey | 0.748 | 85 158 | 233.33 | 117 955 | 250.26 | 0.07 |
| (74 588–96 867) | (204.61–265.97) | (93 375–146 975) | (198.42–311.87) | (‐0.17–0.4) | ||
| Middle SID | ||||||
| Armenia | 0.689 | 5548 | 263.73 | 5540 | 242.58 | ‐0.08 |
| (5221–5921) | (247.62–281.46) | (4557–6581) | (198.59–288.26) | (‐0.25–0.11) | ||
| Azerbaijan | 0.683 | 9643 | 223.93 | 12 364 | 222.46 | ‐0.01 |
| (8400–11 193) | (194.18–258.94) | (9432–15 634) | (172.67–281.07) | (‐0.22–0.26) | ||
| China | 0.686 | 3 956 613 | 500.77 | 5 160 817 | 492.17 | ‐0.02 |
| (3 524 734–4 404 296) | (444.94–556.06) | (4 138 835–6 353 139) | (393.74–604.27) | (‐0.23–0.23) | ||
| Indonesia | 0.66 | 299 009 | 315.66 | 407 620 | 339.17 | 0.07 |
| (182 599–424 669) | (194.98–443.91) | (226 898–623 490) | (189.97–516.37) | (‐0.17–0.39) | ||
| Iran (Islamic Republic of) | 0.67 | 41 148 | 141.32 | 68 653 | 178.15 | 0.26 |
| (39 261–43 163) | (134.22–148.3) | (62 555–74 042) | (161.41–192.43) | (0.13–0.37) | ||
| Iraq | 0.671 | 16 598 | 183.06 | 31 249 | 239.59 | 0.31 |
| (12 447–21 665) | (138.93–236.13) | (23 269–41 007) | (181.03–307.77) | (0.02–0.7) | ||
| Philippines | 0.623 | 74 977 | 224.83 | 115 106 | 259.58 | 0.15 |
| (66 626–84 617) | (200.27–253.9) | (86 753–150 100) | (197.49–336.23) | (‐0.15–0.55) | ||
| Syrian Arab Republic | 0.619 | 8304 | 149.22 | 10 148 | 155.27 | 0.04 |
| (6706–10 155) | (121.78–178.86) | (6956–13 953) | (106.32–210.2) | (‐0.25–0.4) | ||
| Thailand | 0.687 | 145 242 | 357.80 | 176 154 | 321.69 | ‐0.10 |
| (126 649–165 290) | (312.22–406.92) | (131 468–234 593) | (238.79–427.89) | (‐0.36–0.21) | ||
| Turkmenistan | 0.67 | 1925 | 104.73 | 2880 | 122.63 | 0.17 |
| (1737–2120) | (94.93–115.65) | (2203–3719) | (94.53–158.09) | (‐0.09–0.48) | ||
| Uzbekistan | 0.631 | 14 642 | 147.49 | 22 746 | 169.49 | 0.15 |
| (13 757–15 641) | (139.11–156.73) | (18 516–27 581) | (140.38–203.1) | (‐0.06–0.39) | ||
| Vietnam | 0.617 | 121 151 | 298.72 | 177 929 | 325.27 | 0.09 |
| (98 246–148 007) | (243.31–366.61) | (133 317–235 275) | (245.25–426.63) | (‐0.15–0.37) | ||
| Low‐middle SDI | ||||||
| Bangladesh | 0.483 | 32 752 | 73.08 | 57 053 | 85.35 | 0.17 |
| (22 955–46 303) | (50.63–103.78) | (38 132–81 434) | (56.79–121.16) | (‐0.11–0.48) | ||
| Bhutan | 0.455 | 202 | 89.76 | 297 | 103.59 | 0.15 |
| (130–335) | (58.16–148.43) | (194–475) | (68.51–165.05) | (‐0.06–0.45) | ||
| Cambodia | 0.469 | 13 712 | 255.02 | 21 146 | 290.69 | 0.14 |
| (11 060–16 856) | (208.3–313.1) | (16 089–27 193) | (222–372.55) | (‐0.08–0.4) | ||
| Democratic People's Republic of Korea | 0.558 | 63 341 | 399.33 | 73 730 | 403.09 | 0.01 |
| (46 751–80 830) | (295.05–507.97) | (52 217–98 877) | (281.86–545.06) | (‐0.2–0.25) | ||
| India | 0.566 | 387 473 | 83.99 | 689 155 | 112.92 | 0.34 |
| (337 962–432 534) | (73.01–93.81) | (533 934–873 541) | (87.71–142.75) | (0.02–0.71) | ||
| Kyrgyzstan | 0.596 | 2825 | 132.57 | 3656 | 133.43 | 0.01 |
| (2631–3014) | (123.23–141.85) | (3012–4338) | (110.79–157.91) | (‐0.17–0.19) | ||
| Lao People's Democratic Republic | 0.49 | 5000 | 262.98 | 7302 | 292.87 | 0.11 |
| (3744–7061) | (200.26–370.62) | (5148–10 478) | (208.9–416.89) | (‐0.11–0.37) | ||
| Maldives | 0.562 | 94 | 98.29 | 142 | 101.31 | 0.03 |
| (81–107) | (84.75–112.82) | (114–174) | (81.22–123.74) | (‐0.17–0.28) | ||
| Mongolia | 0.606 | 2366 | 279.40 | 3517 | 277.36 | ‐0.01 |
| (1928–2906) | (228.98–340.45) | (2711–4617) | (216.31–357.36) | (‐0.23–0.26) | ||
| Myanmar | 0.521 | 65 711 | 311.66 | 87 034 | 318.70 | 0.02 |
| (51 120–84 000) | (241.54–396.25) | (66 622–115 527) | (245.68–419.49) | (‐0.17–0.26) | ||
| Palestine | 0.588 | 1824 | 178.40 | 3042 | 219.65 | 0.23 |
| (1606–2076) | (156.62–203.01) | (2491–3666) | (178.84–265.01) | (‐0.03–0.54) | ||
| Tajikistan | 0.539 | 3691 | 169.53 | 5470 | 175.30 | 0.03 |
| (3184–4273) | (146.33–196.93) | (4327–6888) | (141.02–219.76) | (‐0.19–0.33) | ||
| Timor‐Leste | 0.514 | 795 | 235.30 | 1210 | 280.22 | 0.19 |
| (566–1252) | (171.45–374.02) | (840–1736) | (196.83–400.22) | (‐0.1–0.54) | ||
| Low SDI | ||||||
| Afghanistan | 0.343 | 7220 | 118.35 | 11 732 | 139.69 | 0.18 |
| (4658–10 796) | (81.42–170.34) | (7195–17 414) | (92.77–198.61) | (‐0.09–0.51) | ||
| Nepal | 0.422 | 9148 | 99.40 | 14 762 | 119.79 | 0.21 |
| (5909–13 668) | (62.82–149.13) | (9894–21 002) | (80.4–171.49) | (‐0.06–0.57) | ||
| Pakistan | 0.449 | 57 638 | 128.42 | 85 679 | 141.81 | 0.10 |
| (45 789–71 940) | (102.3–158.25) | (62 126–114 158) | (104.07–189.04) | (‐0.18–0.51) | ||
| Yemen | 0.412 | 5407 | 98.81 | 8460 | 107.43 | 0.09 |
| (3996–7443) | (74.26–132.27) | (5985–11 599) | (78.67–145.39) | (‐0.2–0.38) | ||
Abbreviations: CI, confidence interval; DALYs, disability‐adjusted life‐years; SDI, sociodemographic index; TBL, tracheal, bronchial and lung.
National comparison
Among Asian countries, 33 countries experienced a decreasing trend in the TBL cancer DALYs ASR between 2010 and 2019; the greatest increase was detected in Iraq (increase in DALYs ASR = 0.16 [95% CI: −0.05–0.42]) and the greatest decrease was detected in Oman (decrease in DALYs ASR = −0.23 [95% CI: −0.38–0]) (Figure 4).
In 2019, the highest DALYs ASR (per 100 000) of TBL cancer was reported in Brunei Darussalam (867.69), China (831.27), Georgia (828.59), Turkey (814.58), and Armenia (772.08). The lowest DALYs ASR of TBL cancer was reported in Bangladesh (181.71), Bhutan (184.25), India (190.16), Nepal (195.08), and Maldives (199.38).
In Asian men, the highest DALYs ASR (per 100 000) of TBL cancer was reported in Georgia (1623.55), Armenia (1456.82), Turkey (1431.86), Mongolia (1335.28), and China (1203.78). The lowest DALYs ASR (per 100 000) of TBL cancer was reported in Saudi Arabia (260.49), Bhutan (261.11), Bangladesh (271.23), India (271.3), and Oman (274.3).
In women, the highest DALYs ASR (per 100 000) of TBL cancer was reported in Brunei Darussalam (730.8), China (492.17), Taiwan (Province of China) (457.18), Democratic People's Republic of Korea (403.09), and Lebanon (384.97). The lowest DALYs ASR (per 100 000) of TBL cancer was reported in Bangladesh (85.35), Maldives (101.31), Bhutan (103.59), Kuwait (104.23), and Yemen (107.43). Detailed results are presented in Table 7.
DISCUSSION
In this study, temporal trends of TBL cancer were estimated in 49 Asian countries and territories by geographical region and SDI and compared with the global data between 2010 and 2019. This study is the first in which calculated temporal trends of TBL cancer were estimated in Asian countries. The results showed that from 2010 to 2019 in the total population there was an over 1.34‐fold increase in the number of TBL cancer incidences. Also, ASIR, ASDR, and ASPR decreased while the age‐standardized DALY rate increased.
In 2019, more than half of TBL cancer cases (58%) occurred in Asian countries. However, during this period, the ASIR of TBL decreased by 1%. Also, the results of the study show that the number of TBL cancer increased more in women than in men so the number of TBL cancer cases in men increased 1.3‐fold and in women 1.42‐fold from 2010 to 2019. In men, the age group of 65–69 years had the higher number of TBL cancer, while in women, this number was greater in the age group of 70–74 years. Also, the ASIR decreased in men by 3% but in women increased by 5%.
In this period, ASIR decreased globally, in America and Europe in men but this index increased globally, in Europe, and Africa, and decreased in America in women.
The main risk factor is tobacco smoking; however, genetic sensitivity, unhealthy eating, occupational exposure, air pollution, chronic bronchitis, emphysema, tuberculosis, pneumonia, asthma, and environmental carcinogens (arsenic, asbestos, and radon) are other risk factors that can act independently, or together, with smoking. 30 , 31 Another study in Europe showed that lung cancer rates were increasing in female smokers but decreasing in male smokers over time. 32 Other studies reported that women who are heavy smokers had a higher risk of lung cancer than men. 33 , 34 It has also been found that sex hormones can be associated with lung cancer. 35 However, gender differences are important and must be considered. For lung cancer, behavioral factors such as smoking and gender‐related factors such as genetic susceptibility, exposure to sex hormones and molecular characteristics may increase a woman's susceptibility. 36 , 37 , 38
One of the modifiable risk factors is cigarette smoking and quitting smoking can reduce the risk of lung cancer by up to 50% in 10 years. 39 Because TBL cancer risk factors have various distributions in different geographical areas, for the prevention of TBL cancer, first we must not only know the geographic and temporal patterns of lung cancer incidence and mortality but also the risk factors. Research on the risk factors must be done in different areas to focus intervention programs on dominant and important risk factors in each area. Since smoking is the most important risk factor for lung cancer, for effective prevention and management of lung cancer, the determination of the risk factors in smokers and nonsmokers should be a useful action. On the other hand, education, tax increase, and government legislation, such as prohibiting smoking and introducing packaging for cigarettes, can achieve better outcomes. 40
In 2019, the highest ASIR (per 100 000) of TBL cancer was reported in Brunei Darussalam, China, the Republic of Korea, Turkey, and Taiwan. The lowest ASIR of TBL cancer was reported in Bangladesh, India, Bhutan, Nepal, and Saudi Arabia. Deng et al. showed that the incident cases, deaths, and DALYs of TBL cancer in China growth ranged from 140% to 240%. 41
According to the results in men and women, the highest number of TBL cancer deaths was in the age group of 70 to 74 years. The results of the study also showed that the number of TBL cancer deaths was higher in men than in women (1.28‐fold vs. 1.4‐fold). However, ASDR of TBL cancer in women increased by 2% but decreased in men by 6% from 2010 to 2019. Also in 2019, ASDR of TBL cancer in men was higher than in women. In the meantime, ASDR decreased globally, in America and Europe in men while this index was globally stable in women, but increased in Europe and Africa, and decreased in America. Zang et al. showed that at all levels of cigarette smoke exposure, women are consistently at a greater risk for developing major types of lung cancer than men. 42 This difference between men and women is probably due to the greater susceptibility of women to tobacco carcinogens. 43 Other studies in developed countries consistent with this study showed that lung cancer mortality has increased rapidly in women, while it has remained constant or decreased in men. 44 , 45 It should be noted that the risks and pathophysiology of lung cancer in nonsmoker women are different compared to nonsmoker men. In Asia, 60%–80% of women with lung cancer have never smoked, while 10%–15% of men with lung cancer have never smoked. 46 , 47
In this study, the prevalence of TBL cancer was also assessed. According to the results, from 2010 to 2019 the prevalence of TBL cancer increased in men by 1.36‐fold and women by 1.36‐fold. In 2019, the prevalence of TBL cancer was approximately 57% in Asian countries. During this period, the ASPR of TBL cancer increased by 4% in men. This increase was higher (10%) in women. Also, in this period in men, ASPR decreased globally, in America and Europe and in women, this index increased globally, in Africa, and Europe; while decreasing in American countries. As the ASIR decreased in men and increased in women within this period, the ASPR increased more in women than in men (10% vs. 2%). However, there is no information about the duration of TBL cancer in men and women. In the meantime, the survival rate of TBL cancer should also be considered. Cao et al. showed that the survival rate of lung cancer is higher in women (47.3% vs. men 29.3%). 48 Therefore, the higher survival rate of TBL cancer in women may be one of the reasons for the increased ASPR in this group.
The results showed that in this period, the number of DALY of TBL cancer in men and women increased 1.23‐ and 1.34‐fold, respectively. However, the age‐standardized DALY rate in men decreased by 7% and in women increased by 1%. In men, the age‐standardized DALY rate decreased globally, in America, Europe, and Africa and women this index decreased globally and in America, but increased in Africa and was stable in Europe. Other studies showed that due to the improvement of lung cancer treatment worldwide, the age‐standardized DALY rate of TBL cancer decreased in men and women. 49 , 50 TBL cancer is still considered an important public health burden as the survival rate of this cancer is quite poor. 51 As a consequence, early screening and detection have a major role in decreasing TBL mortality. 52 , 53 According to the American Cancer Society recommendations, for people aged 55–74, low‐dose helical computed tomography (LDCT) should be done for the annual screening of lung cancer. As shown by screening programs, the incidence and mortality of lung cancer have significantly decreased. 54 , 55 Due to differences in equipment, resources, and skill of personnel, early detection rates differ, and to improve the detection rate, skilled personnel as well as the latest tools and equipment must be used.
In conclusion, most of the global burden of lung cancer occurs in Asian countries, and the decreasing trend of incidence, death, prevalence, and burden of this cancer in these countries is slower than in other regions. Therefore, the implementation of necessary measures to reduce the process of this cancer is considered urgent. These plans should include reducing the risk factors exposure, starting or expanding the screening and diagnostic programs especially for high‐risk smoker men, and expanding treatment procedures.
As online data were used in this study, the possibility of errors in the stored data is a major limitation of the study, such as problems of quantifying all sources, delays in accessing data, and changes in coding practices over time, gaps in reliable cancer reporting, and registries in low‐SDI countries.
AUTHOR CONTRIBUTIONS
HS, AM, FR and LA designed and conceived the study. AM collected thedata. LA, AM, HS, and FR analyzed and interpreted the data. AM, AR, FR, LA, andHS, drafted the manuscript. HS, FR and AM provided administrative, technical,or material support. All authors contributed to the article and approved thesubmitted version.
Rezaei F, Mazidimoradi A, Rayatinejad A, Allahqoli L, Salehiniya H. Temporal trends of tracheal, bronchus, and lung cancer between 2010 and 2019, in Asian countries by geographical region and sociodemographic index, comparison with global data. Thorac Cancer. 2023;14(18):1668–1706. 10.1111/1759-7714.14912
REFERENCES
- 1. Vineis P, Wild CP. Global cancer patterns: causes and prevention. Lancet. 2014;383(9916):549–57. [DOI] [PubMed] [Google Scholar]
- 2. Sung H, Ferlay J, Siegel RL, Laversanne M, Soerjomataram I, Jemal A, et al. Global cancer statistics 2020: GLOBOCAN estimates of incidence and mortality worldwide for 36 cancers in 185 countries. CA Cancer J Clin. 2021;71(3):209–49. [DOI] [PubMed] [Google Scholar]
- 3. Rafiemanesh H, Mehtarpour M, Khani F, Hesami SM, Shamlou R, Towhidi F, et al. Epidemiology, incidence and mortality of lung cancer and their relationship with the development index in the world. J thorac Dis. 2016;8(6):1094–102. [DOI] [PMC free article] [PubMed] [Google Scholar]
- 4. Ghoncheh M, Mohammadian M, Mohammadian‐Hafshejani A, Salehiniya H. The incidence and mortality of colorectal cancer and its relationship with the human development index in Asia. Ann Glob Health. 2016;82(5):726–37. [DOI] [PubMed] [Google Scholar]
- 5. Arabsalmani M, Mohammadian‐Hafshejani A, Ghoncheh M, Hadadian F, Towhidi F, Vafaee K, et al. Incidence and mortality of kidney cancers, and human development index in Asia; a matter of concern. J Nephropathol. 2017;6(1):30–42. [DOI] [PMC free article] [PubMed] [Google Scholar]
- 6. James SL, Abate D, Abate KH, Abay SM, Abbafati C, Abbasi N, et al. Global, regional, and national incidence, prevalence, and years lived with disability for 354 diseases and injuries for 195 countries and territories, 1990–2017: a systematic analysis for the Global Burden of Disease Study 2017. Lancet. 2018;392(10159):1789–858. [DOI] [PMC free article] [PubMed] [Google Scholar]
- 7. Bray F, Ferlay J, Soerjomataram I, Siegel RL, Torre LA, Jemal A. Global cancer statistics 2018: GLOBOCAN estimates of incidence and mortality worldwide for 36 cancers in 185 countries. CA Cancer J Clin. 2018;68(6):394–424. [DOI] [PubMed] [Google Scholar]
- 8. Ferlay J, Steliarova‐Foucher E, Lortet‐Tieulent J, Rosso S, Coebergh J‐WW, Comber H, et al. Cancer incidence and mortality patterns in Europe: estimates for 40 countries in 2012. Eur J Cancer. 2013;49(6):1374–403. [DOI] [PubMed] [Google Scholar]
- 9. Fitzmaurice C, Dicker D, Pain A, Hamavid H, Moradi‐Lakeh M, MacIntyre MF, et al. The global burden of cancer 2013. JAMA Oncol. 2015;1(4):505–27. [DOI] [PMC free article] [PubMed] [Google Scholar]
- 10. Tavargeri AK, Kulkarni SS, Sudha P. Idiopathic gingival fibromatosis—a case report. J Indian Soc Pedod Prev Dent. 2004;22(4):180–2. [PubMed] [Google Scholar]
- 11. Jemal A, Thun MJ, Ries LA, Howe HL, Weir HK, Center MM, et al. Annual report to the nation on the status of cancer, 1975–2005, featuring trends in lung cancer, tobacco use, and tobacco control. J Natl Cancer Inst. 2008;100(23):1672–94. [DOI] [PMC free article] [PubMed] [Google Scholar]
- 12. Krishna KB, Raju PK, Chitturi RR, Smitha G, Vijai S, Srinivas BV. Prevalence of gingival enlargement in Karnataka school going children. J Int Oral Health. 2014;6(1):106–10. [PMC free article] [PubMed] [Google Scholar]
- 13. Nazir M, Al‐Ansari A, Al‐Khalifa K, Alhareky M, Gaffar B, Almas K. Global prevalence of periodontal disease and lack of its surveillance. Sci World J. 2020;2020:2146160. [DOI] [PMC free article] [PubMed] [Google Scholar]
- 14. Vos T, Abajobir AA, Abate KH, Abbafati C, Abbas KM, Abd‐Allah F, et al. Global, regional, and national incidence, prevalence, and years lived with disability for 328 diseases and injuries for 195 countries, 1990–2016: a systematic analysis for the Global Burden of Disease Study 2016. Lancet. 2017;390(10100):1211–59. [DOI] [PMC free article] [PubMed] [Google Scholar]
- 15. Kianmehr N. Update in systemic lupus erythematosus. RJMS. 2018;24(163):63–9. [Google Scholar]
- 16. Pakzad R, Mohammadian‐Hafshejani A, Ghoncheh M, Pakzad I, Salehiniya H. The incidence and mortality of lung cancer and their relationship to development in Asia. Transl Lung Cancer Res. 2015;4(6):763–74. [DOI] [PMC free article] [PubMed] [Google Scholar]
- 17. Thandra KC, Barsouk A, Saginala K, Aluru JS, Barsouk A. Epidemiology of lung cancer. Contemp Oncol (Pozn). 2021;25(1):45–52. [DOI] [PMC free article] [PubMed] [Google Scholar]
- 18. Islami F, Goding Sauer A, Miller KD, Siegel RL, Fedewa SA, Jacobs EJ, et al. Proportion and number of cancer cases and deaths attributable to potentially modifiable risk factors in the United States. CA Cancer J Clin. 2018;68(1):31–54. [DOI] [PubMed] [Google Scholar]
- 19. Samet JM. Health benefits of smoking cessation. Clin Chest Med. 1991;12(4):669–79. [PubMed] [Google Scholar]
- 20. Barta JA, Powell CA, Wisnivesky JP. Global epidemiology of lung cancer. Ann Global Health. 2019;85(1):8. [DOI] [PMC free article] [PubMed] [Google Scholar]
- 21. Ning F‐L, Lyu J, Pei J‐P, Gu W‐J, Zhang N‐N, Cao S‐Y, et al. The burden and trend of gastric cancer and possible risk factors in five Asian countries from 1990 to 2019. Sci Rep. 2022;12(1):5980. [DOI] [PMC free article] [PubMed] [Google Scholar]
- 22. Mubarik S, Wang F, Fawad M, Wang Y, Ahmad I, Yu C. Trends and projections in breast cancer mortality among four Asian countries (1990–2017): Evidence from five stochastic mortality models. Sci Rep. 2020;10(1):5480. [DOI] [PMC free article] [PubMed] [Google Scholar]
- 23. Allahqoli L, Mazidimoradi A, Momenimovahed Z, Rahmani A, Hakimi S, Tiznobaik A, et al. The global incidence, mortality, and burden of breast cancer in 2019: correlation with smoking, drinking, and drug use. Front Oncol. 2022;12:921015. [DOI] [PMC free article] [PubMed] [Google Scholar]
- 24. Mazidimoradi A, Momenimovahed Z, Allahqoli L, Tiznobaik A, Hajinasab N, Salehiniya H, et al. The global, regional and national epidemiology, incidence, mortality, and burden of ovarian cancer. Health Sci Rep. 2022;5(6):e936. [DOI] [PMC free article] [PubMed] [Google Scholar]
- 25. Momenimovahed Z, Mazidimoradi A, Maroofi P, Allahqoli L, Salehiniya H, Alkatout I. Global, regional and national burden, incidence, and mortality of cervical cancer. Cancer Rep. 2022;6:e1756. [DOI] [PMC free article] [PubMed] [Google Scholar]
- 26. Sharma R, Abbasi‐Kangevari M, Abd‐Rabu R, Abidi H, Abu‐Gharbieh E, Acuna JM, et al. Global, regional, and national burden of colorectal cancer and its risk factors, 1990–2019: a systematic analysis for the Global Burden of Disease Study 2019. Lancet Gastroenterol Hepatol. 2022;7(7):627–47. [DOI] [PMC free article] [PubMed] [Google Scholar]
- 27. Go DS, Kim YE, Yoon SJ. Subnational Burden of Disease According to the Sociodemographic Index in South Korea. Int J Environ Res Public Health. 2020;17(16):5788. [DOI] [PMC free article] [PubMed] [Google Scholar]
- 28. Fan J, Liu Z, Mao X, Tong X, Zhang T, Suo C, et al. Global trends in the incidence and mortality of esophageal cancer from 1990 to 2017. Cancer Med. 2020;9(18):e03338. [DOI] [PMC free article] [PubMed] [Google Scholar]
- 29. Institute for Health Metrics and Evaluation . Protocol for the global burden of diseases, injuries, and risk factors study (GBD) Version 4.0. Global burden of diseases, injuries, and risk factors study. 2020.
- 30. Malhotra J, Malvezzi M, Negri E, La Vecchia C, Boffetta P. Risk factors for lung cancer worldwide. Eur Respir J. 2016;48(3):889–902. [DOI] [PubMed] [Google Scholar]
- 31. Akhtar N, Bansal JG. Risk factors of lung cancer in nonsmoker. Curr Probl Cancer. 2017;41(5):328–39. [DOI] [PubMed] [Google Scholar]
- 32. Malvezzi M, Bertuccio P, Rosso T, Rota M, Levi F, La Vecchia C, et al. European cancer mortality predictions for the year 2015: does lung cancer have the highest death rate in EU women? Ann Oncol. 2015;26(4):779–86. [DOI] [PubMed] [Google Scholar]
- 33. Papadopoulos A, Guida F, Leffondré K, Cénée S, Cyr D, Schmaus A, et al. Heavy smoking and lung cancer: are women at higher risk? Result of the ICARE study. Br J Cancer. 2014;110(5):1385–91. [DOI] [PMC free article] [PubMed] [Google Scholar]
- 34. Powell HA, Iyen−Omofoman B, Hubbard RB, Baldwin DR, Tata LJ. The association between smoking quantity and lung cancer in men and women. Chest. 2013;143(1):123–9. [DOI] [PubMed] [Google Scholar]
- 35. Mollerup S, Jørgensen K, Berge G, Haugen A. Expression of estrogen receptors α and β in human lung tissue and cell lines. Lung Cancer. 2002;37(2):153–9. [DOI] [PubMed] [Google Scholar]
- 36. Alberg AJ, Wallace K, Silvestri GA, Brock MV. Invited commentary: the etiology of lung cancer in men compared with women. Am J Epidemiol. 2013;177(7):613–6. [DOI] [PMC free article] [PubMed] [Google Scholar]
- 37. Schwartz AG, Ray RM, Cote ML, Abrams J, Sokol RJ, Hendrix SL, et al. Hormone use, reproductive history, and risk of lung cancer: the women's health initiative studies. J Thorac Oncol. 2015;10(7):1004–13. [DOI] [PMC free article] [PubMed] [Google Scholar]
- 38. Remon J, Molina−Montes E, Majem M, Lianes P, Isla D, Garrido P, et al. Lung cancer in women: an overview with special focus on Spanish women. Clin Transl Oncol. 2014;16:517–28. [DOI] [PubMed] [Google Scholar]
- 39. World Health Organization (WHO) . Fact sheet about health benefits of smoking cessation. WHO Tobacco Free Initiative. 2015. https://www.who.int/tobacco/quitting/benefits/en
- 40. Reitsma MB, Fullman N, Ng M, Salama JS, Abajobir A, Abate KH, et al. Smoking prevalence and attributable disease burden in 195 countries and territories, 1990–2015: a systematic analysis from the Global Burden of Disease Study 2015. Lancet. 2017;389(10082):1885–906. [DOI] [PMC free article] [PubMed] [Google Scholar]
- 41. Deng Y, Peng L, Li N, Zhai Z, Xiang D, Ye X, et al. Tracheal, bronchus, and lung cancer burden and related risk factors in the United States and China. Am J Transl Res. 2021;13(4):1928–51. [PMC free article] [PubMed] [Google Scholar]
- 42. Zang EA, Wynder EL. Differences in lung cancer risk between men and women: examination of the evidence. J Natl Cancer Inst. 1996;88(3‐4):183–92. [DOI] [PubMed] [Google Scholar]
- 43. Cohen SB‐Z, Paré PD, Man SP, Sin DD. COPD and lung cancer in women: examining sex differences in cigarette smoke metabolism. Am J Respir Crit Care Med. 2007;176(2):113–20. [DOI] [PubMed] [Google Scholar]
- 44. Patel JD, Bach PB, Kris MG. Lung cancer in US women: a contemporary epidemic. JAMA. 2004;291(14):1763–8. [DOI] [PubMed] [Google Scholar]
- 45. Brennan P, Bray I. Recent trends and future directions for lung cancer mortality in Europe. Br J Cancer. 2002;87(1):43–8. [DOI] [PMC free article] [PubMed] [Google Scholar]
- 46. Kligerman S, White C. Epidemiology of lung cancer in women: risk factors, survival, and screening. AJR Am J Roentgenol. 2011;196(2):287–95. [DOI] [PubMed] [Google Scholar]
- 47. Sun S, Schiller JH, Gazdar AF. Lung cancer in never smokers—a different disease. Nat Rev Cancer. 2007;7(10):778–90. [DOI] [PubMed] [Google Scholar]
- 48. Cao M, Chen W. Epidemiology of lung cancer in China. Thorac Cancer. 2019;10(1):3–7. [DOI] [PMC free article] [PubMed] [Google Scholar]
- 49. Tsao AS, Scagliotti GV, Bunn PA Jr, Carbone DP, Warren GW, Bai C, et al. Scientific advances in lung cancer 2015. J Thorac Oncol. 2016;11(5):613–38. [DOI] [PubMed] [Google Scholar]
- 50. Wu L, Leng D, Cun D, Foged C, Yang M. Advances in combination therapy of lung cancer: Rationales, delivery technologies and dosage regimens. J Control Release. 2017;260:78–91. [DOI] [PubMed] [Google Scholar]
- 51. Arnold M, Rutherford MJ, Bardot A, Ferlay J, Andersson TM, Myklebust TÅ, et al. Progress in cancer survival, mortality, and incidence in seven high−income countries 1995–2014 (ICBP SURVMARK−2): a population‐based study. Lancet Oncol. 2019;20(11):1493–505. [DOI] [PMC free article] [PubMed] [Google Scholar]
- 52. Oudkerk M, Liu S, Heuvelmans MA, Walter JE, Field JK. Lung cancer LDCT screening and mortality reduction—evidence, pitfalls and future perspectives. Nat Rev Clin Oncol. 2021;18(3):135–51. [DOI] [PubMed] [Google Scholar]
- 53. de Koning HJ, van der Aalst CM, de Jong PA, Scholten ET, Nackaerts K, Heuvelmans MA, et al. Reduced lung‐cancer mortality with volume CT screening in a randomized trial. N Engl J Med. 2020;382(6):503–13. [DOI] [PubMed] [Google Scholar]
- 54. National Lung Screening Trial Research Team , Church TR, Black WC, Aberle DR, Berg CD, Clingan KL, et al. Results of initial low‐dose computed tomographic screening for lung cancer. N Engl J Med. 2013;368(21):1980–91. [DOI] [PMC free article] [PubMed] [Google Scholar]
- 55. Nanavaty P, Alvarez MS, Alberts WM. Lung cancer screening: advantages, controversies, and applications. Cancer Control. 2014;21(1):9–14. [DOI] [PubMed] [Google Scholar]