

Abstract
The Enzyme Function Initiative (EFI) provides a web resource with “genomic enzymology” web tools to leverage the protein (UniProt) and genome (European Nucleotide Archive; ENA; https://www.ebi.ac.uk/ena/) databases to assist the assignment of in vitro enzymatic activities and in vivo metabolic functions to uncharacterized enzymes (https://efi.igb.illinois.edu/). The tools enable 1) exploration of sequence-function space in enzyme families using sequence similarity networks (SSNs; EFI-EST), 2) easy access to genome context for bacterial, archaeal, and fungal proteins in the SSN clusters so that isofunctional families can be identified and their functions inferred from genome context (EFI-GNT); and 3) determination of the abundance of SSN clusters in NIH Human Metagenome Project metagenomes using chemically guided functional profiling (EFI-CGFP). We describe enhancements that enable SSNs to be generated from taxonomy categories, allowing higher resolution analyses of sequence-function space; we provide examples of the generation of taxonomy category-specific SSNs.
Keywords: EFI-EST, EFI-GNT, sequence similarity networks, genome context, taxonomy
Graphical Abstract:
The UniProt Knowledgebase (UniProtKB; Release 2202_04; https://www.uniprot.org/) contains 230,496,503 protein sequences (229,928,140 IDs in the unreviewed/computationally annotated TrEMBL database and 568,363 IDs in the reviewed manually curated SwissProt database; Supplementary Figure S1). Perhaps one-half of the IDs have unknown, uncertain, or incorrectly assigned functions (in vitro enzymatic activities and in vivo metabolic functions), the latter because it is difficult to distinguish orthologues from paralogues [1, 2]. However, correctly assigned functions are essential for elucidating mechanisms of enzymatic reactions, identifying novel metabolic pathways, and integrating metabolic pathways into the systems biology of both individual organisms and communities.
With the continually increasing amount of sequence data available from genome projects (https://gold.jgi.doe.gov/), UniProt identifies “reference proteomes” for inclusion in UniProtKB so that its growth can be managed; sequences from “redundant proteomes” are deposited in the UniParc database. This process started in 2015, leading to a significant reduction in the number of entries; now, as the criteria for defining reference proteomes are refined, a more modest increase in the number of entries is occurring. UniProtKB is increasing in functional diversity as its reference proteomes become more taxonomically diverse. Functional annotation remains a difficult challenge that requires large-scale integration of sequence (both protein and genome) information with other types of bioinformatics/’omics information.
The Enzyme Function Initiative (EFI; 5/20/2010 – 6/15/2016) devised strategies and tools to assist assignment of functions to uncharacterized enzymes [3]. It developed a web resource that provides “genomic enzymology” tools (https://efi.igb.illinois.edu/); these enable 1) exploration of sequence-function space in enzyme families using sequence similarity networks (SSNs; EFI-EST), 2) easy access to genome context for bacterial, archaeal, and fungal proteins in the SSN clusters so that isofunctional families might be identified from genome context and their functions inferred from the types of activities associated with encoded neighbor proteins (EFI-GNT); and 3) determination of the abundance of SSN clusters in metagenomes (https://www.hmpdacc.org/hmp/) using chemically guided functional profiling (EFI-CGFP).
In 2015, we introduced EFI-EST [4]. In 2019, we described enhancements to EFI-EST and introduced both EFI-GNT and EFI-CGFP [5]; we used the glycyl radical enzyme superfamily (IPR004184) to illustrate the use of SSNs generated with EFI-EST to explore sequence-function space and collect genome context information using EFI-GNT so that isofunctional clusters could be identified. Other articles provide additional examples of their use [6–11]. The tools have been used by >9700 users, >90,000 EFI-EST jobs have been run, and >680 articles have been published that cite the tools (https://efi.igb.illinois.edu/training/index), confirming their utility in generating hypotheses to guide experimental verification of novel in vitro enzymatic activities and in vivo metabolic functions of uncharacterized enzymes/proteins.
As the sizes of protein families continue to increase, we now have added to EFI-EST the ability to generate SSNs for user-selected taxonomy categories, allowing higher resolution analyses of focused regions of sequence-function space. The higher resolution SSNs enable more detailed analyses of the genome context for members of large superfamilies, improving identification of isofunctional families and, also, inference of their in vitro activities and in vivo metabolic functions.
We also added three utilities to EFI-EST for analyses of SSN clusters: 1) Cluster Analysis to provide multiple sequence alignments (MSAs), WebLogos, hidden Markov models (HMMs), positions of conserved residues, and length histograms; 2) Convergence Ratio to quantitate internode connectivity, and 3) Neighborhood Connectivity to identify emerging families in SSNs generated with low alignment scores [12]. The Cluster Analysis utility is useful for identifying the positions of conserved residues, important information for both inferring both enzymatic activities and determining reaction mechanisms.
In this article we provide an overview of the web resource, focusing on the recent enhancements so that users can understand both their use and the information they provide. We also provide examples of the generation of taxonomy category-specific SSNs to explore sequence-function space in both the glycyl radical enzyme (GRE) superfamily [13, 14], the example used in our 2019 publication [5], and the radical SAM (RS) superfamily [11, 15–18], arguably the largest and most functionally diverse enzyme superfamily.
Background Information
Sequence Similarity Networks.
The tools use sequence similarity networks (SSNs) generated by EFI-EST to enable analyses of sequence-function space in datasets of homologous sequences, e.g., protein families [19]. Briefly, SSNs are multidimensional networks that display pairwise sequence relationships in groups of homologous proteins. Each protein is represented by a “node”; pairs of nodes are connected by an “edge” if they share a pairwise sequence similarity (quantitated by an alignment score calculated from the BLAST bit score) that exceeds a user-specified threshold, e.g., Figure 1B. By selecting increasing alignment score thresholds for drawing edges, the nodes can be segregated into clusters that define isofunctional families. The SSNs include “node attributes” with information about each node, e.g., sequence length, taxonomy, and links to AlphaFold-predicted structures and various databases, including BRENDA, STRING, and KEGG, that may be useful for inferring functions. The SSNs are analyzed with Cytoscape, an open-source software platform for visualizing complex networks (https://cytoscape.org/).
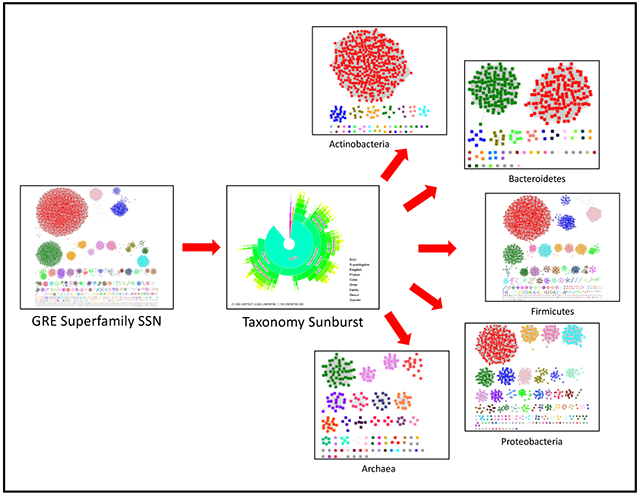
Figure 1. Taxonomy Sunburst and Taxonomy Category-Filtered UniRef90 Cluster SSNs for GRE Superfamily.

Panel A, Taxonomy Sunburst for the complete sequences in the GRE superfamily (IPR004184) generated with the Taxonomy Tool Families Option as described in the Supplementary Tutorial. Panel B, UniRef90 cluster Color SSN for the GRE superfamily generated with the Color SSNs utility as described in the Supplementary Tutorial with an alignment score threshold of 240 and a minimum length of 650 residues that segregates the SwissProt and literature-curated functions into separate clusters; the SSN contains 5,801 nodes and 2,133,174 edges. The clusters/nodes were assigned unique colors by the Color SSNs utility. Panel C, Taxonomy category-filtered UniRef90 cluster SSN for superkingdom Bacteria, phylum Actinobacteria generated as described in the Supplementary Tutorial Tutorial using the Taxonomy Tool Families Option with transfer of the UniRef90 cluster IDs to the EFI-EST Accession IDs Option; the SSN contains 488 nodes and 64,199 edges. In this and the following panels, the nodes are colored using the UniProt ID-Color-Cluster number mapping table generated for the Color SSN in Panel B, allowing the clusters/nodes in the taxonomy category-filtered SSN to be associated with the clusters/nodes in the Color SSN in Panel B for the entire superfamily. Panel D, Taxonomy category-filtered UniRef90 cluster SSN for superkingdom Bacteria, phylum Bacteroidetes; the SSN contains 333 nodes and 13,658 edges. Panel E, Taxonomy category-filtered UniRef90 cluster SSN for superkingdom Bacteria, phylum Firmicutes; the SSN contains 2,467 nodes and 515,667 edges. Panel F, Taxonomy category-filtered UniRef90 cluster SSN for superkingdom Bacteria, phylum Protobacteria; the SSN contains 1,048 nodes and 50,190 edges.
Phylogenetic trees are used by evolutionary biologists to analyze sequence relationships. Trees are constructed from multiple sequence alignments (MSAs) that are more difficult to perform than pairwise sequence comparisons (BLAST) with large datasets; in addition, the visualization and interpretation of trees for large datasets is challenging. Although the pairwise sequence relationships revealed by SSNs do not provide phylogenetic relationships, they are useful for distinguishing paralogues from orthologues as well as access to genome context using the genome neighborhood networks (GNNs) and genome neighborhood diagrams (GNDs) provided by the EFI-GNT web tool. Analyses of several superfamilies using both SSNs and trees allow the conclusion that SSNs are useful (and user-friendly) for analyzing sequence-function space in protein families [18, 20–23].
EFI-EST provides four options for generating datasets of homologous sequences: 1) “Sequence BLAST” using a sequence with BLASTP to retrieve homologues, 2) “Families” using sequences from one or more user-provided Pfam and/or InterPro families and/or Pfam clans, 3) “FASTA” using sequences in a FASTA format, and 4) “Accession IDs” using lists of UniProt, UniRef90 cluster, UniRef50 cluster, or NCBI IDs. Although the tools were conceived to analyze sequence-function space in families, Sequence BLAST is the most frequently used option.
Protein and Genome Sequences.
The tools use protein sequences from the UniProtKB (https://www.uniprot.org/) and UniRef (https://www.uniprot.org/help/uniref) databases and genome sequences from the European Nucleotide Archive (ENA; https://www.ebi.ac.uk/ena). The databases are updated with each release of UniProtKB (usually every twelve weeks).
Fragments and truncated sequences.
Not all sequences in UniProtKB are “full-length”. UniProtKB designates a “Sequence Status” for each entry: “Complete” if the encoding DNA sequence has both start and stop codons; “Fragment” if the start and/or stop codon is missing. In Release 2022_04, a significant number of entries are fragments (10.7%); these can influence the interpretation of SSNs as well as interfere with other analyses, e.g., MSAs and HMMs.
The EFI-EST options provides the Fragment Option to exclude fragments in the input dataset. However, this does not eliminate sequences truncated because of sequencing errors. Length histograms are provided in the Dataset Analysis step; the Sequence Length Restriction Option can be used to apply a minimum length filter to eliminate truncated sequences recognized as short “outliers” in the distribution of sequences. However, exclusion of fragments and minimum length filtering do not guarantee exclusion of truncated sequences.
UniRef90 and UniRef50 Clusters.
SSNs can be generated using UniProt IDs, UniRef90 cluster IDs, or UniRef50 cluster IDs. As the sizes of families increase, SSNs generated with UniProt IDs may be too large to be analyzed with Cytoscape (due to insufficient RAM). This problem often can be solved by generating SSNs with nodes that are UniRef90 or UniRef50 clusters in which UniProt IDs that share the specified levels of pairwise identity are conflated.
UniRef90 clusters conflate UniProt entries that share ≥90% sequence identity and have 80% overlap with the longest sequence in the cluster (seed sequence); the entries in the cluster usually are functionally homogeneous, i.e., orthologues. UniRef50 clusters conflate UniProt entries that share ≥50% sequence identity and have 80% overlap with the seed sequence; the entries often are functionally heterogeneous, e.g., paralogues and/or heterofunctional multidomain proteins that share a common domain. UniRef50 and UniRef90 clusters are labeled with the UniProt ID of the “representative sequence” chosen from the UniProt IDs in the cluster, with the following priorities for its selection: 1) manual review (SwissProt curation), 2) annotation score (reliability of available annotations), 3) organism (reference proteome), and 4) length (longest); if possible, a fragment is not used as a representative sequence.
A UniRef cluster (usually UniRef50) can contain one or more members of a user-selected family, but the representative sequence (cluster ID) may not include a sequence from the selected family. This situation occurs when a cluster contains multidomain proteins, and the domain associated with the selected family is not present in the multidomain structure of the representative sequence. Edge alignment scores calculated for these clusters will not be appropriate for quantitating the similarity of the family members in the cluster to other clusters in which the representative sequence includes a sequence from the selected family. By selecting Filter by Family (vide infra), these types of UniRef clusters can be excluded from SSNs.
Input ID and SSN node filtering.
EFI-EST provides the ability to filter UniProt entries, UniRef90 clusters, and UniRef50 clusters in both input datasets and nodes included in an SSN calculation using several criteria: fragments (using Fragment Option), sequence length (Sequence Length Restriction Options), taxonomy (using Filter by Taxonomy, vide infra), and family (using Filter by Family, vide infra). When these filters are applied to UniRef90 and UniRef50 clusters, the filter first is applied to the representative sequence (cluster ID) and then to internal UniProt IDs to remove those from the cluster that do not satisfy the filter. The node attributes for SSNs generated for filtered UniRef90 and UniRef50 clusters are lists of values for the internal UniProt entries that satisfy the filter(s).
The filtered UniProt IDs in UniRef90 and UniRef50 clusters are transferred to 1) EFI-GNT to generate genome neighborhood networks (GNNs) and retrieve genome neighborhood diagrams (GNDs), 2) the Color SSNs utility that provides files containing the UniProt IDs, UniRef90 cluster IDs, UniRef50 cluster IDs, or FASTA-formatted sequences for each cluster in the SSN, 3) the Cluster Analysis utility that provides information about each cluster in the SSN (vide infra), and 4) the Neighborhood Connectivity utility that quantitates internode connectivity in each cluster in the SSN (vide infra). These tools/utilities provide files with information for the internal UniProt IDs that matched the filters, including SwissProt descriptions and files of UniProt, UniRef90 cluster, and UniRef50 cluster IDs for each SSN cluster by the Color SSNs and Cluster Analysis utilities.
Web resource.
EFI-EST, EFI-GNT, and EFI-CGFP can be accessed at https://efi.igb.illinois.edu/. The computer cluster that hosts the tools is maintained by the Computer Network Resource Group at the Institute of Genomic Biology at the University of Illinois, Urbana-Champaign. The resource can be accessed without registration; users can create optional accounts to organize their jobs and view their job history.
Resource Enhancements: Taxonomy Tool and Filter by Taxonomy
The web resource now (since our 2019 publication [5]) provides 1) the Taxonomy Tool (Supplementary Figure S2A) that displays the taxonomic distribution of entries in EFI-EST input datasets (Families, FASTA, and Accession IDs) and enables the transfer of the entries (UniProt, UniRef90 cluster, or UniRef50 cluster) in a selected category to either the EFI-EST Accession IDs Option for SSN generation or the EFI-GNT Retrieve Genome Neighborhood Diagram tab for retrieval of GNDs and 2) Filter by Taxonomy (Supplementary Figures S2B and S2C) in the EFI-EST dataset input and SSN finalization options that enables SSNs to be restricted to one or more taxonomy categories in the Superkingdom, Kingdom, Phylum, Class, Order, Family, Genus, and Species ranks. Both increase the likelihood that UniRef90 clusters can be used instead of UniRef50 clusters (or UniProt IDs instead of UniRef90 clusters) to generate SSNs to 1) provide higher resolution SSNs that can be analyzed using Cytoscape with the RAM typically available on desktop/laptop computers and 2) increase the probability that UniRef SSN nodes will contain orthologues instead of paralogues (UniRef90 instead of UniRef50 nodes).
Taxonomy Tool (https://efi.igb.illinois.edu/taxonomy/; Supplementary Figure S2A).
The Taxonomy Tool (blue Taxonomy tab at the top of each page) provides three input options that parallel those in EFI-EST: “Families”, a list of one or more Pfam families, InterPro families and/or Pfam clans; “FASTA”, FASTA-formatted UniProt sequences; and “Accession IDs”, UniProt, UniRef90 cluster, or UniRef50 cluster IDs.
The output is a Taxonomy Sunburst (Figure 1A; expanded in Supplementary Figure S3) that displays the taxonomic distribution of the UniProt IDs in the dataset, i.e., the categories in the Superkingdom, Kingdom, Phylum, Class, Order, Family and Genus ranks. The sunburst provides the numbers of UniProt, UniRef90 cluster, and UniRef50 cluster IDs for each category within each rank by clicking on the wedge for that category (e.g., Supplementary Figure S4; clicking on the center resets to the next higher rank). The UniProt, UniRef90 cluster, and UniRef50 cluster IDs and FASTA-formatted sequences for the selected category can be downloaded. The UniProt, UniRef90 cluster, or UniRef50 cluster IDs can be transferred with Transfer to EFI-EST to the EFI-EST Accessions ID Option (Supplementary Figure S5) to generate a taxonomy-filtered SSN (e.g., Figure 1C, 1D, 1E, and 1F) and/or with Transfer to EFI-GND Viewer to the EFI-GNT Sequence ID Lookup/Retrieve Genome Neighborhood Diagram tab to retrieve GNDs.
If the user selects Transfer to EFI-EST and either UniRef90 or UniRef50 cluster IDs, the EFI-EST Accessions ID Option retrieves the clusters from the UniRef database, so these may contain internal UniProt IDs that do not have the same Sequence Status, family, and/or taxonomy category that were used for generating the sunburst (vide infra). Therefore, the EFI-EST Accessions ID Option provides the Fragment Option, Filter by Family, and Filter by Taxonomy (Supplementary Figure S6) to ensure that the UniRef90 or UniRef50 cluster IDs (representative sequences) have the desired taxonomy and family properties as well as remove UniProt IDs from the clusters that do not have the desired properties.
Taxonomy Tool: “Families” option (Supplementary Figure S7).
This option identifies UniProt IDs for a list of Pfam families, InterPro families/domains and/or Pfam clans to generate the Taxonomy Sunburst. The information in the sunburst assists selection of both the database (UniProt, UniRef90, or UniRef50) and taxonomy categories (Filter by Taxonomy) for generating SSNs with the EFI-EST Families Option.
The UniRef90 and UniRef50 clusters that contain the family UniProt IDs are retrieved from UniRef using the lookup table provided by UniProt/UniRef. As described previously, because UniRef90 and UniRef50 clusters contain sequences conflated based on sequence identity, the representative sequence is not always a member of the input family; this can occur when a cluster contains multidomain proteins, some of which do not contain the domain associated with the input family. Such clusters should be excluded using Filter by Family (Supplementary Figure S6C) because the alignment scores calculated for the internode pairwise similarity would be misleading.
The numbers of UniProt IDs and UniRef90 and UniRef50 clusters in the selected category are displayed (Figure 1A). Because these will be the numbers of nodes in SSNs, the user can better select the database (UniProt, UniRef90, or UniRef50) and/or taxonomy categories (Filter by Taxonomy) for generating the SSN using the EFI-EST Families Option.
Taxonomy Tool: FASTA option (Supplementary Figure S8).
This option assumes the input FASTA-formatted sequences are UniProt entries. The FASTA headers must contain UniProt IDs (or NCBI IDs that have that have “equivalent” UniProt IDs) so that taxonomy information can be retrieved from UniProtKB. The input sequences can be filtered with the Fragment Option, Filter by Taxonomy, and Filter by Family (Supplementary Figure S6). The Taxonomy Sunburst provides the number of the UniProt IDs in each taxonomy category; UniRef90 and UniRef50 clusters are not retrieved.
Taxonomy Tool: Accession IDs option (Supplementary Figure S9).
This option obtains UniProt IDs from a list of UniProt, UniRef90 cluster, or UniRef50 cluster IDs (often obtained from the Color SSNs utility or the Taxonomy Tool). If the input is a list of UniRef90 cluster or UniRef50 cluster IDs, the clusters are obtained from the lookup table from UniProt/UniRef; the UniProt IDs in the UniRef90 or UniRef50 clusters are used to generate the Taxonomy Sunburst.
The UniRef90 or UniRef50 clusters retrieved from UniProt/UniRef may contain internal UniProt IDs that were removed by filtering in the SSN or Taxonomy Tool job (Fragment Option, Filter by Family, and/or Filter by Taxonomy). Therefore, the input clusters should be filtered using Fragment Option, Filter by Family and/or Filter by Taxonomy to include only UniProt IDs with the desired sequence status, Pfam families, InterPro families and/or Pfam clans, and taxonomy categories in the sunburst.
Filter by Taxonomy (Supplementary Figures S2B and Figure S2C).
EFI-EST provides Filter by Taxonomy in the EFI-EST Generate and SSN Finalization steps. With Filter by Taxonomy, UniProt entries and UniRef clusters retrieved from UniProt can be restricted to match one or more selected taxonomy categories. Filter by Taxonomy first excludes UniRef clusters for which the taxonomy category associated with the UniRef90 or UniRef50 cluster ID (representative sequence) does not match the selected category(ies); the filter then removes internal UniProt IDs that do not match the selected category(ies).
The user can choose three Preselected conditions that are not single taxonomy ranks (Supplementary Figure S2A): 1) “Bacteria, Archaea, Fungi” selects entries from organisms that may provide useful genome context (gene clusters/operons) for inferring functions; 2) “Fungi” selects entries from the Ascomycota, Basidiomycota, Fungi incertae sedis and unclassified Fungi phyla within the Opisthokonta kingdom of the Eukaryota superkingdom; and 3) “Eukaryota, No Fungi” selects entries from Eukaryota that are not Fungi. Preselected conditions also include “Viruses”, “Bacteria”, “Eukaryota”, and “Archaea”, although these ranks are available from “Add Taxonomy category”. “Add Taxonomy category” is used to select one or more taxonomy categories from the Superkingdom, Kingdom, Phylum, Class, Order, Family, Genus, and Species ranks (Supplementary Figure S2C).
Resource Enhancements: Cluster Analysis, Convergence Ratio, and Neighborhood Connectivity Utilities
Cluster Analysis utility for MSAs, WebLogos, HMMs, consensus residues, and length histograms for SSN clusters (Supplementary Figures S10 and S11; Figure 2).
Figure 2. Cluster Analysis utility output.
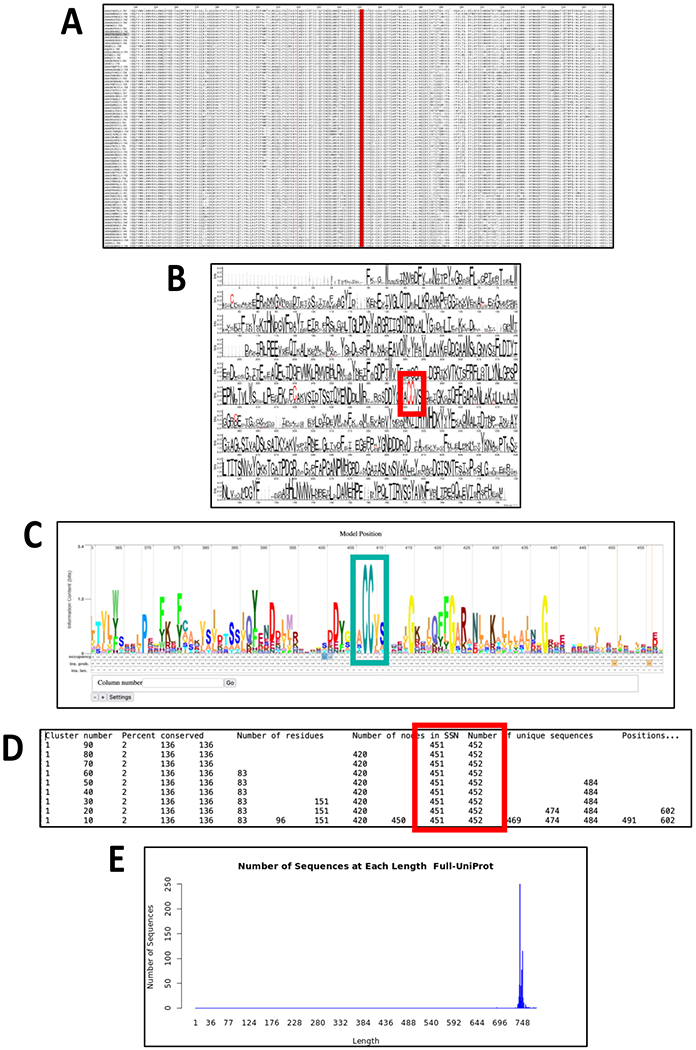
The xgmml file for the taxonomy category-filtered UniRef90 cluster SSN for superkingdom Bacteria, phylum Bacteroidetes within the GRE superfamily (generated as described in the Tutorial for the GRE superfamily) was transferred to the Cluster Analysis utility. The panels display the types of output generated by the utility. Panel A, MSA for Cluster 1. The -CC- motif characteristic of the pyruvate formate lyase function is highlighted in red. Panel B, WebLogo for the MSA in Panel A. The -CC- motif characteristic of the pyruvate formate lyase function is highlighted in the red box. Panel C, Skylign display for the HMM generated for Cluster 1. The -CC- motif characteristic of the pyruvate formate lyase function is highlighted in the cyan box. Panel D, Consensus Residue table for Cys residues in the MSA in Panel A. The -CC- motif characteristic of the pyruvate formate lyase function is located at positions 451 and 452 (highlighted in the red box). Panel E, length histogram for the UniProt IDs in Cluster 1.
The Cluster Analysis utility uses an SSN as input (ideally segregated into isofunctional clusters). The utility generates the MSA for the nodes in each cluster (Figure 2A; UniProt, UniRef90 cluster, or UniRef50 cluster IDs) using MUSCLE and generates the WebLogo diagram (http://weblogo.threeplusone.com) using the MSA (Figure 2B). The MSA is used to generate an HMM (http://hmmer.org); the text file can be downloaded, and the HMM can be viewed interactively with the Skylign display (http://skylign.org/; Figure 2C). The WebLogo and Skylign display of the HMM allow easy visual identification of conserved sequence motifs that may be useful for inferring functions. The utility also provides a table of the positions of consensus residues in a user-supplied list (Figure 2D; calculated from the MSA) as well as length histograms for the sequences in each cluster (Figure 2E).
Convergence Ratio utility for quantitating internode connectivity in SSN clusters (Supplementary Figure S12).
The Convergence Ratio utility calculates cluster internode connectivity. A Color SSN generated with the Color SSNs utility is the input (cluster numbers assigned by the utility are required). The “convergence ratio” is the ratio of the actual number of edges in the cluster to the maximum possible number of edges (each node connected to every other node). For UniRef90 cluster and UniRef50 cluster SSNs, two ratios are calculated, one for the edges connecting the UniRef nodes in the SSN clusters and the second for the internal UniProt IDs. The user specifies the alignment score—as the alignment score increases the number of edges will decrease if a cluster contains paralogues or orthologues from different taxonomy categories. The value of the ratio ranges from 1.0 for “identical” sequences to 0.0 for unrelated sequences at the specified alignment score. The ratio can be used as a criterion to infer whether an SSN cluster contains orthologues—the ratio for a cluster containing orthologues is expected to be close to 1.0 even at large alignment scores.
Neighborhood Connectivity utility for identifying unresolved families in SSN clusters (Supplementary Figure S13).
The nodes for unresolved families can be difficult to identify in SSNs generated with low alignment scores. Coloring the nodes according to the number of their internode edges (neighborhood connectivity) may facilitate identification of emerging families with highly connected nodes [12]. Using Neighborhood Connectivity Coloring as a guide, the alignment score threshold can be chosen to separate the SSN into families. An example for the GRE superfamily is shown in Figure 3; as the alignment score threshold increases to 240 where the clusters are isofunctional, the coloring reveals the emerging clusters.
Figure 3. Neighborhood Connectivity utility output.
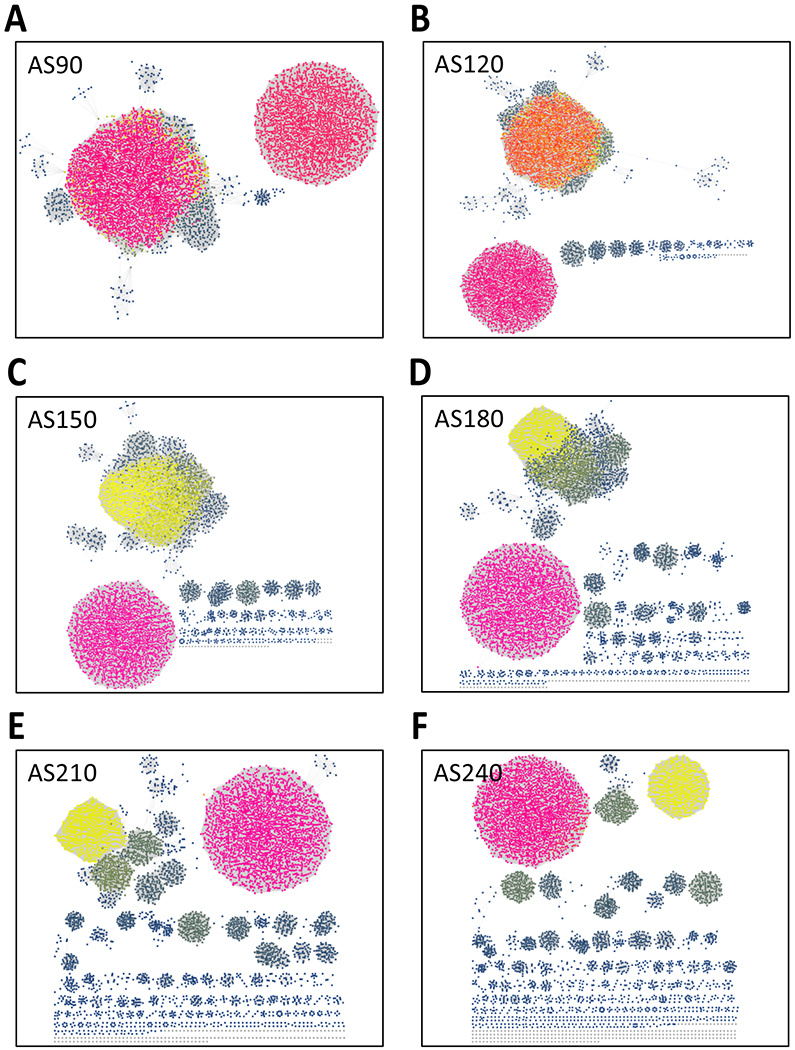
Neighborhood connectivity UniRef90 cluster SSNs generated for the complete sequences in the GRE superfamily (IPR004184) as a function of increasing alignment score with a minimum length of 650 residues. The nodes are colored according to neighborhood connectivity (number of internode edges) assigned by the utility. Panel A, alignment score 90. Panel B, alignment score 120. Panel C, alignment score 150. Panel D, alignment score 180. Panel E, alignment score 210. Panel F, alignment score 240. As the alignment score increases, the coloring highlights the emerging isofunctional clusters.
EFI-EST, EFI-GNT, and EFI-CGFP
The following sections provide an overview of the tools, noting the enhancements that have been added since our 2019 publication [5].
EFI-EST “Sequence BLAST” tab: Single sequence query (Supplementary Figure S14).
A sequence is the query for a BLAST search of the UniProt, UniRef90, or UniRef50 databases; the hits are used to generate an SSN. If desired, the hits can be restricted to specific taxonomy categories (the filter is applied to the list of hits identified in the BLAST). A text file with a list of the UniProt, UniRef90, or UniRef50 ID hits, e-values, descriptions, and numbers of IDs in the UniRef cluster is available for download.
EFI-EST “Families” tab: Pfam families, InterPro families and/or Pfam clans (Supplementary Figure S15).
Sequences from one or more Pfam families, InterPro families, and/or Pfam clans are used. The number of sequences (UniProt IDs, UniRef90 cluster IDs, and UniRef50 cluster IDs) and the taxonomic distribution can be previewed using the Taxonomy Tool (so that the proper database and any desired taxonomy category can be selected to allow the generation of an SSN that can be analyzed with Cytoscape). Filter by Taxonomy can be applied to the UniProt, UniRef90 clusters, or UniRef50 clusters identified as IDs of the selected family.
EFI-EST “FASTA” tab: FASTA file (Supplementary Figure S16).
The user provides sequences in the FASTA format. The FASTA headers can be read for UniProt IDs (and/or NCBI IDs with “equivalent” UniProt IDs) so that node attribute information can be included in the SSN. Filter by Taxonomy can be applied to the input sequences using FASTA header reading. The sequences are assumed to be UniProt IDs.
EFI-EST “Accessions IDs” tab: UniProt, UniRef90 cluster, UniRef50 cluster and/or NCBI IDs (Supplementary Figure S5).
The user provides a list of UniProt, UniRef90 cluster, or UniRef50 cluster IDs (and/or NCBI IDs with “equivalent” UniProt IDs). Typically, the list is obtained from the Color SSNs utility that provides files with the UniProt, UniRef90 cluster, and UniRef50 cluster IDs for the clusters in an input SSN; alternatively, files are available from the Taxonomy Tool. Because the Color SSNs utility and the Taxonomy Tool provide UniRef90 and UniRef50 IDs without any information about family and/or taxonomy filtering that may have been applied to the internal IDs, the EFI-EST Accession IDs Option provides Filter by Family and Filter by Taxonomy.
EFI-EST utilities: “Color SSNs” for identifying and coloring SSN clusters (Supplementary Figure S17).
An SSN is the input; the output is an SSN in which the nodes in each cluster are assigned a unique number and color (for visualization in Cytoscape). Files of UniProt, UniRef90 cluster, and UniRef50 cluster IDs and FASTA sequences for the nodes in each cluster and a list of the SwissProt-curated functions in each cluster are provided. If Filter by Family and/or Filter by Taxonomy were used to generate the input SSN, the UniProt and UniRef clusters IDs are those for the filtered clusters.
EFI-EST utilities: “Cluster Analysis” for multiple sequence alignments, WebLogos, HMMs, consensus residues, and length histograms of IDs of SSN clusters (Supplementary Figures S10 and S11).
Its functions were described in the Resource Enhancements: Cluster Analysis and Convergence Utilities section. Like the Color SSNs utility, if Filter by Family and/or Filter by Taxonomy were used to generate the input UniRef90 or UniRef50 cluster SSN, the UniProt and UniRef clusters IDs that are provided are those for the filtered clusters.
EFI-EST utilities: “Convergence Ratio” for quantitating internode connectivity in SSN clusters (Supplementary Figure S12).
Its functions were described in the Resource Enhancements: Cluster Analysis and Convergence Utilities section.
EFI-EST utilities: “Neighborhood Connectivity” for identifying unresolved families in SSN clusters (Supplementary Figure S13).
Its functions were described in the Resource Enhancements: Cluster Analysis and Convergence Utilities section.
EFI-GNT: genome context of IDs of SSN clusters.
EFI-GNT provides access to the genome context for the bacterial, archaeal, and fungal members of SSN clusters: in these organisms the genes encoding the enzymes in metabolic pathways often are colocated in gene clusters/operons. The local database is constructed from the ENA database and provides genome neighborhoods (±20 genes) for each bacterial, archaeal, and fungal member in the UniProtKB. EFI-GNT is unchanged since our 2019 publication [5].
EFI-CGFP: metagenome abundance of IDs of SSN clusters using chemically guided functional profiling.
EFI-CGFP provides an interface for mapping SSN clusters to metagenomes determined in the Human Metagenome Project (HMP-1; https://hmpdacc.org/hmp/) using the CGFP pipeline developed by Balskus and Huttenhower [13]. EFI-CGFP is unchanged since our 2019 publication [5].
In the following sections, we provide examples of using the Taxonomy Tool with Transfer to EFI-EST as well as Filter by Taxonomy in the SSN Finalization and Generate steps of the EFI-EST Family Option to generate taxonomy category-filtered SSNs for the glycyl radical enzyme (GRE) superfamily and the radical SAM (RS) superfamily. The GRE superfamily was used in our 2019 publication to demonstrate the integrated use of EFI-EST, EFI-GNT, and EFI-CGFP [5]. The RS superfamily is very large (vide infra) and both functionally and mechanistically diverse, so we use this superfamily to demonstrate that both the Taxonomy Tool and Filter by Taxonomy are robust.
A Supplemental Tutorial is provided for each superfamily that describes the use of the Taxonomy Tool and Filter by Taxonomy. The web resource Training page (https://efi.igb.Illinois.edu/training/example.php?id=2022) provides links to 1) the Taxonomy Taxonomy Tool jobs used to generate Taxonomy Sunbursts and 2) both the DATASET COMPLETED and DOWNLOAD NETWORK FILES pages for the EFI-EST jobs used for generating the taxonomy category-filtered SSNs.
Taxonomy Tool and Filter by Taxonomy: GRE Superfamily
GRE superfamily.
The GRE superfamily is a functionally diverse superfamily, with reactions involving radical-based mechanisms [13, 14]. An activating enzyme (a member of the RS superfamily) abstracts the pro-(S) hydrogen atom from a Gly in a loop near the C-terminus of a ten-stranded (β/α)-barrel domain; the radical then abstracts a hydrogen atom from the thiol group of a Cys residue in a second loop near the middle of the polypeptide chain. The reaction proceeds, usually by abstraction of a hydrogen atom from the substrate by the thiyl radical, but in the case of pyruvate formate lyase by addition of the thiyl radical to the carbonyl group of pyruvate.
Taxonomy Sunbursts (Tutorial pages 2 - 8).
The Taxonomy Tool Families Option was used with UniProt Release 2022_04 to generate three Taxonomy Sunbursts, one including both complete and fragment sequences, the second only complete sequences, and the third complete sequences with ≥650 residues (“full-length” sequences). As shown in the Taxonomy Sunbursts, the superfamily contains 25,513 total UniProt entries (fragment and complete; 21,288 unique sequences determined using CD-HIT), 21,636 complete UniProt entries (17,505 unique sequences), and 20,089 “full-length” UniProt entries (15,986 unique sequences).
UniProt ID SSN (Tutorial pages 9 – 12).
The UniProt ID SSN was generated for the complete UniProt entries using the EFI-EST Families Option; an alignment score threshold of 240 and a minimum length filter of 650 residues were selected to finalize the SSN [5]. The alignment score threshold of 240 segregates the SwissProt and literature-curated functions into separate clusters. The SSN contained 20,089 UniProt ID nodes and 47,499,276 edges; it is too large to be analyzed with Cytoscape using most desktop/laptop computers.
UniRef90 Cluster SSN (Tutorial pages 13 – 19).
As shown in the Taxonomy Sunburst for the complete UniProt entries, the superfamily contains 6,938 UniRef90 clusters. The UniRef90 cluster SSN was generated for the UniRef90 cluster IDs using the EFI-EST Families Option; using the same alignment score threshold of 240 and a minimum length filter of 650 residues [5], the full UniRef90 cluster SSN contained 5,801 UniRef90 cluster nodes and 2,133,174 edges.
The SSN was transferred to the Color SSNs utility (to assign unique numbers to each cluster and colors to the nodes in each cluster); the Color SSN is shown in Figure 1B. The UniProt ID-Color-Cluster number mapping table generated by the utility was used with the BridgeDb application in Cytoscape to color the nodes in the taxonomy category-filtered SSNs described in the following sections.
Taxonomy category-filtered UniRef90 cluster SSNs were generated by the three methods described in the following sections.
Taxonomy Tool Families Option, with transfer of UniRef90 cluster IDs to the EFI-EST Accession IDs Option (Tutorial pages 20 – 26).
The Taxonomy Sunburst generated for the complete sequences (Figure 1A) was used with Transfer to EFI-EST to generate taxonomy category-filtered UniRef90 cluster SSNs that include the majority of the entries in the superfamily: superkingdom Bacteria; superkingdom Bacteria, phylum Actinobacteria (Figure 1C); superkingdom Bacteria, phylum Bacteroidetes (Figure 1D); superkingdom Bacteria, phylum Firmicutes (Figure 1E); superkingdom Bacteria, phylum Proteobacteria (Figure 1F); superkingdom Archaea; and Fungi (a subset of superkingdom Eukaryota). The nodes in the SSNs were colored in Cytoscape using the UniProt ID-Color-Cluster number color mapping table for the UniRef90 cluster SSN for the superfamily in Figure 1B (previous section).
Comparison of the UniRef90 cluster SSN for the superfamily (Figure 1B) with taxonomy category-filtered UniRef90 cluster SSNs (Figures 1C–1F; assisted by the colors assigned to the clusters in the UniRef90 cluster SSN by the Color SSNs utility) reveals the shared and unique presence of enzymatic activities/metabolic functions in the various taxonomy groups. The taxonomy category-filtered SSNs provide an overview of the distribution of the GRE family functions across the taxonomy categories.
This method for generating a taxonomy category-filtered SSN is the easiest for single taxonomy categories: the Taxonomy Sunburst provides the numbers of UniProt, UniRef90 cluster, and UniRef50 cluster IDs; the user can estimate the size of the SSN and directly generate it by transferring the selected IDs to EFI-EST Accession IDs Option. However, an SSN for multiple taxonomy categories requires that the SSN be generating using an EFI-EST tool, e.g., one of the following two methods using the EFI-EST Families Option.
EFI-EST Families Option, Filter by Taxonomy in the Analysis Step (Tutorial pages 27 – 28).
Filter by Taxonomy on the SSN Finalization tab of the DATASET COMPLETED page for the UniRef90 cluster SSN for the superfamily (Figure 1B) was used to generate the same taxonomy category-filtered UniRef90 cluster SSNs described in the previous section. The resulting SSNs are identical (same numbers of nodes and edges with the same layout in Cytoscape) to those generated as described in the previous section.
EFI-EST Families Option, Filter by Taxonomy in the Generate Step (Tutorial pages 29 – 31).
The same taxonomy category-filtered UniRef90 cluster SSNs were generated in separate EFI-EST Family Option jobs. The resulting SSNs are identical (same numbers of nodes and edges with the same layout in Cytoscape) to those generated as described in the previous two sections.
Genome context.
The minimum edge alignment score (240) used to generate the SSNs separates the SwissProt-curated functions into different clusters [5]. EFI-GNT generates genome neighborhood networks (GNNs) for the clusters so that co-occurring genome proximal proteins can be identified that participate in a metabolic pathway with the members of the superfamily. EFI-GNT also retrieves genome neighborhood diagrams (GNDs) for visualization of conserved genome context. The taxonomy category-specific SSNs described in the Taxonomy Tool Families Option, with transfer of UniRef90 cluster IDs to the EFI-EST Accession IDs Option section were transferred to EFI-GNT; the output files for these jobs, including the GNNs and GNDs, are available on the Training page.
Chemically guided functional profiling.
In our 2019 publication [5], we used EFI-CGFP to determine the human metagenome abundance of the isofunctional clusters in the SSN for the superfamily. The taxonomy category-specific SSNs described in the Taxonomy Tool Families Option, with transfer of UniRef90 cluster IDs to the EFI-EST Accession IDs Option section were submitted to EFI-CGFP; the output files for these jobs, including the heat maps and boxplots for metagenome abundance, also are available on the Training page.
Cluster Analysis.
The Cluster Analysis utility generates the MSA, WebLogo, and Skylign HMM for each cluster in the input SSN. These can be inspected to identify conserved residue motifs that may provide information useful for identifying isofunctional families. The SSNs for the various taxonomy categories described in the Taxonomy Tool Families Option, with transfer of UniRef90 cluster IDs to the EFI-EST Accession IDs Option section were submitted to the Cluster Analysis utility, selecting Cys for highlighting conservation and position in the WebLogo; the output files for these jobs are available on the training page.
In each SSN, the MSA (Figure 2A), WebLogo (Figure 2B) and Skylign HMM (Figure 2C) allow easy visualization of the two conserved sequence proximal Cys residues in the cluster with the largest number of SSN UniRef90 nodes (designated “Node Cluster 1” in the utility output, numbered in order of decreasing number of nodes) and UniProt IDs (designated “Sequence Cluster 1” in the utility output, numbered in order of decreasing number of UniProt IDs); the Node Cluster and Sequence Cluster numbers are node attributes in the Color SSN generated by the Color SSNs and Cluster Analysis utilities. This CC motif is diagnostic of the pyruvate formate lyase (PFL) function. The Cluster Analysis utility also provides a file that identifies MSA positions in which Cys occurs with a range of percent conservation (decreasing from 90% to 10%, in 10% intervals; Figure 2D). Finally, the Cluster Analysis utility provides length histograms for the UniRef clusters and UniProt IDs in each cluster (Figure 2E).
Neighborhood Connectivity utility.
To illustrate the new Neighborhood Connectivity utility, UniRef90 cluster SSNs for the complete sequences were generated by increasing the minimum edge alignment score from 90 to 240 in increments of 30 and transferring the SSNs to the utility. As the alignment score threshold increases to 240, large multifunctional clusters are segregated into smaller isofunctional clusters. The emergence of isofunctional clusters in multifunctional clusters can be visualized using the colors assigned to nodes according to the number of edges to other nodes in the cluster; these SSNs are displayed in Figure 3.
Taxonomy Tool and Filter by Taxonomy: RS Superfamily
Radical SAM (RS) superfamily.
To illustrate that both the Taxonomy Tool and Filter by Taxonomy can handle large numbers of sequences, we generated taxonomy category-filtered UniRef90 cluster SSNs for the RS superfamily [11, 15–18], arguably the largest functionally and mechanistically diverse enzyme superfamily, with its members catalyzing a wide variety of reactions initiated by abstraction of a hydrogen atom from the substrate. The sequences contain a conserved Cx3Cx2C motif located near the N-terminus of a (β/α)6-partial barrel domain; the Cys residues participate in a 4Fe-4S cluster that binds S-adenosyl-L-methionine (SAM). One electron reduction of the cluster results in homolytic cleavage of the C5’-S bond of the SAM to yield the 5’-deoxyadenosyl radical that mediates hydrogen atom abstraction.
Taxonomy Sunbursts (Tutorial pages 32 – 42).
The Taxonomy Tool Families Option was used with UniProt Release 2022_04 to generate three Taxonomy Sunbursts, one including both fragments and complete sequences, the second only complete sequences, and the third complete sequences with ≥140 residues (“full-length” sequences; vide infra). As shown in the Taxonomy Sunbursts, the superfamily contains 773,426 total UniProt entries (fragment and complete; 692,220 unique sequences determined using CD-HIT) and 724,116 complete UniProt entries (643,373 unique sequences). The members of the anaerobic ribonucleotide reductase activating enzyme family within the RS superfamily have the shortest sequences (≥140 residues) [11]; we used this minimum length to remove truncated sequences and identified 717,940 “full-length” UniProt entries (637,424 unique sequences).
UniRef50 Cluster SSN (Tutorial pages 43 – 46).
The UniRef50 cluster SSN was generated using the EFI-EST Families Option; an alignment score threshold of 11 and a minimum length filter of 140 residues were selected to finalize the SSN. The SSN (63,359 nodes and 65,099,366 edges) can be analyzed with a Mac Pro computer with 1.5TB RAM (Figure 4A); the nodes were colored according to the Structure-Function Linkage Database subgroups [11, 18]. In the RadicalSAM.org resource [11], we use the UniRef50 cluster SSN to enable separation of the superfamily into subgroups so that higher resolution UniRef90 cluster SSNs for the subgroups can be generated.
Figure 4. UniRef90 Cluster SSNs for the RS Superfamily.
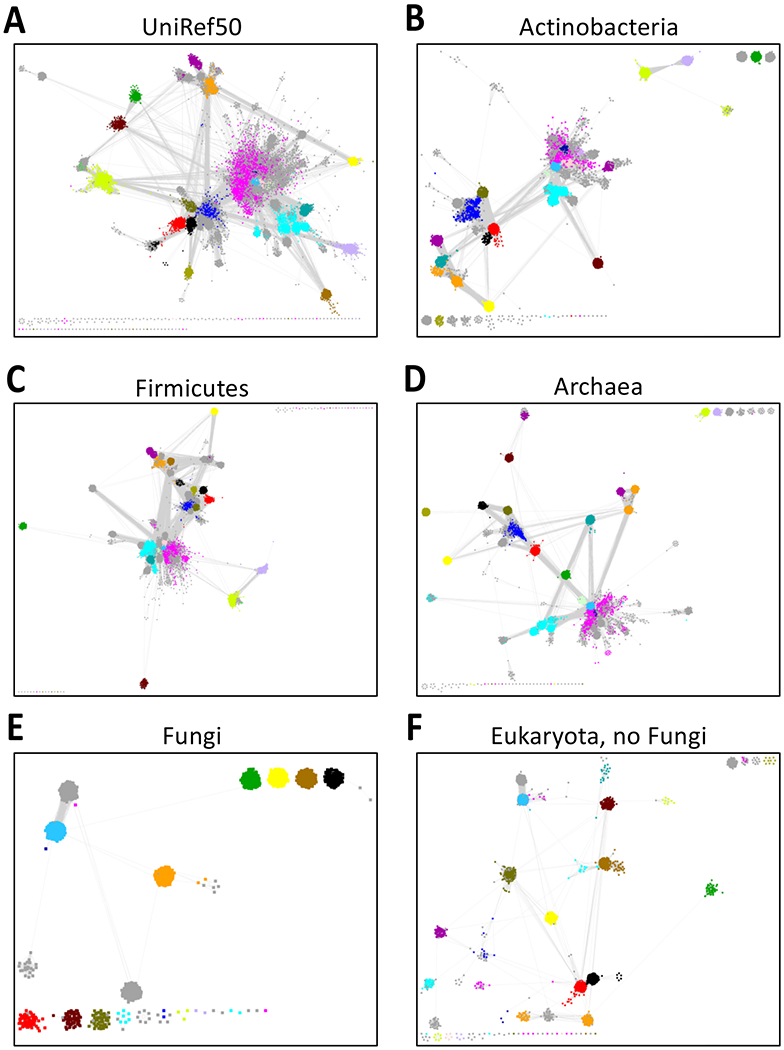
Panel A, UniRef50 cluster SSN for the complete sequences in the RS superfamily generated as described in the Supplementary Tutorial for the RS superfamily with an alignment score threshold of 11 and a minimum length 140 residues. In this and the other panels, the nodes are colored using the BridgeDb app in Cytoscape with the colors used for the RS superfamily subgroups by the Structure-Function Linkage Database (SFLD) [11, 18]. Panel B, Taxonomy category-filtered UniRef90 cluster SSN for superkingdom Bacteria, phylum Actinobacteria generated as described in the Supplementary Tutorial using the Taxonomy Tool Families Option with transfer of the UniRef90 cluster IDs to the EFI-EST Accession IDs Option; the SSN contains 27,953 nodes and 20,427,812 edges. Panel C, UniRef90 cluster SSN for superkingdom Bacteria, phylum Firmicutes; the SSN contains 52,421 nodes and 61,254,499 edges. Panel D, UniRef90 cluster SSN for superkingdom Archaea; the SSN contains 36,996 nodes and 27,905,053 edges. Panel E, UniRef90 cluster SSN for superkingdom Eukaryota, Fungi only; the SSN contains 3,341 nodes and 715,572 edges. Panel F, UniRef90 cluster SSN for superkingdom Eukaryota, no Fungi; the SSN contains 8,266 nodes and 3,859,620 edges.
UniRef90 Cluster SSN (Tutorial pages 47 – 49).
The UniRef90 cluster SSN was generated using the EFI-EST Families Option; again; an alignment score threshold of 11 and a minimum length filter of 140 residues were selected to finalize the SSN. The SSN is extremely large (348,446 nodes and 2,583,616,067 edges); EFI-EST did not generate the xgmml file (edge maximum for generating an SSN is 200,000,000). However, as described in the EFI-EST Families Option, Filter by Taxonomy in the Analysis Step section below, this generate job can be used with Filter by Taxonomy in the Analysis step to generate taxonomy category-filtered SSNs that can be analyzed with Cytoscape.
Taxonomy category-filtered UniRef90 cluster SSNs that can be analyzed with Cytoscape were generated by the three methods described in the following sections.
Taxonomy Tool Families Option, with transfer of UniRef90 cluster IDs to the EFI-EST Accession IDs Option (Tutorial pages 50 – 58).
The Taxonomy Sunburst for the “complete” entries (Figure 1A) was used with the Transfer to EFI-EST feature to generate taxonomy category-filtered UniRef90 cluster SSNs: superkingdom Bacteria, phylum Actinobacteria (Figure 4B); superkingdom Bacteria, phylum Bacteroidetes; superkingdom Bacteria, phylum Firmicutes (Figure 4C); superkingdom Archaea (Figure 4D) and two subsets of superkingdom Eukaryota, Fungi (Figure 4E) and Eukaryota, no Fungi (Figure 4F).
The UniRef90 cluster SSN for superkingdom Bacteria, phylum Proteobacteria is too large to be analyzed with Cytoscape (102,114 nodes and 250,587,566 edges). However, UniRef90 cluster SSNs were generated and could be analyzed for classes within the Proteobacteria phylum: Alphaproteobacteria, Betaproteobacteria, Gammaproteobacteria, Deltaproteobacteria, and Epsilonproteobacteria.
EFI-EST Families Option, Filter by Taxonomy in the Analysis Step (Tutorial pages 59 – 61).
Filter by Taxonomy on the SSN Finalization tab of the DATASET COMPLETED page for the UniRef90 cluster SSN for the superfamily was used to generate the taxonomy category-filtered UniRef90 cluster SSNs described in the previous section. The resulting SSNs are identical (same numbers of nodes and edges with the same layout in Cytoscape) to those generated as described in the previous section.
EFI-EST Families Option, Filter by Taxonomy in the Generate Step (Tutorial pages 62 – 64).
The same taxonomy category-filtered UniRef90 cluster SSNs were generated in separate jobs using the EFI-EST Family Option with the list of Pfam and InterPro and/or domains and separately selecting the taxonomy categories used to generate the Taxonomy Sunburst and the UniRef90 cluster SSN for the entire superfamily. The resulting SSNs are identical (same numbers of nodes and edges with the same layout in Cytoscape) to those generated as described in the previous two sections.
Comparison of the high-resolution taxonomy category-specific UniRef90 cluster SSNs (Figures 4B–4F) with the lower resolution UniRef50 cluster SSN for the entire superfamily (Figure 4A) suggests that the UniRef90 cluster SSNs for taxonomy categories will facilitate identification and functional characterization of isofunctional families in the RSS. Separation of the subgroups by manual deletion of the connecting edges (as used by RadicalSAM.org to separate the subgroup) provides facile access to the enzymatic activities/metabolic functions in the various taxonomy categories.
Conclusions
We hope that this article will convince readers to use the tools provided by the EFI’s web resource, now including the ability to generate high resolution SSNs for taxonomy categories within large (super)families to better explore sequence-function space. The tools are available without charge. As noted earlier, the tools have been used by >9700 users, >90,000 EFI-EST jobs have been run, and >680 articles have been published that cite the tools, confirming their utility in generating hypotheses to guide experimental verification of novel in vitro enzymatic activities and in vivo metabolic functions of uncharacterized enzymes/proteins.
Supplementary Material
Highlights.
The Enzyme Function Initiative (EFI) provides “user-friendly” web tools that guide experimental approaches for assigning functions to uncharacterized proteins.
EFI-EST to generate sequence similarity networks (SSNs) for protein families/groups of homologous proteins.
EFI-GNT to generate genome neighborhood networks (GNNs) and genome neighborhood diagrams (GNDs; genome context for bacterial, archaeal and fungal proteins) for clusters in SSNs.
EFI-CGFP for chemically guided functional profiling (CGFP) to determine human metagenome abundance for clusters in SSNs.
Taxonomy Tool and the Filter by Taxonomy to generate SSNs for specific taxonomic categories, reducing the sizes of the SSNs to allow higher resolution analyses of sequence-function space.
Cluster Analysis, Convergence Ratio, and Neighborhood Connectivity utilities to provide multiple sequence alignments, WebLogos, hidden Markov models, length histograms, convergence ratios, and neighborhood connectivity for clusters in SSNs.
Acknowledgements
We thank Professor Douglas A. Mitchell for helpful comments. The web resource has been supported by U54GM093342 (5/20/2010 – 6/15/2016), P01GM118303 (6/15/2016 – 12/31-2021), and, currently, R24GM141196 (1/1/2022 – 12/31/2026).
Footnotes
Publisher's Disclaimer: This is a PDF file of an unedited manuscript that has been accepted for publication. As a service to our customers we are providing this early version of the manuscript. The manuscript will undergo copyediting, typesetting, and review of the resulting proof before it is published in its final form. Please note that during the production process errors may be discovered which could affect the content, and all legal disclaimers that apply to the journal pertain.
Software Availability
The source code is available at https://github.com/EnzymeFunctionInitiative.
Supplementary Figures and Tutorials
The Supplementary Figures cited in the text are provided in the Supplementary Figures file. The tutorials describing the use of the Taxonomy Tool and Filter by Taxonomy to generate taxonomy category-filtered SSNs for the GRE and RS superfamilies are provided in the Supplementary Tutorials file.
Declaration of interests
The authors declare that they have no known competing financial interests or personal relationships that could have appeared to influence the work reported in this paper.
References
- [1].Schnoes AM, Brown SD, Dodevski I, Babbitt PC. Annotation error in public databases: misannotation of molecular function in enzyme superfamilies. PLoS Comput Biol. 2009;5:e1000605. [DOI] [PMC free article] [PubMed] [Google Scholar]
- [2].Rembeza E, Engqvist MKM. Experimental and computational investigation of enzyme functional annotations uncovers misannotation in the EC 1.1.3.15 enzyme class. PLoS Comput Biol. 2021;17:e1009446. [DOI] [PMC free article] [PubMed] [Google Scholar]
- [3].Gerlt JA, Allen KN, Almo SC, Armstrong RN, Babbitt PC, Cronan JE, et al. The Enzyme Function Initiative. Biochemistry. 2011;50:9950–62. [DOI] [PMC free article] [PubMed] [Google Scholar]
- [4].Gerlt JA, Bouvier JT, Davidson DB, Imker HJ, Sadkhin B, Slater DR, et al. Enzyme Function Initiative-Enzyme Similarity Tool (EFI-EST): A web tool for generating protein sequence similarity networks. Biochim Biophys Acta. 2015;1854:1019–37. [DOI] [PMC free article] [PubMed] [Google Scholar]
- [5].Zallot R, Oberg N, Gerlt JA. The EFI Web Resource for Genomic Enzymology Tools: Leveraging Protein, Genome, and Metagenome Databases to Discover Novel Enzymes and Metabolic Pathways. Biochemistry. 2019;58:4169–82. [DOI] [PMC free article] [PubMed] [Google Scholar]
- [6].Gerlt JA. Genomic Enzymology: Web Tools for Leveraging Protein Family Sequence-Function Space and Genome Context to Discover Novel Functions. Biochemistry. 2017;56:4293–308. [DOI] [PMC free article] [PubMed] [Google Scholar]
- [7].Carter MS, Zhang X, Huang H, Bouvier JT, Francisco BS, Vetting MW, et al. Functional assignment of multiple catabolic pathways for D-apiose. Nat Chem Biol. 2018;14:696–705. [DOI] [PMC free article] [PubMed] [Google Scholar]
- [8].Zallot R, Oberg NO, Gerlt JA. ‘Democratized’ genomic enzymology web tools for functional assignment. Curr Opin Chem Biol. 2018;47:77–85. [DOI] [PMC free article] [PubMed] [Google Scholar]
- [9].Stack TMM, Gerlt JA. Discovery of novel pathways for carbohydrate metabolism. Curr Opin Chem Biol. 2021;61:63–70. [DOI] [PMC free article] [PubMed] [Google Scholar]
- [10].Zallot R, Oberg N, Gerlt JA. Discovery of new enzymatic functions and metabolic pathways using genomic enzymology web tools. Curr Opin Biotechnol. 2021;69:77–90. [DOI] [PMC free article] [PubMed] [Google Scholar]
- [11].Oberg N, Precord TW, Mitchell DA, Gerlt JA. RadicalSAM.org: A Resource to Interpret Sequence-Function Space and Discover New Radical SAM Enzyme Chemistry. ACS Bio Med Chem Au. 2022;2:22–35. [DOI] [PMC free article] [PubMed] [Google Scholar]
- [12].Gonzalez JM. Visualizing the superfamily of metallo-beta-lactamases through sequence similarity network neighborhood connectivity analysis. Heliyon. 2021;7:e05867. [DOI] [PMC free article] [PubMed] [Google Scholar]
- [13].Levin BJ, Huang YY, Peck SC, Wei Y, Martinez-Del Campo A, Marks JA, et al. A prominent glycyl radical enzyme in human gut microbiomes metabolizes trans-4-hydroxy-l-proline. Science. 2017;355. [DOI] [PMC free article] [PubMed] [Google Scholar]
- [14].Backman LRF, Funk MA, Dawson CD, Drennan CL. New tricks for the glycyl radical enzyme family. Crit Rev Biochem Mol Biol. 2017;52:674–95. [DOI] [PMC free article] [PubMed] [Google Scholar]
- [15].Sofia HJ, Chen G, Hetzler BG, Reyes-Spindola JF, Miller NE. Radical SAM, a novel protein superfamily linking unresolved steps in familiar biosynthetic pathways with radical mechanisms: functional characterization using new analysis and information visualization methods. Nucleic Acids Res. 2001;29:1097–106. [DOI] [PMC free article] [PubMed] [Google Scholar]
- [16].Frey PA, Hegeman AD, Ruzicka FJ. The Radical SAM Superfamily. Crit Rev Biochem Mol Biol. 2008;43:63–88. [DOI] [PubMed] [Google Scholar]
- [17].Booker SJ, Lloyd CT. Twenty Years of Radical SAM! The Genesis of the Superfamily. ACS Bio & Med Chem Au. 2022;2:538–47. [DOI] [PMC free article] [PubMed] [Google Scholar]
- [18].Holliday GL, Akiva E, Meng EC, Brown SD, Calhoun S, Pieper U, et al. Atlas of the Radical SAM Superfamily: Divergent Evolution of Function Using a “Plug and Play” Domain. Methods Enzymol. 2018;606:1–71. [DOI] [PMC free article] [PubMed] [Google Scholar]
- [19].Atkinson HJ, Morris JH, Ferrin TE, Babbitt PC. Using sequence similarity networks for visualization of relationships across diverse protein superfamilies. PLoS One. 2009;4:e4345. [DOI] [PMC free article] [PubMed] [Google Scholar]
- [20].Akiva E, Copp JN, Tokuriki N, Babbitt PC. Evolutionary and molecular foundations of multiple contemporary functions of the nitroreductase superfamily. Proc Natl Acad Sci U S A. 2017;114:E9549–E58. [DOI] [PMC free article] [PubMed] [Google Scholar]
- [21].Copp JN, Akiva E, Babbitt PC, Tokuriki N. Revealing Unexplored Sequence-Function Space Using Sequence Similarity Networks. Biochemistry. 2018;57:4651–62. [DOI] [PubMed] [Google Scholar]
- [22].Burroughs AM, Glasner ME, Barry KP, Taylor EA, Aravind L. Oxidative opening of the aromatic ring: Tracing the natural history of a large superfamily of dioxygenase domains and their relatives. J Biol Chem. 2019;294:10211–35. [DOI] [PMC free article] [PubMed] [Google Scholar]
- [23].Copp JN, Anderson DW, Akiva E, Babbitt PC, Tokuriki N. Exploring the sequence, function, and evolutionary space of protein superfamilies using sequence similarity networks and phylogenetic reconstructions. Methods Enzymol. 2019;620:315–47. [DOI] [PubMed] [Google Scholar]
Associated Data
This section collects any data citations, data availability statements, or supplementary materials included in this article.