

Summary
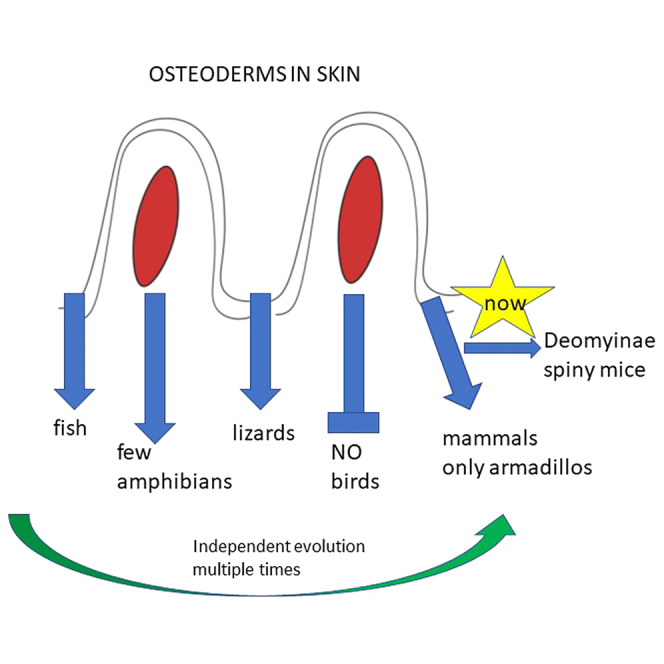
Osteoderms are bony plates found in the skin of vertebrates, mostly commonly in reptiles where they have evolved independently multiple times, suggesting the presence of a gene regulatory network that is readily activated and inactivated. They are absent in birds and mammals except for the armadillo. However, we have discovered that in one subfamily of rodents, the Deomyinae, there are osteoderms in the skin of their tails. Osteoderm development begins in the proximal tail skin and is complete 6 weeks after birth. RNA sequencing has identified the gene networks involved in their differentiation. There is a widespread down-regulation of keratin genes and an up-regulation of osteoblast genes and a finely balanced expression of signaling pathways as the osteoderms differentiate. Future comparisons with reptilian osteoderms may allow us to understand how these structures have evolved and why they are so rare in mammals.
Subject areas: Comparative anatomy, Zoology, Evolutionary biology, Developmental biology
Graphical abstract
Highlights
-
•
Osteoderms are most common in reptiles, evolving independently at least twenty times
-
•
In living mammals osteoderms are rare, present only in armadillos
-
•
Now osteoderms are present in a subfamily of rodents which includes the spiny mouse
-
•
We can now investigate the cellular and molecular basis of evolutionary novelties
Comparative anatomy; Zoology; Evolutionary biology; Developmental biology
Introduction
The bones in the vertebrate skeleton develop from two independently derived pathways: the majority of the postcranial skeleton and chondrocranium is of endochondral origin where a cartilaginous model is first formed which then mineralizes, while the bones of the dermatocranium (the skull roof, jaw) and clavicles develop intramembranously by direct ossification within a matrix of collagen. The origins of these two pathways can be traced back to the earliest jawless fish. Ostracoderms and their jawed descendants, placoderms, were covered in bony plates of dermal or integumentary bone, which represented the dominant bony structures of these organisms, and are considered to be the evolutionary precursor to the bones of the dermatocranium.1,2 The endoskeleton of these early vertebrates was entirely cartilaginous, mineralizing in Osteichthyes and forming the endochondral skeleton. The relative proportions of these two bone-forming systems reversed early in the evolutionary history of bony vertebrates, with a reduction of the dermal skeleton and the endoskeleton mineralizing and taking on a more dominant role to permit a greater degree of movement. Nevertheless, the dermal skeleton has been retained in the bones of the vertebrate dermatocranium and the scales of modern-day fish, which have a plate of dermal bone, much reduced in size from the ancestral form, but derived from a common ancestral integumentary element.3 Noncranial dermal bones are retained in tetrapods in the form of osteoderms, clavicles, and the furcula.4 Osteoderms occur in numerous lineages of extinct reptiles and amphibians and are common in lizards,5,6 crocodiles,7,8 turtles,9 and some families of lissamphibians.10 They are entirely absent in birds, but are known in one genus of theropod dinosaur, Ceratosaurus,11 as well as from numerous ornithischian and sauropod dinosaurs. Dermal skeletal elements are broadly absent in mammals, but occur in several xenarthrans, including all know species of Cingulata, e.g., armadillos and some giant ground sloths.12,13,14 Osteoderms are clearly homoplastic structures having independently re-evolved with different designs at least nineteen times in amniotes (Pareiasauria, Pantestudines, Hupehsuchia, Archosauria—independently evolving in pseudosuchians, thyreophorids, titanosaurs, and therapods—Placodontia, Xenarthra, Eutipotyphla, Rhynchocepahia, and eight independent origins in Squamata—lacertids, scincoids, anguimorphs, one species of dwarf chameleon, and three divergent lineages of gecko).15 However their common features such as the ability of groups of cells to undergo mineralization within a well-structured dermis and having a hierarchical structure with collagen fibers joining more rigid units, thereby increasing flexibility without significantly sacrificing strength,16 may represent a deep molecular/developmental homology that has facilitated the repeated evolution of these structures.
Non-avian reptiles, which have an integument covered with keratinized scales and scutes, have re-evolved osteoderms an inordinate number of times. Mammals, having evolved hairs, seem to have taken a different route and have undergone modifications of the epidermis rather than the dermis for protection. Thus we see the modified guard hairs of hedgehogs, porcupines and echidnas, the ectodermal scales of pangolins or the keratinized horns of many herbivores. The only mammals that possess osteoderms are armadillos and their extinct xenarthran relatives, an extinct hedgehog-like creature from the early Eocene of Europe and, as identified in this study, one subfamily of rodents.13,17 The absence of a readily accessible and genetically tractable mammalian model of osteoderm development has prevented a deeper understanding of their evolution and the elaboration of the gene regulatory networks involved. However, we can now make molecular progress because we have discovered the presence of osteoderms in the tails of a subfamily of rodents, the Deomyinae, comprising four genera—the spiny mouse Acomys, the brush-furred mouse Lophuromys, the link rat Deomys and Rudd’s mouse Uranomys, by CT scanning. Using Acomys cahirinus from our in-house colony we describe the structure and development of osteoderms in the tail which develop in a proximal to distal and dorsal to ventral sequence over a 6-week period postnatally. We use histological, immunohistochemical and molecular analyses including RNA sequencing to identify which gene regulatory networks are involved in their development which together suggests a deep molecular homology exists in the mammalian dermis that can be activated at any time in evolution.
Results
Identification of osteoderms by CT scanning
CT scans from adult museum specimens of Acomys, Lophuromys, Uranomys, and Deomys revealed a series of dense, imbricate structures embedded in the caudal dermis (Figures 1A–1D). These structures comprise a series of 8–11 rectangular plates arranged in rings around the tail. Internal densities of the proximal structures are similar to that of the long bones, and the structures decrease in density as they approach the distal tip of the tail. NanoCT scans of Acomys osteoderms revealed both osteocyte lacunae (volume approx. 500um3) and areas of non-mineralization (Figure S1). For comparison, scans of the armadillo (Figures 1E and F) and a squamate, the spiny-tailed skink were obtained (Figure 1G) which revealed a similar arrangement of dermal overlapping plates to the Deomyinae osteoderms. In particular the imbricate osteoderms in the squamate Elgaria hosmeri (Figure 1G) looked strikingly similar to these rodent tails.
Figure 1.

CT images of osteoderms
(A–G) CT datasets showing (from left to right) 3D renders of whole body scans and magnified caudal/dorsal osteoderms, sagittal tomograms, and transverse tomograms of (A) Acomys cahirinus UF:Mammals:29706, (B) Lophuromys flavopunctatus ummz:mammals:114774, (C) Uranomys ruddi AMNH:mammals:M−239548, (D) Deomys ferruguineus AMNH:mammals:M−50464, (E) Cabassous chacoensis UF:mammals:20650, (F) Chlamyphorus truncatus fmnh:mammals:39468, and (G) Egernia hosmeri UF:herp:80342. Osteoderms colorized by thickness. All scale bars = 10 mm. See also Figure S1.
A developmental series of post-natal Acomys specimens beginning immediately after birth was then scanned (Figure 2A). This revealed the presence of osteoderms in the proximal part of the tail and their absence in the distal part of the tail. Osteoderms were not present throughout the tail including the distal tip in these scan images until at least 6 weeks of age.
Figure 2.

Development of osteoderms in Acomys
(A) Timed series of scans of Acomys cahirinus from postnatal day 1 (far left) to 2 years adult (far right) showing the presence of osteoderms initially only in the proximal part of the tail and then spreading throughout. Scale bar = 10 mm.
(B) Alizarin red stained newborn tail (upper) showing the presence of osteoderms in the proximal half and their absence in the distal half. A close-up of each white box is shown below revealing their regular patterning (with holes in each osteoderm) and their pattern of differentiation starting on the dorsal surface and spreading ventrally.
The absence of osteoderms in the distal newborn tail of Acomys was confirmed using Alizarin red stained preparations (Figure 2B). Here it can be seen that osteoderms appear in a gradient of differentiation beginning dorsally with one or two regions of differentiation and then their appearance progress circumferentially to the ventral surface while the original ones on the dorsal surface expand and grow (Figure 2B). There is therefore a gradient of differentiation both from proximal to distal and from dorsal to ventral. It was also apparent that the differentiated osteoderms contained one or more areas that are not mineralized (Figure 2B, left panels, Figure S1). Histological sections revealed that these non-mineralized areas are clear gaps in the osteoderm (e.g. Figure 3D) rather than consisting of non-mineralized osteoid and these likely become the neurovascular canals seen in the adult osteoderm (Figures 4H–4J).
Figure 3.

Histological development of Acomys osteoderms
(A–C) Sections through newborn tail skin showing osteoderms in the proximal (A), middle (B), but not the distal third (C).
(D–F) Sections through 2 week-old tail skin showing osteoderms in the proximal (D), middle (E), but not the distal third (F).
(G–I) Sections through 6 week-old tail skin showing osteoderms in the proximal (G), middle (H), and their first appearance in the distal third (I, red arrows). J–O, Osteoderm development with Ost immunhistochemistry.
(J) Ost+ve dermal cells first appear scattered in the dermis surrounded by large spaces in the dermal matrix particularly under the epidermis (red stars). Hfe = hair follicle.
(K) Strong Ost+ve staining is present in cells aggregating in the middle of the dermis between the epidermis and hair follicle. Large spaces are still seen immediately below the epidermis.
(L) More Ost+ve cells appear and clump together in the dermis.
(M) A matrix (red arrows) appears in the center of the Ost+ve cells creating a central space.
(N) Lower power view showing the aggregation of Ost+ve cells with a central matrix (red arrows) being secreted.
(O) fully formed osteoderms surrounded by Ost+ve cells and Ost-ve cells in the center surrounded by the bony matrix. A–I bar = 100 μm; J–M bar = 30 μm; N–O bar = 100 μm.
Figure 4.

Adult Acomys osteoderm structure
(A) External view of the adult Acomys tail showing the regular grouping of 3 hairs (brackets) appearing underneath an osteoderm. The 2 large hairs are awl hairs and the smaller central hair of the three is a guard hair.
(B) Alizarin stained preparation of the adult Acomys tail showing the formation of a continuous circle of dermal bone with each concentric ring slightly overlapping the adjacent one. Also seen are canals (darker dots) in each osteoderm.
(C) High power view of an Alizarin stained osteoderm showing the canals.
(D) Transverse section of the skin removed from the adult Acomys tail showing how the osteoderms form complete ring of bone in the dermis.
(E) Longitudinal section through the skin of the adult Acomys tail showing that the osteoderms are immediately below the epidermis, the hair follicles are between each osteoderm (hf) and the osteoderms are either bound together by connective tissue (ct) or are adjacent to adipose tissue (ad) depending on the relative position of two osteoderms. The white arrow shows a canal.
(F) High power view of the relation between the epidermis (ep) and the dorsal surface of the osteoderm (ost) below showing that there is a 2–3 cell layer of dermal cells (d) between.
(G) The ventral surface of the osteoderm (ost) has far fewer dermal cells present (d) below it and there are flattened cells between the two resembling a periosteum (p).
(H) Section through an adult osteoderm showing a neurovascular canal (c) passing through it from dorsal to ventral.
(I) High power view of a canal showing red blood cells (red arrows) in a capillary entering a canaliculus.
(J)Aanother view of a capillary entering a canal identified with red arrows. D–J, haematoxylin and eosin staining. A–B bar = 500 μm; C bar = 100 μm; D–E bar = 50 μm; F–G bar = 20 μm; H bar = 250 μm; I–J bar = 20 μm.
Post-natal development of osteoderms in Acomys
A developmental series of tail skin from newborn to 6 weeks of age was used to cut sections through the proximal third, the middle third and the distal third. The newborn tail had osteoderms present in the proximal third (Figure 3A) and middle third (Figure 3B) of the tail, but they were absent in the distal third of the tail (Figure 3C). The same situation was present in 4-day-old tails (not shown), 1-week-old tails (not shown), and 2-week-old tails (Figures 3D–3F). It was not until 6 weeks of age when approaching sexual maturity that osteoderms first appeared in the distal third of the tail as thin plates of bone (Figure 3I). By this time the proximal osteoderms had grown considerably in length and particularly in thickness (Figure 3G). For this post-natal period of time, therefore, there was a gradient of osteoderm development along the tail which allowed us the opportunity to study their histological and molecular characteristics as osteoderms developed.
We used an antibody to Osterix (Ost) (the gene Sp7) which is a transcription factor involved in the development of osteoblasts, to understand how and where these osteoderms develop. The first appearance of Ost +ve cells is in individual fibroblast-like cells in the dermis that are sandwiched between the external epidermis and the ectoderm of the hair follicle (Figure 3J). These Ost+ve cells increase in number and intensity of staining (Figure 3K) within a dermal matrix which was replete with vacuole-like cavities (red stars in Figure 3J). Only a minority of these cavities is capillaries based on the presence of red blood cells and the remainder are not adipocytes based on the lack of staining with a perilipin antibody (data not shown). Thus the nature of these cavities is mysterious, but they are seen at all stages of osteoderm development and are particularly noticeable immediately underneath the epidermis between the basal epidermal cells and the dermal fibroblasts (Figures 3J–3M). The number of Ost +ve cells increases over time and they aggregate to form an elongated and widening accumulation of cells (Figures 3L and 3M) which at its proximal region begins to secrete an extracellular matrix (red arrows in Figures 3M and 3N). As the matrix continues to be synthesized and the elongated and thin shape of the osteoderm appears, the osteoblasts within the matrix cease expressing Osterix whereas those at the edge (presumably continuing to secrete bone matrix) continue to express Osterix and generate a ring of +ve cells around the osteoderm (Figure 3O).
Histological structure of adult osteoderms in Acomys
Adult Acomys have osteoderms along the whole length of their tails and they are arranged in overlapping plates with each plate having two awl hairs (thicker ones) and a central guard hair (thinner one) emerging below it (Figure 4A). In Alizarin red preparations the osteoderms generate rings of bone each with a slight overlap to the next ring distally to it and an offset of half an osteoderm in the circumferential axis (Figure 4B) and the neurovascular canals can readily be seen (Figure 4C). This arrangement creates a complete circle of bone (Figure 4D) surrounding the vertebrae and spinal cord of the tail. In a section through the longitudinal axis (Figure 4E) the regular sequential arrangement of osteoderms with hairs emerging between them can readily be seen.
Mature osteoderms are cellular (Figures 4E and 4H) with the cell bodies embedded in a lacuna (Figures 4F, 4G, 4I, and 4J). The dorsal surface of each osteoderm is adjacent to the epidermis of the tail with a 3–4 cell thick dermis in between (Figure 4F) and no obvious cell layer such as a periosteum being present. The ventral surface of the osteoderm has a flattened cell layer with a resemblance to a periosteum and below that is a loose connective tissue of the dermis (Figure 4G). The ventral surface of the osteoderm is adjacent to either the adipose cells of the hypodermis (ad in Figure 4E) or embedded in the connective tissue of the dermis (ct in Figure 4E) depending on the mediolateral plane of section. It can be seen that this dermal connective tissue binds two adjacent osteoderms together (ct in Figure 4E). In between each osteoderm, a hair follicle is present (hf in Figure 4E). Neurovascular canals can also be seen running through the osteoderms (white arrow in Figure 4E) which run from the dorsal to the ventral surface (c in Figure 4H) and contain capillaries (Figures 4I and 4J), perhaps functioning to provide the metabolic requirements of the osteoblasts within the osteoderm or to enable the vasculature to reach the layer of dermis between the dorsal surface of the osteoderm and the epidermis.
All of these data were obtained from Acomys because although the other genera have osteoderms (Figures 1B–1D) we have not obtained any living specimens to examine the development of these structures.
Molecular development of osteoderms
To identify the molecular players in the development of osteoderms, we performed a transcriptome analysis using bulk RNA sequencing. Newborn Acomys tails were divided into 3 equal parts—proximal (with osteoderms), middle (osteoderms developing), distal (no osteoderms), and the proximal vs. distal segments assayed in 6 replicates. The skin was removed from the underlying vertebrae and used for extracting total RNA having first removed a segment of each sample for histology to confirm the presence (proximal skin) or absence (distal skin) of osteoderms. Sequencing libraries were prepared from the extracted total RNA of each skin sample and sequenced on an Illumina NovaSeq6000 platform, yielding approximately 898 million paired-end, 150 bp length reads. Analysis using fastQC indicated that all 12 libraries passed standard quality control assessments following trimming of low-quality reads and adapter sequences, and all libraries were utilized in downstream analyses.
A transcriptome cataloging gene expression in the developing spiny mouse tail was assembled using the Acomys skin transcriptome (accession #GSE11308118) as a reference. HISAT219 and StringTie20 were used to align and assemble the trimmed paired-end reads, respectively and featurecounts used to determine counts per transcript (https://figshare.com/articles/dataset/Supplemental_Tables/21971018). Counts for transcripts sharing the same Trinity cluster and gene designation were collapsed essentially converting counts/isoform to counts/gene (https://figshare.com/articles/dataset/Supplemental_Tables/21971018). Differential expression analysis using edgeR with a paired sample design in the gene level counts data identified 4366 genes with differential expression in proximal and distal tail skin, with 1814 genes f-interest and 2552 up-regulated at an adjusted p value of 0.05 (https://figshare.com/articles/dataset/Supplemental_Tables/21971042, Figure S2). The counts data converted to log2 CPM (counts per million) for genes exhibiting significant differential expression (p value ≥ 0.05) and log2FC ≥ 2 were hierarchically clustered and exhibited as a gplots heatmap2 plot (Figure S3). Hierarchical clustering visualizing differences in gene expression between proximal and distal skin across all significantly differentially expressed genes (Figure S4) separates treatment groups (proximal/distal) but indicates variation between individuals.
The top 20 up-regulated (‘+’ log2FC) and the top twenty down-regulated (‘-‘ log2FC) genes between Acomys proximal vs. distal tail skin samples that can be annotated by similarity to Mus orthologues are shown in Table 1. These counts data converted to log2 CPM (counts per million) were hierarchically clustered and exhibited as a gplots heatmap.2 function (Figure 5). Inter-sample variation in gene expression is clear in both the heatmap of all significant genes exhibiting a log2 fold change of ≤2 and the heatmap displaying hierarchical clustering of the top 25 up- and top 25 down-regulated transcripts. A non-clustered heatmap (Figure S5) of the top 25 up- and 25 down-regulated genes data displaying paired proximal – distal samples side by side and gene order from top-up to top-down (same order as Table 1) further illustrates the inter-sample variation but makes clear that the trends in genes expression between distal and proximal pairs are consistent between samples.
Table 1.
The top 20 up- and down-regulated genes in proximal vs distal newborn skin from the Acomys tail
| Down-regulated |
Up-regulated |
||||
|---|---|---|---|---|---|
| Transcript | gene name | LogFC | transcript | gene name | logFC |
| TR50180|c0_g3_i1 | Krt71 | −6.0819 | TR140362|c0_g2_i1 | Ibsp | 4.573993 |
| TR151232|c0_g2_i2 | Gprc5d | −6.05321 | TR91530|c0_g1_i1 | Fat3 | 4.551078 |
| TR152503|c0_g3_i1 | Krt28 | −6.02479 | TR160427|c0_g1_i1 | Spp1 | 4.340795 |
| TR36557|c0_g1_i1 | Krt73 | −5.68412 | TR1455|c0_g1_i1 | FAM43B | 4.219769 |
| TR152503|c0_g2_i2 | Krt25 | −5.6488 | TR45613|c0_g1_i1 | PANX3 | 4.219341 |
| TR121791|c0_g1_i1 | FABP9 | −5.52026 | TR3405|c0_g1_i1 | Ostn | 4.159454 |
| TR68726|c0_g2_i1 | Krt33b | −5.3499 | TR157631|c0_g1_i1 | Dkk1 | 4.122973 |
| TR152503|c0_g2_i1 | Krt27 | −5.27835 | TR122953|c0_g1_i1 | Dlg2 | 4.005114 |
| TR150451|c0_g1_i1 | Krt72 | −5.18255 | TR160543|c1_g1_i4 | Col1a2 | 3.916185 |
| TR47183|c0_g2_i1 | TCHH | −5.1125 | TR56704|c0_g2_i1 | Sp7 | 3.84437 |
| TR68726|c0_g2_i2 | Krt33a | −5.01606 | TR141673|c0_g1_i1 | Slc13a5 | 3.830126 |
| TR14881|c0_g2_i1 | Krt34 | −4.99813 | TR57247|c0_g1_i1 | Ifitm5 | 3.822103 |
| TR138942|c0_g1_i1 | Tnnc1 | −4.89897 | TR36614|c0_g1_i1 | Omd | 3.770761 |
| TR76306|c0_g1_i1 | Krtap14 | −4.75122 | TR106888|c0_g1_i1 | Slc8a3 | 3.719812 |
| TR42445|c0_g1_i2 | Krtap9-3 | −4.73519 | TR87506|c0_g1_i1 | Slitrk1 | 3.690604 |
| TR91685|c0_g1_i1 | Krtap15-1 | −4.62534 | TR29945|c3_g1_i1 | Lep | 3.57031 |
| TR3858|c2_g3_i3 | Krt82 | −4.62435 | TR127592|c0_g1_i1 | COL22A1 | 3.521128 |
| TR63600|c0_g1_i1 | Vsig8 | −4.39061 | TR1115|c0_g2_i1 | Cthrc1 | 3.508358 |
| TR62920|c0_g1_i1 | Tchhl1 | −4.25904 | TR26729|c0_g1_i1 | Pck1 | 3.43655 |
| TR123314|c0_g2_i1 | Ly6g6d | −4.18871 | TR38404|c1_g3_i1 | Mamdc2 | 3.434927 |
Figure 5.

Heatmap of the top 25 (largest log2 FC) variable transcripts between proximal and distal newborn Acomys tail skin
The six distal skin samples are D1–D6 and the six proximal samples are P1–P6 and these samples separate well. See also Figures S2 and S5 and https://figshare.com/articles/dataset/Supplemental_Tables/21971018, Tables S5 and S6.
What is strikingly apparent in the proximal vs. distal tail skin is the switch from hair formation to bone formation. Of the top 20 down-regulated genes with annotations in the proximal tail skin, 16 are associated with hairs. 7 are hair keratins (Krt71, Krt 28, Krt25, Krt27, Krt73, Krt72, and Krt34), 2 are cuticular keratins (Krt33b and Krt 33a), 5 are keratin associated proteins (KRTAP19-1, 1–4, 14, 5-5, and 15) and one more gives strength to hairs (Tchh), while FabP9 is expressed in the internal root sheath of hair follicles. Only four genes have no apparent relationship to hairs: a G protein-coupled receptor (Gprc5d), calcium homeostasis modulator family member 4 (Fam26d), and two muscle genes (Tnni1 and Tnnc1). Interestingly, the KTRAP multigene family plays an important role in hair formation and morphology and has been associated with phenotypic differences in hairs.21 In particular the spines of hedgehogs which are similar to the spines of spiny mice are correlated with the number of KTRAP genes and the number of pseudogenes. It would be interesting to undertake a genomic study of these genes in Acomys.
The switch to bone formation is clear as 12 of the top 20 up-regulated genes are directly involved in or associated with bone as structural proteins (Bglap2, Ibsp,and Col22a1), mineralization (Phex, Fat, Ifitm5, and Omd) or attachment proteins (Spp1), hormones or transcription factors (Ostn, Sp7, and Lep). Images of Sp7 immunohistochemistry (Osterix) can be seen in Figure 3 confirming its up-regulation in the osteoderms of the proximal tail skin and octeocrin (Ostn) is a direct gene target of Sp7 in the differentiation of osteocytes.22 The other top genes are involved in Wnt signaling (Dkk1 and Cthrc1), metabolism (Slc13a5 and Slc8a3), gap junctions (Panx3), or no known function (Fam43b).
Pathway analysis using IPA predicted the activation of osteoblast differentiation (p value 7.24E-18, Z score 2.14), connective tissue differentiation (p value 1.34E-20, Z score 2.00) and mineralization of bone (p value 4.45E-16, Z score 2.257) in the proximal tail skin samples. All three of these developmental processes are important for the formation of bone, and the genes involved may shed light on the mechanisms that initiate and drive osteoderm development. Twenty-two genes including Panx3 (up-regulated 4.23-fold), Sp7 (up-regulated 3.85-fold), and Runx2 (up-regulated 2.31-fold) were identified by IPA as having differential expression consistent with the activation of osteoblast differentiation (Table S5). Likewise, Areg and Mstn are expected to inhibit osteoblast differentiation and their down-regulation (log2FC = −1.688 and log2FC = −1.72, respectively) in proximal vs. distal tail skin are consistent with activation of osteoblast differentiation. Indeed, Runx2 and Osterix (Sp7) are the two essential transcription factors for osteoblast differentiation.
We also identified 8 collagens that are up-regulated at least 2-fold in the proximal tail (Table S6), including collagens of types 1, 3, 5, 11, 22, and 24. Additional molecular evidence for the formation of osteoderms in the proximal tail can be seen by the expression of 12 out of 33 genes cataloged by IPA as being involved in the activation of bone mineralization (p value 4.45E-16, Z score 2.26).
There are five canonical pathways involved in bone formation, namely BMP, FGF, HH, Wnt, and EDA pathways and we could identify four of them in these data. In the proximal gene lists we identified several BMPs, namely Bmp1 (log2FC = 1.02), Bmp3 (log2FC = 1.29), Bmp6 (log2FC = 0.52), and the inhibitor Bmper (log2FC = 1 0.38). Several FGF genes were identified including, Fgf12 (log2FC = 0.77), Fgf13 (log2FC = 1.02), Fgf22 (log2FC = −1.00), Fgfbp3 (log2FC = −0.58), and Fgf5 (log2FC = −2.97). The hedgehog pathway members Smo (log2FC 0.61) and Hhip (log2FC = 1.53) were identified along with the transcription factors Gli1 (log2FC 1.43) and Gli3 (log2FC = 0.60).
The Wnt pathway components were well represented and “Wnt-b catenin signaling” was identified by IPA. Interestingly, both positive components and inhibitors were identified. The Wnt ligands Wnt2 (log2FC = 1.37), Wnt10b (log2FC = 1.44), and Wnt6 (log2FC = 0.87) were up-regulated whereas Wnt5a (log2FC = 0.50) and Wnt9a (log2FC = −0.55 were down-regulated. The Wnt inhibitor Dkk1 (log2FC = 4.13 and Wif1 (log2FC = 2.47) were strongly up-regulated suggesting osteoderm development requires Wnt inhibition. Other Dkks were Dkk2 (log2FC = 0.82) and Dkk3 (log2FC = 1.13). The receptor components Fzd2 (log2FC = −0.69), Fzd3 (log2FC = 0.38), Fzd8 (log2FC = 0.83), and Lrp5 (log2FC = 0.54) were identified along with the secreted frizzleds Sfrp1 (logFC = −0.33) and Sfrp4 (log2FC = 1.89). Another Wnt pathway inhibitor Sclerostin was highly up-regulated 3.18-fold (log2) and Cdh2 which interacts with β-catenin was up-regulated 2.55-fold (log2). In contrast Wisp1 which promotes osteoblast differentiation by binding BMP2 and enhances BMP function in osteogenesis was up-regulated 1.82-fold (log2). These data suggest that the careful regulation of Wnt signaling is important in the formation of osteocytes so that there is no excessive production of bone throughout the dermis. This is discussed further in the following.
Discussion
We have identified a unique phenomenon in rodents—the presence of osteoderms in the adult tail of all four genera of the subfamily Deomynidae—Acomys, Lophuryomus, Deomys, and Uranomys. An earlier report of osteoderms in another species of Acomys suggests that they may be present in all species of the Acomys genus.23 The function of these osteoderms is unknown, but one possible explanation is it they complement the distinctive skin-shedding and tail-sheathing behavior reported in Acomys and other members of the Deomyinae.24,25 This tear-away defense may be enhanced by the presence of bony plates, which may prevent predators from piercing through the skin and seizing the underlying, unsheddable tissue. A similar escape mechanism is seen in the Madagascar Fish-scaled Geckos, Geckolepis, which are one of the few gekkotans known to possess osteoderms.26
Osteoderms are rare in mammals, only occurring in one extinct eulipotyphlan, some xenarthrans, armadillos, glyptodons, giant ground sloths12,13,14 and now in deomyinids. Since the armored members of rodents eulipotyphlans and xenarthrans are on divergent branches of the mammalian tree, these structures appear to be homoplastic. There are no reports of osteoderms in birds but they are widespread in other reptiles, from lizards to turtles and crocodiles, again, independently evolving multiple times (see Introduction). Nevertheless, the gene regulatory network required to generate dermal bones, which we have analyzed here, has likely been preserved throughout evolution and can be reactivated with the appropriate cues.
Thanks to the presence of a breeding colony of Acomys which we use for regeneration studies27,28,29 we could readily examine the development of osteoderms in the Acomys tail. Differentiation of the newly forming osteoderms begins within the dorsal dermis of the tail skin and spreads distally and ventrally. In the middle third of the tail they are just beginning to form by the aggregation of Osterix +ve osteoblasts in the dermis and they are absent in the distal third of the newborn tail.
The process of osteoblast differentiation (osterix positivity) begins in a small number of dermal fibroblasts-like cells just below the epidermis and at the same time vacuole-like cavities appear within the dermal matrix perhaps suggesting a secreted factor from the epidermis may play a role in the induction of osteoblast differentiation. The aggregated osteoblasts then begin to secrete bone matrix themselves and assemble into a flat plate surrounded by osteoblasts with osteocytes embedded in the matrix. This sequence of development is strikingly similar to the other mammal with osteoderms, the armadillo.13 The fully differentiated osteoderm has neurovascular canals passing through it to allow the passage of blood vessels which can be seen within the larger canals. At their internal surface the osteoderms are attached to thick connective tissue joining adjacent ones to create a strong ring of imbricate scales and each ring is offset by half an osteoderm relative to the adjacent one showing a very precise patterning event has taken place during development. Furthermore, they are precisely arranged relative to the hairs of the tail so that three hairs emerge below each osteoderm. If induction does occur due to an epidermal signal it would be fascinating to examine the patterning relationship between the hairs (epidermal placodes) and osteoderm-inducing signal much earlier in tail development before the appearance of the epidermal scales.
RNA seq revealed the up-regulation of a large number of genes involved in osteoblast differentiation, connective tissue differentiation, and activation of bone cell differentiation, which comprised the vast majority of the top 20 up-regulated genes in proximal tail skin. Conversely, there was a corresponding down-regulation of a large number of keratin genes. The up-regulated genes included many collagens, mineralization genes, structural protein genes, transcription factors, and secreted factors. The Runx2 - Sp7 – Osteocrin induction sequence was operative here and Osteocrin is a secreted protein that promotes osteocyte dendrite formation and maintenance.22 Some less well-known factors involved in bone formation that are up-regulated in proximal vs. distal tail skin samples include leptin (log2FC = 3.56; https://figshare.com/articles/dataset/Supplemental_Tables/21971018) and the leptin receptor (log2FC = 2.41; https://figshare.com/articles/dataset/Supplemental_Tables/21971018), which are both involved in osteoblast proliferation and differentiation.30 The induction of some of these factors in dermal fibroblasts may play a role in osteoderm generation and now we have a mammalian system to work with we can test the efficacy of these individual genes we have identified by transfecting dermal fibroblasts. What these future experiments will not tell us, however, is the fascinating “positional” question of why osteoderms only appeared in the tail and not all over the body.
Genes of the Wnt pathway which are also involved in bone development31 were also up-regulated, but surprisingly so are genes which are antagonistic to the Wnt pathway such as Dkk1, Wnt inhibitory factor, Sfrp4, and Sclerostin. It is reasonable to assume therefore that careful control of the Wnt pathway by the balance between inducers and inhibitors is important for the precise differentiation of osteoderms so that the correct size of the osteoderm primordium is generated and they do not overgrow as they are precisely arranged in the circumferential and longitudinal axis. Indeed, mutations in each of these Wnt inhibitors identified here,32,33,34,35,36 results in increased bone density and mass demonstrating their role in the control of bone growth. Surprisingly, we could not detect the presence of the ectodysplasin (Eda) gene which plays a role in skin appendage development37 nor were genes in another skin pathway, Shh, significantly up-regulated. This may suggest that tetrapod osteoderms (bone, no placode) have diverged molecularly and perhaps anatomically too, from the classical pathways used for tooth, feather, and hair development (dental, placode) which are thought to be derived from the common ancestral element, the odontode.38
Despite considerable structural variation across the vertebrates, osteoderms have two common features: their origin is within the dermis and structurally they are composed of osseous tissue without the formation of a cartilaginous precursor as is the case in endochondral ossification. As such it is suggested that osteoderms share a common evolutionary origin3,4 stretching back at least to the Placoderms. Thus the origin of the cells that give rise to the wide array of dermal bone and osteoderms across the vertebrates is of considerable evolutionary interest and has been hypothesized to be of neural crest origin because of the similarity to tooth and hair formation and because the development of osteoderms by direct ossification of mesenchyme resembles intramembranous ossification of neural crest cells that takes place during the development of the skull. Although there are no epithelial placodes apparent during osteoderm development (Figure 3) as there are in the case of teeth, feathers, and hairs, the presence of cells staining for the neural crest marker HNK-1 around the early armadillo osteoderm39 provides evidence for this hypothesis. In contrast to the cranial neural crest, the trunk neural crest does not normally make bone but it does have skeletogenic potential40 and these ideas place the neural crest as a driving force in dermal armor evolution assuming the loss of its odontogenic capacity.4
The alternative hypothesis is that osteoderms form by direct ossification of the dermal fibroblast-like cells, a process referred to as bone metaplasia, and this has been characterized in the development of lizard and anuran osteoderms.4,5 In support of this concept the posterior skull bones of both mouse and chick which also develop by intramembranous ossification are mesodermally derived41,42,43 not neural crest derived, so direct ossification of mesodermal cells themselves is a normal process during development. In addition, there is no evidence for a neural crest origin of scales in zebrafish44 providing phylogenetic evidence for the mesodermal origin of dermal bony structures. If the mouse possessed osteoderms this question could readily be answered using the neural crest lineage labeled transgenic lines which have been so instrumental in realizing the origin of cranial structures.42,45 There seem to be no studies on neural crest in the developing mouse tail using these transgenics, but since tails have melanophores in their hairs and melanophores are a neural crest-derived cell type there must be crest cells present in the tail during development which could potentially also generate the osteoderms. Identifying the origin of osteoderms is an extremely interesting evolutionary question that we can begin to address now that we have identified their presence in an experimentally tractable mammalian model system.
Limitations of the study
Osteoderms may be more widespread in mammals than we are suggesting here because experimental and anatomical studies are invariably conducted on model organisms, not on unusual species. Osteoderms are not visible externally and so may escape detection in other mammalian species.
STAR★Methods
Key resources table
| REAGENT or RESOURCE | SOURCE | IDENTIFIER |
|---|---|---|
| Antibodies | ||
| Rabbit monoclonal anti-sp7/Osterix antibody | Abcam | Cat # ab227820 |
| Deposited data | ||
| Raw RNA-seq data | This paper | GEO GSE224007 |
| Experimental models: Organisms/strains | ||
| Acomys cahirinus | In-house colony | |
| Software and algorithms | ||
| Trimmomatic v0.39 | Bolger, et al.46 | https://github.com/timflutre/trimmomatic/tree/master/adapters |
| HiSat2 (v2.2.1) | Kim., et al.19 | https://doi.org/10.1038/s41587-019-0201-4 |
| SamTools (1.12) | Danecek, et al.47 | https://doi.org/10.1093/gigascience/giab008 |
| Stringtie | Kim, D, et al.19 | https://doi.org/10.1038/s41587-019-0201-4 |
| Rsubreads package (v2.0.0) | Liao, et al.48 | https://doi.org/10.1093/nar/gkz114 |
| Other | ||
| Acomys skin transcriptome | Brant, et al.18 | Geo Accession GSE113081 |
| Featurecounts | Liao, et al.49 | https://doi.org/10.1093/bioinformatics/btt656 |
| EdgeR | Robinson, et al.50 | https://doi.org/10.1093/bioinformatics/btp616 |
| Acomys tail transcriptome | This paper | Geo Accession GSE224007 |
Resource availability
Lead contact
Further information and requests for resources and reagents should be directed to and will be fulfilled by the lead contact, Malcolm Maden (malcmaden@ufl.edu).
Materials availability
This study did not generate new unique reagents.
Experimental model and subject detail
Animals
Animals were obtained from our colony of Acomys cahirinus housed at the University of Florida and used in accordance with protocols approved by the Institutional Animal Care and Use Committee (IACUC) (protocol number 202107707). The ages of animals used varied from newborn to adult (6 months) and both males and females were used in equal group numbers.
Museum specimens were obtained from the Florida Museum of Natural History, Peabody Museum and the University of Michigan Museum of Zoology.
Method details
CT scanning
A Yale Peabody specimen of Acomys cahirinus (YPM-MAM-005794) was imaged as part of the Open Vertebrate (oVert) Thematic Collections Network initiative (NSF1701714). Following discovery of the structures resembling osteoderms in the caudal region of the specimen, an ontogenetic series of A. cahirinus was imaged. All specimens were scanned using a dual tube GE Phoenix V|tome|X M CT system at the University of Florida’s Nanoscale Research Facility (NRF). We employed the 240 kV microCT tube focus tube, and modified the voltage, current, detector capture time and rotation angles to optimize contrast and signal and minimize artifacts (Table S7). Radiographs were converted into tomograms using Phoenix DatosOS|X reconstruction software. Submicron voxel resolution CT scans of second series of osteoderms were imaged using an Xradia Versa 620 system at the NRF and processed in CT datasets for comparative squamate and mammalian material, including a closely related genus of deomyine mouse, Lophuromys flavopunctatus (UMMZ-MAM-114774), were downloaded from Morphosource.org. All CT datasets were post-processed in VGStudio Max 2022.1 (VolumeGraphics, Heidelberg Germany) to digitally isolate regions of interest and recover volumetric measurements. Ray-based wall thickness analyses were performed on isolated osteoderm regions and osteocyte lacunae volumes were recovered using the defect detection module. All CT datasets (Tomogram stacks and metadata) are freely available to download at morphosource.org and the scan data settings are provided in Table S7.
Histology
Tails of various ages were fixed overnight in 4% PFA and then decalcified for at least 1 week in 14% EDTA with daily changes of solution. Tissues were processed for paraffin wax histology and sectioned at 10 μm. Sections for haematoxylin and eosin staining were dewaxed to deionized water and then placed in Harris’ haematoxylin for 3 minutes and washed in running tap water for 10 minutes. Slides were then placed in 0.1% eosin in 70% alcohol for 3 minutes followed by 90% ethanol, 100% ethanol twice each for 1 minute and then twice in xylene each for 5 minutes before being coverslipped with Cytoseal.
For immunohistochemistry slides were dewaxed and rehydrated to deionized water and placed in 2% hydrogen peroxide for 30 minutes. After 5 minutes washing in deionized water antigen retrieval was performed by heating in a microwave for 4 minutes in sodium citrate buffer at pH6. Slides were then placed in PBS for 5 minutes and blocked in diluted normal serum in PBS for 1 hr at room temperature following the Vectastain Elite ABC kit procedure. A Sp7/Osterix antibody (Abcam ab227820) was diluted at 1 in 500 in blocking buffer and applied to the slides overnight at 4°C. After washing the slides 2x in PBS the relevant biotinylated secondary antibody was diluted in blocking buffer and applied for 1 hr at room temperature followed by ABC reagent (1 hr) and DAB (2 mins) according to the Vectastain protocol. After washing the slides were lightly stained with haematoxylin (1 min), dehydrated and mounted in Cytoseal.
Alizarin red staining for whole-mount tail osteoderms was performed by fixing the tails in 10% neutral buffered formalin overnight, washing in PBS and then another overnight step in 30% hydrogen peroxide. After another wash in PBS the tails were stained for 45 minutes in Alizarin prepared by dissolving 1g of Alizarin Red S in 24 ml distilled water and adjusting the pH to 4.2 with conc HCl. They were then washed in distilled water and left overnight in 1% KOH. The specimens were then cleared in 50% glycerol in 1% KOH for 24 hrs or longer as required.
RNA extraction
Full-thickness skin was collected from the proximal and distal tail of six newborn Acomys pups and either stored at −20°C in RNALater or immediately processed for RNA extraction. Samples of 13–34 mg skin were homogenized with a handheld mechanical homogenizer, and total RNA was extracted using a RNeasy Fibrous Tissue Mini Kit (QIAGEN 74704) according to the manufacturer’s protocol. A total of 17.7–42.8 μg of RNA was extracted from each sample (means of 29.8 μg (s = 10.1 μg) and 22.8 μg (s = 2.6 μg) for proximal and distal tail samples, respectively), as quantified using a NanoDrop ND-1000 spectrophotometer. Agilent TapeStation analysis assigned RINs ranging from 7.7 to 9.3 (mean RIN of 8.6, s = 0.63).
Library construction and RNA-sequencing
An Illumina TruSeq stranded library was constructed via poly-A selection for each individual skin sample for a total of 12 libraries (six proximal and six distal). The libraries were sequenced on the Illumina NovaSeq6000 platform to yield nearly 898 million paired-end, 150 bp reads (mean of 74.8 M read pairs (s = 9.1 M read pairs) per library). Library construction and sequencing were performed by HudsonAlpha Discovery in Huntsville, Alabama, USA.
Quantification and statistical analysis
Sequencing data processing
RNA-seq FASTQ-files were quality and adapter trimmed using Trimmomatic v0.3946 with the parameters: LEADING:3 TRAILING:3 SLIDINGWINDOW:4:15 MINLEN:36 and ILLUMINACLIP with the TruSeq3-PE-2.fa adapter set (available on the Trimmomatic github page: https://github.com/timflutre/trimmomatic/tree/master/adapters) and values of 2, 30,10 for seed mismatches, palindrome clip threshold and simple clip threshold, respectively. The preprocessed reads were aligned to the Acomys skin transcriptome (Geo Accession GSE113081) with HiSat2 (v2.2.1)19 using default parameters for paired-end reads. HiSat output SAM files were converted to BAM format and sorted with SamTools (1.12)47 and used as input to Stringtie.20 Individual read set alignments representing the output from HiSat2 were assembled into transcripts with Stringtie using default settings. Output GFF files were merged with Stringtie called a second time with the following parameters: --merge. Stringtie was called a third time using the individual sorted BAM file outputs of HiSat and the following parameters: -G and the merged GFF as reference, and -A to report transcript abundance.
Identification of differentially expressed genes
The Acomys transcriptome (Geo Accession GSE113081) is a Trinity51 assembly described in Brant et al. 2019.18 Trinity assembles in a hierarchical manner first assembling RNA-Seq reads into contigs and grouping contigs that have sequence similarity. The contig groups are used to construct De Brujin graphs that are traversed to identify transcript isoforms. The names of the individual transcript assemblies outputted by Trinity are structured to capture the cluster ID (related contigs) the transcript was constructed from, the group (gene) within the cluster the transcript belongs to and a final isoform designation. Thus, each individual transcripts within the Trinity assembled Acomys transcriptome (GSE113081) can be assigned to an independent loci based on its sequence ID. Counts per transcript for each RNA-Seq sample were determined with the featureCounts function from the Rsubreads package (v2.0.0)48 (https://figshare.com/articles/dataset/Supplemental_Tables/21971018), which map the aligned reads described in sorted BAM HiSat2 output to individual transcripts within the Acomys trancriptome assembly. Featurecounts49 was called with the following parameters: -s 2 -p -t exon -g gene_id -T 8. Counts to isoforms that are representatives of the same trinity loci were aggregated (https://figshare.com/articles/dataset/Supplemental_Tables/21971018) to enable gene level expression analysis. Brant et al. annotated the Acomys transcriptome and defined Mus – Acomys orthologous for a subset of the transcripts. These annotations were used in this analysis. Differentially expressed genes were discovered with the EdgeR package (v3.36)50 using the aggregated count matrix as input. Count data were TMM normalized, distal/proximal tail skin samples from the same individual were treated as paired samples, and genes differentially expressed between Acomys distal and proximal tail skin samples with p values ≤ 0.05 after Benjamini & Hochberg false discovery rate correction were reported as significant (https://figshare.com/articles/dataset/Supplemental_Tables/21971042). Log2 cpm (counts per million) values were calculated for each gene across all samples by the CPM method within EdgeR (https://figshare.com/articles/dataset/Supplemental_Tables/21971042) and used for PCA assessment and heatmap construction. Note that the trinity transcript assembly used as a reference (Geo Accession GSE113081) was constructed without a genome reference. Thus, it is expected that transcripts represented by incomplete read coverage will result in the assembly of discrete regions of the same transcript that are treated as independent (i.e. the 3′ and the 5′ regions of the same transcript may be assembled and represented as two seemingly unrelated transcripts). Indeed, this is one reason for the large number of transcripts in the collection. The discrete but related transcript assemblies will usually have strong sequence similarity to the same Mus gene, and will both appear in the differentially expressed gene lists. When redundant entries were encountered in parsed lists for visual display (i.e. the top 20 up regulated genes and down regulated genes) the highest log2FC entry was kept, while the related redundant entries were omitted.
Acknowledgments
Funding was provided by National Institutes of Health grant R25GM115298 (A.P. and D.J.), National Science Foundation grant 1558017 (T.P., M.M., and J.M.), and National Science Foundation grant 1701714 (E.S.).
Author contributions
Conceptualization: E.S. and M.M., Methodology: T.P. and W.B.B., Investigation: E.S., M.M., A.P., T.P., and W.B.B., Writing—original draft: M.M. and E.S., Writing—review & editing: W.B.B., M.M., and E.S.
Declaration of interests
The authors declare that they have no competing interests.
Published: May 24, 2023
Footnotes
Supplemental information can be found online at https://doi.org/10.1016/j.isci.2023.106779.
Supplemental information
https://figshare.com/articles/dataset/Supplemental_table/22634929.
Data and code availability
-
•
RNA-seq data have been deposited at GEO GSE224007 and are publicly available as of the date of publication. Accession numbers are also listed in the key resources table.
-
•
This paper does not report original code.
-
•
Any additional information required to reanalyze the data reported in this paper is available from the lead contact upon request.
References
- 1.Hirasawa T., Kuratani S. Evolution of the vertebrate skeleton: morphology, embryology, and development. Zool. Lett. 2015;1:2. doi: 10.1186/s40851-014-0007-7. [DOI] [PMC free article] [PubMed] [Google Scholar]
- 2.Pitirri M.K., Kawasaki K., Richtsmeier J.T. It takes two: building the vertebrate skull from chondrocranium and dermatocranium. Vertebr. Zool. 2020;70:587–600. [PMC free article] [PubMed] [Google Scholar]
- 3.Sire J.-Y., Donoghue P.C.J., Vickaryous M.K. Origin and evolution of the integumentary skeleton in non-tetrapod vertebrates. J. Anat. 2009;214:409–440. doi: 10.1111/j.1469-7580.2009.01046.x. [DOI] [PMC free article] [PubMed] [Google Scholar]
- 4.Vickaryous M.K., Sire J.-Y. The integumentary system of tetrapods: origin, evolution, and development. J. Anat. 2009;214:441–464. doi: 10.1111/j.1469-7580.2008.01043.x. [DOI] [PMC free article] [PubMed] [Google Scholar]
- 5.Levrat-Calviac V., Zylberberg L. The structure of the osteoderms in the Gekko: tatentola mauritanica. Am. J. Anat. 1986;176:437–446. doi: 10.1002/aja.1001760406. [DOI] [PubMed] [Google Scholar]
- 6.Williams C., Kirby A., Marghoub A., Kéver L., Ostashevskaya-Gohstand S., Bertazzo S., Moazen M., Abzhanov A., Herrel A., Evans S.E., Vickaryous M. A review of the osteoderms of lizards (Reptilia: Squamata) Biol. Rev. 2022;97:1–19. doi: 10.1111/brv.12788. [DOI] [PMC free article] [PubMed] [Google Scholar]
- 7.Seidel M.R. The osteoderms of the American alligator and their functional significance. Herpatologica. 1979;35:375–380. [Google Scholar]
- 8.Vickaryous M.K., Hall B.K. Development of the dermal skeleton in ALLIGATOR MISSISSIPPIENSIS (Archosauria, Crocodylia) with comments on the homology of osteoderms. J. Morphol. 2008;269:398–422. doi: 10.1002/jmor.10575. [DOI] [PubMed] [Google Scholar]
- 9.Chen I.H., Yang W., Meyers M.A. Leatherback sea turtle shell: a tough and flexible biological design. Acta Biomater. 2015;28:2–12. doi: 10.1016/j.actbio.2015.09.023. [DOI] [PubMed] [Google Scholar]
- 10.Ruibal R., Shoemaker V. Osteoderms in Anurans. J. Herpetol. 1984;18:313–328. [Google Scholar]
- 11.Hendrickx C., Bell P.R., Pittman M., Milner A.R.C., Cuesta E., O'Connor J., Loewen M., Currie P.J., Mateus O., Kaye T.G., Delcourt R. Morphology and distribution of scales, dermal ossifications, and other non-feather integumentary structures in non-avian theropod dinosaurs. Biol. Rev. 2022;97:960–1004. doi: 10.1111/brv.12829. [DOI] [PubMed] [Google Scholar]
- 12.Hill R.V. Comparative anatomy and histology of Xenarthran osteoderms. J. Morphol. 2006;267:1441–1460. doi: 10.1002/jmor.10490. [DOI] [PubMed] [Google Scholar]
- 13.Vickaryous M.K., Hall B.K. Osteoderm morphology and development in the nine-banded armadillo, daspypus novemcinctus (mammalia, Xenarthra, Cingulata) J. Morphol. 2006;267:1273–1283. doi: 10.1002/jmor.10475. [DOI] [PubMed] [Google Scholar]
- 14.Krmpotic C.M., Ciancio M.R., Carlini A.A., Castro M.C., Scarano A.C., Barbeito C.G. Comparative histology and ontogenetic change in the carapace of armadillos (Mammalia: dasypodidae) Zoomorphology. 2015;134:601–616. [Google Scholar]
- 15.Hill R.V. Integration of morphological data sets for phylogenetic analysis of Amniota: the importance of integumentary characters and increased taxonomic sampling. Syst. Biol. 2005;54:530–547. doi: 10.1080/10635150590950326. [DOI] [PubMed] [Google Scholar]
- 16.Yang W., Chen I.H., Gludovatz B., Zimmermann E.A., Ritchie R.O., Meyers M.A. Natural flexible dermal armor. Adv. Mater. 2013;25:31–48. doi: 10.1002/adma.201202713. [DOI] [PubMed] [Google Scholar]
- 17.von Koenigswald W., Storch G. Fossilfundstelle Messel, Nr. 36: pholidocercus hassiacus, ein Amphilemuride aus dem Eozän der «Grube Messel» bei Darmstadt (Mammalia, Lipotyphla) Senckenberg. Lethaea. 1983;64:447–495. [Google Scholar]
- 18.Brant J.O., Boatwright J.L., Davenport R., Sandoval A.G.W., Maden M., Barbazuk W.B. Comparative transcriptomic analysis of dermal wound healing reveals De novo skeletal muscle regeneration in Acomys cahirinus. PLoS One. 2019;14:e0216228. doi: 10.1371/journal.pone.0216228. [DOI] [PMC free article] [PubMed] [Google Scholar]
- 19.Kim D., Paggi J.M., Park C., Bennett C., Salzberg S.L. Graph-based genome alignment and genotyping with HISAT2 and HISAT-genotype. Nat. Biotechnol. 2019;37:907–915. doi: 10.1038/s41587-019-0201-4. [DOI] [PMC free article] [PubMed] [Google Scholar]
- 20.Pertea M., Pertea G.M., Antonescu C.M., Chang T.-C., Mendell J.T., Salzberg S.L. StringTie enables improved reconstruction of a transcriptome from RNA-seq reads. Nat. Biotechnol. 2015;33:290–295. doi: 10.1038/nbt.3122. [DOI] [PMC free article] [PubMed] [Google Scholar]
- 21.Khan I., Maldonado E., Vasconcelos V., O-Brien S.J., Johnson W.E., Antunes A. Mammalian keratins associated proteins (KRTAPs) subgenomes: disentangling hair diversity and adaptation to terrestrial and aquatic environments. BMC Genom. 2014;15:779. doi: 10.1186/1471-2164-15-779. [DOI] [PMC free article] [PubMed] [Google Scholar]
- 22.Wang J.S., Kamath T., Mazur C.M., Mirzamohammadi F., Rotter D., Hojo H., Castro C.D., Tokavanich N., Patel R., Govea N., et al. Control of osteocyte dendrite formation by Sp7 and its target gene osteocrin. Nat. Commun. 2021;12:6271. doi: 10.1038/s41467-021-26571-7. [DOI] [PMC free article] [PubMed] [Google Scholar]
- 23.Niethammer J. Hautverknocherungen im Schwanz von Stachelmaused (Acomys dimidiatus) Bonn. Zool. Beitr. 1975;26:100–106. [Google Scholar]
- 24.Shargal E., Rath-Wolfson L., Kronfeld N., Dayan T. Ecological and histological aspects of tail loss in spiny mice (Rodentia: muridae, Acomys) with a review of its occurrence in rodents. J. Zool. 1999;249:187–193. [Google Scholar]
- 25.Haughton C.L., Gawriluk T.R., Seifert A.W. The biology and husbandry of the African spiny mouse (Acomys cahirinus) and the research uses of a laboratory colony. J. Am. Assoc. Lab. Anim. Sci. 2016;55:9–17. [PMC free article] [PubMed] [Google Scholar]
- 26.Paluh D.J., Griffing A.H., Bauer A.M. Sheddable armour: identification of osteoderms in the integument of Geckolepis maculata (Gekkota) Afr. J. Herpetol. 2017;66:12–24. [Google Scholar]
- 27.Maden M., Varholick J.A. Model systems for regeneration: the spiny mouse, Acomys cahirinus. Development. 2020;147:dev167718. doi: 10.1242/dev.167718. [DOI] [PMC free article] [PubMed] [Google Scholar]
- 28.Sandoval A.G.W., Maden M. Regeneration in the spiny mouse, Acomys, a new mammalian model. Curr. Opin. Genet. Dev. 2020;64:31–36. doi: 10.1016/j.gde.2020.05.019. [DOI] [PMC free article] [PubMed] [Google Scholar]
- 29.Gaire J., Varholick J.A., Rana S., Sunshine M.D., Doré S., Barbazuk W.B., Fuller D.D., Maden M., Simmons C.S. Spiny Mouse (Acomys): an emerging research organism for regenerative medicine with applications beyond the skin. NPJ Regen. Med. 2021;6:1. doi: 10.1038/s41536-020-00111-1. [DOI] [PMC free article] [PubMed] [Google Scholar]
- 30.Motyl K.J., Rosen C.J. Understanding leptin-dependent regulation of skeletal homeostasis. Biochimie. 2012;94:2089–2096. doi: 10.1016/j.biochi.2012.04.015. [DOI] [PMC free article] [PubMed] [Google Scholar]
- 31.Day T.F., Yang Y. Wnt and hedgehog signaling pathways in bone development. J. Bone Joint Surg. Am. 2008;90:19–24. doi: 10.2106/JBJS.G.01174. [DOI] [PubMed] [Google Scholar]
- 32.Haraguchi R., Kitazawa R., Mori K., Tachibana R., Kiyonari H., Imai Y., Abe T., Kitazawa S. sFRP4-dependent Wnt signal modulation is critical for bone remodeling during postnatal development and age-related bone loss. Sci. Rep. 2016;6:25198. doi: 10.1038/srep25198. [DOI] [PMC free article] [PubMed] [Google Scholar]
- 33.MacDonald B.T., Joiner D.M., Oyserman S.M., Sharma P., Goldstein S.A., He X., Hauschka P.V. Bone mass is inversely proportional to Dkk1 levels in mice. Bone. 2007;41:331–339. doi: 10.1016/j.bone.2007.05.009. [DOI] [PMC free article] [PubMed] [Google Scholar]
- 34.Morvan F., Boulukos K., Clément-Lacroix P., Roman Roman S., Suc-Royer I., Vayssière B., Ammann P., Martin P., Pinho S., Pognonec P., et al. Deletion of a single allele of the Dkk1 gene leads to an increase in bone formation and bone mass. J. Bone Miner. Res. 2006;21:934–945. doi: 10.1359/jbmr.060311. [DOI] [PubMed] [Google Scholar]
- 35.Stock M., Böhm C., Scholtysek C., Englbrecht M., Fürnrohr B.G., Klinger P., Gelse K., Gayetskyy S., Engelke K., Billmeier U., et al. Wnt inhibitory factor 1 deficiency uncouples cartilage and bone destruction in tumor necrosis factor-a mediated experimental arthritis. Exp. Arth. 2013;65:2310–2322. doi: 10.1002/art.38054. [DOI] [PubMed] [Google Scholar]
- 36.Holdsworth G., Roberts S.J., Ke H.Z. Novel actions of sclerostin on bone. J. Mol. Endocrinol. 2019;62:R167–R185. doi: 10.1530/JME-18-0176. [DOI] [PubMed] [Google Scholar]
- 37.Cui C.-Y., Schlessinger D. EDA signaling and skin appendage development. Cell Cycle. 2006;5:2477–2483. doi: 10.4161/cc.5.21.3403. [DOI] [PMC free article] [PubMed] [Google Scholar]
- 38.Sire J.-Y., Huysseune A. Formation of dermal skeletal and dental tissues in fish: a comparative and evolutionary approach. Biol. Rev. 2003;78:219–249. doi: 10.1017/s1464793102006073. [DOI] [PubMed] [Google Scholar]
- 39.Krmpotic C.M., Nishida F., Galliari F.C., Pombo M.T., Acuña F., Barbeito C.G., Carlini A.A. The dorsal integument of the southern long-nosed armadillo Dasypus hybridus (Cingulata, Xenarthra), and a possible neural crest origin of the osteoderms. Discussing evolutive consequences for Amniota. J. Mamm. Evol. 2021;28:635–645. [Google Scholar]
- 40.McGonnell I.M., Graham A. Trunk neural crest has skeletogenic potential. Curr. Biol. 2002;12:767–771. doi: 10.1016/s0960-9822(02)00818-7. [DOI] [PubMed] [Google Scholar]
- 41.Le Douarin N. Cambridge Univ Press; 1982. The Neural Crest. [Google Scholar]
- 42.Jiang X., Iseki S., Maxson R.E., Sucov H.M., Morriss-Kay G.M. Tissue origins and interactions in the mammalian skull vault. Dev. Biol. 2002;241:106–116. doi: 10.1006/dbio.2001.0487. [DOI] [PubMed] [Google Scholar]
- 43.Gross J.B., Hanken J. Review of fate-mapping studies of osteogenic neural crest in vertebrates. Dev. Biol. 2008;317:389–400. doi: 10.1016/j.ydbio.2008.02.046. [DOI] [PubMed] [Google Scholar]
- 44.Lee R.T.H., Thiery J.P., Carney T.J. Dermal fin rays and scales derive from mesoderm, not neural crest. Curr. Biol. 2013;23:R336–R337. doi: 10.1016/j.cub.2013.02.055. [DOI] [PubMed] [Google Scholar]
- 45.Chai Y., Jiang X., Ito Y., Bringas P., Han J., Rowitch D.H., Soriano P., McMahon A.P., Sucov H.M. Fate of mammalian neural crest during tooth and mandibular morphogenesis. Development. 2000;127:1671–1679. doi: 10.1242/dev.127.8.1671. [DOI] [PubMed] [Google Scholar]
- 46.Bolger A.M., Lohse M., Usadel B. Trimmomatic: a flexible trimmer for Illumina sequence data. Bioinformatics. 2014;30:2114–2120. doi: 10.1093/bioinformatics/btu170. [DOI] [PMC free article] [PubMed] [Google Scholar]
- 47.Danecek P., Bonfield J.K., Liddle J., Marshall J., Ohan V., Pollard M.O., Whitwham A., Keane T., McCarthy S.A., Davies R.M., Li H. Twelve years of SAMtools and BCFtools. GigaScience. 2021;10:giab008. doi: 10.1093/gigascience/giab008. [DOI] [PMC free article] [PubMed] [Google Scholar]
- 48.Liao Y., Smyth G.K., Shi W. The R package Rsubread is easier, faster, cheaper and better for alignment and quantification of RNA sequencing reads. Nucleic Acids Res. 2019;47:e47. doi: 10.1093/nar/gkz114. [DOI] [PMC free article] [PubMed] [Google Scholar]
- 49.Liao Y., Smyth G.K., Shi W. featureCounts: an efficient general-purpose read summarization program. Bioinformatics. 2014;30:923–930. doi: 10.1093/bioinformatics/btt656. [DOI] [PubMed] [Google Scholar]
- 50.Robinson M.D., McCarthy D.J., Smyth G.K. edgeR: a Bioconductor package for differential expression analysis of digital gene expression data. Bioinformatics. 2010;26:139–140. doi: 10.1093/bioinformatics/btp616. [DOI] [PMC free article] [PubMed] [Google Scholar]
- 51.Haas B.J., Papanicolaou A., Yassour M., Grabherr M., Blood P.D., Bowden J., Couger M.B., Eccles D., Li B., Lieber M., et al. De novo transcript sequence reconstruction from RNA-seq using the Trinity platform for reference generation and analysis. Nat. Protoc. 2013;8:1494–1512. doi: 10.1038/nprot.2013.084. [DOI] [PMC free article] [PubMed] [Google Scholar]
Associated Data
This section collects any data citations, data availability statements, or supplementary materials included in this article.
Supplementary Materials
https://figshare.com/articles/dataset/Supplemental_table/22634929.
Data Availability Statement
-
•
RNA-seq data have been deposited at GEO GSE224007 and are publicly available as of the date of publication. Accession numbers are also listed in the key resources table.
-
•
This paper does not report original code.
-
•
Any additional information required to reanalyze the data reported in this paper is available from the lead contact upon request.