

Summary
Putative ant mimicry is a remarkable example of an evolutionary strategy that can be well integrated into the framework of natural selection and adaptation. However, challenges remain in understanding imperfect ant mimicry. Here, we combine trait quantification and behavioral assays to investigate imperfect ant mimicry in the jumping spider Siler collingwoodi. We performed trajectory analysis and gait analysis to show that the locomotor characters of S. collingwoodi generally resemble those of the putative ant models, supporting the multiple models hypothesis. We then performed background-matching analysis, revealing that body coloration may be involved in background camouflage. We further carried out antipredation assays and found that S. collingwoodi had a significantly lower risk of predation than nonmimetic salticids, suggesting an overall protective effect of Batesian mimicry. Our findings quantitatively demonstrate a combination of mimicry and camouflage in S. collingwoodi and thus highlight the significance of a complex phenomenon driven by natural selection.
Subject areas: Entomology, Ethology, Evolutionary biology
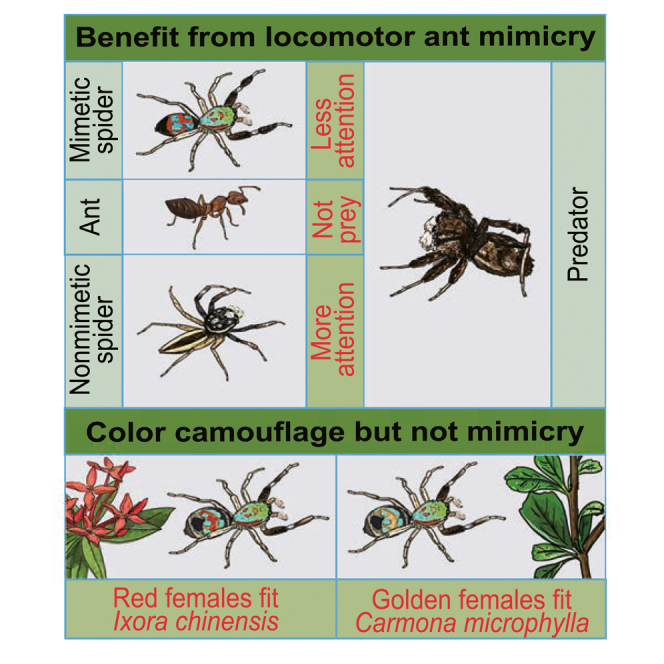
Graphical abstract
Highlights
-
•
Jumping spiders (Siler collingwoodi) live sympatric with multiple ant species
-
•
The locomotor traits of S. collingwoodi resemble those of the sympatric ants
-
•
The body coloration of S. collingwoodi may be involved in background camouflage
-
•
S. collingwoodi gains survival advantages through imperfect ant mimicry
Entomology; Ethology; Evolutionary biology
Introduction
Batesian mimicry is a classic example of antipredator adaptation and natural selection.1,2 The mimetic species imitates a co-occurring unpalatable model species through morphological features and body coloration to gain protection, a phenomenon that has been widely observed and studied in butterflies, snakes, and hoverflies.3,4,5,6,7 Only recently has mimicry involving dynamic visual traits, i.e., locomotor mimicry, received attention and been studied with quantitative approaches.7,8,9,10,11,12,13,14 For example, swallowtail butterfly (Papilio polytes) and clearwing moth (Heterosphecia pahangensis, Aschistophleps argentifasciata, Pyrophleps cruentata, and Pyrophleps sp.) mimics are morphologically and behaviorally similar to their models.8,14 Belonging to an impressive class of Batesian mimics, ant mimics gain ecological benefits by mimicking ants,15 which is attributed to ants’ widespread presence and possession of multiple offensive and defensive strategies.16,17 Although morphological ant mimicry in spiders has been investigated, scant attention has been given to locomotor mimicry using quantitative approaches.9,10,18 For example, the ant-mimicking jumping spider Myrmarachne formicaria has been demonstrated to mimic sympatric ants in both limb use and overall movement patterns, and behavioral experiments with predators confirmed a protective role of locomotor mimicry.10 Such perfect mimicry has attracted considerable attention; it is commonly assumed that higher accuracy is optimal and may promote predator deception, thus leading to lower predation risk.19 However, inaccurate mimicry has been observed with high abundance and is assumed to be evolutionarily unstable,19 leading to the development of multiple hypotheses to explain the maintenance of imperfect mimicry, such as the multiple models hypothesis and multiple predators hypothesis.20,21,22,23 The multiple models hypothesis proposes that general mimics gain advantages such as population expansion and population size magnification from mimicry, which enable them to expand to larger areas if models occupy different habitats or to gain multiple protections from each model if the habitats of models overlap.20 According to the multiple predators hypothesis, imperfect mimicry may be a better option under complex selective pressures from model-specialized predators and model-aversive predators: the former may prey on mimics of poor resemblance with low likelihood, imposing relaxed selection on the imperfect mimics, whereas the latter may avoid mimics with high similarity, promoting mimetic accuracy.23
In the present study, to understand the nature of imperfect mimicry, we studied the salticid species S. collingwoodi, which exhibits ant-like locomotion, brilliant body coloration, and female-limited polymorphism. We first compared the locomotor traits of S. collingwoodi with those of putative ant models and sympatric nonmimetic jumping spiders. Our results indicate that S. collingwoodi dynamically mimics co-occurring ants. Specifically, S. collingwoodi moves in a fashion similar to multiple ant species in terms of trajectory characteristics, movement speed, opisthosoma bobbing and leg lifting, which together may support the multiple models hypothesis, improving the inaccurate static visual resemblance and therefore leading to higher mimetic accuracy. We then explored the mechanisms that promote brilliant body coloration by conducting background-matching analysis, and our findings suggest that body coloration is involved in background camouflage. We further performed antipredation experiments, revealing that S. collingwoodi combines locomotor mimicry and background matching to reduce its predation risk, ultimately revealing the nature of Batesian mimicry. In summary, we disentangle the benefits of ant-like locomotion and brilliant body coloration in S. collingwoodi and explore the driving forces, providing a remarkable example for understanding the complex biological phenomenon of imperfect mimicry shaped by natural selection.
Results
Quantification of the ant-like locomotion of S. collingwoodi
To assess the locomotor mimicry of S. collingwoodi, we collected S. collingwoodi from four geographic locations in southern Hainan (Figure 1A). During this process, we noted that S. collingwoodi adopts a “stop-and-go” walking pattern similar to that of ants: during antiphase, it extends its first pair of legs anterolaterally away from the body, creating the illusion of an ant holding the antennae upward and forward, which is often seen in ant-mimicking spiders.10,24,25,26 We thus hypothesized that S. collingwoodi may mimic multiple ant model species in locomotion, potentially supporting the multiple models hypothesis. To test this hypothesis, we also collected co-occurring putative ant models (Table S1), i.e., Meranoplus bicolor, Crematogaster egidyi, Technomyrmex sp., Polyrhachis jianghuaensis, and Polyrhachis dives, the nonmimetic jumping spider Phintelloides versicolor, and two potential predators, Portia labiata (Araneae, Salticidae) and Gonypeta brunneri (Mantodea, Gonypetidae). We selected putative ant species with high abundance and co-occurrence with S. collingwoodi, suggesting that they have the potential to serve as model species. Furthermore, we chose both Por. labiata and G. brunneri as potential predators for the following reasons. First, these two species are highly abundant in the habitat of S. collingwoodi (Z.H., personal observation). Second, Por. labiata is a jumping spider that specializes in preying upon other spiders,27 whereas G. brunneri is a generalist predator with a monochromatic visual system. Thus, the selection of these two species allowed us to test the multiple predators hypothesis. Notably, the sampling location in Wuzhishan showed the richest diversity, with up to five ant species and two predator species, among the sampling locations, indicating that this area is a suitable habitat for these species (Figure 1A). However, distinct from the dark, dull body color of the sympatric perfect ant-mimicking Toxeus maxillosus, S. collingwoodi displays brilliant body coloration and female-limited polymorphism on the host plants Ixora chinensis and Carmona microphylla (Figures 1B and 1C). Focusing on S. collingwoodi, we quantified mimetic accuracy by characterizing and comparing a total of 93 trajectories. These trajectories included 25 mimetic trajectories of S. collingwoodi; 57 ant trajectories of M. bicolor, C. egidyi, Technomyrmex sp., Pol. jianghuaensis, and Pol. dives; and 11 nonmimetic trajectories of Phi. versicolor (Figure 2). Notably, all individuals of S. collingwoodi and the ants moved with a single pattern comprising “walk”, whereas 10 of the 11 tested Phi. versicolor individuals moved in a “walk-jump” fashion. Second, all ant individuals raised their antennae during their walk, and C. egidyi also lifted their abdomen; all individuals of S. collingwoodi were observed to raise the first pair of legs and bob their abdomen during the walk. In contrast, no individuals of Phi. versicolor were found to exhibit either behavior (Figure 2A). The overall movement pattern and trajectory characteristics of S. collingwoodi were similar to those of the ants, whereas the pattern of Phi. versicolor was different from that of both S. collingwoodi and the ants (Figures 2A and 2B); in other words, S. collingwoodi exhibited more pronounced ant-mimicking characteristics than Phi. versicolor.
Figure 1.

Sampling location, morphological phenotype, and host plants of Siler collingwoodi
(A) Sampling locations and sympatry of species used in this study, including three jumping spider species (the ant-mimetic species S. collingwoodi (cyan), nonmimetic species Phi. versicolor (yellow) and predator Por. labiata (black)), five ant species (M. bicolor (light green), C. egidyi (gray), Technomyrmex sp. (green), Pol. jianghuaensis (purple) and Pol. dives (blue)), and one mantis species (G. brunneri (black)) as a predator.
(B) Morphological phenotypes of S. collingwoodi and the perfect ant-mimetic species T. maxillosus.
(C)Two host plants of the habitat of S. collingwoodi. See also Table S1 in the supplemental information.
Figure 2.

The overall movement pattern and trajectory analysis of ants and mimetic and nonmimetic jumping spiders
(A) Movement patterns of the ant species C. egidyi and two jumping spider species S. collingwoodi and Phi. versicolor. Both C. egidyi and S. collingwoodi show a “stop-and-go” pattern.
(B) Trajectories of two jumping spider species, S. collingwoodi and Phi. versicolor, and five ant species, C. egidyi, M. bicolor, Technomyrmex sp., Pol. jianghuaensis and Pol. dives. (C) Results of PCA based on trajectory- and movement rate-related parameters of spiders and ants, including sinuosity, amplitude (C(Δ)) and wavelength (Δs) of trajectory periodicity, directional change (DC, mean and standard deviation), movement speed (mean and standard deviation) and acceleration (mean and standard deviation). S. collingwoodi showed high similarity in locomotion to ants, whereas Phi. versicolor resembled ants the least. The ellipses with different colors indicate different groups, i.e., blue: large ant species, purple: small ant species, green: mimetic S. collingwoodi, and yellow: nonmimetic Phi. versicolor.
(D) A summary of locomotion similarity between S. collingwoodi and putative ant models. Statistical analyses were performed using (Welch’s) ANOVAs or Kruskal‒Wallis tests for trajectory and movement rate parameters, followed by Tukey’s pairwise comparisons, Games-Howell multiple comparisons, or Dunn’s test with Bonferroni correction to compare between species. The locomotion features of S. collingwoodi best resembled those of the putative ant model C. egidyi, followed by M. bicolor and Technomyrmex sp., which supported the multiple models hypothesis. See also Figure S1 and Table S2 in the supplemental information.
We analyzed five parameters to describe trajectory features, including the sinuosity of the trajectory, mean and standard deviation of directional change (DC), amplitude (C(Δs)) and wavelength (Δs) of periodicity in the trajectory, and four movement rate-related parameters, including the mean and standard deviation of walking speed and the mean and standard deviation of acceleration, using principal component analysis (PCA). PC1 explained 39.5% of the total variance, whereas PC2 and PC3 explained 25.7% and 13.2% of the total variance, respectively. Significant differences were found among species in PC1 (one-way analysis of variance (one-way ANOVA): F6,86 = 30.23, p < 0.001) and PC2 (Kruskal‒Wallis test: χ2(6) = 48.44, p < 0.001), and marginal differences were found among species in PC3 (ANOVA: F6,86 = 2.18, p = 0.05). PC1 had high loadings for the mean and standard deviation of DC (−0.49 and −0.48), sinuosity (−0.46), mean speed (0.36), and wavelength (Δs) of trajectory periodicity (−0.31). PC2 had high loadings for the standard deviation of speed (−0.62) and standard deviation of acceleration (−0.61), and PC3 had high loadings for wavelength (C(Δs)) of trajectory periodicity (−0.62) and mean acceleration (0.53). Notably, S. collingwoodi showed a high degree of similarity to the small ant models (i.e., C. egidyi, M. bicolor, and Technomyrmex sp.) and lower similarity to the large ants (i.e., Pol. jianghuaensis and Pol. dives), whereas Phi. versicolor was different from the ants (Figure 2C). To further dissect the relationship between the mimetic species S. collingwoodi, the model species, and the nonmimetic species Phi. versicolor, we performed separate one-way (Welch’s) ANOVAs or Kruskal‒Wallis tests for each parameter.
Sinuosity was significantly different among species (Kruskal‒Wallis test: χ2(6) = 69.26, p < 0.001): S. collingwoodi walked as tortuously as C. egidyi, M. bicolor and Technomyrmex sp.; significantly more tortuously than Pol. jianghuaensis and Pol. dives; and slightly less tortuously than Phi. versicolor. The mean and standard deviation of directional change were significantly different among species (Welch’s ANOVA: F6,33 = 27.69, p < 0.001; Welch’s ANOVA: F6,32 = 34.81, p < 0.001): S. collingwoodi changed movement direction at similar rates as C. egidyi and M. bicolor; significantly more frequently than Technomyrmex sp., Pol. Jianghuaensis and Pol. dives; and significantly less frequently than Phi. versicolor. The amplitude (C(Δs)) of the trajectory period was significantly different among species (Kruskal‒Wallis test: χ2(6) = 21.81, p = 0.001): the trajectory period amplitude of S. collingwoodi was similar to that of C. egidyi, M. bicolor, Technomyrmex sp., Pol. jianghuaensis, and Phi.versicolor, but slightly larger than Pol. dives. The wavelength (Δs) of the trajectory period was significantly different among species (Kruskal‒Wallis test: χ2(6) = 39.07, p < 0.001): the trajectory period wavelength of S. collingwoodi was similar to that of M. bicolor, Technomyrmex sp. and Phi. versicolor; slightly shorter than that of C. egidyi; and slightly longer than that of Pol. jianghuaensis and Pol. dives. The mean walking speed was significantly different among species (ANOVA: F6,86 = 29.55, p < 0.001): S. collingwoodi walked as fast as Technomyrmex sp.; significantly faster than C. egidyi, M. bicolor and Phi. versicolor; and significantly slower than Pol. jianghuaensis and Pol. dives. The standard deviation of walking speed was significantly different among species (ANOVA: F6,86 = 12.24, p < 0.001): the variance in the walking speed of S. collingwoodi was similar to that of Pol. dives, but significantly larger than that of C. egidyi, M. bicolor, Technomyrmex sp., Pol. jianghuaensis and Phi. versicolor. The standard deviation of acceleration was significantly different among species (ANOVA: F6,86= 13.21, p < 0.001): the variance of acceleration of S. collingwoodi was similar to that of Pol. dives and Phi. versicolor but significantly larger than that of C. egidyi, M. bicolor, Technomyrmex sp. and Pol. jianghuaensis. In brief, S. collingwoodi was indistinctive to the small ants in almost all trajectory feature-related parameters but had low similarity in velocity-related parameters; on the other hand, S. collingwoodi was similar to the large ants in only trajectory periodicity features (i.e., amplitude C(Δs) and wavelength (Δs)) but different from them in most velocity-related parameters. Among ant species, we found that the two large ants were alike in all examined parameters. The three small ants showed a high degree of similarity, except that Technomyrmex sp. walked faster and had more variable acceleration than the other two small ant species, and C. egidyi had a wavelength of periodicity (Δs) larger than that of M. bicolor and Technomyrmex sp. (Figure S1; Table S2). We also performed parallel comparisons between Phi. versicolor and ants and found that Phi. versicolor showed low similarity to the small ants in terms of the two trajectory periodicity features (i.e., amplitude C(Δs) and wavelength (Δs)) and velocity-related parameters (i.e., mean and standard deviation of walking speed); however, Phi. versicolor had no similarity in trajectory-related parameters to the large ants (Figure S1; Table S2). Furthermore, mean acceleration was not significantly different among all species, suggesting its low capacity in distinguishing these animals (Kruskal‒Wallis Test: χ2(6) = 7.55, p = 0.272, Figure S1; Table S2). Taken together, our findings demonstrate that although S. collingwoodi and the large ants were similar in only movement pattern and trajectory periodicity features, S. collingwoodi and the small ants showed high similarity in both overall movement pattern and trajectory features, as well as a low similarity in velocity. Specifically, the behavioral pattern of S. collingwoodi most closely resembles that of C. egidyi, followed by M. bicolor and Technomyrmex sp., supporting the multiple models hypothesis (Figure 2D).
We further explored the behavioral patterns of the mimetic species S. collingwoodi, the nonmimetic species Phi. versicolor, and the ant species using gait analysis. We observed that S. collingwoodi always lifted its forelimbs during the quick antiphase of walking, which seemed to be an imitation of the ant antennae, whereas Phi. versicolor never behaved in such a way (Figure 3A). We calculated the probability of a spider’s forelimb or an ant’s antennae being above the head. The nonmimetic species Phi. versicolor was found to never lift the forelimbs during rest or movement, in contrast to the observations in both S. collingwoodi and ants (Figure 3B). Moreover, C. egidyi was observed to raise the abdomen during rest or in agonistic interactions with other creatures; thus, we calculated the probability that a spider or an ant would raise its abdomen above its head. Consistent with the potential ant model C. egidyi, S. collingwoodi showed a high probability of raising the abdomen above the head, which was significantly higher than that of the nonmimetic species Phi. versicolor (ANOVA: F2,24 = 8.23, p = 0.002; Figure 3C).
Figure 3.

Gait analysis of putative ant models and mimetic and nonmimetic jumping spiders
(A) The relative height of the forelimbs or antennae to that of the head of spiders and ants during motion or at rest. The gray part shows that during antiphase, S. collingwoodi raised its forelimbs above the head, close to the height of the antennae of the two Polyrhachis ants; however, Phi. versicolor did not behave in a similar way. The motion curve was smoothed by the Savitzky‒Golay method (window points: 41; polynomial order: 6). Scale bar = 1 mm.
(B) Conditional probability of forelimbs or antennae being higher than the head in stationary or moving conditions. For both the mimetic species S. collingwoodi and ants, the probabilities were higher than the nonmimetic species Phi. versicolor, during both the moving and stationary stages.
(C) Abdomen height relative to the head at different movement rates for S. collingwoodi, Phi. versicolor, and C. egidyi. Vertical lines indicate the boundary between motionless and moving stages, horizontal lines indicate the height of forelimbs or antennae consistent with that of the head, and n indicates the number of points used for calculation. Data were normalized to the range of [0,1] separately for each species. The distribution probabilities of the forelimbs or the antennae whereas stationary are shown in the upper right corner. During the stationary stage, the probability of the abdomen being higher than the head for the mimetic species S. collingwoodi and for C. egidyi were similar (in red, mean ± S.E.) and much higher than that for the nonmimetic species Phi. versicolor. The gradient indicates the probability of the forelimbs or antennae being in each region. From white to black: 0%–100%. See also Figures S2 and S3 and Table S3 in the supplemental information.
We also estimated the unpalatability of each of the five potential model species by measuring their morphological traits, including the number of spines, total spine length, total body size and mandible size. We found that Pol. dives appeared to be the most unpalatable among the ant model species, whereas Technomyrmex sp. was the least unpalatable (Figure S3; Table S3).
Body color involved in background camouflage
Unlike typical ant-mimicking spiders that mimic the brown or black body color of ants, S. collingwoodi has brilliant body coloration and female-limited polymorphism; from a human’s perspective, it seems to blend well with plants in its environment (Figures 1B and 1C). Specifically, I. chinensis and C. microphylla are the two plants where S. collingwoodi is normally found in the wild. The former blooms year-round, exhibiting red flowers with green leaves, which appear to be similar to the color pattern of S. collingwoodi males and the red morph of females, whereas the latter exhibits green leaves and brown twigs that may be similar to the golden morph of S. collingwoodi females. Because animals with concealment/camouflage may gain survival advantages by reducing detection and consumption by predators,25,28 our a priori hypothesis was that body coloration served as camouflage to protect S. collingwoodi against predators.
To test this hypothesis, we first examined body color differences between S. collingwoodi and its putative ant models; then we investigated the background matching of S. collingwoodi to its two host plants I. chinensis and C. microphylla (Figure 1C). To do so, we obtained reflectance spectra of six main color patches (the dorsal carapace red patch (DCR), the irregular dorsal abdomen red/golden patch (DAR), the orbicular dorsal abdomen blue patch (DAB), the posterior part of the dorsal abdomen black patch (DEB), the front-end dorsal carapace green patch (DCG) and the posterior part of dorsal abdomen goldish brown patch (DEG)) on S. collingwoodi (red-morph females: n = 10, golden-morph females: n = 9, males: n = 12) and Phi. versicolor (females: n = 12, males: n = 10), as well as corresponding color patches for the ants (C. egidyi: n = 13, M. bicolor: n = 12, Technomyrmex sp.: n = 12, Pol. dives: n = 10, Pol. jianghuaensis: n = 12) and measured reflectance spectra of both the petals and leaves of I. chinensis (n = 10) and twigs and leaves of C. microphylla (n = 10) (for a detailed description and illustration of color patches, see STAR Methods; Figures 4A–4C; Figure S4A). To explore whether and how potential predators perceived the color difference, we conducted visual modeling of potential predators by estimating color contrasts between S. collingwoodi and the ant models and between S. collingwoodi and the nonmimetic species Phi. versicolor. The color perception abilities of salticids and mantids are quite different: salticids possess acute eye sight and excellent color discrimination, whereas mantids are monochromatic, which means that they can detect only differences in brightness rather than coloration. Therefore, we generated a chromatic contrast for the salticid visual system and an achromatic contrast for the mantid visual system. We found that from the perspective of both salticids and mantids, S. collingwoodi shows no color similarity to sympatric ants or Phi. versicolor (Table 1). We then conducted visual modeling in a similar manner to compare spider coloration to the two host plants. From the perspective of salticids, S. collingwoodi was more similar to the host plants than Phi. versicolor (Figure 4D; Table S4). Specifically, color contrasts between S. collingwoodi and I. chinensis were significantly lower than those between Phi. versicolor and I. chinensis for DCR (ANOVA: F3,39 = 299.40, p < 0.001), DAR (Welch’s ANOVA: F3,18 = 177.03, p < 0.001), DAB (ANOVA: F3,40 = 49.62, p < 0.001) and DEB (Welch’s ANOVA: F3,17 = 88.35, p < 0.001) but not for DCG (Welch’s ANOVA: F3,20 = 51.12, p<0.001) or DEG (Kruskal‒Wallis Test: χ2(3) = 32.28, p < 0.001), indicating a better camouflage capability in S. collingwoodi (Figure 4D; Table S4). In contrast, compared to Phi. versicolor, S. collingwoodi did not seem to have better camouflage on C. microphylla, i.e., only the color contrast values for DAB between S. collingwoodi and C. microphylla were significantly lower than those between Phi. versicolor and C. microphylla (ANOVA: F3,39 = 41.06, p < 0.001), whereas the color contrast values of S. collingwoodi were higher for the other color patches, especially for those on S. collingwoodi males (Figure 4D; Table S4). From the perspective of mantids with a monochromatic visual system, S. collingwoodi was more camouflaged than Phi. versicolor on I. chinensis because of overall lower just noticeable difference (JND) values between S. collingwoodi and I. chinensis than between Phi. versicolor and I. chinensis for DCG (ANOVA: F3,40 = 26.86, p < 0.001), DCR (ANOVA: F3,39 = 17.13, p < 0.001), DAR (ANOVA: F3,40 = 26.36, p < 0.001) and DAB (Kruskal‒Wallis test: χ2(3) = 14.99, p = 0.002), and such a difference was more pronounced for S. collingwoodi females (Figure S4B; Table S4). However, S. collingwoodi seemed to be similarly noticeable as Phi. versicolor on C. microphylla because of the overall equivalence of JND values between S. collingwoodi and C. microphylla and between Phi. versicolor and C. microphylla (Figure 4D; Table S4). Therefore, we inferred that the body color of S. collingwoodi provides some degree of protection.
Figure 4.

Reflectance spectra and color contrast between spiders and plants from the perspective of a jumping spider
(A) Illustrations of the main color patches compared for the mimetic species S. collingwoodi, the nonmimetic species Phi. versicolor, and the ants.
(B) Color patches of interest for the host plants I. chinensis and C. microphylla with the illustration of the mimetic system in their natural environment.
(C) Reflectance spectra (mean ± S.E.) of all measured species, illustrated by color patch. From left to right: dorsal carapace green patch (DCG), dorsal carapace red patch (DCR), dorsal abdomen red patch (DAR), dorsal abdomen blue patch (DAB), posterior part of dorsal abdomen black patch (DEB) and goldish brown patch (DEG).
(D) Color contrast (just noticeable difference, JND) between spiders and host plants from the perspective of a jumping spider (green boxplot: between S. collingwoodi and the host plant; yellow boxplot: between Phi. versicolor and the host plant; upper: I. chinensis, lower: C. microphylla). Color contrast values >3 JND suggest increasingly distinguishable colors, while values ≤3 JND indicate low discriminability of the colors for a given visual system (dashed line = 3). S. collingwoodi had better camouflage than Phi. versicolor, especially on I. chinensis. For details, please see the main text. Boxplots show the median, upper and lower quartiles, and maxima and minima; dots indicate outliers. Different letters (a, b, and c) indicate statistically significant differences between groups (p < 0.05). See also Figure S4 and Table S4 in the supplemental information.
Table 1.
Color contrast between spiders and ants from different predator perspectives
| Visual system | Comparison | Color contrast (JND) | ||||||
|---|---|---|---|---|---|---|---|---|
| Jumping spider | DCG | DCR | DAR | DAB | DEB | DEG | ||
| Female golden morph | Crematogaster egidyi | 6.38 ± 0.31 | 7.00 ± 0.31 | 9.25 ± 0.71 | 4.44 ± 0.31 | 3.32 ± 0.81 | 8.25 ± 0.81 | |
| Meranoplus bicolor | 5.82 ± 0.31 | 7.57 ± 0.31 | 10.83 ± 0.71 | 4.36 ± 0.31 | 3.95 ± 0.81 | 8.80 ± 0.71 | ||
| Technomyrmex sp. | 6.83 ± 0.51 | 11.15 ± 0.61 | 10.78 ± 0.71 | 3.15 ± 0.31 | 3.23 ± 0.71 | 7.45 ± 0.81 | ||
| Polyrhachis jianghuaensis | 5.35 ± 0.31 | 7.86 ± 0.71 | 9.05 ± 0.71 | 3.33 ± 0.21 | 4.46 ± 0.51 | 6.09 ± 0.61 | ||
| Polyrhachis dives | 5.01 ± 0.41 | 7.51 ± 0.61 | 8.12 ± 0.71 | 3.45 ± 0.31 | 5.59 ± 0.51 | 3.96 ± 0.61 | ||
| Phintelloides versicolor female | 2.44 ± 0.20 | 5.09 ± 0.68 | 6.32 ± 0.47 | 5.48 ± 0.37 | 4.31 ± 0.61 | 3.00 ± 0.43 | ||
| Phintelloides versicolor male | 5.40 ± 0.49 | 10.26 ± 0.72 | 6.11 ± 0.62 | 10.95 ± 0.33 | 5.76 ± 0.44 | 3.66 ± 0.42 | ||
| Female red morph | Crematogaster egidyi | 6.81 ± 0.21 | 11.26 ± 0.81 | 19.30 ± 1.31 | 4.85 ± 0.31 | 4.70 ± 0.81 | 9.67 ± 0.71 | |
| Meranoplus bicolor | 6.22 ± 0.21 | 11.49 ± 0.81 | 21.13 ± 1.31 | 4.71 ± 0.41 | 5.61 ± 0.81 | 10.21 ± 0.71 | ||
| Technomyrmex sp. | 7.52 ± 0.31 | 17.17 ± 0.81 | 21.19 ± 1.31 | 3.39 ± 0.31 | 4.03 ± 0.81 | 8.79 ± 0.71 | ||
| Polyrhachis jianghuaensis | 5.84 ± 0.31 | 14.66 ± 0.81 | 19.58 ± 1.21 | 3.58 ± 0.21 | 4.09 ± 0.41 | 7.00 ± 0.51 | ||
| Polyrhachis dives | 5.54 ± 0.31 | 13.76 ± 0.81 | 18.62 ± 1.21 | 3.94 ± 0.41 | 3.68 ± 0.41 | 4.73 ± 0.61 | ||
| Phintelloides versicolor female | 2.31 ± 0.20 | 11.87 ± 0.80 | 16.40 ± 1.18 | 5.91 ± 0.58 | 3.23 ± 0.49 | 3.39 ± 0.50 | ||
| Phintelloides versicolor male | 6.08 ± 0.37 | 16.70 ± 0.86 | 16.51 ± 1.25 | 11.12 ± 0.58 | 4.37 ± 0.27 | 3.90 ± 0.47 | ||
| Male | Crematogaster egidyi | 7.53 ± 0.61 | 17.23 ± 0.91 | 24.90 ± 0.41 | 5.61 ± 0.31 | 18.79 ± 1.51 | 2.95 ± 0.41 | |
| Meranoplus bicolor | 6.96 ± 0.61 | 17.43 ± 0.81 | 26.77 ± 0.41 | 3.91 ± 0.31 | 19.00 ± 1.51 | 3.77 ± 0.41 | ||
| Technomyrmex sp. | 8.36 ± 0.71 | 23.15 ± 0.91 | 26.90 ± 0.41 | 4.41 ± 0.41 | 18.22 ± 1.51 | 2.67 ± 0.31 | ||
| Polyrhachis jianghuaensis | 6.63 ± 0.61 | 20.49 ± 0.91 | 25.39 ± 0.41 | 5.29 ± 0.41 | 16.41 ± 1.41 | 3.99 ± 0.21 | ||
| Polyrhachis dives | 6.33 ± 0.71 | 19.69 ± 0.91 | 24.40 ± 0.41 | 7.99 ± 0.41 | 14.50 ± 1.41 | 5.20 ± 0.51 | ||
| Phintelloides versicolor female | 3.13 ± 0.37 | 17.39 ± 1.01 | 22.30 ± 0.42 | 10.52 ± 0.49 | 16.00 ± 1.53 | 6.87 ± 0.60 | ||
| Phintelloides versicolor male | 6.91 ± 0.76 | 22.66 ± 0.94 | 22.33 ± 0.44 | 16.60 ± 0.49 | 14.43 ± 1.42 | 6.57 ± 0.59 | ||
| Mantis | DCG | DCR | DAR | DAB | DEB | DEG | ||
| Female golden morph | Crematogaster egidyi | 8.26 ± 1.36 | 15.73 ± 1.56 | 30.95 ± 1.56 | 28.75 ± 2.26 | 27.29 ± 3.09 | 23.67 ± 1.57 | |
| Meranoplus bicolor | 4.31 ± 0.58 | 7.21 ± 0.56 | 22.04 ± 1.56 | 33.51 ± 2.26 | 17.09 ± 2.43 | 34.88 ± 1.57 | ||
| Technomyrmex sp. | 22.10 ± 1.42 | 30.83 ± 1.57 | 30.85 ± 1.56 | 22.67 ± 2.26 | 36.84 ± 3.15 | 14.12 ± 1.53 | ||
| Polyrhachis jianghuaensis | 20.91 ± 1.33 | 11.44 ± 1.13 | 18.68 ± 1.54 | 36.52 ± 2.26 | 18.74 ± 2.19 | 34.31 ± 1.57 | ||
| Polyrhachis dives | 7.47 ± 0.95 | 6.50 ± 1.00 | 8.31 ± 0.95 | 7.66 ± 0.52 | 42.12 ± 3.15 | 11.11 ± 1.02 | ||
| Phintelloides versicolor female | 9.93 ± 0.52 | 5.31 ± 0.61 | 13.62 ± 0.64 | 3.50 ± 0.47 | 31.39 ± 1.03 | 2.56 ± 0.30 | ||
| Phintelloides versicolor male | 5.19 ± 0.52 | 13.39 ± 0.64 | 5.13 ± 0.43 | 3.65 ± 0.55 | 18.23 ± 1.03 | 3.48 ± 0.10 | ||
| Female red morph | Crematogaster egidyi | 9.58 ± 1.09 | 24.42 ± 1.62 | 28.39 ± 2.04 | 27.90 ± 1.81 | 28.69 ± 3.09 | 27.97 ± 3.24 | |
| Meranoplus bicolor | 4.37 ± 0.59 | 13.64 ± 1.57 | 19.65 ± 1.96 | 32.64 ± 1.83 | 17.96 ± 2.87 | 39.13 ± 3.28 | ||
| Technomyrmex sp. | 23.54 ± 1.10 | 39.53 ± 1.62 | 28.29 ± 2.04 | 21.79 ± 1.83 | 38.33 ± 3.09 | 18.89 ± 2.94 | ||
| Polyrhachis jianghuaensis | 22.18 ± 1.07 | 19.31 ± 1.62 | 16.50 ± 1.84 | 35.64 ± 1.83 | 19.61 ± 2.63 | 38.56 ± 3.28 | ||
| Polyrhachis dives | 6.33 ± 0.65 | 7.02 ± 0.81 | 8.17 ± 0.71 | 7.30 ± 0.51 | 43.61 ± 3.09 | 15.59 ± 2.26 | ||
| Phintelloides versicolor female | 9.65 ± 0.31 | 8.39 ± 0.88 | 21.59 ± 1.09 | 3.32 ± 0.25 | 32.86 ± 0.88 | 3.49 ± 0.56 | ||
| Phintelloides versicolor male | 5.46 ± 0.31 | 16.51 ± 0.90 | 12.35 ± 1.09 | 3.20 ± 0.32 | 19.70 ± 0.88 | 4.07 ± 0.40 | ||
| Male | Crematogaster egidyi | 10.15 ± 0.74 | 23.25 ± 1.44 | 31.56 ± 0.92 | 40.97 ± 1.87 | 20.30 ± 2.92 | 18.30 ± 2.33 | |
| Meranoplus bicolor | 4.25 ± 0.47 | 12.65 ± 1.28 | 22.65 ± 0.92 | 45.75 ± 1.87 | 30.14 ± 3.60 | 10.43 ± 1.24 | ||
| Technomyrmex sp. | 24.15 ± 0.74 | 38.36 ± 1.44 | 31.46 ± 0.92 | 34.90 ± 1.87 | 14.28 ± 1.85 | 27.64 ± 2.47 | ||
| Polyrhachis jianghuaensis | 22.73 ± 0.73 | 18.19 ± 1.41 | 19.25 ± 0.92 | 48.75 ± 1.87 | 29.84 ± 3.44 | 12.76 ± 1.17 | ||
| Polyrhachis dives | 5.80 ± 0.40 | 6.72 ± 0.45 | 8.13 ± 0.51 | 13.29 ± 1.66 | 12.98 ± 1.43 | 32.82 ± 2.54 | ||
| Phintelloides versicolor female | 9.51 ± 0.33 | 12.40 ± 1.13 | 25.55 ± 0.48 | 7.93 ± 0.69 | 24.12 ± 0.82 | 14.24 ± 1.02 | ||
| Phintelloides versicolor male | 5.60 ± 0.33 | 20.55 ± 1.13 | 16.32 ± 0.48 | 2.99 ± 0.39 | 10.96 ± 0.82 | 14.11 ± 1.02 | ||
Note: Data are presented as means ± standard errors. Color contrast values >3 JND suggest increasingly distinguishable colors, while values ≤3 indicate low discriminability of the colors for a given visual system.
See also Figures 4 and S4 in the supplemental information.
Validity of Batesian mimicry and protective coloration in S. collingwoodi
Because we characterized ant-like locomotion and explored the mechanisms promoting brilliant body coloration in S. collingwoodi, we performed a series of antipredation experiments to further evaluate the possibility that this phenotypic combination reduces predation risk by imperfectly mimicking ants. We used S. collingwoodi and Phi. versicolor as the prey and exposed them to different potential predators, the jumping spider Por. labiata and the praying mantis G. brunneri. With Por. labiata as the potential predator, a total of 17 trials were conducted to test whether locomotion and background matching jointly contributed to low predation risk in S. collingwoodi. During the predator–ant interaction phase, Por. labiata showed obvious avoidance of the ant C. egidyi in 11 trials and did not show a response to the presence of the ant C. egidyi in the other six trials. No attacks on the ant were observed in any trial. During the predator‒prey interaction phase, Por. labiata were equally likely to orient toward the prey first regardless of the prey characteristics and position (S. collingwoodi: n = 6, Phi. versicolor: n = 11; left: n = 10, right: n = 7; GLMM: χ2(1) = 2.32, p = 0.13); Figure 5A; Table S5). However, prey characteristics, but not position, predicted the attack likelihood, such that Por. labiata spent significantly less time assessing the mimetic species S. collingwoodi than the nonmimetic species Phi. versicolor (LMM: F1,22 = 8.31, p = 0.009; Figure 5B; Table S6). Moreover, S. collingwoodi incurred a lower predation risk than Phi. versicolor; Por. labiata launched attacks in five trials, and all these attacks were exclusively toward Phi. versicolor.
Figure 5.

Antipredation assays for different species or manipulated S. collingwoodi individuals
(A and B) Por. labiata initiated prey assessment equally toward Phi. versicolor (n = 11) and S. collingwoodi (n = 6), but spent significantly longer time assessing the nonmimetic species Phi. versicolor, indicating a higher attack likelihood compared with that of the mimetic species S. collingwoodi.
(C and D) G. brunneri initiated prey assessment equally (Phi. versicolor: n = 8; S. collingwoodi: n = 4), and spent the same amount of time assessing both prey species, suggesting that the nonmimetic species Phi. versicolor and the mimetic species S. collingwoodi bore similar extents of predation risk.
(E) Illustration of manipulations applied to S. collingwoodi individuals to disentangle the role of ant-like locomotor characteristics and camouflaged body coloration in antipredation. From left to right: intact individual (L+C+), colorless individual (L+C-), foreleg-removed individual (L-C+), both foreleg-removed and colorless individual (L-C-).
(F) Por. labiata spent a significantly longer time assessing L-C+ individuals than L+C+ and L+C- individuals, indicating that ant-like locomotor characteristics contributed to a lower predation risk in S. collingwoodi. Moreover, Por. labiata spent a slightly shorter time assessing L+C- individuals than L+C+ individuals and a slightly shorter time assessing L-C- individuals than L-C+ individuals, suggesting that the ant-like color may also provide S. collingwoodi with some protection. ∗, p < 0.05; ∗∗, p < 0.01. Boxplots in (B), (D) and (F)show median, upper and lower quartiles, and maxima and minima; dots show raw data. See also Tables S5 and S6 in the supplemental information.
With G. brunneri as the potential predator, we performed another 17 trials. Unlike the obvious avoidance of C. egidyi ants by Por. labiata, C. egidyi ants were eaten by the mantis in five trials during the predator–ant interaction phase and thus were excluded from further analysis. In ten of the remaining 12 trials, the mantis attacked the ant, whereas obvious avoidance or no interaction with the ant was observed in each of the other two trials. During the predator‒prey interaction phase, the predator oriented first toward the prey, and this outcome was independent of prey characteristics and position (S. collingwoodi: n = 4, Phi. versicolor: n = 8; left: n = 6, right: n = 6; GLMM: χ2(1) = 2.56, p = 0.11; Figure 5C; Table S5). Neither prey characteristics nor position predicted the attack likelihood, such that G. brunneri spent the same amount of time assessing each prey (LMM: F1,22 = 2.59, p = 0.12; Figure 5D; Table S6). Moreover, the mantis launched an attack in ten trials, five of which were toward S. collingwoodi and the other five of which were toward Phi. versicolor (Fisher’s exact test: p = 1.000). These results indicate that the mimetic species S. collingwoodi and the nonmimetic species Phi. versicolor experience similar predation risks by predators that do not avoid ants.
We further investigated the effects of ant-like behavior and body coloration as a form of camouflage on predator avoidance. For this purpose, we conducted the antipredation experiments described above using manipulated S. collingwoodi as the prey and Por. labiata as the predator. For spider manipulation, we removed one foreleg (L-C+), painted the dorsal side of the carapace and the abdomen black (L+C-) or conducted both alternations (L-C-) and then examined how the predator responded toward each form compared to the intact individual (L+C+) (Figure 5E). To determine whether color manipulation affected the spider’s behavioral pattern, we performed gait analysis comparisons between color-manipulated individuals (L+C-, N = 5) and normal individuals (L+C+, N = 4). We detected no difference between color-manipulated and normal individuals for either the probability of holding forelimbs above the head when stationary (manipulated: 0.28 ± 0.04, intact: 0.23 ± 0.06; two-sample t test: t(7) = 0.69, p = 0.51) or moving (manipulated: 0.01 ± 0.003, intact: 0.02 ± 0.01; two-sample t test: t(7) = −1.67, p = 0.14) or the probability of holding the abdomen above the head during stationary stage (manipulated: 0.17 ± 0.04, intact: 0.20 ± 0.02; two-sample t test: t(7) = −0.65, p = 0.54). We performed a total of 39 trials, and no ant was eaten during the predator-ant interaction phase. We excluded one trial from the dataset in which the predator was not active and only paid attention to one of the four prey candidates for a very short time. We found that manipulation significantly affected the predator’s response (LMM: F3,25 = 3.09, p = 0.045). Specifically, foreleg-removed prey (L-) experienced a higher predation risk; Por. labiata spent a significantly longer time assessing L-C+ individuals than L+C- and L+C+ individuals and a slightly longer time assessing L-C- individuals than L+C- and L+C+ individuals, indicating the contribution of ant-like locomotion to a lower predation risk. We also observed that Por. labiata spent a slightly shorter time assessing L+C- individuals than L+C+ individuals and a slightly shorter time assessing L-C- individuals than L-C+ individuals, suggesting that the artificial dark color may have provided some protection due to its similarity with dull ants. Prey position did not affect how much time Por. labiata spent assessing the prey (LMM: F3,125 = 1.01, p = 0.389; Figure 5F; Table S6). Moreover, Por. labiata launched a total of ten attacks in nine trials, four of which were toward L-C+ individuals and only two of which were toward L-C-, L+C-, and L+C+ individuals. Notably, no significant differences were found between treatments (Fisher’s exact test: p = 0.843); however, L-C+ individuals experienced more attacks.
In short, our findings support the idea that the combination of locomotor characteristics and body coloration of S. collingwoodi provides effective protection against specific predators that show ant avoidance, which further supports the presence of a Batesian mimetic complex in S. collingwoodi and ants.
Discussion
In this study, we combined trait measurements and receiver responses to comprehensively assess the accuracy and driving forces of imperfect locomotor mimicry in S. collingwoodi. We found that S. collingwoodi individuals typically move in a fashion similar to that of multiple sympatric ants, whereas the bright-colored appearance blends themselves well into their living environment. In antipredation assays, spider-eating and ant-avoiding predators showed lower predation likelihood on S. collingwoodi than on nonmimetic salticids.
By quantitatively demonstrating the locomotion resemblance of S. collingwoodi to its ant models, we provide practical evidence that such mimicry increases the likelihood of survival, thus highlighting the importance of locomotor mimicry. S. collingwoodi is not necessarily a perfect mimic, as trajectory analysis and gait analysis revealed high similarity between S. collingwoodi and multiple ant species. Specifically, S. collingwoodi better resembled small ant species (i.e., C. egidyi, M. bicolor and Technomyrmex sp.) than large ant species (i.e., Pol. jianghuaensis and Pol. dives). We also investigated the unpalatability of potential ant models and found that Polyrhachis ants are the most unpalatable because of their large body size and impressive defensive capability (i.e., numerous and long spines); Technomyrmex sp. was the least unpalatable, and M. bicolor and C. egidyi were in between. These results support the multiple models hypothesis that general mimics may gain higher fitness than specific mimics by adopting intermediate phenotypes corresponding to multiple models.20 Of interest, although Polyrhachis ants are more unpalatable than the other three small ants, S. collingwoodi seems to behaviorally mimic the latter to a higher degree. This is possibly due to a body structure limitation (i.e., S. collingwoodi is smaller than Polyrhachis ants and has a similar body size to small ant models such as C. egidyi and M. bicolor). Alternatively, some ant species may have a wider distribution or higher abundance, which may provide more protection to their mimics. Indeed, during our field trips, we noted that the distributions of M. bicolor, C. egidyi, and Technomyrmex sp. overlapped at multiple collection sites with high abundance, and M. bicolor shared every occupied habitat with S. collingwoodi. A higher co-occurrence rate may also promote the mimicking by S. collingwoodi of these ants (Figure 1A). The various abundance and unpalatability of multiple models may benefit S. collingwoodi in multiple ways; the former may lie in the dilution effect whereas the latter may imply Batesian mimicry, which may both effectively divide or reduce the danger from a successful predator.29,30 Nevertheless, the protective role of mimicry in S. collingwoodi does not support the multiple predators hypothesis that different predators may impose differential selective pressures on the prey.23,31
Relative to the nonmimetic species Phi. versicolor, S. collingwoodi showed a significantly reduced likelihood of predation risk by the spider-eating salticid Por. labiata but not the praying mantis G. brunneri. Both jumping spiders and mantids are known to be active predators that utilize visual cues to locate their prey; thus, the visual information used and how this information is processed are important for understanding decision-making regarding prey selection.31Por. labiata is a spider-eating predator with high cognitive function and complex predation strategies that develops hunting strategies through careful observation and trial-and-error tactics.27,32,33 With such cautious predation behavior, Por. labiata launches an attack only when it can distinguish between S. collingwoodi and ants with high confidence, as a random attack on an ant-like animal may result in unexpected injury. In contrast, the praying mantis G. brunneri is a predator with more general feeding habits and, in particular, a much larger body size than either prey species or the ant species used in this study. Such distinct differences could cause an indiscriminate attack tendency of G. brunneri toward both prey types, given that body size and mass are principal elements that may affect agonistic animal interactions.34
In addition, we took body color into account to interpret this phenomenon of imperfect mimicry. Relative to the dynamic visual signal released by locomotion, coloration and color patterns have been more thoroughly demonstrated in many species and have the potential to serve as static visual signals that protectively benefit the mimic. We revealed a potential role of the brilliant body coloration of S. collingwoodi in camouflage by conducting visual system-based color comparisons between the ant-mimicking S. collingwoodi and its host plants, using the nonmimetic species Phi. versicolor as a control. We also investigated the role of ant-like locomotion and body coloration in reducing predation using leg- or color-manipulated S. collingwoodi as the prey and Por. labiata as the predator. Of interest, we found that leg-removed S. collingwoodi suffered significantly higher predation risk (i.e., longer assessment duration by the predator), which highlighted the vital role of ant-like locomotion in reducing predation risk, whereas blackened S. collingwoodi experienced slightly lower predation risk (i.e., shorter assessment duration by the predator). Given the white background in the assay, the blackened S. collingwoodi may have mimicked an ant more accurately, as it resembled the ant in both appearance and behavior. Taken together, the results from the visual system-based color comparison indicate that the brightly colored imperfect mimic S. collingwoodi may have a high survival rate in the open, as its partial mimetic resemblance to ants effectively reduces predation; whereas it hunts in the vegetation, it may retain a low predation risk given both its ant-like locomotion and camouflaged body coloration. To investigate how body coloration may contribute to spider fitness, future work should make use of an experimental apparatus with a corresponding background because the environment may influence both how the spiders behave and how the predator perceives and responds to the prey.35,36 Moreover, we hypothesized that the sexual dimorphism and female-limited polymorphism in S. collingwoodi may be driven by sexual selection, as documented in many jumping spiders,37 which warrants further investigation in the future. If this hypothesis is confirmed, S. collingwoodi may serve as a remarkable example to support body color as a key visual signal in the sexual selection of jumping spiders and to illustrate the nature of such imperfect mimics that is driven by both natural and sexual selection.
Limitations of the study
Owing to experimental conditions, we conducted unpalatability analyses of the potential ant models based on morphological traits, but did not involve other defensive strategies such as chemical repellents and venom. Given limited samples, we did not perform antipredation assays with background similar to the habitat to reveal the contribution of body coloration. As we aimed to investigate imperfect ant mimicry in S. collingwoodi, we did not explore the driving forces of female-limited polymorphism. Additional samples and further investigations will be needed to address the above issues.
Ethical approval
No ethical approval was required.
STAR★Methods
Key resources table
| REAGENT or RESOURCE | SOURCE | IDENTIFIER |
|---|---|---|
| Critical commercial assays | ||
| HiPure Insect DNA Kit | Magen | D3129-03 |
| Deposited data | ||
| Siler collingwoodi CO1 gene partial sequence | This paper; NCBI Nucleotide | ON834482 |
| Toxeus maxillosus CO1 gene partial sequence | This paper; NCBI Nucleotide | ON827526 |
| Crematogaster egidyi CO1 gene partial sequence | This paper; NCBI Nucleotide | OQ607473 |
| Meranoplus bicolor CO1 gene partial sequence | This paper; NCBI Nucleotide | OQ607472 |
| Technomyrmex sp. CO1 gene partial sequence | This paper; NCBI Nucleotide | OQ627925 |
| Polyrhachis jianghuaensis CO1 gene partial sequence | This paper; NCBI Nucleotide | OQ612558 |
| Polyrhachis dives CO1 gene partial sequence | This paper; NCBI Nucleotide | OQ607475 |
| Behavioral raw data | This paper; Mendeley Data | https://doi.org/10.17632/jrvzn7n475.1 |
| Experimental models: Organisms/strains | ||
| Siler collingwoodi | Collected from Hainan, China | N/A |
| Phintelloides versicolor | Collected from Hainan, China | N/A |
| Meranoplus bicolor | Collected from Hainan, China | N/A |
| Crematogaster egidyi | Collected from Hainan, China | N/A |
| Technomyrmex sp. | Collected from Hainan, China | N/A |
| Polyrhachis dives | Collected from Hainan, China | N/A |
| Polyrhachis jianghuaensis | Collected from Hainan, China | N/A |
| Portia labiata | Collected from Hainan, China | N/A |
| Gonypeta brunneri | Collected from Hainan, China | N/A |
| Oligonucleotides | ||
| Forward primer for CO1: GGTCAACAAATCATAAAGATATTGG | This paper | N/A |
| Reverse primer for CO1: TAAACTTCAGGGTGACCAAAAAATCA | This paper | N/A |
| Software and algorithms | ||
| MATLAB R2020a | MathWorks | https://ww2.mathworks.cn/products/new_products/release2020a.html |
| R v4.1.2 | R Core Team, 202138 | https://www.R-project.org/ |
| Solomon Coder beta19.08.02 | András Péter | https://solomon.andraspeter.com/ |
| ArcMap 10.8 | Esri | https://desktop.arcgis.com/en/arcmap/ |
| BLASTX | NCBI | https://blast.ncbi.nlm.nih.gov/Blast.cgi |
| pavo v2.0 | Maia et al., 201939 | https://github.com/rmaia/pavo |
| Trajr | McLean and Volponi, 201840 | https://github.com/JimMcL/trajr |
| multcomp | Hothorn et al., 200841 | https://github.com/r-forge/multcomp |
| Car | Fox and Weisberg, 201942 | https://github.com/renesas-rcar |
| DLTdv8a | Hedrick, 200843 | https://biomech.web.unc.edu/dltdv/ |
| Other | ||
| Sony DSC-WX500 camera | Sony | N/A |
| Nikon SMZ18 stereo microscope | Nikon | N/A |
| Ocean Optics FLAME-S spectrometer | Ocean Optics Inc. | N/A |
| DH2000-BAL deuterium and tungsten halogen light source | Ocean Optics Inc. | N/A |
Resource availability
Lead contact
Further information and requests for resources and reagents should be directed to and will be fulfilled by the Lead Contact, Wei Zhang (weizhangvv@pku.edu.cn).
Materials availability
All specimens used in this study are available from the lead contact upon request.
Experimental model and subject details
Animal collection
We collected juvenile and adult S. collingwoodi from southern Hainan Province, China, between November 2019 and October 2022. We also collected cooccurring putative ant model species (C. egidyi, M. bicolor, Technomyrmex sp., Pol. jianghuaensis and Pol. dives) and the nonmimetic jumping spider Phi. versicolor, as well as potential predators, i.e., the jumping spider Por. labiata and praying mantis G. brunneri. Specifically, regarding putative ant models, only worker ants were collected. All animals were collected with the permission and assistance of Wuzhishan National Natural Reserve (China) and were collected by visual inspection and beating the foliage of bushes on sunny days during daylight hours when the animals were most active. Specimens were brought to the laboratory at Peking University immediately after the fieldwork. Adult spiders and mantids were housed separately in 5.5 cm × 5.5 cm × 4.5 cm clear containers, fed Drosophila flies twice a week, and provided with water ad libitum. Based on the microhabitat where the spiders were collected, juvenile S. collingwoodi were kept in groups in 30 cm × 10 cm × 20 cm clear containers. To imitate the spider’s original environment, three inner sides of the container housing juveniles collected from the host plants of I. chinensis were covered with red paperboard, while the container housing juveniles collected from the host plants of C. microphylla were covered with green paperboard. We also included I. chinensis or C. microphylla in the containers. Juvenile S. collingwoodi were inspected daily; once they matured, we transferred them into individual containers. Ants were kept in Petri dishes in their collection groups and fed sugar water. All animals were reared at 28 ± 2°C under a 12 h light:12 h dark photoperiod.
Methods details
Species identification
Morphological and molecular methods were combined for species identification. The collected spiders and ants were anesthetized with carbon dioxide and photographed (Figure 1; Figure S3). Morphological identification was performed by referring to the World Spider Catalog,44 AntWeb45 and taxonomic references.46,47,48,49 Moreover, legs on the right side of the spider or the ant were removed for genomic DNA extraction using the HiPure Insect DNA Kit. The DNA fragment of the mitochondrial CO1 gene was amplified using PCR with the forward primer (GGTCAACAAATCATAAAGATATTGG) and the reverse primer (TAAACTTCAGGGTGACCAAAAAATCA) and was sequenced (Table S1). The CO1 gene sequences were compared to the DNA sequences in the NCBI database using BLAST.50
Trajectory analysis
To assess locomotor mimicry, we characterized and compared the trajectories of the ant-mimicking S. collingwoodi, nonmimetic species Phi. versicolor, and putative ant models (S. collingwoodi: n = 25, Phi. versicolor: n = 11, five ant species (M. bicolor: n = 9; C. egidyi: n = 11; Technomyrmex sp.: n = 11; Pol. jianghuaensis: n = 11; Pol. dives: n = 15). Animals were allowed to move freely on a 25 cm × 25 cm white platform surrounded by a 20 cm-tall white paper wall. Trials were recorded with a Sony DSC-WX500 camera from above (1920 pixels × 1080 pixels at 50 fps) with an LED light providing illumination. A 20-cm customized scale was used for calibration.
Before the experiment, we transferred one animal from its host container into a covered 5-mL microtube that was inserted into the center of the platform; the animal was left there for a 2-min acclimation period. Next, we removed the cover and allowed the individual to move freely on the platform for 5 min or until it reached the boundary of the platform, whichever happened first. Once the trial was performed, we brought the animal back to its host container and cleaned the platform with 75% alcohol to remove the chemical material and the spider’s silk. The next trial was started 15 min later to ensure alcohol volatilization. No individuals were reused.
The trajectories were extracted using the DLTdv8a digitizing package43 in MATLAB51 To analyze and compare the trajectories between the ant-mimetic species S. collingwoodi, ants, and nonmimetic species Phi. versicolor. Stationary periods were excluded from digitization and further analysis. For each trajectory, the X–Y coordinates of the head were obtained by manual frame-by-frame digitization. The data were processed using the R package trajr40 to generate the following trajectory parameters: (a) sinuosity, a reliable estimate of the tortuosity of a random search path52; (b) directional change (DC, mean and standard deviation), a measurement of the angular change in direction over time8; (c) direction autocorrelation, a measurement of the overall regularity of trajectory shape that characterizes the amplitude (C(Δs)) and wavelength (Δs) of periodicity in a trajectory10; (d) walking speed (mean and standard deviation), determined by the displacement of the head over the horizontal plane/time; and (e) acceleration (mean and standard deviation), a measurement of changes in walking speed between steps. The X–Y coordinate data were smoothed using a Savitzky–Golay filter before data processing (window size: 41 samples; polynomial order: 6).53 We also noted three categorical parameters characterizing the walking pattern, namely, whether the individual jumped during the recording session, whether it lifted its first pair of legs (for spiders) or its antennae (for ants), and whether it raised its abdomen.
Gait analysis
To compare the gait features among S. collingwoodi, Phi. versicolor, and ants, we filmed animals walking across a slide surface using two high-speed cameras, one capturing a top view and the other capturing a side view (S. collingwoodi: n = 9, Phi. versicolor: n = 10, M. bicolor: n = 8; C. egidyi: n = 8; Technomyrmex sp.: n = 8; Pol. jianghuaensis: n = 8; Pol. dives: n = 8; video recorded at 500 frames per second). The movements of the forelimbs of the spiders and ants were quantified using the DLTdv8a application43 in MATLAB.51
We calculated the differences in height between the spider’s forelimb and the ant’s antennae relative to the head. We divided the motion into two states, i.e., a stationary state, in which the animal’s moving velocity was slower than 3 mm/s (for the three small ant species) or 10 mm/s (for the other species), and a movement state. Since the velocity calculation was based on the change in the centroid of different species in the high-speed video, their behavior at rest changed their centroid, resulting in a low velocity. Therefore, we artificially revised the results based on the video, that is, to determine a speed limit.10 Specifically, S. collingwoodi and C. egidyi ants were observed to raise their abdomen during movement; therefore, we also recorded the height of their abdomen relative to the head at different velocities for S. collingwoodi, C. egidyi and Phi. versicolor and calculated the probability that the height of the abdomen was above the head.10
Unpalatability analysis of the potential ant models
We estimated the unpalatability of the potential ant model species, i.e., M. bicolor, C. egidyi, Technomyrmex sp., Pol. jianghuaensis, and Pol. dives, using the following four traits: number of spines, total spine length, total body size and mandible size.54 For each species, eight individuals were measured using a Research Stereo Microscope (Nikon SMZ18) and inbuild microscope imaging software (NIS-Elements v5.11.01).
Spectrophotometry and visual modeling
Color reflectance measurement
To quantify the color similarity between the spiders and host plants, reflectance spectra of the main color patches for each individual were obtained using reflectance spectrophotometry. Specifically, we measured the two chromatic color patches on the dorsal carapace, i.e., the dorsal carapace green patch (DCG) and the dorsal carapace red patch (DCR), and two chromatic color patches on the abdomen, i.e., the dorsal abdomen red/golden patch (DAR) and the dorsal abdomen blue patch (DAB). For further comparison between S. collingwoodi and sympatric ants, we also measured the two achromatic color patches on the abdomen, i.e., the posterior part of the dorsal abdomen black patch (DEB) and the goldish brown patch (DEG) (Figure 3A). To quantify the visual background where the spiders are most active, we measured the reflectance spectra of both the petals and leaves of I. chinensis and the twigs and leaves of C. microphylla, with two replicates for each of five plants. The measurements were conducted using an Ocean Optics FLAME-S spectrometer (Ocean Optics Inc., USA) and a DH2000-BAL deuterium and tungsten halogen light source (Ocean Optics Inc., USA), which provides stable full-spectrum light (210–2500 nm). A customized three-dimensional adjustable translation stage was used to hold the illumination probe and the reflection probe. A Spectralon white standard (Labsphere, USA) was used as the white reference, and the shutter was closed for the dark reference. To facilitate color measurement, the spiders and ants were temporarily anesthetized with carbon dioxide for approximately 5 min before the measurement. Five spectral readings from each color patch were recorded, and the mean values of the five readings were used for later spectral analysis.
Visual modeling (color discrimination capability)
Spectral data analysis was performed using the R package ‘pavo’ v2.0.39 We smoothed the spectra with a span of 0.1 before further analysis. To assess the ability of potential signal receivers to discriminate spectral reflectance between the mimetic species and the potential ant models or between the mimetic species and the host plant, we fit the Vorobyev–Osorio color discrimination model55,56 and calculated the color contrast for each color patch. Jumping spiders are renowned for their remarkable color vision and acute sight, making them excellent models for studying the function of color-based visual signals. In contrast, mantids are sensitive to movement but have poor color vision. In this study, we used the sympatric spider-eating jumping spider Por. labiata and the praying mantis G. brunneri as potential predators. Thus, we performed visual modeling based on salticid visual sensitivity and mantid visual sensitivity separately.
Since the visual sensitivities of Por. labiata are not yet available, we used data from another salticid species, Habronattus pyrrithrix, in which three types of photoreceptors (i.e., UV, green/medium wavelength (MW), and red/long wavelength (LW)) have been reported, i.e., a trichromatic model with sensitivity peaks at 377 nm, 530 nm and 626 nm.57 The Weber fraction of the long-wavelength-sensitivity (LWS) cone was set at 0.05 due to a lack of behavioral data on the visual thresholds of these species.57 A cone ratio of 1:2:4 (UV:MW:LW) was used.57 D65 data were used as the irradiance spectrum. Contrast values are expressed in units of the just noticeable difference (JND), which indicates the discriminability between two colors for a given visual system. Normally, a JND value less than three indicates difficulty with color discrimination in natural lighting conditions, while larger values indicate increasing discriminability.58,59 JND values were calculated for all pairwise comparisons between the spider and the ants, also between the spider and the host plant separately. Average values were generated for further analysis.
The photoreceptor sensitivity of the other potential predator, the praying mantis G. brunneri, is unknown; therefore, we used data from Tenodera aridifolia, which has only one photoreceptor with a peak sensitivity between 510 nm and 520 nm.60 We constructed a monochromatic model for mantid vision with peak sensitivity of a single photoreceptor using the average value, i.e., 515 nm. We estimated receptor noise using a honeybee Weber fraction of 0.13,53 as used in other insect systems.61
Antipredation experiment 1 – Differences in predation risk between mimetic and nonmimetic spiders
To evaluate whether S. collingwoodi benefits from adopting ant-like walking patterns and bearing body colorations that seem to well match host plants, we performed a series of antipredation experiments using S. collingwoodi and Phi. versicolor as the prey and Por. labiata (n = 9) and G. brunneri (n = 11) as the predators. Given the small number of predators available, some of the predators were reused, but the interval between two rounds was at least one week. The experiments were performed in an 8 cm × 8 cm × 3 cm white cuboid box under natural light and at laboratory temperatures (28 ± 2°C), which were similar to the conditions in the field. The platform was divided into three chambers: one large chamber for the predator and two small chambers containing one prey each. An opaque paperboard was placed between the two small chambers, while the small rooms and the large room were separated by full-spectrum-transmitting glass. As a result, only visual signals were available between the predator and prey. The chambers were covered with a piece of quartz glass, preventing the animals from escaping. The whole apparatus was surrounded with white paper to prevent external influences. To standardize the hunger level of the predator, each predator was fasted for 5 days before the experiment. Each prey animal was fed fruit flies the day before the experiment. All behavioral assays were conducted between 10:00 and 17:00.
For each trial, we first introduced the predator into the large chamber and provided a 3-min acclimation period. Next, we introduced a C. egidyi ant into the large chamber, covered the top with glass, and recorded the interaction between the ant and the predator to verify whether the ant had an effect as the model of Bastian mimicry, i.e., the predator–ant interaction phase. The interaction lasted for 5 min unless the ant was eaten. Interactions between the predator and the ant included the following: (1) the predator did not interact with the ant, (2) the predator attacked the ant but failed to capture it, (3) the predator attacked the ant but was bitten by the ant, thus avoiding any more interactions, or (4) the predator consumed the ant. The experiment ceased if the ant was consumed; otherwise, it continued to the next phase.
After the predator–ant interaction phase, we removed the ant and kept the predator in the large chamber. Meanwhile, we placed the opaque paperboard between the large chamber and the small chambers and introduced one S. collingwoodi individual and one Phi. versicolor individual into the two small chambers for the predator‒prey interaction phase. We randomly paired one S. collingwoodi individual with one Phi. versicolor individual and exposed them simultaneously to the larger salticid predator or the mantis. After a 3-min acclimation period, we removed the opaque paperboard and allowed visual cue-based interaction between the predator and the prey. The interactions were recorded for 10 min using a Sony DSC-WX500 camera.
For each trial, we played back and analyzed the video frame-by-frame using Solomon Coder,62 starting from the moment that the predator turned its body and oriented toward one of the preys to the end of the video. The predator was considered to be performing “prey assessment” while it was oriented toward and/or approached the prey, which indicated a tendency for predation. We noted which prey the predator first oriented toward and whether the predator launched an attack toward either of the prey. We also recorded the prey assessment duration of the predator toward each prey, i.e., the attack likelihood, which served as a proxy of predation tendency in which a shorter duration suggested a lower predation risk.
Antipredation experiment 2 – Contribution of mimetic traits and body coloration to low predation risk in S. collingwoodi
To determine whether S. collingwoodi benefits both from ant-like locomotion patterns and background-matching body colorations which seem to reduce ant-mimicry accuracy on a visual level, we further conducted antipredation experiments using manipulated male S. collingwoodi individuals as prey and Por. labiata (n = 15) as the predator. Given the small number of predators available, some of the individuals were reused; the interval between two rounds was at least five days. The manipulations that were applied to the prey included: (a) removing the first leg on either the left or the right side of the prey, i.e., leg-removed individuals (L-C+); (b) covering the dorsal side of the cephalothorax and the abdomen of the prey with black acrylic paint, i.e., color-manipulated individuals (L+C-); (c) removing one of the first legs and covering the prey with black paint, i.e., leg-removed color-manipulated individuals (L-C-); and (d) no manipulation, i.e., intact, normal-colored individuals (L+C+). The experimental platform was similar to that in the predation experiments for different species, except that the platform was divided into five 4 cm × 4 cm × 4 cm chambers forming a cross-like configuration with the predator in the central chamber and the prey in the four surrounding chambers.
Before each trial, we covered the top surface with a piece of quartz glass and placed an opaque paperboard between the chambers to prevent visual contact between the predator and the prey. We first introduced the predator into the central chamber. After a 3-min acclimation period, we introduced a C. egidyi ant into the central chamber and recorded the predator–ant interaction phase. The interaction lasted for 5 min unless the ant was consumed, at which point the experiment was ceased; otherwise, the experiment continued to the predator‒prey interaction phase.
We removed the ant after the predator–ant interaction phase, kept the predator in the central chamber, and introduced four male S. collingwoodi individuals of different treatments into the four surrounding chambers. The position of the prey was randomly assigned. After a 3-min acclimation period, we removed the opaque paperboard and allowed visual cue-based interactions between the predator and the prey. The predator was allowed to interact with the prey for 10 min. Both the predator–ant interaction phase and the predator–prey interaction phase were recorded using a Sony DSC-WX500 camera. Videos were later played back and analyzed using Solomon Coder.62
Quantification and statistical analysis
All statistical analyses were performed using R program,38 and means ± standard errors are reported. Normality and homogeneity of the residuals were verified before further analysis. All tests were two-tailed and conducted with α = 0.05.
Trajectory analysis
To assess the extent of locomotor mimicry in S. collingwoodi relative to the walking pattern of putative ant models, we first performed a principal component analysis (PCA) on trajectory- and movement rate-related parameters, i.e., sinuosity, the mean and standard deviation of directional change, direction autocorrelation (C(Δs) and Δs, respectively), and the mean and standard deviation of movement speed and acceleration. All variables were zero-centered and scaled. After principal components (PCs) were obtained for each individual, we then separately compared the PCs among species using analysis of variance (ANOVA) or Kruskal–Wallis tests. To further identify specific species differences, we performed multiple ANOVAs for each high-loading parameter as well as post hoc Tukey’s paired comparisons using the “multcomp” package were used (if p < 0.05 in the ANOVAs).41 We applied the Shapiro‒Wilk test and Levene’s test to examine the assumptions of normality and homogeneity of variance, respectively. Data were log- or square root-transformed when necessary; otherwise, Welch’s ANOVA was performed when the assumption of homogeneity of variance was violated, or the nonparametric Kruskal–Wallis test was performed when the assumption of normality was violated, followed by Games-Howell multiple comparisons or Dunn’s test with Bonferroni correction for pairwise comparisons.
Gait analysis
We compared the differences of the probability that the height of the abdomen was above the head for C. egidyi, S. collingwoodi and Phi. versicolor using ANOVA, followed by Tukey’s paired comparisons in the “multcomp” package.
Spectrophotometry and visual modeling
We performed multiple one-way (Welch’s) ANOVAs or Kruskal‒Wallis tests to evaluate how well S. collingwoodi matched their microhabitat in terms of body coloration compared to sympatric species Phi. versicolor. Color contrast was used as the dependent variable, and species and morph, i.e., S. collingwoodi female, S. collingwoodi male, Phi. versicolor female, and Phi. versicolor males, were used as independent variables. Color contrast values were log-transformed to meet the normality and homogeneity of variance assumptions when necessary, and raw data are presented in the figures. Post hoc tests were conducted with the “multcomp” package using Tukey’s paired comparisons,41 Games-Howell multiple comparisons, or Dunn’s test with Bonferroni correction. The average of the pairwise JND values of each individual was used for comparison.
Antipredation experiment 1 – Differences in predation risk between mimetic and nonmimetic spiders
To examine whether movement pattern affected prey assessment initiation by the predator, i.e., which prey the predator first oriented toward, and prey assessment duration, i.e., attack likelihood, we fitted a generalized linear mixed model (GLMM) with a binomial distribution and a linear mixed model (LMM). The response variables were whether the prey was first oriented toward by the predator (yes = 1, no = 0) and the predator assessment duration. The initial model included the prey characteristics, i.e., mimetic or nonmimetic, prey position, i.e., left or right, and their interaction as the fixed factors. Predator ID and prey ID were included as random factors. Multicollinearity inspection was conducted using the function “vif” in the package “car”.42 We conducted backward elimination of the nonsignificant interaction term and compared models using the Akaike information criterion (AIC) and ANOVAs at each step for model reduction. We retained the model with the smallest AIC value. LMM fitting, GLMM fitting, and post hoc tests were implemented by lme4, lmerTest, car, and lsmeans in the R environment.42,63,64,65 Finally, Fisher’s exact test was performed to examine whether prey characteristics affected the predator’s attacking behavior. Analyses were performed separately for the two predators. Notably, Fisher’s exact test was only performed to test the attacking behavior of the mantis since the jumping spider Por. labiata launched attacks exclusively toward Phi. versicolor.
Antipredation experiment 2 – Contribution of mimetic traits and body coloration to low predation risk in S. collingwoodi
We also analyzed how mimetic traits and body coloration affected predator assessment duration by using an LMM, with predator assessment duration as the response variable and manipulation (i.e., L+C+, L+C-, L-C+, or L-C-), prey position (i.e., north, south, east, or west), and their interaction as fixed factors. Predator ID and prey ID were included as the random factors. We inspected multicollinearity using the function “vif” in the package “car”.42 We conducted backward elimination of the nonsignificant interaction term and compared models using the Akaike information criterion (AIC) and ANOVAs at each step for model reduction; the model with the smallest AIC value was retained. We then applied Fisher’s exact test to evaluate whether both mimetic traits and body coloration influenced attacking behavior.
Acknowledgments
We thank the Wuzhishan Division of the Hainan Tropical Rainforest National Park Bureau, the Wuzhishan National Natural Reserve, Shun Huang, and Yunhu Mo for their help with sample collection. We thank Fengyuan Li, Han Yang, Dequn Teng, and Peiwen Yang for help rearing the animals in the laboratory. This project was supported by grants from the National Natural Science Foundation of China (32170420 to W.Z.), the Beijing Natural Science Foundation (JQ19021 to W.Z.), the Peking-TsinghuaCenter for Life Sciences (to W.Z.), the State Key Laboratory of Protein and Plant Gene Research (to W.Z.), the Qidong-SLS Innovation Fund (to W.Z.), Benyuan Charity Young Investigator Exploration Fellowship in Life Science (to W.Z.), the Postdoctoral Fellowship of Peking-TsinghuaCenter for Life Sciences (to H.Z.) and the Beijing Natural Science Foundation (5234035 to H.Z.).
Author contributions
H.Z. conceived the idea, designed the project, collected the animals from the field, collected and analyzed the spectral data, performed data analysis, and wrote the manuscript. D.Z. helped design the project, collected the animals from the field, conducted the behavioral assays in the laboratory, performed data analysis, and interpreted the results. Z.Z. conducted the behavioral assays in the laboratory, performed data analysis, and interpreted the results. H.G. collected the animals from the field and performed data analysis. W.Z. directed and designed the project, performed data analysis, and wrote the manuscript. All authors proofread and approved the manuscript.
Declaration of interests
The authors declare they have no competing interests.
Published: May 17, 2023
Footnotes
Supplemental information can be found online at https://doi.org/10.1016/j.isci.2023.106747.
Contributor Information
Hua Zeng, Email: zenghua@pku.edu.cn.
Wei Zhang, Email: weizhangvv@pku.edu.cn.
Supplemental information
Data and code availability
The datasets that were compiled and analyzed in this study are publicly available from Mendeley Data (https://doi.org/10.17632/jrvzn7n475.1). The CO1 gene sequences are available from the NCBI Nucleotide (https://www.ncbi.nlm.nih.gov/nuccore) with accession numbers ON834482, ON827526, OQ607473, OQ607472, OQ627925, OQ612558, and OQ607475.
References
- 1.Bates H.W. Contributions to an insect fauna of the Amazon valley (Leopidoptera: Heliconidae) Biol. J. Linn. Soc. Lond. 1981;16:41–54. doi: 10.1111/j.1095-8312.1981.tb01842.x. [DOI] [Google Scholar]
- 2.Vane-Wright R.I. On the definition of mimicry. Biol. J. Linn. Soc. Lond. 1980;13:1–6. doi: 10.1111/j.1095-8312.1980.tb00066.x. [DOI] [Google Scholar]
- 3.Clarke C.A., Sheppard P.M. The evolution of mimicry in the butterfly Papilio dardanus. Heredity. 1960;14:163–173. doi: 10.1038/hdy.1960.14. [DOI] [Google Scholar]
- 4.Greene H.W., McDiarmid R.W. Coral snake mimicry: does it occur? Science. 1981;213:1207–1212. doi: 10.1126/science.213.4513.1207. [DOI] [PubMed] [Google Scholar]
- 5.Howarth B., Edmunds M., Gilbert F. Does the abundance of hoverfly (syrphidae) mimics depend on the numbers of their hymenopteran models? Evolution. 2004;58:367–375. doi: 10.1111/j.0014-3820.2004.tb01652.x. [DOI] [PubMed] [Google Scholar]
- 6.Kunte K., Zhang W., Tenger-Trolander A., Palmer D.H., Martin A., Reed R.D., Mullen S.P., Kronforst M.R. Doublesex is a mimicry supergene. Nature. 2014;507:229–232. doi: 10.1038/nature13112. [DOI] [PubMed] [Google Scholar]
- 7.Penney H.D., Hassall C., Skevington J.H., Lamborn B., Sherratt T.N. The Relationship between morphological and behavioral mimicry in hover flies (Diptera: syrphidae) Am. Nat. 2014;183:281–289. doi: 10.1086/674612. [DOI] [PubMed] [Google Scholar]
- 8.Kitamura T., Imafuku M. Behavioural mimicry in flight path of Batesian intraspecific polymorphic butterfly Papilio polytes. Proc. Biol. Sci. 2015;282:20150483. doi: 10.1098/rspb.2015.0483. [DOI] [PMC free article] [PubMed] [Google Scholar]
- 9.Nelson X.J., Card A. Locomotory mimicry in ant-like spiders. Behav. Ecol. 2016;27:700–707. [Google Scholar]
- 10.Shamble P.S., Hoy R.R., Cohen I., Beatus T. Walking like an ant: a quantitative and experimental approach to understanding locomotor mimicry in the jumping spider Myrmarachne formicaria. Proc. Biol. Sci. 2017;284:20170308. doi: 10.1098/rspb.2017.0308. [DOI] [PMC free article] [PubMed] [Google Scholar]
- 11.Srygley R.B. Incorporating motion into investigations of mimicry. Evol. Ecol. 1999;13:691–708. doi: 10.1023/A:1011046202928. [DOI] [Google Scholar]
- 12.Srygley R.B. Locomotor mimicry in Heliconius butterflies: contrast analyses of flight morphology and kinematics. Phil. Trans. R. Soc. Lond. B. 1999;354:203–214. doi: 10.1098/rstb.1999.0372. [DOI] [Google Scholar]
- 13.Tan E.J., Elgar M.A. Motion: enhancing signals and concealing cues. Biol. Open. 2021;10:bio058762. doi: 10.1242/bio.058762. [DOI] [PMC free article] [PubMed] [Google Scholar]
- 14.Skowron Volponi M.A., McLean D.J., Volponi P., Dudley R. Moving like a model: mimicry of hymenopteran flight trajectories by clearwing moths of Southeast Asian rainforests. Biol. Lett. 2018;14:20180152. doi: 10.1098/rsbl.2018.0152. [DOI] [PMC free article] [PubMed] [Google Scholar]
- 15.McIver J.D., Stonedahl G. Myrmecomorphy: morphological and behavioral mimicry of ants. Annu. Rev. Entomol. 1993;38:351–379. doi: 10.1146/annurev.en.38.010193.002031. [DOI] [Google Scholar]
- 16.Sanders D., Platner C. Intraguild interactions between spiders and ants and top-down control in a grassland food web. Oecologia. 2007;150:611–624. doi: 10.1007/s00442-006-0538-5. [DOI] [PubMed] [Google Scholar]
- 17.Wilson E.O. The sociogenesis of insect colonies. Science. 1985;228:1489–1495. doi: 10.1126/science.228.4707.1489. [DOI] [PubMed] [Google Scholar]
- 18.McLean D.J., Herberstein M.E. Mimicry in motion and morphology: do information limitation, trade-offs or compensation relax selection for mimetic accuracy? Proc. Biol. Sci. 2021;288:20210815. doi: 10.1098/rspb.2021.0815. [DOI] [PMC free article] [PubMed] [Google Scholar]
- 19.Nur U. Evolutionary rates of models and mimics in Batesian mimicry. Am. Nat. 1970;104:477–486. doi: 10.1086/282682. [DOI] [Google Scholar]
- 20.Edmunds M. Why are there good and poor mimics? Biol. J. Linn. Soc. Lond. 2000;70:459–466. doi: 10.1111/j.1095-8312.2000.tb01234.x. [DOI] [Google Scholar]
- 21.Ruxton G.D., Sherratt T.N., Speed M.P. Oxford University Press; 2004. Avoiding Attack: The Evolutionary Ecology of Crypsis, Warning Signals and Mimicry. [DOI] [Google Scholar]
- 22.Kikuchi D.W., Pfennig D.W. Imperfect mimicry and the limits of natural selection. Q. Rev. Biol. 2013;88:297–315. doi: 10.1086/673758. [DOI] [PubMed] [Google Scholar]
- 23.Pekár S., Jarab M., Fromhage L., Herberstein M.E. Is the evolution of inaccurate mimicry a result of selection by a suite of predators? A case study using Myrmecomorphic spiders. Am. Nat. 2011;178:124–134. doi: 10.1086/660287. [DOI] [PubMed] [Google Scholar]
- 24.Ceccarelli F.S. Behavioral mimicry in Myrmarachne species (Araneae, Salticidae) from north Queensland, Australia. J. Arachnol. 2008;36:344–351. doi: 10.1636/CSt07-114.1. [DOI] [Google Scholar]
- 25.Cushing P.E. Myrmecomorphy and myrmecophily in spiders: a review. Fla. Entomol. 1997;80:165–193. doi: 10.2307/3495552. [DOI] [Google Scholar]
- 26.Cushing P.E. Spider-ant associations: an updated review of myrmecomorphy, myrmecophily, and myrmecophagy in spiders. Psyche: J. Entomol. 2012;2012:1–23. doi: 10.1155/2012/151989. [DOI] [Google Scholar]
- 27.Harland D.P., Jackson R.R. A knife in the back: use of prey-specific attack tactics by araneophagic jumping spiders (Araneae : Salticidae) J. Zool. 2006;269:285–290. doi: 10.1111/J.1469-7998.2006.00112.X. [DOI] [Google Scholar]
- 28.Hughes A., Liggins E., Stevens M. Imperfect camouflage: how to hide in a variable world? Proc. Biol. Sci. 2019;286:20190646. doi: 10.1098/rspb.2019.0646. [DOI] [PMC free article] [PubMed] [Google Scholar]
- 29.Lehtonen J., Jaatinen K. Safety in numbers: the dilution effect and other drivers of group life in the face of danger. Behav. Ecol. Sociobiol. 2016;70:449–458. doi: 10.1007/s00265-016-2075-5. [DOI] [Google Scholar]
- 30.Schifani E., Giannetti D., Csősz S., Castellucci F., Luchetti A., Castracani C., Spotti F.A., Mori A., Grasso D.A. Is mimicry a diversification-driver in ants? Biogeography, ecology, ethology, genetics and morphology define a second West-Palaearctic Colobopsis species (Hymenoptera: Formicidae) Zool. J. Linn. Soc. 2022;194:1424–1450. doi: 10.1093/zoolinnean/zlab035. [DOI] [Google Scholar]
- 31.Endler J.A., Mappes J. Predator mixes and the conspicuousness of aposematic signals. Am. Nat. 2004;163:532–547. doi: 10.1086/382662. [DOI] [PubMed] [Google Scholar]
- 32.Jackson R.R., Cross F.R. In: Advances in Insect Physiology. Casas J., editor. Academic Press; 2011. Spider cognition; pp. 115–174. [DOI] [Google Scholar]
- 33.Jackson R.R., Wilcox R.S. Spider flexibly chooses aggressive mimicry signals for different prey by trial and error. Beyond Behav. 1993;127:21–36. doi: 10.1163/156853993X00407. [DOI] [Google Scholar]
- 34.Reichert M.S., Quinn J.L. Cognition in contests: mechanisms, ecology, and evolution. Trends Ecol. Evol. 2017;32:773–785. doi: 10.1016/j.tree.2017.07.003. [DOI] [PubMed] [Google Scholar]
- 35.Bian X., Elgar M.A., Peters R.A. The swaying behavior of Extatosoma tiaratum: motion camouflage in a stick insect? Behav. Ecol. 2016;27:83–92. doi: 10.1093/beheco/arv125. [DOI] [Google Scholar]
- 36.Pohl S., Bungum H.Z., Lee K.E.M., Sani M.A.B., Poh Y.H., Wahab R.b.H.A., Norma-Rashid Y., Tan E.J. Age and appearance shape behavioral responses of phasmids in a dynamic environment. Front. Ecol. Evol. 2022;9:767940. doi: 10.3389/fevo.2021.767940. [DOI] [Google Scholar]
- 37.Oxford G.S., Gillespie R.G. Evolution and ecology of spider coloration. Annu. Rev. Entomol. 1998;43:619–643. doi: 10.1146/annurev.ento.43.1.619. [DOI] [PubMed] [Google Scholar]
- 38.R Core Team . R Foundation for Statistical Computing; 2022. R: A Language and Environment for Statistical Computing.https://www.R-project.org/ [Google Scholar]
- 39.Maia R., Gruson H., Endler J.A., White T.E. pavo 2: New tools for the spectral and spatial analysis of colour in R. Methods Ecol. Evol. 2019;10:1097–1107. doi: 10.1111/2041-210X.13174. [DOI] [Google Scholar]
- 40.McLean D.J., Skowron Volponi M.A. trajr: an R package for characterisation of animal trajectories. Ethology. 2018;124:440–448. doi: 10.1111/eth.12739. [DOI] [Google Scholar]
- 41.Hothorn T., Bretz F., Westfall P. Simultaneous inference in general parametric models. Biom. J. 2008;50:346–363. doi: 10.1002/bimj.200810425. [DOI] [PubMed] [Google Scholar]
- 42.Fox J., Weisberg S. Third Edition. Sage; 2019. An R Companion to Applied Regression. [Google Scholar]
- 43.Hedrick T.L. Software techniques for two- and three-dimensional kinematic measurements of biological and biomimetic systems. Bioinspir. Biomim. 2008;3:034001. doi: 10.1088/1748-3182/3/3/034001. [DOI] [PubMed] [Google Scholar]
- 44.World Spider Catalog . Natural History Museum Bern; 2021. World Spider Catalog. Version 22.5.http://wsc.nmbe.ch [DOI] [Google Scholar]
- 45.AntWeb . California Academy of Science; 2023. Version 8.87.https://www.antweb.org [Google Scholar]
- 46.Kohout R.J. A review of the Australian Polyrhachis ants of the subgenera Myrmhopla Forel and Hirtomyrma subgen. Nov. (Hymenoptera: Formicidae: Formicinae) Memoir. Queensl. Mus. 2010;55:167–204. [Google Scholar]
- 47.Schödl S. Taxonomic revision of Oriental Meranoplus F. Smith, 1853 (Insecta: Hymenoptera: Formicidae: Myrmicinae). Annalen des Naturhistorischen Museums in Wien. Serie B für Botanik und Zoologie. 1998;100:361–394. [Google Scholar]
- 48.Wang C., Wu J. Taxonomic studies on the genus Polyrhachis of China (Hymenoptera: Formicidae) (in Chinese) For. Res. 1991;4:596–601. [Google Scholar]
- 49.Wang W.Y., Soh E.J.Y., Yong G.W.J., Wong M.K.L., Guenard B., Economo E.P., Yamane S. Remarkable diversity in a little red dot: a comprehensive checklist of known ant species in Singapore (Hymenoptera: Formicidae) with notes on ecology and taxonomy. Asian Myrmecology. 2022;15:e015006. doi: 10.20362/am.015006. [DOI] [Google Scholar]
- 50.Sayers E.W., Bolton E.E., Brister J.R., Canese K., Chan J., Comeau D.C., Connor R., Funk K., Kelly C., Kim S., et al. Database resources of the National Center for Biotechnology Information. Nucleic Acids Res. 2022;50:D20–D26. doi: 10.1093/nar/gkab1112. [DOI] [PMC free article] [PubMed] [Google Scholar]
- 51.MATLAB Version: 9.8.0 (R2020a) The MathWorks Inc; 2020. The MathWorks Inc.https://www.mathworks.com [Google Scholar]
- 52.Benhamou S. How to reliably estimate the tortuosity of an animal's path: straightness, sinuosity, or fractal dimension? J. Theor. Biol. 2004;229:209–220. doi: 10.1016/j.jtbi.2004.03.016. [DOI] [PubMed] [Google Scholar]
- 53.Savitzky A., Golay M.J.E. Smoothing and differentiation of data by simplified least squares procedures. Anal. Chem. 1964;36:1627–1639. doi: 10.1021/ac60214a047. [DOI] [Google Scholar]
- 54.Pekár S., Petráková L., Bulbert M.W., Whiting M.J., Herberstein M.E. The golden mimicry complex uses a wide spectrum of defence to deter a community of predators. Elife. 2017;6:e22089. doi: 10.7554/eLife.22089. [DOI] [PMC free article] [PubMed] [Google Scholar]
- 55.Vorobyev M., Brandt R., Peitsch D., Laughlin S.B., Menzel R. Colour thresholds and receptor noise: behaviour and physiology compared. Vision Res. 2001;41:639–653. doi: 10.1016/S0042-6989(00)00288-1. [DOI] [PubMed] [Google Scholar]
- 56.Vorobyev M., Osorio D. Receptor noise as a determinant of colour thresholds. Proc. Biol. Sci. 1998;265:351–358. doi: 10.1098/rspb.1998.0302. [DOI] [PMC free article] [PubMed] [Google Scholar]
- 57.Zurek D.B., Cronin T.W., Taylor L.A., Byrne K., Sullivan M.L.G., Morehouse N.I. Spectral filtering enables trichromatic vision in colorful jumping spiders. Curr. Biol. 2015;25:R403–R404. doi: 10.1016/j.cub.2015.03.033. [DOI] [PubMed] [Google Scholar]
- 58.Kemp D.J., Herberstein M.E., Fleishman L.J., Endler J.A., Bennett A.T.D., Dyer A.G., Hart N.S., Marshall J., Whiting M.J. An integrative framework for the appraisal of coloration in nature. Am. Nat. 2015;185:705–724. doi: 10.1086/681021. [DOI] [PubMed] [Google Scholar]
- 59.Siddiqi A., Cronin T.W., Loew E.R., Vorobyev M., Summers K. Interspecific and intraspecific views of color signals in the strawberry poison frog Dendrobates pumilio. J. Exp. Biol. 2004;207:2471–2485. doi: 10.1242/jeb.01047. [DOI] [PubMed] [Google Scholar]
- 60.Sontag C. Spectral sensitivity studies on the visual system of the praying mantis, Tenodera sinensis. J. Gen. Physiol. 1971;57:93–112. doi: 10.1085/jgp.57.1.93. [DOI] [PMC free article] [PubMed] [Google Scholar]
- 61.Schultz T.D., Fincke O.M. Lost in the crowd or hidden in the grass: signal apparency of female polymorphic damselflies in alternative habitats. Anim. Behav. 2013;86:923–931. doi: 10.1016/j.anbehav.2013.08.008. [DOI] [Google Scholar]
- 62.Solomon C. Solomon coder; 2019. Version Beta 19.08.02.https://solomon.andraspeter.com/ [Google Scholar]
- 63.Bates D.W., Zimlichman E., Bolker B.M., Walker S.C. Fitting linear mixed-effects models using lme4. BMJ Qual. Saf. 2015;24:1–3. doi: 10.18637/jss.v067.i01. [DOI] [Google Scholar]
- 64.Kuznetsova A., Brockhoff P.B., Christensen R.H.B. lmerTest package: tests in linear mixed effects models. J. Stat. Softw. 2017;82:1–26. doi: 10.18637/jss.v082.i13. [DOI] [Google Scholar]
- 65.Lenth R.V. Least-squares means: the R package lsmeans. J. Stat. Softw. 2016;69:1–33. doi: 10.18637/jss.v069.i01. [DOI] [Google Scholar]
Associated Data
This section collects any data citations, data availability statements, or supplementary materials included in this article.
Supplementary Materials
Data Availability Statement
The datasets that were compiled and analyzed in this study are publicly available from Mendeley Data (https://doi.org/10.17632/jrvzn7n475.1). The CO1 gene sequences are available from the NCBI Nucleotide (https://www.ncbi.nlm.nih.gov/nuccore) with accession numbers ON834482, ON827526, OQ607473, OQ607472, OQ627925, OQ612558, and OQ607475.