

Abstract

Electric forces acting on molecules in liquids at ambient temperature fluctuate at terahertz (THz) frequencies with a direct impact on their electronic and optical properties. We introduce the transient THz Stark effect to modify the electronic absorption spectra of dye molecules and, thus, elucidate and determine the underlying molecular interactions and dynamics. Picosecond electric fields of megavolts/cm induce a nonequilibrium response of the prototypical Betaine-30 in polar solution that is probed via transient absorption changes. The field-induced broadening of the absorption band follows the THz intensity in time, with a minor impact of solvent dynamics. The ground and excited state dipole energies in the THz field govern this response, allowing for a quantification of electric forces in a structurally frozen molecular environment.
Changes of molecular absorption and emission spectra upon application of an external electric field, the Stark effect, give quantitative insight into molecular dipole moments, electric polarizabilities, and, thus, charge distributions in electronically excited states.1−5 In the condensed phase, stationary Stark spectroscopy of electronic transitions has been performed with the help of static or slowly modulated external fields acting on molecular chromophores dissolved in nonpolar solvents, attached to proteins, or embedded in solid matrices, partly at cryogenic temperatures. Performed in a nonpolar medium, the latter approach avoids field-induced molecular reorientation and limits electric interactions between the chromophore under study and its environment. Throughout, the interaction strength with the external field has been in the perturbative limit with the molecular ensemble close to equilibrium.
Many chemical and biological processes occur in highly polar environments such as water, proteins containing polar amino acids, and membranes composed of phospholipids with charged head groups. Here, interactions with the environment are strong and markedly different from a quasi-static situation. The local electric fields of the polar environment at ambient temperature fluctuate at terahertz (THz) frequencies, corresponding to femto- to picosecond time scales, and have a strong impact on structural and optical properties.6−9 In particular, electronic and/or vibrational excitations undergo a shift in energy due to solvation,10,11 i.e., a rearrangement of the environment, which minimizes primarily the electrostatic energy.
For grasping basic electric interactions in such systems at a molecular level, time-resolved Stark spectroscopy with strong electric fields in the THz frequency range appears highly attractive due to its ability to modulate the molecular properties directly in the relevant time range but has not been implemented so far. The inherent subpicosecond time resolution of such a method should allow for a dynamic separation of processes, like ultrafast polarization changes and slower reorientational dynamics. Here, we introduce time-resolved THz Stark spectroscopy to demonstrate its strong potential by mapping the nonequilibrium response of the prototypical organic dye Betaine-30 (B-30, Reichardt’s dye, ref (12)) and its electric interactions with polar solvents.
In the electronic ground state S0, B-30 (inset of Figure 1d), displays a strong electric dipole moment of 15–20 D along the N–C–O axis, which upon excitation to the S1 state is reduced by more than a factor of 2,13 due to a concomitant charge transfer between the phenolate and N-pyridinium moieties of the molecule. With increasing polarity of the solvent, the steady-state S0–S1 absorption band undergoes a pronounced blue shift over a wavelength range of ∼350 nm (frequency range ≈ 290 THz), from the near-infrared to visible spectral range. This solvatochromism defines the ET(30) polarity scale of liquids, which is widely used in chemistry.12 The strong spectral shifts have been ascribed to changes of dipole solvation energy in the S0 and S1 states with solvent polarity.14,15 A large body of experimental16−18 and theoretical work, the latter ranging from reaction field theory within the Onsager cavity picture1,19 to microscopic simulations of electric and dispersion forces,14,15,20,21 has addressed B-30 solvatochromism, without, however, giving a consistent picture of molecular interactions, dipole moments, and polarizabilities.
Figure 1.
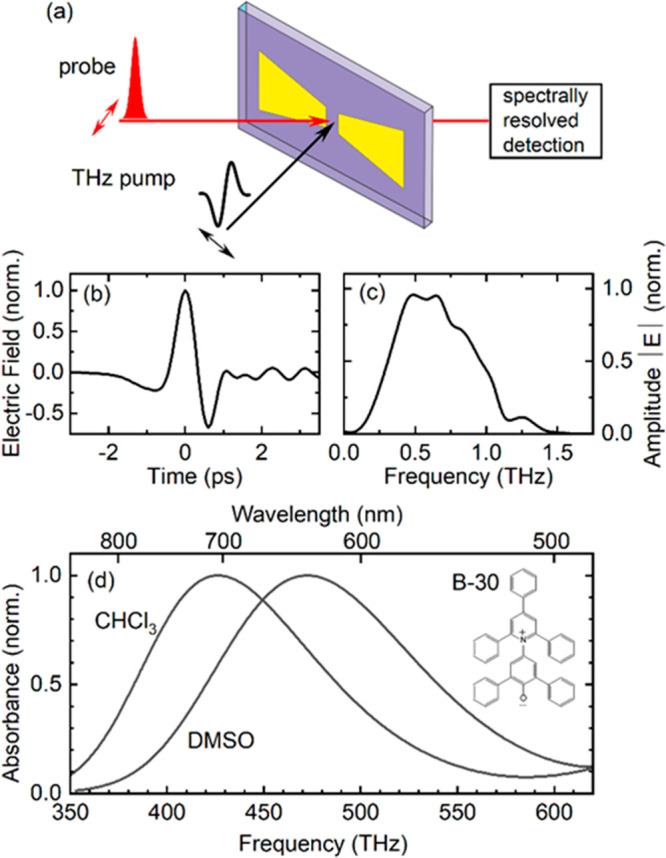
Terahertz Stark effect method. (a) Schematic of the experimental geometry. The electric field of a picosecond THz transient is enhanced by an antenna structure (yellow contour, gap width 12 μm) on the front window of a liquid sample cell (thickness 25 μm). Absorption changes induced by the THz field in the sample solution are probed by a broadband femtosecond pulse. The probe pulse transmitted through the sample is recorded with a spectrally resolving detection system. The THz and the probe pulse have parallel linear polarizations along the horizontal axis of the antenna structure (double arrows). (b) Time-dependent electric field of the THz pulse measured by free-space electrooptic sampling. (c) Amplitude spectrum of the THz pulse shown in panel (b). (d) Electronic S0–S1 absorption band of Betaine-30 (B-30) in chloroform (CHCl3) and dimethylsulfoxide (C2H6SO, DMSO). Inset: Molecular structure of B-30 in the S0 state.
Our experiments are based on the pump–probe scheme illustrated in Figure 1a. A linearly polarized single-cycle THz transient is focused on a metallic antenna structure placed on the inner side of the front window of a liquid-sample cell (thickness 25 μm).22 The enhancement of the THz electric field in the 12-μm wide antenna gap results in a peak external THz field of Eex,max = 1.9 MV/cm averaged over the sample volume behind the gap (see the Supporting Information (SI)). The time-dependent THz field and its spectrum are presented in Figure 1b,c. Changes of the S0–S1 absorption spectrum of B-30 induced by the THz field are mapped in transmission through the antenna gap with a broadband probe pulse of 120 fs duration, much shorter than the THz period of 1.4 ps. Recording the spectrally dispersed transmitted probe pulse allows for measuring transient absorption spectra, while scanning the time delay of the probe pulse over the THz transient and beyond allows for following the time evolution of transient absorption. We study B-30 in chloroform (CHCl3) and dimethylsulfoxide (C2H6SO, DMSO), two aprotic solvents of moderate polarity and markedly different static dielectric constants (CHCl3: εstatic = 4.81; DMSO: εstatic = 46.7). Absorption spectra of B-30 in the two solvents are shown in Figure 1d. In the following, we focus on results for B-30 in DMSO, while data for B-30 in CHCl3 and further experimental details are given in the SI.
Transient absorption spectra of B-30 in DMSO are summarized in Figure 2a. The change of absorbance ΔA = A – A0 = −log(T/T0) is plotted as a function of probe frequency for three different delay times during the THz transient (symbols; T, T0: sample transmission with and without an external THz field). The spectra exhibit an absorption decrease around the maximum of the steady-state absorption spectrum (blue line) and an enhanced absorption on the low- and high-frequency wings. This behavior corresponds to a broadening of the transient spectral envelopes relative to the stationary absorption band. The maximum negative absorption change of B-30 in DMSO arises close to the maximum of the steady-state absorption, i.e., there is no major shift of the band upon application of the THz field. With increasing delay time, the amplitudes of the positive and negative ΔA decrease, whereas the frequency positions of the zero crossings of ΔA are essentially maintained.
Figure 2.

Time-dependent THz Stark effect. (a) Transient absorption spectra of B-30 in DMSO for different delay times between the maximum of the THz pulse at 0 fs and the femtosecond probe pulse (symbols). The absorbance change ΔA = −log(T/T0) in mOD is plotted as a function of probe frequency (T, T0: sample transmission with and without the THz field). The THz field induces a spectral broadening of the stationary absorption band (blue line). (b,c) Time-dependent absorbance changes ΔA measured at fixed probe frequencies νpr (symbols, spectral positions marked by arrows in panel (a)). The solid lines give the normalized THz intensity ITHz (t) ∝ |ETHz(t)|2 derived from the experimental THz field amplitude ETHz(t). (e,f) Absorbance changes ΔA at delay zero as a function of the B-30 concentration in DMSO. The solid lines represent a linear concentration dependence of ΔA.
Time-resolved absorbance changes measured at a fixed probe frequency are presented in Figure 2b,c (symbols). The time evolution closely follows the intensity of the THz transient ITHz(t) ∝ |ETHz(t)|2 (solid lines), which is proportional to the absolute square of the THz field ETHz(t). In line with such results, measurements with different peak amplitudes of the THz transient (Figure S2 in the SI) give a linear dependence of ΔA on ITHz(t). We also find a linear dependence of ΔA on dye concentration (Figure 2d,e). It is important to note that absorption changes are absent at longer delay times after the THz transient. In this picosecond time range occurs the THz-induced Kerr rotation of solvent molecules [cf. SI and refs (23−25)], with, however, a minor impact on the B-30 absorption changes. We conclude that changes of the local electric field originating from a reorientation of solvent molecules play a negligible role under the present experimental conditions. Instead, the absorbance changes are dominated by the electronic interaction of the THz field with the B-30 molecules. A very similar behavior is observed with B-30 in CHCl3 (Figure S3, SI).
The spectrally resolved absorption changes ΔA cover the full range of the stationary S0–S1 absorption band A0 of B-30 in DMSO. From the ΔA spectra taken at delay zero (maximum of the THz field), we derived the quantity ΔA(ν)/ν (ν: frequency), which is plotted for B-30 in DMSO in Figure S5a, SI. The integral of ΔA(ν)/ν over the frequency range of the absorption band is related to the electronic transition moments μ01* and μ01 with and without the THz field:
| 1 |
For B-30 in both DMSO and chloroform, this integral is less than 10–3 of the integral of A0(ν)/ν over ν, demonstrating that the electronic S0–S1 transition dipole moment is not altered in the presence of the THz field.
We now consider the electric fields acting on the B-30 dipoles in solution. In the elementary Onsager cavity picture,19 the solvatochromism of B-30 has been assigned to the reaction field the chromophore induces in the solvent. This continuum approach gives a reaction field of 15.9 MV/cm for B-30 in DMSO, using a cavity radius of 6.6 Å.14 The microscopic molecular dynamics (MD) simulations presented below give an average solvent field of some 10 MV/cm acting on a B-30 dipole. Superimposed on the solvent field is the linearly polarized local THz field Eloc(t). In a Clausius–Mossotti approach, the local field amplitude is given by Eloc(t) = (εTHz + 2)/3·Eex(t), with the THz dielectric constant εTHz of the solvent. For Eex,max = 1.9 MV/cm, one estimates a peak value of Eloc = 3.6 MV/cm. This peak local field corresponds to a sizable fraction of 23% of the reaction field.
There are mainly two mechanisms by which the THz field induces changes of the S0–S1 absorption line shape, (i) the energetic changes of the B-30 permanent dipoles μS0 (S0 state) and μS1 (S1 state) in the THz field Eloc(t) and (ii) a change of μS0 and μS1 via the electronic polarizabilities in the S0 and S1 states. The spectral shift of the optical S0–S1 transition of an individual B-30 molecule in the THz field is then given by
| 2 |
with Δμ = μS1 – μS0 and Δα = αS1 – αS0, αS1 and αS0 being the electronic polarizability tensors of B-30 in the S1 and S0 states.3 The first term induces a spectral red- or blue-shift of the S0–S1 transition, depending on the sign of −Δμ·Eloc (Figure 3a). The second term is quadratic in Eloc and, thus, causes a spectral shift determined by the sign of Δα. In B-30, the difference of the (permanent) dipole moments is expected to have a value of |μS1| − |μS0| ≈ −7 to −9 D.13,21 Theory consistently predicts a value of the ground state αS0 between 60 and 100 Å3. In the older theoretical literature, the values of Δα vary over a very broad range, while more recent theoretical work suggests a Δα ≈ −18 Å3.21
Figure 3.
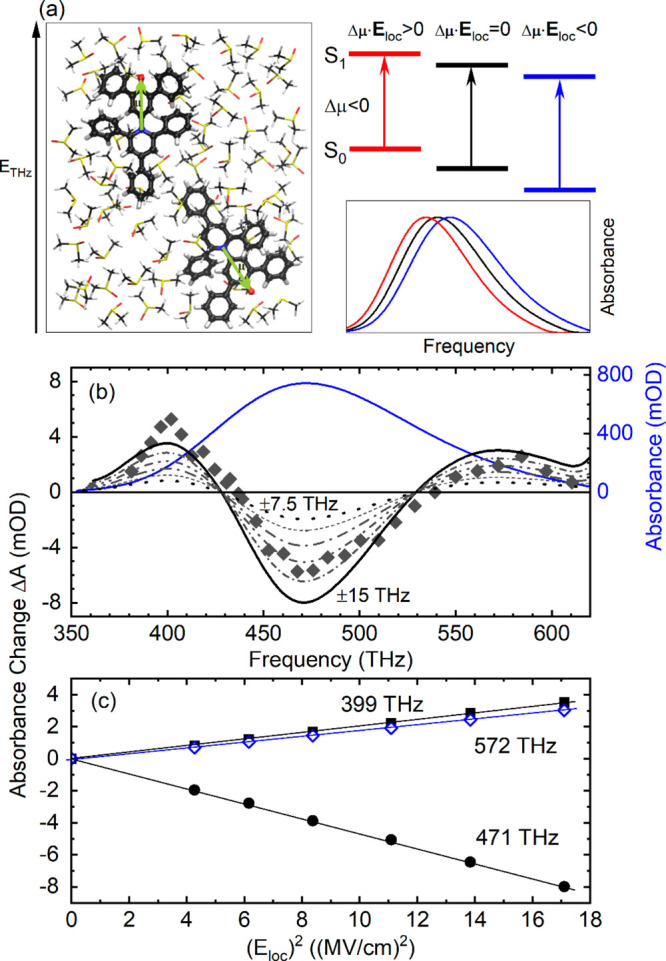
Simulation for B-30 in DMSO. (a) Left: B-30 molecules in DMSO with a different orientation of their permanent dipole μ (green arrows) relative to the external THz field ETHz. Right: Schematic of spectral shifts induced by the external electric field Eloc (cf. eq 2). (b) Spectrally resolved absorbance change at zero delay (symbols) and simulated absorption changes (lines) for maximum frequency shifts between ±7.5 and ±15 THz in steps of 1.5 THz. Blue line: Steady-state absorption spectrum. (c) Absorbance change at frequencies of 399, 471, and 572 THz (symbols) calculated as a function of the local peak electric field Eloc squared. The absorbance changes follow a quadratic dependence on Eloc (lines).
The B-30 molecules in solution are randomly oriented, and thus, the projection of Eloc(t) on the direction of Δμ determines the spectral shift for the individual B-30 molecule. On the 1–2 ps time scale of the THz transient (Figure 1b), the B-30 molecules preserve their spatial orientation. Thus, the transient S0–S1 absorption spectra of the B-30 ensemble represent the spatial average over all original B-30 orientations. The first term in eq 2 then leads to a field-induced broadening of the S0–S1 absorption band to higher and lower frequencies (Figure 3a), as observed in experiment. The second term induces a net spectral shift of the band center, which is absent in the transient spectra. This fact suggests minor changes of polarizability upon electronic excitation, in line with the small value of Δα from theory.21 We, thus, neglect this term in the following.
For a peak value Eloc = 3.6 MV/cm and a dipole difference |Δμ| = 10 D, the frequency shifts due to the first term of eq 2 can reach a value of Δνmax = ±18 THz, which represents a substantial fraction of the total 100 THz width of the undisturbed S0–S1 absorption band. As a consequence, the established perturbative approach for analyzing a field-induced broadening1−3,13 cannot be applied here (see the SI). Instead, we use a numerical simulation, in which the transient absorption spectrum is generated as a sum of S0–S1 absorption bands, symmetrically shifted in frequency position by up to ±Δνmax. This modeling inherently assumes that THz-induced changes of the absorption line shape are minor. Details of the simulations are given in the SI, and results are summarized in Figure 3b,c. The black lines in Figure 3b represent the absorbance change ΔA calculated for maximum frequency shifts Δνmax between ±7.5 and ±15 THz. With increasing Δνmax, the amplitudes of the positive and negative absorbance changes increase, while the positions of the zero crossings are preserved.
The symbols in Figure 3b represent the experimental ΔA measured at delay zero, the maximum THz field. The absolute values and the zero crossings of the simulated ΔA in Figure 3b reproduce experiment in a reasonable way. A comparison of the experimental and calculated ΔA in Figure 3b suggests a maximum field-induced broadening Δνmax ≈ ±13 THz for Eloc = 3.6 MV/cm, corresponding to a dipole difference |Δμ| ≈ 7.2 D between the S1 and S0 states. This value is in fair agreement with part of the literature and rules out the much larger dipole differences suggested by some theoretical work. We note that the spectral envelope of ΔA is not fully reproduced by the model, a fact pointing to a limited modification of the absorption line shape in the THz field. This issue needs further investigation, which is beyond the scope of the present paper. Figure 3c displays absorbance changes at a fixed frequency as a function of (Eloc)2, calculated with |Δμ| ≈ 7.2 D. In agreement with experiment, one finds a quadratic dependence of ΔA on Eloc, i.e., a linear dependence on the THz intensity ITHz.
Our work extends Stark spectroscopy to the new regime of field–matter interaction at ultrafast time scales where the local electric field of 3.6 MV/cm at the peak of the THz pulse induces a total broadening of some 25 THz. The fact that the local THz fields are of similar strength as the field exerted by the solvent allows for a direct benchmarking of solute–solvent interactions. For polar solvents such as DMSO, our results thus suggest a strong predominance of Coulomb interactions over other types of solute–solvent couplings and identify the differences in S0 and S1 dipole energies in the electric field as the key quantity determining the spectral position of electronic transitions. This coupling mechanism is also expected to dominate spectral diffusion in the fluctuating electric field from a polar solvent and, thus, affecting the spectral width and line shape directly.
To test this hypothesis, we have analyzed the fluctuating electric field obtained from MD simulations (Figure 4; see the SI for simulation details), employing microscopic information on B-30 in DMSO solvent beyond a cavity picture. We found that the average electric field amplitude at the position of the B-30 nitrogen atom has a magnitude of 9.72 MV/cm (projected along the axis of B-30 nitrogen and oxygen atoms, cf. Figure 4a). The fluctuation amplitude has a value of ±10.6 MV/cm (standard deviation). The frequency range of spectral diffusion induced by such fluctuations is proportional to Δμ (cf. eq 2). For assessing the impact of this mechanism on the absorption line shape, we simulated the S0–S1 band of B-30 in DMSO for varying absolute values of the S0–S1 dipole moment difference Δμ (Figure 4c). A comparison with the experimental spectrum (solid black line) illustrates that a large fraction of the experimentally observed spectral width can be ascribed to solvent field fluctuations. The model assumes a field-free S0–S1 excitation energy of 430 THz of B-30, in excellent agreement with highest level ab initio multiconfiguration–second order perturbation theory simulations (406–464 THz; see the SI) and suggests a reduction of the dipole moment in the range Δμ = −(7.3–10.3) D. Given the simplicity of the model, which neglects any vibronic structure of the absorption spectrum, the close agreement in the simulated and experimentally derived change of dipole moment is encouraging and clearly beyond the accuracy of predictions from reported ab initio simulations.21 Vice versa, the boundary conditions imposed on the magnitude of electric interactions by the experiment render the electric field obtained from MD simulations accurate within 10–20%.
Figure 4.
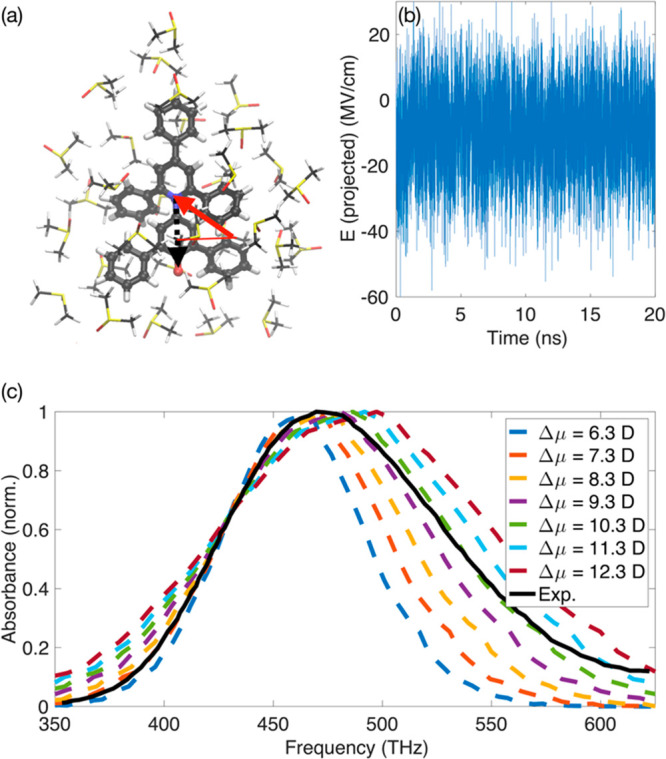
Electric field-induced spectral diffusion of B-30 in DMSO. (a) Structure of the B-30 molecule with the S0 dipole moment along the axis of nitrogen and oxygen atoms (indicated by the black dashed arrow). B-30 is shown together with the first solvation shell of DMSO molecules. Solvent molecules induce an electrical force on B-30 that is recorded at the position of the nitrogen atom and projected on the direction of the S0 dipole moment (as indicated by the red arrow). (b) Fluctuating electric field obtained from a 20 ns atomistic MD simulation. The average magnitude of the projected electric field at the position of the nitrogen atom is 9.72 MV/cm with large-amplitude field excursions (±10.6 MV/cm standard deviation) on a subpicosecond time scale. (c) Simulated and experimental optical absorption spectrum of B-30 in DMSO with spectral diffusion induced by large-amplitude electric field excursions for varying absolute values of Δμ, the difference of S1 and S0 dipole moments (eq 2). Simulations assume a field-free S0–S1 transition frequency of 430 THz.
We note that the field-induced spectral diffusion modeling of the optical absorption spectrum neglects the electric polarization of solvent molecules in the dipole field of the B-30 dye. Using the reaction field 15.9 MV/cm from the Onsager cavity picture and employing the polarizability of isolated DMSO molecules (8 Å3), we estimate a moderate ∼10.6% mean field change of dipole moments of DMSO solvent molecules. The increased field amplitudes arising from polarized DMSO molecules have a moderate impact on the simulated spectral width of the optical absorption spectrum (Figure S7, SI). Additional contributions to the line shape, such as broadening from the solvent correlation decay17,26 and fluctuations of the B-30 nuclear degrees of freedom,20 have a minor influence as well. To what extent the vibronic structure of the spectra is relevant and affected by such interaction defines a topic of future research.
The picosecond THz transients interact with the molecular ensemble under ambient conditions and in a time range where slower field-induced reorientation processes of the molecules play a negligible role. While orientational solvent motions are instrumental for large-amplitude electric field fluctuations underlying spectral diffusion, the electronic component of the dielectric function is relevant for the local THz field acting on B-30. The alignment of solvent molecules in the external THz field, the rotational Kerr effect, is partly suppressed in the solvation shell of a B-30 molecule due to steric hindrance by the solute and a restoring torque from the strong field of the B-30 dipole μS0 (cf. the SI). Thus, solvent reorientation has a minor impact on the electronic absorption changes. In contrast to previous quasi-stationary Stark spectroscopy in matrices and/or frozen environments, our work paves the way for studying the electric response and interactions under ambient “real-world” conditions in a broad range of polar molecular environments.
Acknowledgments
The authors thank Michael Woerner and Klaus Reimann, Max Born Institut, for valuable discussions. This research has received funding from the European Research Council (ERC) under the European Union’s Horizon 2020 Research and Innovation program (grant agreements No. 833365 and No. 802817).
Supporting Information Available
The Supporting Information is available free of charge at https://pubs.acs.org/doi/10.1021/acs.jpclett.3c01079.
Materials and methods, experimental results, analysis of experimental results, theoretical methods and results; Figures S1–S7 showing interaction geometries, time-resolved absorbance, peak absorbance changes, Stark effect of B-30 in CHCl3, solvent Kerr effect, and optical absorbance spectra; Table S1 showing results of ab initio simulations (PDF)
Author Contributions
§ P.S. and J.Z. contributed equally to this work.
The authors declare no competing financial interest.
Supplementary Material
References
- Liptay W. Electrochromism and Solvatochromism. Angew. Chem., Int. Ed. 1969, 8, 177–188. 10.1002/anie.196901771. [DOI] [Google Scholar]
- Ponder M.; Mathies R. Excited-State Polarizabilities and Dipole Moments of Diphenylpolyenes and Retinal. J. Phys. Chem. 1983, 87, 5090–5098. 10.1021/j150643a010. [DOI] [Google Scholar]
- Bublitz G. U.; Boxer S. G. Stark Spectroscopy: Applications in Chemistry, Biology, and Materials Science. Annu. Rev. Phys. Chem. 1997, 48, 213–242. 10.1146/annurev.physchem.48.1.213. [DOI] [PubMed] [Google Scholar]
- Cohen B. E.; McAnaney T. B.; Park E. S.; Jan Y. N.; Boxer S. G.; Jan L. Y. Probing Protein Electrostatics with a Synthetic Fluorescent Amino Acid. Science 2002, 296, 1700–1703. 10.1126/science.1069346. [DOI] [PubMed] [Google Scholar]
- Boxer S. G. Stark Realities. J. Phys. Chem. B 2009, 113, 2972–2983. 10.1021/jp8067393. [DOI] [PubMed] [Google Scholar]
- de Boeij W.; Pshenichnikov M. S.; Wiersma D. A. Ultrafast Solvation Dynamics Explored by Femtosecond Photon Echo Spectroscopies. Annu. Rev. Phys. Chem. 1998, 49, 99–123. 10.1146/annurev.physchem.49.1.99. [DOI] [PubMed] [Google Scholar]
- Bakker H. J.; Skinner J. T. Vibrational Spectroscopy as a Probe of Structure and Dynamics in Liquid Water. Chem. Rev. 2010, 110, 1498–1517. 10.1021/cr9001879. [DOI] [PubMed] [Google Scholar]
- Laage D.; Elsaesser T.; Hynes J. T. Water Dynamics in the Hydration Shells of Biomolecules. Chem. Rev. 2017, 117, 10694–10725. 10.1021/acs.chemrev.6b00765. [DOI] [PMC free article] [PubMed] [Google Scholar]
- Dahms F.; Fingerhut B. P.; Nibbering E. T. J.; Pines E.; Elsaesser T. Large-Amplitude Transfer Motions of Hydrated Excess Protons Mapped by 2D IR Spectroscopy. Science 2017, 357, 491–495. 10.1126/science.aan5144. [DOI] [PubMed] [Google Scholar]
- Fleming G. R.; Cho M. H. Chromophore – Solvent Dynamics. Annu. Rev. Phys. Chem. 1996, 47, 109–134. 10.1146/annurev.physchem.47.1.109. [DOI] [Google Scholar]
- Barbara P. F.; Walker G. C.; Smith T. P. Vibrational Modes and the Dynamic Solvent Effect in Electron and Proton Transfer. Science 1992, 256, 975–981. 10.1126/science.256.5059.975. [DOI] [PubMed] [Google Scholar]
- Machado V. G.; Stock R. I.; Reichardt C. Pyridinium N-Phenolate Betaine Dyes. Chem. Rev. 2014, 114, 10429–10475. 10.1021/cr5001157. [DOI] [PubMed] [Google Scholar]
- Liptay W.; Schlosser H. J.; Dumbacher B.; Hünig S. Die Beeinflussung der optischen Absorption von Molekülen durch ein elektrisches Feld. Z. Naturforsch. A 1968, 23, 1613–1625. 10.1515/zna-1968-1025. [DOI] [Google Scholar]
- Mente S. R.; Maroncelli M. Computer Simulations of the Solvatochromism of Betaine-30. J. Phys. Chem. B 1999, 103, 7704–7719. 10.1021/jp991549r. [DOI] [Google Scholar]
- Renge I. Nonlinear Polarization of Solvatochromic Betaine 30. J. Phys. Chem. A 2010, 114, 6250–6254. 10.1021/jp101953r. [DOI] [PubMed] [Google Scholar]
- Hogiu S.; Dreyer J.; Pfeiffer M.; Brzezinka K. W.; Werncke W. Vibrational Analysis and Excited-State Geometric Changes of Betaine-30 Derived from Raman and Infrared Spectra Combined with Ab-Initio Calculations. J. Raman Spectrosc. 2000, 31, 797–803. . [DOI] [Google Scholar]
- Kovalenko S. A.; Eilers-König N.; Senyushkina T. A.; Ernsting N. P. Charge Transfer and Solvation of Betaine-30 in Polar Solvents – A Femtosecond Broadband Transient Absorption Study. J. Phys. Chem. A 2001, 105, 4834–4843. 10.1021/jp004007e. [DOI] [Google Scholar]
- Plenert A. C.; Mendez-Vega E.; Sander W. Micro- vs Macrosolvation in Reichardt’s Dyes. J. Am. Chem. Soc. 2021, 143, 13156–13166. 10.1021/jacs.1c04680. [DOI] [PubMed] [Google Scholar]
- Onsager L. Electric Moments of Molecules in Liquids. J. Am. Chem. Soc. 1936, 58, 1486–1493. 10.1021/ja01299a050. [DOI] [Google Scholar]
- Lobaugh J.; Rossky P. J. Solvent and Intramolecular Effects on the Absorption Spectrum of Betaine-30. J. Phys. Chem. A 2000, 104, 899–907. 10.1021/jp993444u. [DOI] [Google Scholar]
- Budzak S.; Jaunet-Lahary T.; Laurent A. D.; Laurence C.; Medved M.; Jacquemin D. Exploring the Solvatochromism of Betaine-30 with Ab-Initio Tools: From Accurate Gas-Phase Calculations to Implicit and Explicit Solvation Models. Chem.—Eur. J. 2017, 23, 4108–4119. 10.1002/chem.201604619. [DOI] [PubMed] [Google Scholar]
- Runge M.; Engel D.; Schneider M.; Reimann K.; Woerner M.; Elsaesser T. Spatial Distribution of Electric-Field Enhancement Across the Gap of Terahertz Bow-Tie Antennas. Opt. Express 2020, 28, 24389–24398. 10.1364/OE.399462. [DOI] [PubMed] [Google Scholar]
- Hoffmann M. C.; Brandt N. C.; Hwang H. Y.; Yeh K.-L.; Nelson K. A. Terahertz Kerr Effect. Appl. Phys. Lett. 2009, 95, 231105. 10.1063/1.3271520. [DOI] [Google Scholar]
- Sajadi M.; Wolf M.; Kampfrath T. Transient Birefringence of Liquids Induced by Terahertz Electric-Field Torque on Permanent Molecular Dipoles. Nature Commun. 2017, 8, 14963. 10.1038/ncomms14963. [DOI] [PMC free article] [PubMed] [Google Scholar]
- Zalden P.; Song L.; Wu X.; Huang H.; Ahr F.; Mücke O. D.; Reichert J.; Thorwart M.; Mishra P. K.; Welsch R.; Santra R.; Kärtner F. X.; Bressler C. Molecular Polarizability Anisotropy of Liquid Water Revealed by Terahertz-Induced Transient Orientation. Nature Commun. 2018, 9, 2142. 10.1038/s41467-018-04481-5. [DOI] [PMC free article] [PubMed] [Google Scholar]
- Zong Y.; McHale J. L. Resonance Raman Study of Solvent Dynamics in Electron Transfer. I. Betaine-30 in CH3CN and CD3CN. J. Chem. Phys. 1997, 106, 4963–4972. 10.1063/1.473544. [DOI] [Google Scholar]
Associated Data
This section collects any data citations, data availability statements, or supplementary materials included in this article.