

SUMMARY
Mammalian blastocysts comprise three distinct cell lineages essential for development beyond implantation: the pluripotent epiblast, which generates the future embryo, and surrounding it the extra-embryonic primitive endoderm and the trophectoderm tissues. Embryonic stem cells can reintegrate into embryogenesis but contribute primarily to epiblast lineages. Here, we show that mouse embryonic stem cells cultured under extended pluripotent conditions (EPSCs) can be partnered with trophoblast stem cells to self-organize into blastocyst-like structures with all three embryonic and extra-embryonic lineages. Morphogenetic and transcriptome profiling analyses reveal that these blastocyst-like structures show distinct embryonic-abembryonic axes and primitive endoderm differentiation and can initiate the transition from the pre- to post-implantation egg cylinder morphology in vitro.
In Brief
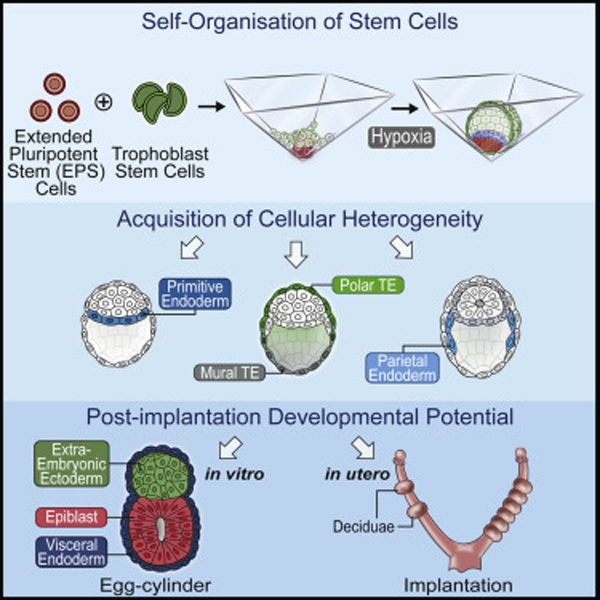
Sozen et al. demonstrate the generation of mammalian blastocyst-like structures from mouse EPSCs and TSCs that contain three spatially segregated lineages representative of the epiblast, trophectoderm, and primitive endoderm. These lineages can generate their descendants as development progresses and form egg cylinder morphology in vitro by effective endoderm programming.
Graphical Abstract
INTRODUCTION
Mammalian development begins in the fertilized egg with potential to form all embryonic and extra-embryonic lineages. As development progresses, embryo cells lose potency to diversify into specialized cell types. In the mouse embryo, the earliest cell fate decisions are completed by the time of blastocyst formation, just before implantation.
The blastocyst is defined by the cavity that emerges three and half days after fertilization (E3.5) and initially comprises two cell populations: the outer extra-embryonic trophectoderm (TE) and the pluripotent inner cell mass (ICM), positioned to one side of the cavity. The ICM gives rise to the epiblast (EPI), the source of fetal cell lineages, and the extra-embryonic primitive endoderm (PE) (Rossant and Tam, 2009). Following implantation, the blastocyst morphologically transforms into the so-called egg cylinder. This remodelling first requires specification of parietal endoderm (PaE), PE-derived cells that migrate from the PE epithelium along the mural TE encompassing the blastocyst cavity by E4.75 (Carnegie and Cabaca, 1991; Hagan, 1982; Salamat et al., 1995). The initially amorphous EPI then transforms into a polarized cup-shaped epithelium and the polar TE, adjacent to the EPI, develops into flanking extra-embryonic ectoderm (ExE) (Bedzhov and Zernicka-Goetz, 2014). By E5.5, both tissues become covered by visceral endoderm (VE), a second PE-derived tissue.
Cultures of mouse embryonic stem cells (ESCs) and extra-embryonic trophoblast stem cells (TSCs) have been derived from the pre-implantation blastocyst and are transcriptionally equivalent to the EPI and TE lineages of the pre-implantation embryo (Evans and Kaufman, 1981; Tanaka et al., 1998). Extra-embryonic endoderm (XEN) stem cells, also derived from blastocysts, show exclusive contribution to endoderm lineages in chimeric embryos (Kunath et al., 2005). Although ESCs are derived from ICM, they lose ability to contribute to extra-embryonic tissues under conventional conditions (Ying et al., 2008). However, recently protocols were established to generate pluripotent stem cells with both embryonic and extra-embryonic potential (Gao et al., 2019; Yang et al., 2017a, 2017b). The bi-potency of such extended pluripotent stem cells (EPSCs) was indicated by their contribution to both embryonic and extra-embryonic parts of chimeric conceptuses (Yang et al., 2017a, 2017b).
Recent studies have shown that stem cells can self-assemble in vitro to generate embryo-like structures, offering new opportunities for understanding embryogenesis (Beccari et al., 2018; Harrison et al., 2017; Rivron et al., 2018; Sozen et al., 2018; Zheng et al., 2019; Warmflash et al., 2014). We previously showed that mouse ESCs and TSCs can organize into bicompartmental embryo-like structures (ET-embryos) that resemble egg cylinders and recapitulate spatiotemporal patterns of mesodermal and primordial germ-cell gene expression (Harrison et al., 2017). The additional incorporation of XEN cells generates ETX-embryos that undertake further anterior specification and early gastrulation (Sozen et al., 2018). However, these structures recapitulate early post-implantation development, circumventing the unique pre-implantation blastocyst stage.
Recent studies described generation of blastocyst-like structures (termed blastoids or blastocyst-like cysts; iBCs) from stem cells (Kime et al., 2019; Rivron et al., 2018). It is reported that these structures developed EPI-like and TE-like lineages with a small proportion specifying PE-like cells, but their subsequent development was arrested (Kime et al., 2019; Rivron et al., 2018). Here, we tested the hypothesis that full specification of the PE-lineage is required to overcome this limited development by devising an approach to establish all three blastocyst lineages in blastocyst-like structures, and, testing their subsequent potential.
RESULTS
Self-Assembly of Mouse EPSCs and TSCs Recapitulates Blastocyst-like Morphology
The ability to generate embryo-like structures from cultured stem cells brings new potential for understanding mammalian development. We hypothesized that utilizing extended potential (EP) culture conditions to promote formation of both embryonic and extra-embryonic lineages (Yang et al., 2017b) could improve developmental potential of blastoids. With this aim, we combined mouse EPSCs and TSCs in a multi-inverted-pyramid microwell-based system using sequential changes of differing media. We optimized the first culture medium (LCDM; STAR Methods) to capture the bi-potency of EPSCs for embryonic and extra-embryonic lineages (Figures 1A and S1A; STAR Methods). Upon formation of compacted amorphous EPSC aggregates, we added TSCs to microwells and changed the medium to one previously described (Kubaczka et al., 2014; Rivron et al., 2018). As natural blastocyst development occurs under low oxygen tension, we switched from normoxic (20% O2) to hypoxic (5% O2) culture conditions upon addition of TSCs (Figures 1A and S1A; STAR Methods). This increased cystic structure formation from 2.5% to 15.17% (Figures S1A–S1C, n = 400). After 72–96 h of hypoxic culture, a cohesive TSC epithelium surrounded an enlarged cavity and an internal acentric EPSC compartment (Figures 1A, 1B, and S1A–S1C). Under these EP conditions, 61.2% (n = 142/233) of EPSC-derived structures developed a PE-like epithelium flanking the cavity (Figures 1C and S1D). By comparison, only 15.9% (n = 19/123) of conventional ESC-derived blastoids specified PE-like cells (Figure 1D). Under these conditions, we were unable to detect any contribution of EPSCs toward the TE lineage in such EPSC-derived blastocysts (Figures S1E and S1F) and could not observe synthetic blastocyst formation when EPSCs were cultured in the absence of TSCs (Figure S1G). The morphology, size, cell numbers, and lineage ratios in EPSC-derived blastocysts indicated a range of mid- to late blastocyst stages (Figures 1E–1G) having an average of 10.35 PE-like cells per structure (Figure S1H). We term these structures extended potential blastoids (EPS-blastoids).
Figure 1. Self-Assembly of Mouse EPSCs and TSCs into Blastocyst-like Structures (EPS-Blastoids).
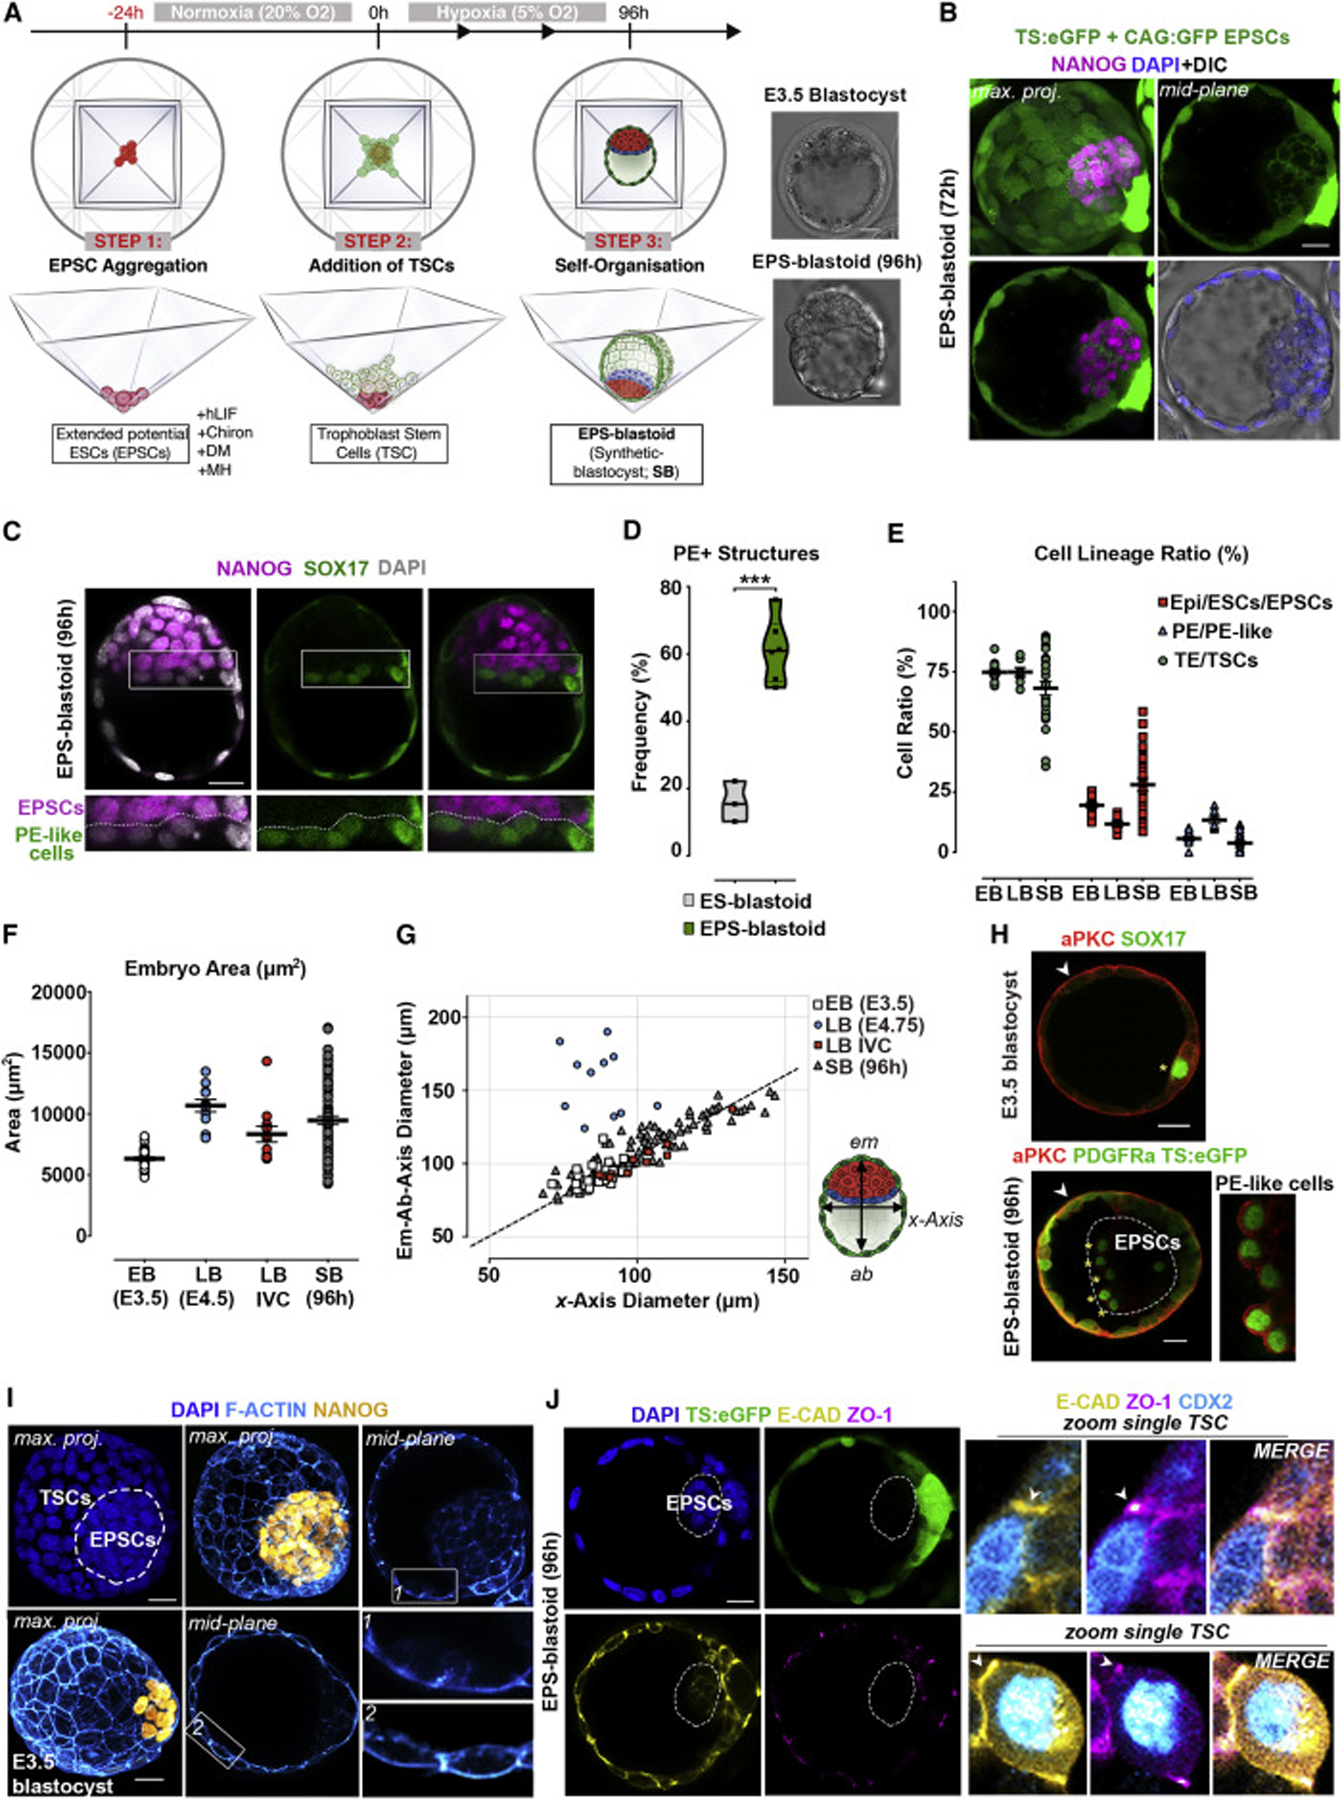
(A) Protocol for generating EPS-blastoids.
(B) EPS-blastoid built from TSCs (ubiquitous eGFP) and EPSCs (membrane CAG-GFP) at 72 h (n = 10).
(C) EPS-blastoid using wild-type TSCs and EPSCs after 96 h of co-culture. Non-nuclear anti-Sox17 fluorescence represents non-specific antibody binding (n = 20).
(D) Frequency of ESC- or EPSC-derived blastoids (see STAR Methods) containing PE-like cells. 233 EPS-blastoids (n = 6) and 123 ES-blastoids (n = 3) were scored based on PDGFRa, alongside other PE markers including Sox17, Gata6, Gata4, and Foxa2. Two-sided Student’s t test, p = 0.0002.
(E) Quantification of cell ratios between EPSC or Epi, TSC or TE, and PE-like or PE lineages in EB (n = 13), LB (n = 7), and SB (n = 27). See Figure S1H.
(F) Quantification of embryonic area in EB (n = 30), LB (n = 11), LB IVC (n = 12), and SB (96 h; n = 93).
(G) Measurements of axial diameters in EB (n = 30), LB (n = 11), LB IVC (n = 12), and SB (n = 93). Illustration on right shows the 2 axes measured.
(H) E3.5 blastocyst (n = 10; upper panel) and EPS-blastoid built from EPSCs (nuclear PDGFRa-H2B-GFP; dashed lines) and TSCs (ubiquitous eGFP) at 96 h (n= 20; lower panel). Two experiments. Asterisk, PE-like cells with aPKC expression (zoomed image).
(I) Apicolateral assembly of F-actin flaments (Cyan) in EPS-blastoid (upper panel) and E3.5 blastocyst (lower panel).
(J) Junction assembly in TSC-derived TE layer of EPS-blastoid. n = 20, 5 experiments. Right panels, zoomed images of a single TSC from TE-like epithelium. EB, early blastocyst (E3.5); LB, late blastocyst (E4.75); LB IVC, late blastocyst developed in vitro from 2-cell stage for 72 h; SB, synthetic blastocyst (96 h).
Scale bars represent 20 μm; Error bars represent SEM in all panels.
The TE and PE cells lining natural mammalian blastocyst cavities exhibit apicobasal polarity that is key for TE fate determination and for PE cells to sort into an epithelial layer (Eckert et al., 2004; Saiz et al., 2013). Such polarity was evident from the apical positioning of atypical protein kinase C (aPKC) in both the TSC-layer and PE-like cells of EPS-blastoids (Figure 1H). Moreover, the distribution of actin and adherens junctions necessary to establish a barrier and accumulate fluid in the blastocoel (Sheth et al., 1997) was established correctly in EPS-blastoids (Figures 1I and 1J). Thus, we concluded that TSCs and EPSCs in the EPS-blastoids self-organize to resemble natural blastocysts.
EPSCs Generate Both Embryonic Epi- and Extra-Embryonic PE-like Lineages
As specification of PE would be critical for subsequent blastoid development, we examined formation of apico-basally polarized epithelium, an important feature of PE maturation. We found that the PE-like cells in EPS-blastoids not only expressed apical aPKC (Figure 1H), but also produced Podocalyxin (Figure 2A), an anti-adhesive sialomucin later secreted into the apical lumen (Bedzhov and Zernicka-Goetz, 2014; Meder et al., 2005). Moreover, the PE-like cells also secreted the basement membrane protein, Laminin (Laurie et al., 1982) at their basal domains (Figure 2B). These results indicate that maturation of PE-like cells resembles the formation of bona-fide PE epithelium.
Figure 2. Bi-potent EPSCs Support the Generation of an ICM-like Compartment with Extended Developmental Potency.
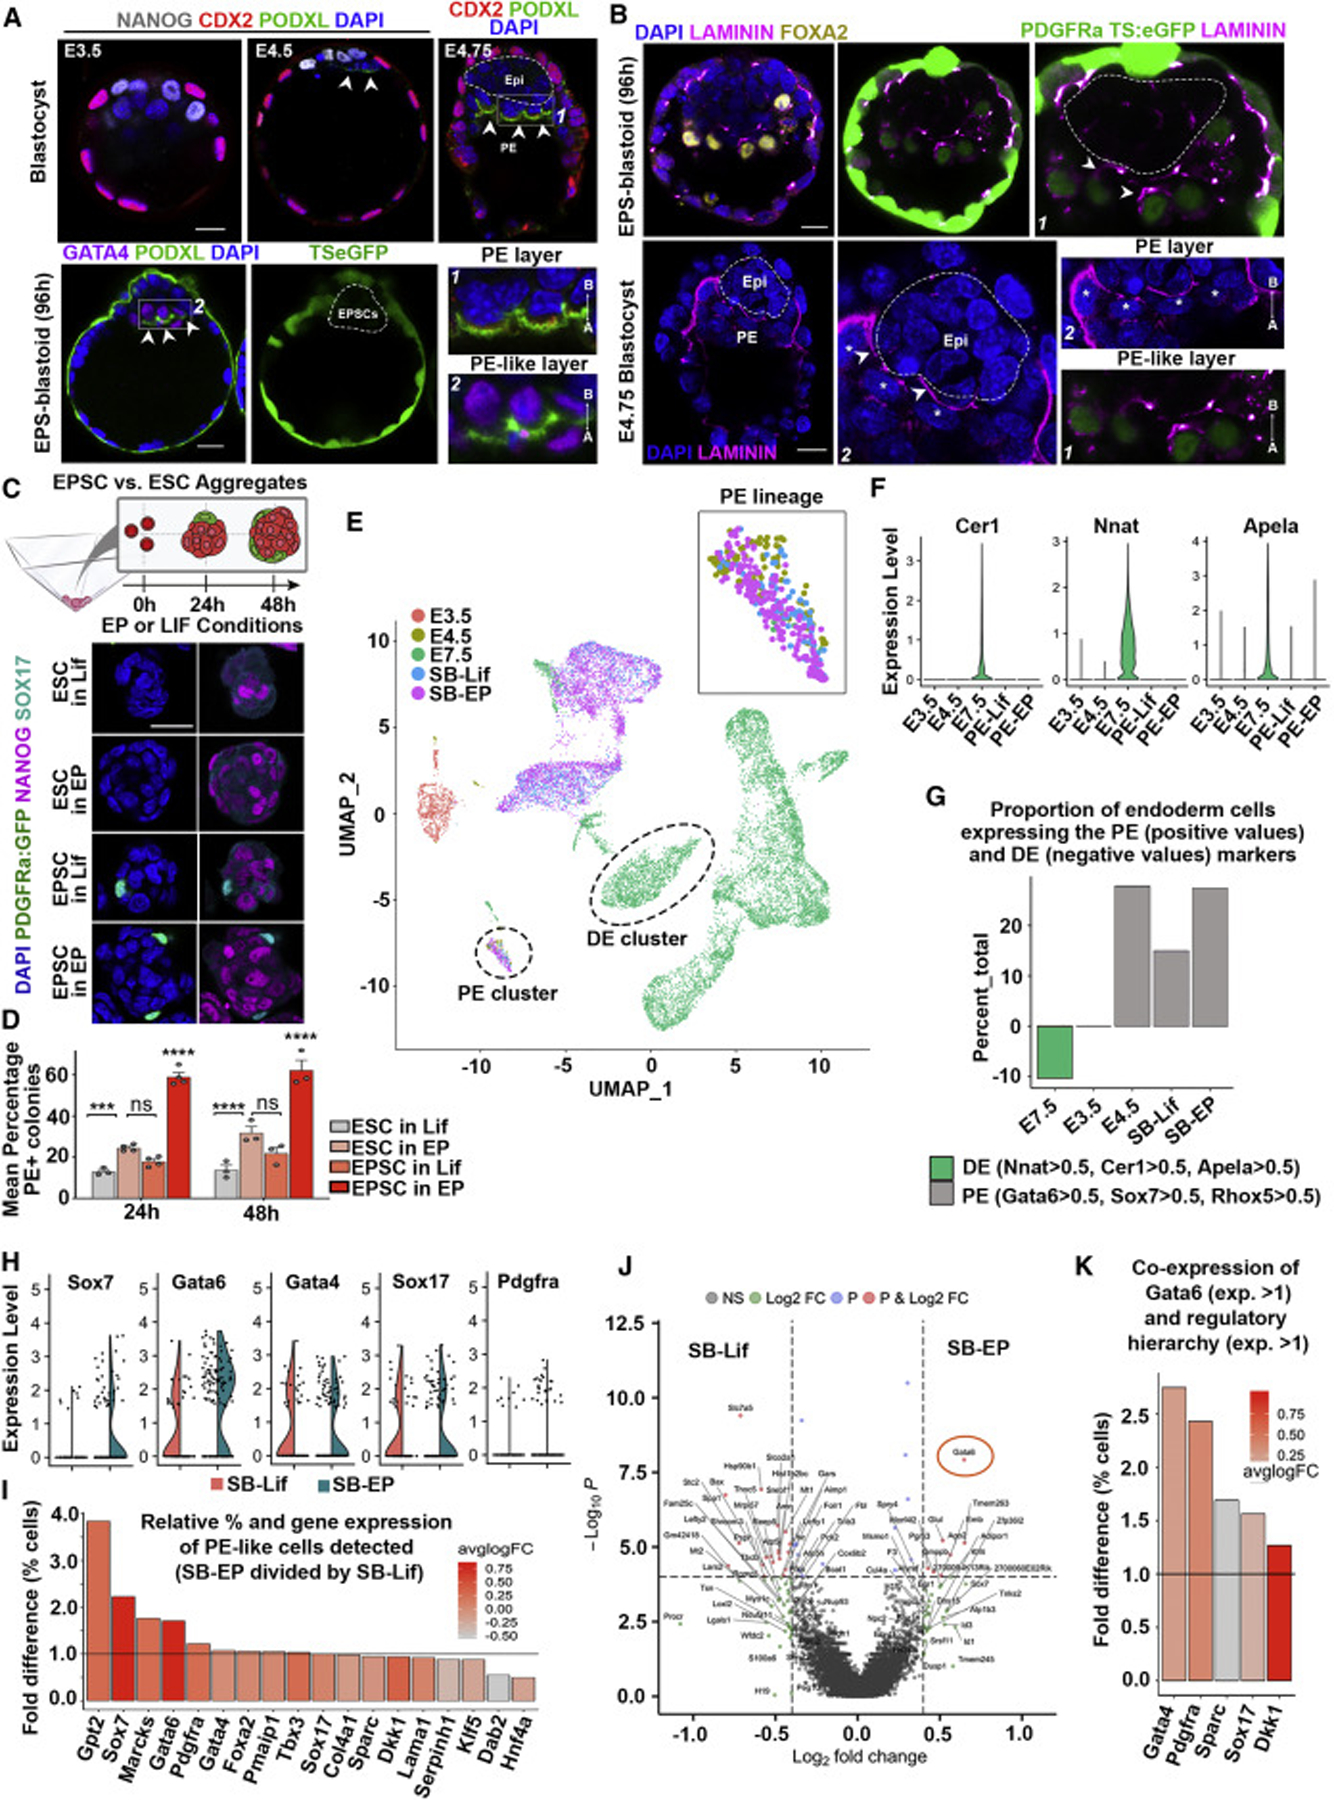
(A) Localization of podocalyxin (Podxl; green) in natural blastocysts (n = 3 per group) and EPS-blastoids (n = 15), 2 experiments. Scale bars represent 20 μm.
(B) Laminin (magenta; arrowheads) in late-stage PE-like or PE basal membranes. Magnified fields (bottom-right) display the PE (asterisks) and PE-like layers from images 1 and 2. n = 3 natural blastocysts, 10 EPS-blastoids, 3 experiments. Scale bars represent 20 μm.
(C) Top, schematic for generating ESC or EPSC aggregates. Bottom, Aggregates co-expressing endogenous nuclear PDGFRa-H2B-GFP (green) and Sox17 (cyan) after immunostaining were scored as positive colonies. Nanog (magenta) indicates naive pluripotent cells. n = 100 aggregates per group, 3 experiments. Scale bar represent 20 μm.
(D) Proportion of PE+ colonies specified under Serum-Lif (in the absence of 2i) or EP culture conditions for 24 or 48 h. One-way ANOVA, Tukey; p < 0.001; n = 100 per group; 3 experiments. Error bars represent SEM.
(E) UMAP dimensional reduction shows clearly defined clusters in stem cell-derived blastocysts and E3.5, E4.5, E7.5 cells (Nowotschin et al., 2019). Each dot represents a single cell that is color-coded by sample type. SB, synthetic blastocyst; SB-lif, ES-blastoid; SB-EP, EPS-blastoid.
(F) Gene expression distribution for DE-specific genes.
(G) Proportion of cells expressing the PE (positive values on y axis) and DE (negative values on y axis) markers. Note that the PE-like cells from synthetic blastocysts generated with ESCs (SB-Lif) shows lower proportion than both E4.5 and those generated with EPSCs (SB-EP).
(H) Main PE fate-determinant genes expressed within PE-like cell cluster of ES-(SB-Lif) or EPS-blastoids (SB-EP). See Figure S4A.
(I) Fold-enrichment in the percentage of cells were detected and color-coded by the log2-fold change in average expression of PE determinant genes in PE-like cells in EPS-blastoids (SB-EP) over ES-blastoids (SB-Lif).
(J) DEGs in PE-like cluster from ES- or EPS-blastoids. Cut-off for plotted genes, p < 10−6 and average log2FC > absolute value of 0.35, not Bonferroni adjusted.
(K) Fold enrichment in the percentage of cells where Gata6 (gene expression > 1) was co-expressed with selected PE genes, Gata4, Pdgfra, Sparc, Sox17, and Dkk1 (gene expression > 1) within the PE-like cell cluster from EPS-blastoids (SB-EP) over ES-blastoids (SB-Lif).
We next sought to further compare how culture conditions influence stem cell pluripotency. Conventional self-renewal culture conditions, in the presence of GSK3B and MEK inhibitors and the cytokine leukemia inhibitory factor (called 2iLif), reduce intercellular heterogeneity maintaining ESCs in a naive pluripotent state (Ying et al., 2008). Upon 2i withdrawal, ESCs change from naive to primed pluripotency, followed by the onset of differentiation (Shahbazi et al., 2017; Ying et al., 2008). To test the efficacy of stem cell-types and culture conditions in specifying PE-like cells, we compared aggregates generated, using ESCs or EPSCs, after 2i withdrawal or under EP conditions (Figure 2C). Only 13.31% of ESC aggregates expressed PE markers, PDGFRa and Sox17, 24 h after 2i withdrawal, rising to 18.18% after 48 h (Figures 2C and 2D).
The efficiency of PE-like cell formation by ESCs could be increased to 24.77% after 24 h and 38.10% after 48 h by culturing them in EP conditions, suggesting partial conversion to an EP state (Figures 2C and 2D). By contrast, 60.19% EPSC aggregates specified PE-like cells after 24 h, rising to 65.14% after 48 h under their EP conditions (Figures 2C and 2D). The efficiency of PE-like cell formation by EPSCs decreased to 18.79% after 24 h or 24.71% after 48 h culture in Lif conditions, suggesting exit from the EP state (Figures 2C and 2D). These results led us to conclude that the ability to generate PE-like epithelium depends upon the potency of the stem cells influenced by culture conditions.
To analyze the developmental potential of ESCs and EPSCs, we dissociated ES- or EPS-blastoids after 96 h of culture for single-cell transcriptome analysis (Figure S2A; see STAR Methods). Single cell clustering revealed three distinct cell populations representing the three blastocyst lineages within both blastoid groups (Figures S2A and S2B) but the abundance of cells able to specify an endoderm-like transcriptome was 1.7-fold higher in EPS-blastoids than ES-blastoids (6.4% versus 10.6%; Figure S2C). To identify the differences between the EPS-blastoids and E4.5 blastocysts, we first identified the differentially expressed genes (DEGs) between each lineage in pairwise combinations (Figure S2D), yielding 86 DEGs for the TE lineage, 63 DEGs for the Epi lineage and 41 DEGs for the PE lineage. To further show the general underlying differences, a Gene Ontology analysis (see STAR Methods) across all lineages was performed and identified an enrichment in functional terms linked to apoptotic process in the EPS-blastoid and an enrichment in methylation and metabolic processes in the E4.5 blastocysts (Figures S2D and S2E). A phylogenetic tree analysis and clusters in the UMAP dimensional reduction plots further illustrated close proximity between the EPS-blastoids and E4.5 blastocysts (Figures S2F and S2G). To determine whether endoderm identity in our synthetic platform captured the pre-implantation PE or post-implantation definitive endoderm (DE) lineage identity, we compared our endoderm transcriptomes with published dataset from early blastocyst to midgestation (E3.5–E8.75) stages (Nowotschin et al., 2019). Our analyses indicated that the PE-like cells from blastoids co-localized with PE cells from the E4.5 blastocyst but neither with cells from E3.5 blastocysts nor DE cells from E7.5 post-implantation embryos (Figures 2E–2G and S3A–S3C), indicating that endoderm-like cells resemble PE from the late blastocyst.
Although PE identity was seemingly captured in both ES- and EPS-blastoids, we identified differences in expression levels of core transcription factors that define PE lineage specification (Figures 2H and 2I). Specifically, PE-like cells from EPS-blastoids expressed higher proportions of Gata6, Sox7, Gata4, Pdgfra, Marcks, Gpt2 than PE-like cells of ES-blastoids (Figures 2H, 2I, and S4A–S4C). Of these, the PE cell fate determinant Gata6 showed the most robustly elevated differential expression in EPS-blastoids (Figures 2J and S4C). Gata6 is at the head of a hierarchy of genes regulating PE development (Hermitte and Chazaud, 2014) and its expression in blastoids correlated with this hierarchy (Figure 2K). These results indicate that gene expression profiles of EPS-blastoids bear the hallmarks of more successful PE generation than conventional ES-blastoids.
After specification of three blastocyst lineages, the PE-epithelium generates two further derivatives, PaE and VE, which are important for blastocyst remodelling at implantation (Figure 3A). In EPS-blastoids, we observed Gata6-expressing PaE-like cells detached from the ICM and extending over TE-like cells of the cavity from which they were separated by basement membrane (Figures 3B and 3C). This resembles the reorganization of newly specified PaE cells of E4.75 blastocysts (Figures 3B–3D). Our single-cell transcriptomic analyses revealed a small proportion of EPS-blastoid cells that expressed Snail (21.95% of total), Folistatin (4.06% of total), Vimentin (4.87% of total), Grem2 (4.87% of total), Stra6 (2.44% of total), and Zeb1 (2.44% of total) (Figures 3E and 3F); genes associated with PaE specification (Lehtonen et al., 1983). This contrasts with ES-blastoids, which did not exhibit features of PaE formation (Figure 3G).
Figure 3. Emergence of Parietal Endoderm (PaE) Subpopulations within PE-like Epithelium.
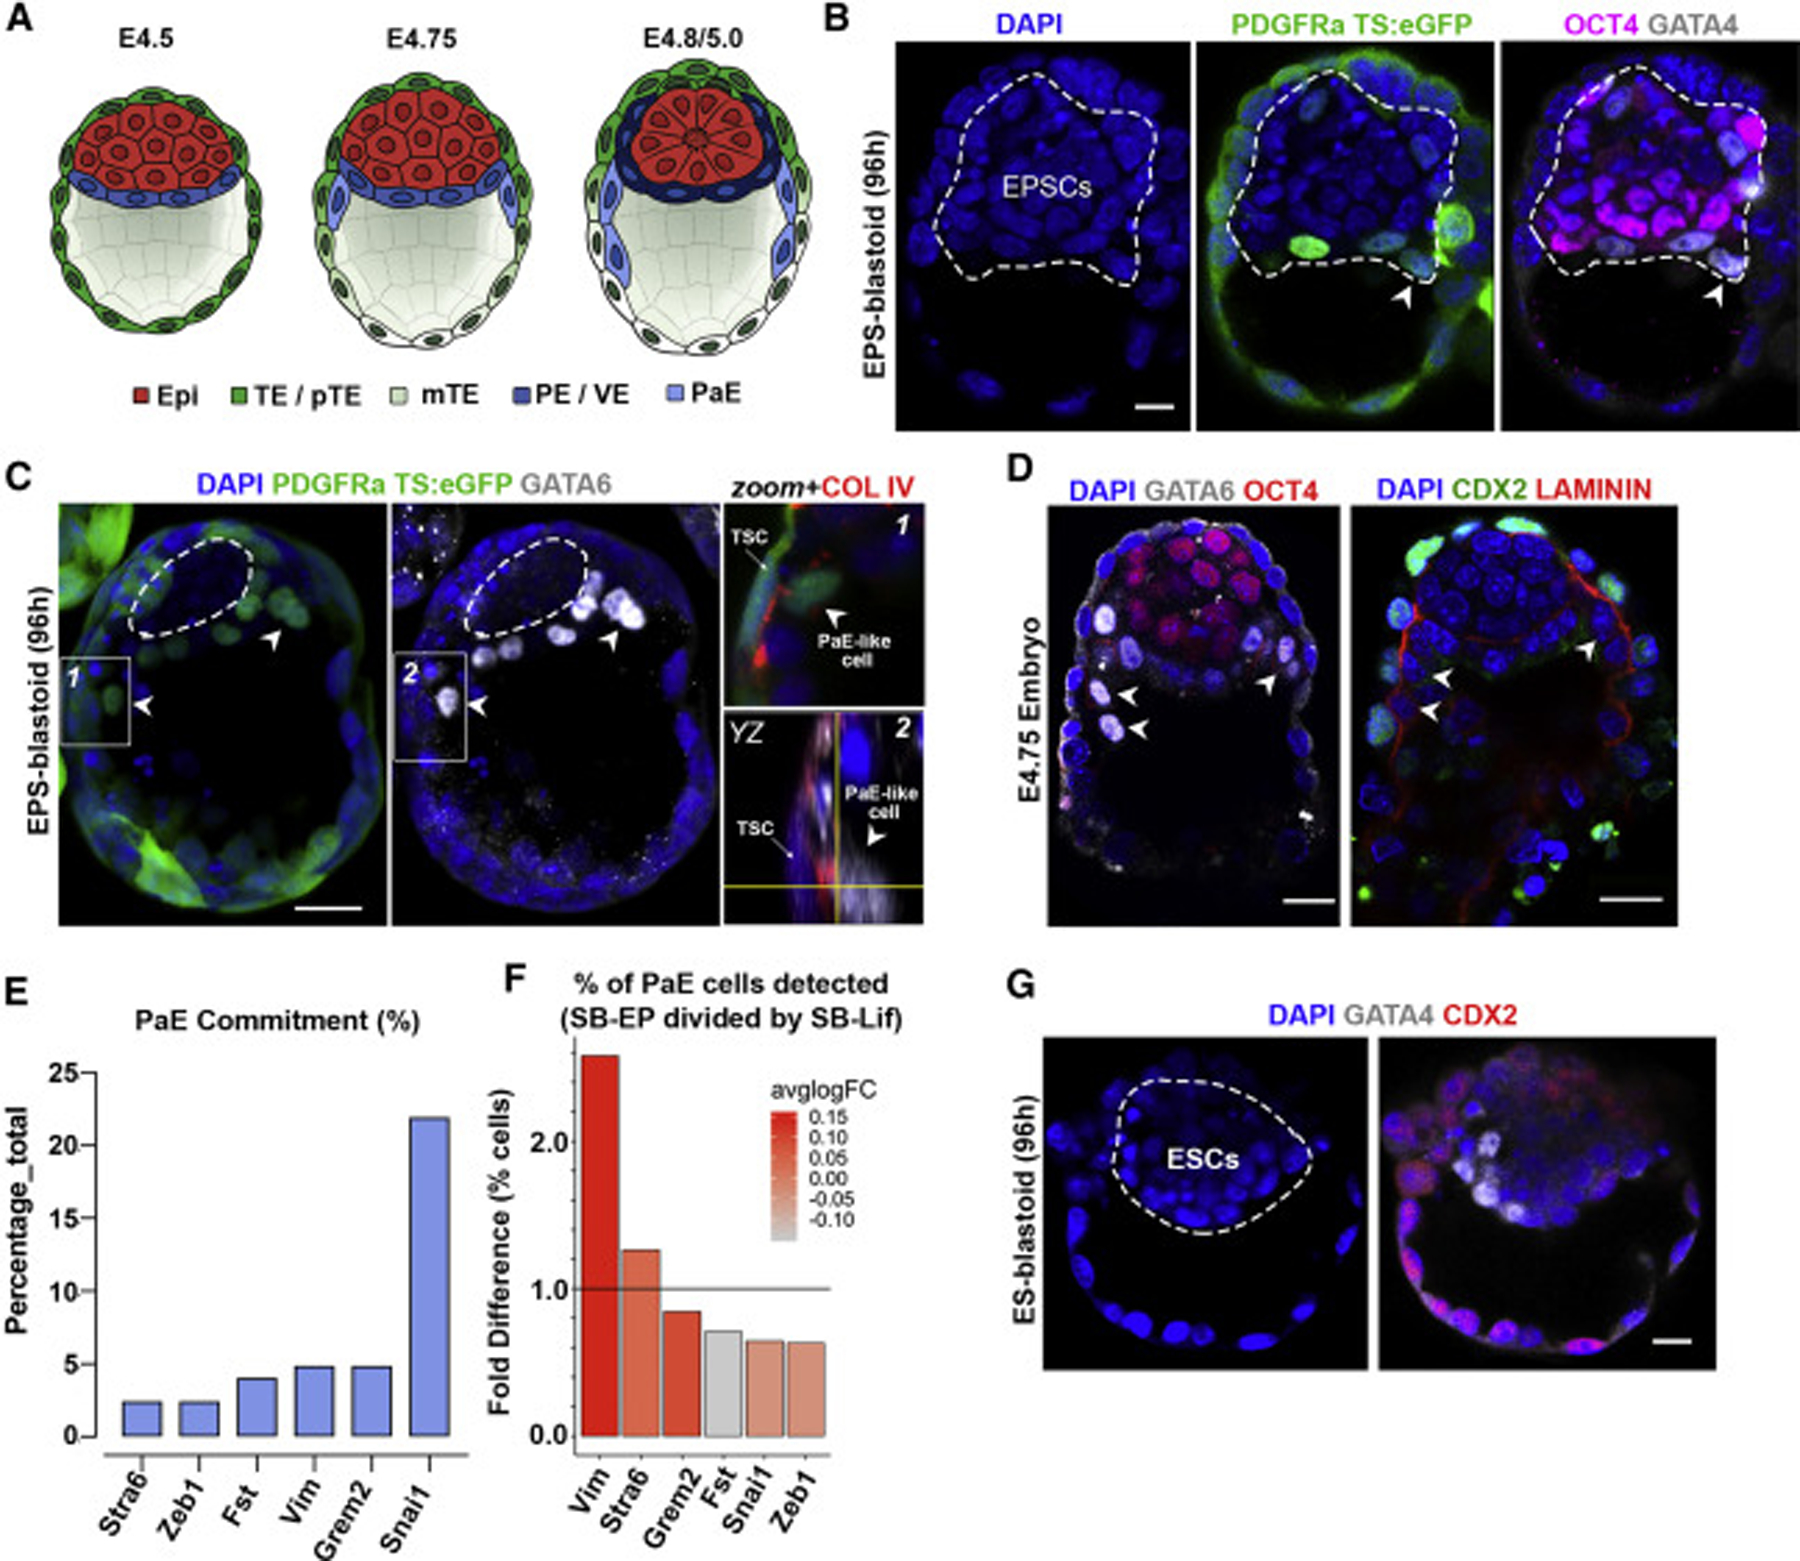
(A) Peri-implantation changes in blastocyst morphology. Emergence of primitive endoderm (PE; blue), PaE (light blue), and visceral endoderm (VE; dark blue). Epi, epiblast; TE, trophectoderm; pTE, polar TE; mTE, mural TE.
(B) EPS-blastoid with PDGFRa+ PaE-like cells.
(C) EPS-blastoid built from nuclear PDGFRa-H2B-GFP EPSCs and ubiquitous-eGFP TSCs. Arrowheads show PDGFRa and/or GATA6+ PaE-like cells extending along blastocoel cavity. Left and middle images show stack of 5 Z-planes. Boxed insets (labelled 1 and 2) on the right show Col IV (red) expression between PaE-cell and TSCs in single Z-plane. Orthagonal YZ view shown in inset 2 for better visualization.
(D) Natural E4.75 blastocyst showing early PaE formation (arrowheads).
(E) Percentage of cells expressing PaE-related genes as identified by sc-RNA-seq within the PE-like cell cluster in EPS-blastoids.
(F) The percentage and average expression levels of genes associated with PaE fate commitment within PE-like cell cluster in EPS-blastoids over ES-blastoids.
(G) Representative image of ESC-derived blastocyst in which there is no PaE formation.
Scale bars represent 20 μm in all panels.
Together, these results indicate that the EPSC-compartment can generate cells that morphologically and transcriptionally resemble the PE of the E4.5 blastocyst and that can initiate generation of PaE, which is critical for the pre- to post-implantation developmental transition.
Establishment of the Embryonic-Abembryonic Axis in Blastoids
At the conclusion of pre-implantation development, an embryonic-abembryonic (em-ab.em) axis becomes established. Polar TE, which covers the ICM at the embryonic pole, displays high self-renewal capacity; elevated expression of core TSC transcription factors; and is fated to form ExE following implantation. Mural TE, which encloses the blastocoel at the abembryonic pole, differentiates as it initiates invasion during implantation (Latos et al., 2015). We found that from around 96 h, EPS-blastoids showed a gradient of expression of the core self-renewal transcription factor, Cdx2, between the embryonic and abembryonic poles (Figures 4A–4C), resembling the Cdx2 pattern in blastocysts at em-ab.em axis formation (Figures 4D–4F). Similarly, the reverse gradient of Tfap2c along the em-ab.em axis (Figures 4B–4F) and the expression of Krt8, a marker for differentiating TE, in the abembryonic part indicated the similarity of EPS-blastoids to blastocysts in the onset of mural TE differentiation (Figure 4G).
Figure 4. Emergence of Distinct Subpopulations within TSC-Derived Epithelium Marks the Embryonic-Abembryonic Axis in EPS-Blastoids.
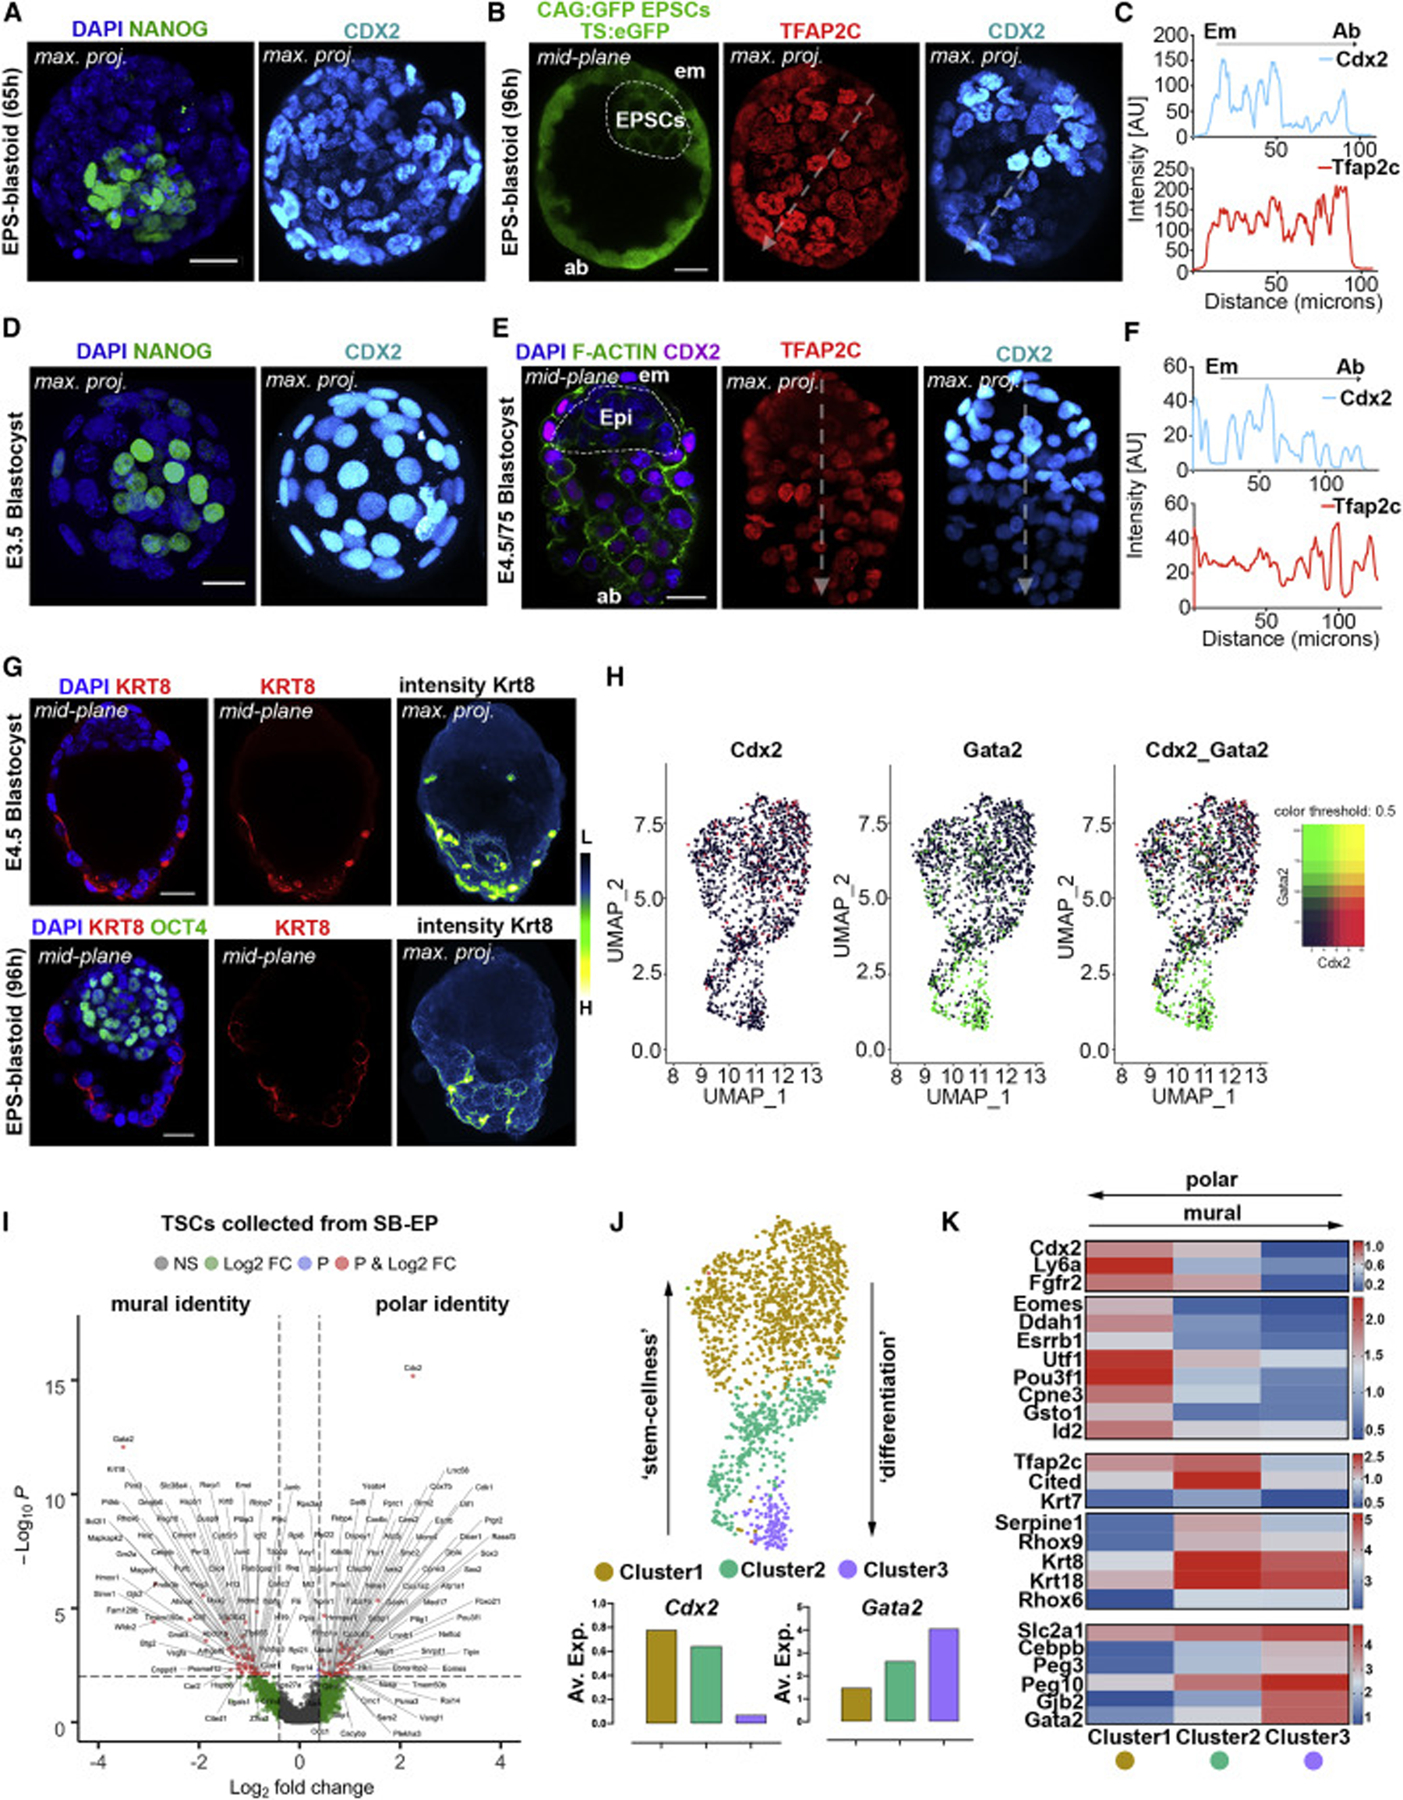
(A) Uniform Cdx2 expression in TSC-derived epithelium. 100%, n = 10/10 structures, 2 experiments.
(B) Cdx2-Tfap2c reverse gradient within the TSC-derived epithelium defining the embryonic-abembryonic axis. Dashed arrows, plane used to plot intensity profiles.
(C) Intensity plots of Cdx2 and Tfap2c expression. 73%, n = 11/15 structures, 3 experiments.
(D and E) Natural blastocysts at E3.5 with uniform Cdx2 expression and at E4.5–4.75 displaying a reverse gradient for Cdx2 and Tfap2c within TE. Dashed arrows, plane used to plot intensity profiles.
(F) Intensity plots for Cdx2 and Tfap2c expression. 100%, n = 10/10 embryos, 2 experiments.
(G) Cytokeratin8 (KRT8) immunostaining on abembryonic side of EPS-blastoid (n = 8/10) or E4.75 blastocyst (n = 9/10). KRT8 signal pseudocoloured with ‘‘fire’’ lookup table in Fiji to highlight intensity gradients on maximum projected images (right). L, low; H, high expression. 3 experiments.
(H) UMAP dimensional reduction on TSCs illustrating polarization via differential expression of Gata2 and Cdx2 along the mural-polar axis.
(I) DEGs between mural-like and polar-like TSCs from EPS-blastoids (STAR Methods). Cut-off for plotted genes, p < 10−2 and log2FC > absolute value bigger than 0.5, not Bonferroni adjusted.
(J) Louvain clustering shows emergence of three subpopulations within TSC-derived epithelium. Graphs below, average expression of Cdx2 or Gata2 within Louvain cluster analysis.
(K) Heatmap for the log2 normalized average expression of polar and mural TE genes between the 3 TSC clusters identified.
Scale bars represent 20 μm in all panels. Intensity plots calculated using the ‘‘plot-profile’’ function in Fiji software.
To validate these observations, we analyzed TE transcriptomes from single cells of blastoids at 96 h sorted using Cdx2 and Gata2 as respective polar and mural TE markers (Nakamura et al., 2015). This analysis revealed the TSC cluster to be polarized into distinct populations having either Cdx2-high and Gata2-low or Cdx2-low and Gata2-high gene signatures (Figures 4H and 4I; see STAR Methods). Louvain clustering (Waltman and Eck, 2013) delineated 3 distinct subpopulations within the TSC-derived epithelium (Figure 4J). Cells in cluster 1 (Figure 4J; yellow), showed expression of self-renewal and mitotic cell cycle transcription factors, including Essrb, Eomes, Utf1, Ddah1, Pou3f1, Cpne3, markers of the polar TE (Figure 4K). The opposing sub-cluster (Figure 4J; Cluster 3, purple) contained cells expressing high levels of terminal differentiation markers including Gata2, Gjb2, Peg3 and Peg10 (Figure 4K). The mid sub-cluster (Figure 4J; Cluster 2, green) showed an intermediate expression profile, with upregulation of early differentiation genes, Tfap2c, Krt7, Krt18, Serpine1, Rhox6, Rhox9 (Figure 4K). These results suggest that cells exhibit a progressive exit from stem-cell (polar) identity toward a differentiated (mural) state characterizing establishment of the em-ab.em axis in EPS-blastoids. These features are likely to reflect segregation of differential cellular identity from an initially multipotent TE lineage as during natural embryogenesis.
Self-Organization of Blastoids into Post-implantation-like Structures In Vitro
We next tested whether EPS-blastoids would undertake cell rearrangements that characterize post-implantation morphogenesis. We found that, depending upon culture conditions, between 5% and 20% of EPS-blastoids became reorganized into elongated, egg cylinder-like structures, 83.5% of which had abutting EPI- and ExE-like compartments positioned along a proximal-distal axis and enveloped by a VE-like cell layer (Figures 5A, 5B, S5A, and S5B). This pattern of organization was similar to natural embryos and ETX embryos comprising ESCs, TSCs, XEN cells (Sozen et al., 2018; Figures 5C and 5D). In contrast, none of the ES-blastoids developed in this way; 91.7% failed to develop at all over 27 h (Figure S5C) and 8.3% formed non-polarized ESC-TSC aggregates with no distinguishable VE-layer after 48 h (Figure S5C).
Figure 5. Self-Organization of EPS-Blastoids into Post-implantation-like Morphology In Vitro.
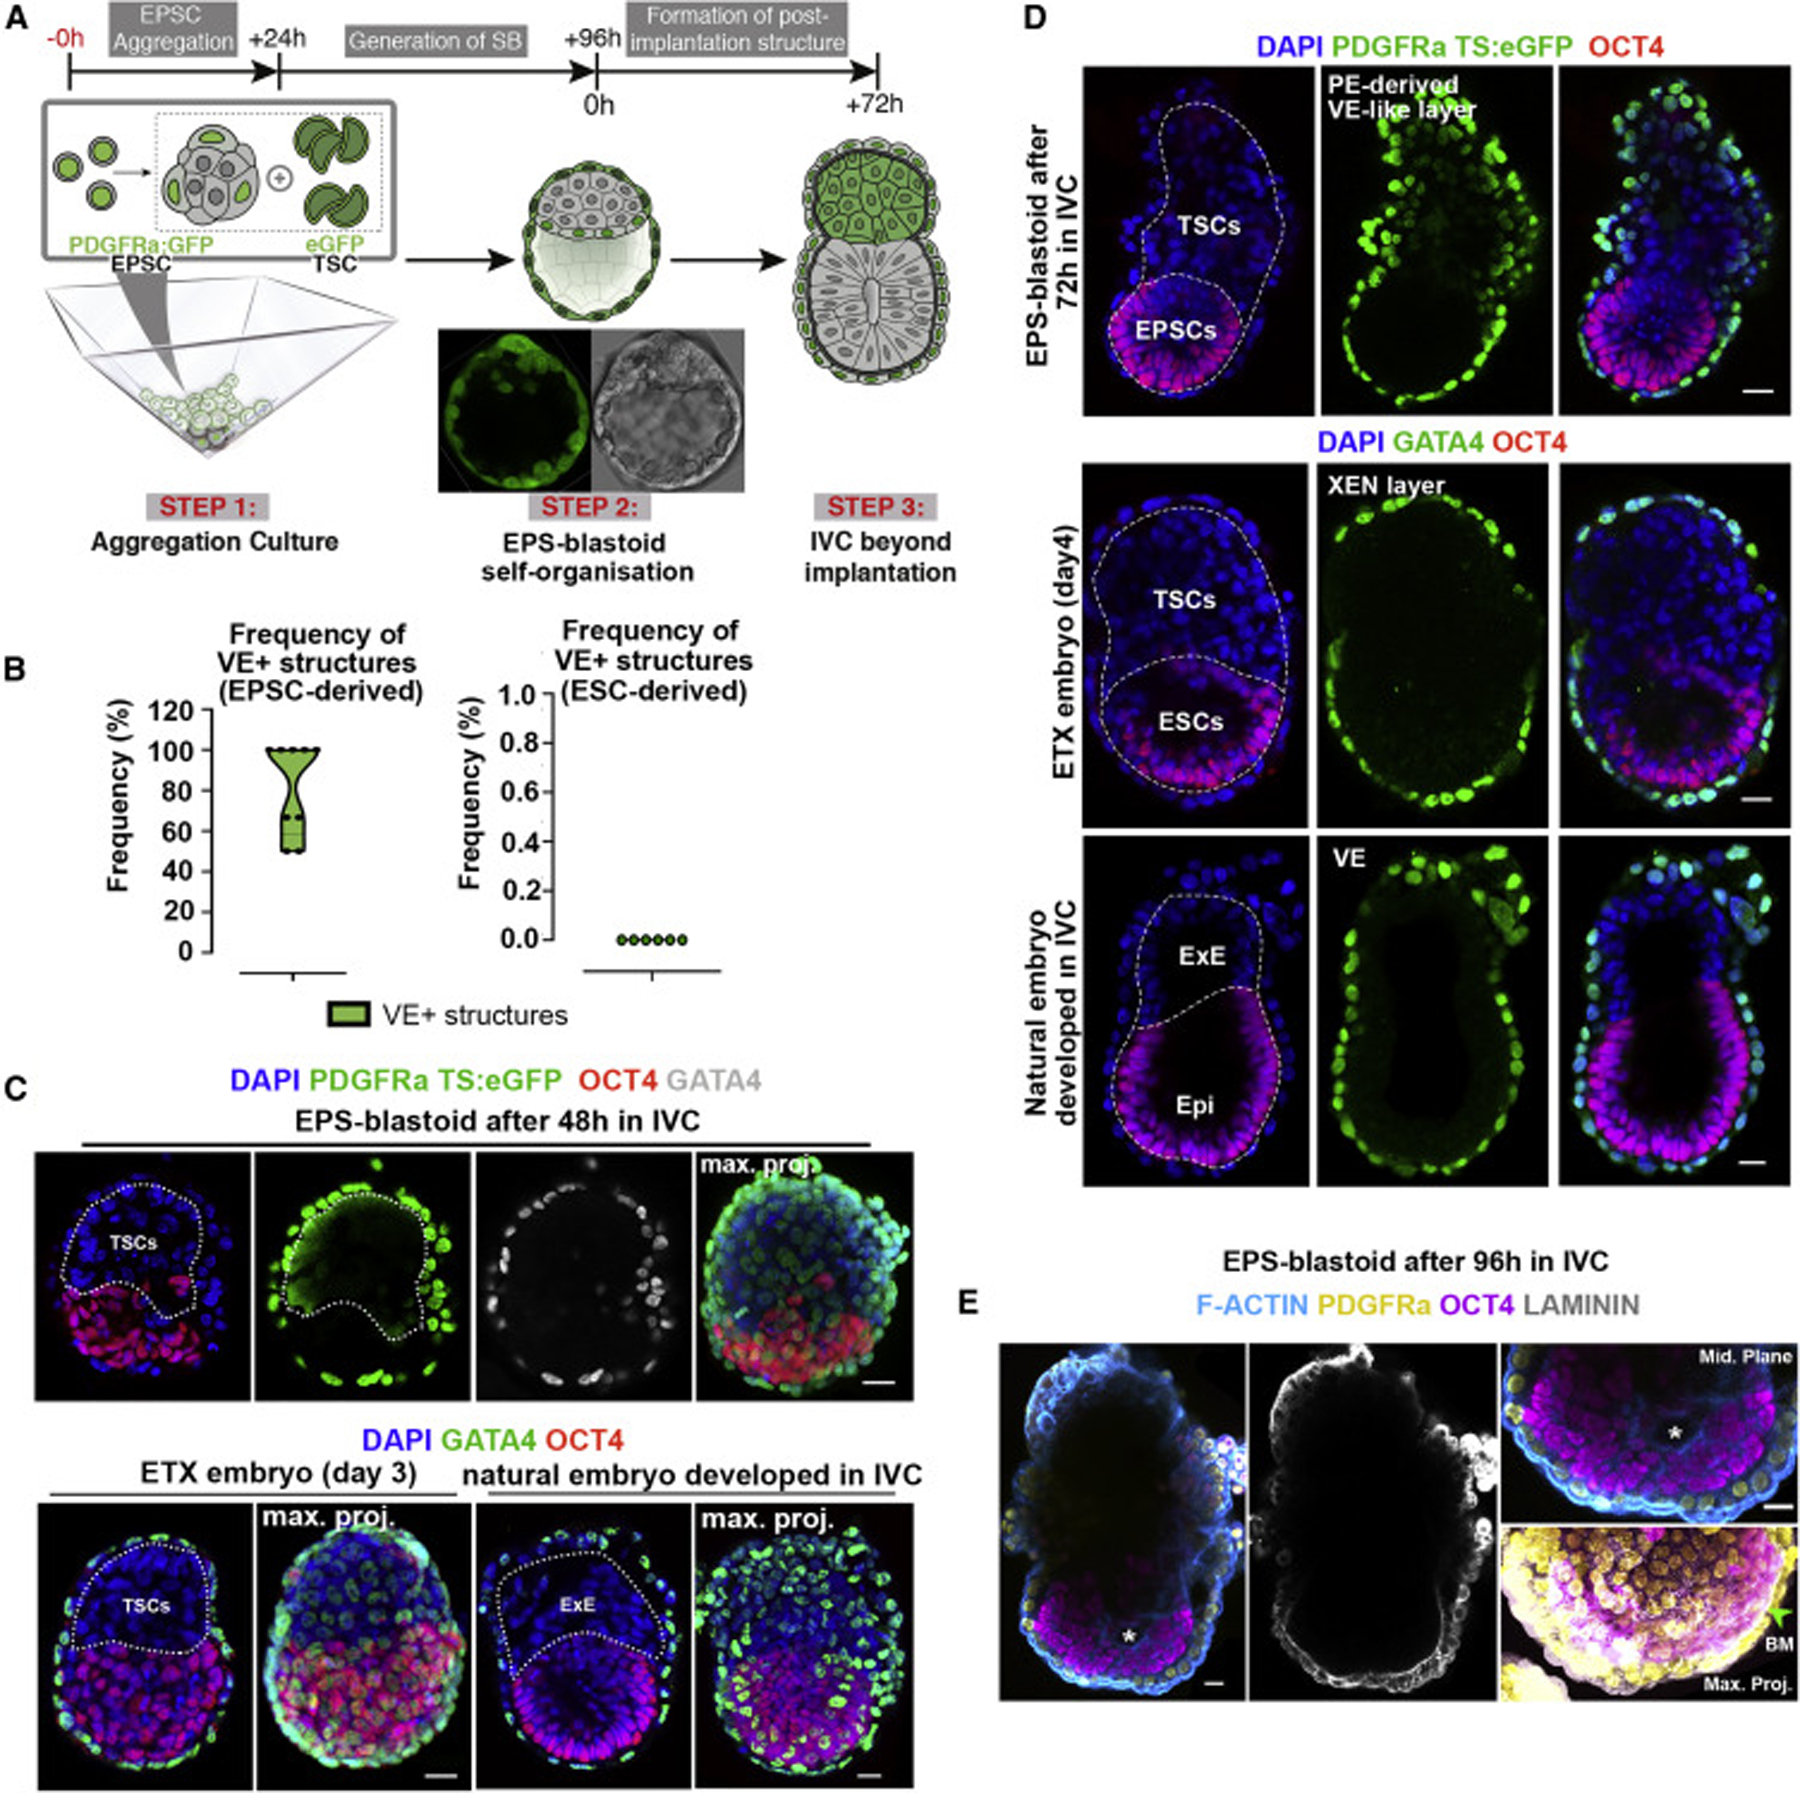
(A) Protocol for generating post-implantation-like structures from EPS-blastoids in vitro. Central micrograph shows a representative EPS-blastoid built from nuclear PDGFRa-H2B-GFP EPSCs and ubiquitous eGFP TSCs.
(B) Efficiency of PE-derived VE-like layer formation from EPS-blastoids (left; n = 15/19, 8 experiments) or ES-blastoids (right; n = 0/10, 6 experiments).
(C) Top, post-implantation-like structure formed from EPS-blastoid after 48 h in vitro (n = 10). Nuclear PDGFRa-H2B-GFP and ubiquitous eGFP TSC signals define the PE-like cell-derived VE-layer and TSC-derived ExE, respectively. Bottom-left, ETX embryo built from ESCs, TSCs, and XEN cells (n = 20). Bottom-right, natural embryo developed in IVC (n = 10). 3 experiments.
(D) Top, post-implantation-like structure generated by self-organization of EPS-blastoid following 72 h culture in vitro. Endogenous PDGFRa signal, PE-like cell derived VE (n = 25, 18 experiments). Middle, ETX embryo. Gata4 reveals XEN-derived VE. Bottom, Natural embryo developed in IVC. Gata4 reveals natural VE. White dashed lines outline embryonic-extraembryonic border and base of VE. n = 15 per group, 3 experiments.
(E) Post-implantation stage structure formed from PDGFRa-H2B-GFP EPS-blastoid. Magnified fields display cavity (top-right; white asterisk) within EPSC-derived embryonic compartment, and basement membrane (bottom-right; green arrowhead) between EPSC and VE-like layer. Maximum projected image (bottom-right) is rotated 30 degrees for a better visualization of basement membrane between embryonic-extraembryonic layers.
Scale bars represent 20 μm; Error bars represent SEM in all panels.
To analyze formation of the respective EPI and VE components of the egg cylinder, we filmed the development of EPS-blastoids on optical-grade plastic under IVC conditions. We found that PE-like cells segregated from other EPSCs and formed an epithelium by 24 h, which surrounded the cylindrical structure by 48 h (Figures S5D and S5E). The PE-derived VE-like layer of these post-implantation stage structures deposited the basement membrane, which is required for EPI cells to polarize and generate the pro-amniotic cavity (Figure 5E; Bedzhov and Zernicka-Goetz, 2014; Christodoulou et al., 2018). These results indicate that, in contrast to ES-blastoids, EPS-blastoids not only self-assemble and organize to correctly specify all 3 lineages of the blastocyst, but also develop further to achieve the global rearrangements of these tissues beyond the implantation stages in vitro.
EPS-Blastoids Initiate Morphogenesis upon Implantation In Vivo
As EPS-blastoids develop to form PE with a potential to generate both PaE and VE and can initiate development through the implantation stages in vitro, we tested their capacity for development beyond implantation in vivo. We observed successful decidualization after transfer of EPS-blastoids into the uteri of pseudo-pregnant mice at 2.5 or 3.5 day post coitum (d.p.c) although deciduae were smaller than those induced by natural blastocysts (Figure 6A). Naturally developing deciduae pass through 2 stages to generate the primary (PDZ) and secondary zones (SDZ) along their mesometrial-antimesometrial axis, crucial to support the embryo before placental vasculature is established (Figure 6B). The deciduae induced by both EPS-blastoids and natural blastocysts developed the PDZ, marked by Ptgs2 expression, and the surrounding undifferentiated stromal cells showed complementary Ki67 expression confirming normal tissue proliferation in the SDZ (Figures 6E and 6F). Despite progression of EPS-blastoids through the SDZ stage, equivalent to 7.5 d.p.c in natural decidualization, EPS-blastoid development was not sustained beyond this point (Figures S6A and S6B).
Figure 6. EPS-Blastoids Initiate Implantation In Vivo.
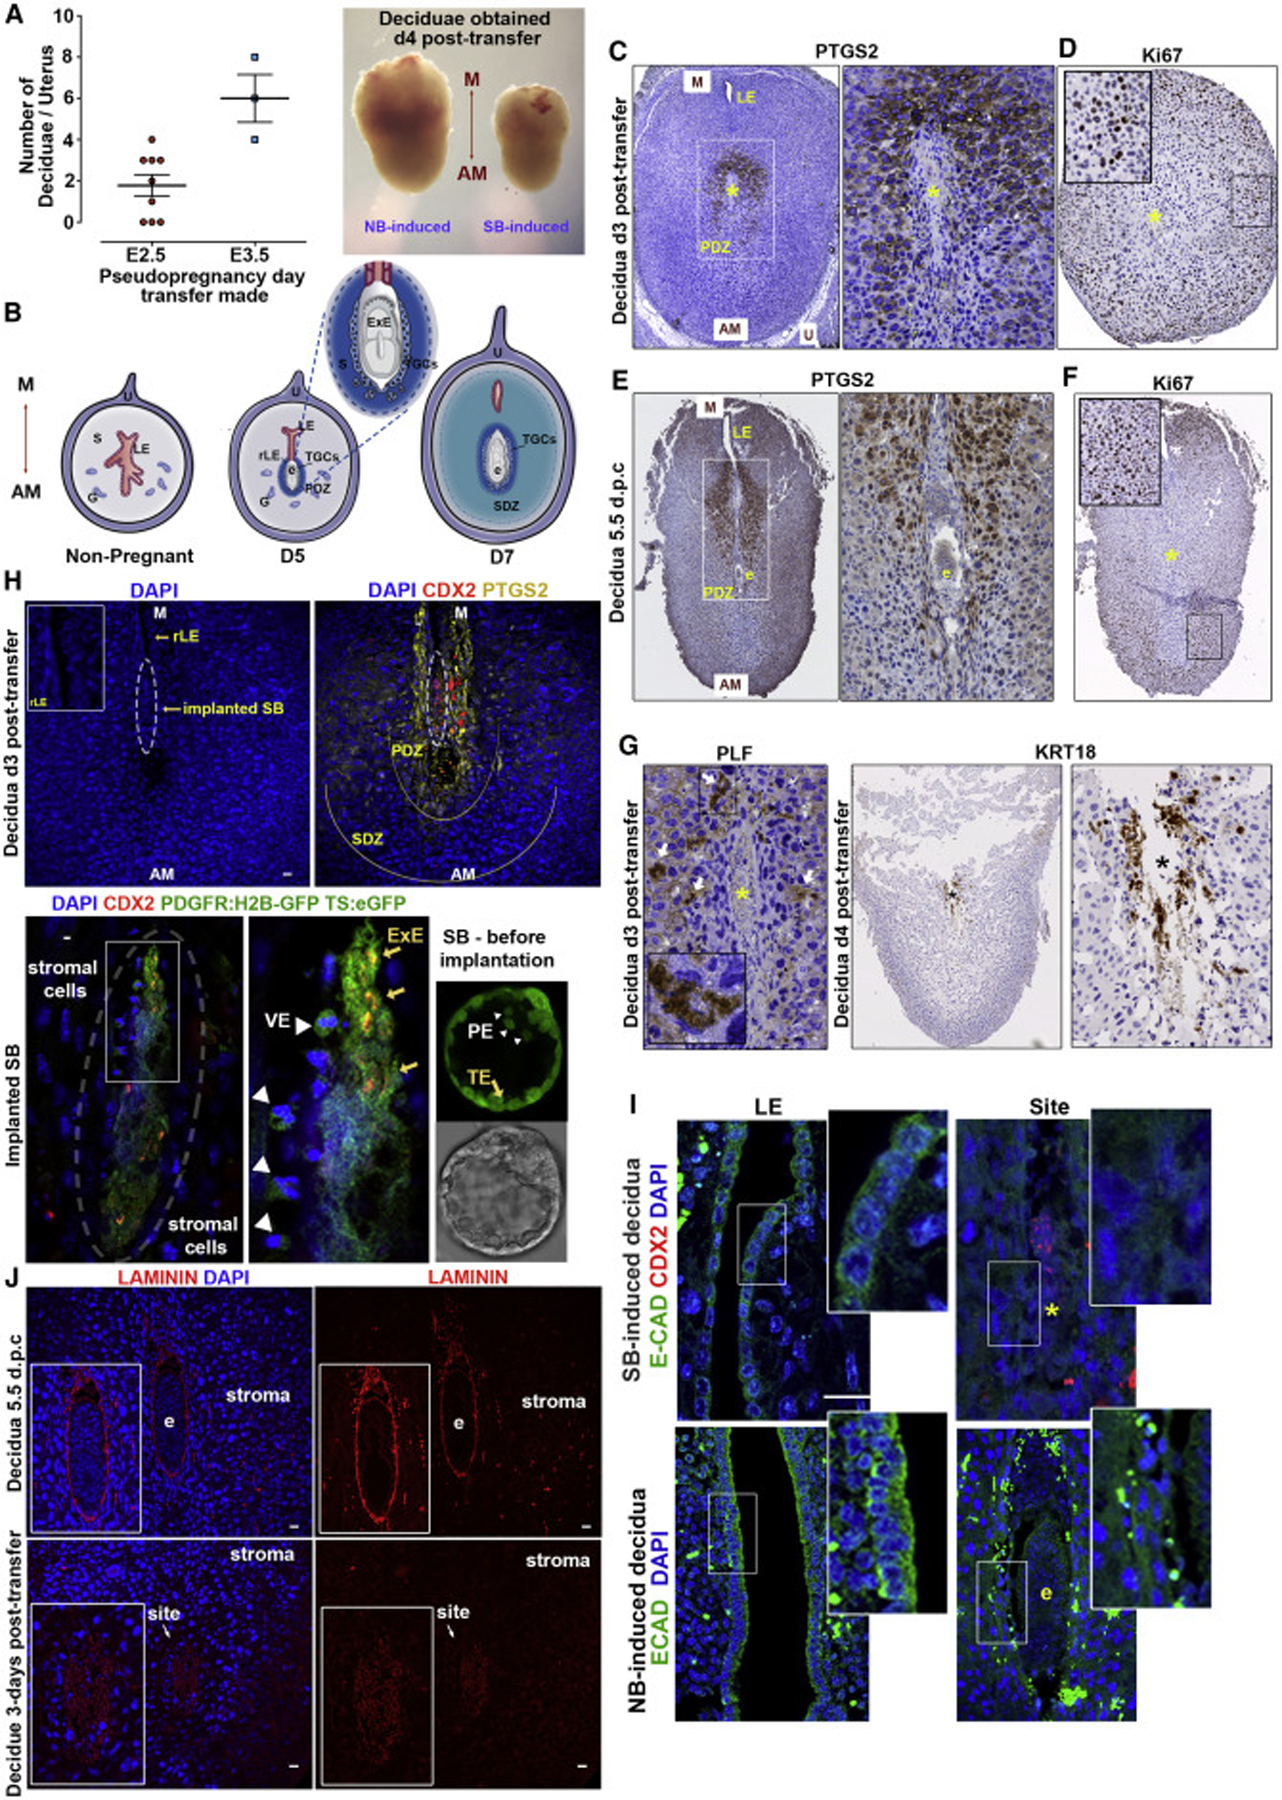
(A) Number of deciduae obtained after transfer to pseudopregnant females at E2.5 or E3.5. Representative deciduae dissected 4 days post-transfer. NB, natural blastocyst induced; SB, EPS-blastoid induced; M, mesometrial; AM, anti-mesometrial.
(B) Decidua remodelling in natural embryo implantation. S, stroma; G, glands; U, uterine tissue; LE, luminal epithelium; rLE, regressed LE; E, implanted embryo; TGC, trophoblast giant cells; PDZ, primary decidua zone; SDZ, secondary decidua zone.
(C and D) Immunohistochemical staining of the EPS-blastoid-induced decidua. Ptgs2 marks PDZ (C), Ki67 marks normal tissue proliferation of SDZ (D); Yellow asterisk, implantation site; n = 8 SB-induced decidua.
(E and F) Immunohistochemical staining of the decidua at 5.5 d.p.c. Ptgs2 marks PDZ. E, embryo (E). Ki67 marks normal tissue proliferation of SDZ. Yellow asterisk: implantation site (F). n = 2 NB-induced decidua.
(G) Proliferin (PLF) and Krt18 mark TCGs upon invasion. Yellow or black asterisk, implantation site. n = 4 EPS-blastoid-induced decidua.
(H) The EPS-blastoid-induced decidua section shows immunohistoflourescence for Ptgs2 (yellow) at implantation site, Cdx2 (red) for implanting conceptus. Implanted structure magnified, Cdx2 co-localises with ubiquitous TS:eGFP expression (yellow arrows); surrounding cells are positive for nuclear PDGFRa-H2B-GFP (white arrowheads). Right, representative EPS-blastoid before transfer (nuclear PDGFRa-H2B-GFP for PE-like cells and ubiquitous eGFP for TSCs). n = 3 SB-induced decidua.
(I) Break-down of LE during implantation. Top, E-cadherin marks LE before the closure (left); implantation site with lost LE (right). Cdx2 indicates implanted conceptus. Note disrupted structural integrity indicating resorption. Bottom, shows same events during natural implantation (e, embryo).
(J) Immunohistoflourescence for laminin (red) at basement membrane surrounding implanted conceptus (E). Laminin assembly absent in EPS-blastoid-induced deciduae (bottom) n = 3 NB-induced; 5 SB-induced deciduae.
Scale bars represent 20 μm; Error bars represent SEM in all panels.
We next investigated the reciprocal interaction between EPS-blastoids and the receptive uterus. Implantation is dependent upon the rapid differentiation of the TE lineage into trophoblast giant cells (TGCs), which surround the implantation site to form the interface with the maternal tissue (Simmons et al., 2007; Tamai et al., 2000). We found cells expressing Proliferin (PLF), a TGC-derived paracrine factor, and Krt18 around the implantation sites, indicating successful TE invasion and differentiation into primary TGCs in utero (Figure 6G). Unlike differentiated TGCs, which invade the decidual stroma, proliferative TSCs form the ExE of the natural conceptus. Therefore expression of core TSC transcription factors, including Cdx2 and Eomes, are limited to conceptus itself (Figure S6C). Three days after the in utero transfer of EPS-blastoids developed from eGFP:TSCs (fluorescence throughout the cell) and PDGFRa-H2B-GFP EPSCs (nuclear fluorescence), we found a group of Cdx2 expressing cells within the Ptgs2-positive implantation site (Figure 6H; upper panel). Importantly, Cdx2 protein co-localized with the eGFP:TSC signal indicating an undifferentiated TSC population forming an ExE-like compartment (Figure 6H; lower panel). Within this structure, several cells surrounding the Cdx2 and/or eGFP positive cell population, were positive for nuclear PDGFRA:H2B-GFP (Figure 6H; lower panel), indicating VE-like organization. Histological examination of these deciduae revealed cells expressing GFP (eGFP:TSC), Sox2 and Eomes within a cylindrical structure (Figure S6D). This suggests that implanted EPS-blastoids can initiate post-implantation re-organization, yet their impaired morphology suggests resorption shortly after implantation (Figures 6H and S6D).
Finally, we explored potential reasons for developmental loss of the EPS-blastoids in utero. Embryo implantation and in utero growth requires anchoring of mural TE to break down the luminal epithelium (LE) barrier to make direct contact with the underlying maternal stroma (Li et al., 2015). Following EPS-blastoid transfer, and resembling natural implantation, the LE became discontinuous with LE cells disappearing from the implantation site surrounding the conceptus (Figures 6I, S6E, and S6F). Thus, our results indicate that despite TE invasion, abnormalities arose after physical contact was established with the maternal tissue. Formation of an extra-embryonic basement, so-called Reichert’s membrane is required to create a protective physical barrier for the conceptus in utero (Schéele et al., 2005; Williamson et al., 1997). Immunohistochemical staining revealed that EPS-blastoids failed to assemble Reichert’s basement membrane in utero (Figure 6J). These results suggest that failure of Reichert’s membrane formation might contribute to disrupted structural integrity and compromised viability of stem cell-derived embryos in utero.
DISCUSSION
Difficulties in studying dynamic patterning and morphogenesis during development have prompted efforts to model embryogenesis in vitro using stem cells (Beccari et al., 2018; Harrison et al., 2017; Kime et al., 2019; Rivron et al., 2018; Warmflash et al., 2014; Zheng et al., 2019). Such systems held a promise to provide an opportunity to unravel developmental complexity in a more accessible and controllable environment than in the natural embryo buried in the uterus. We recently described the ability of embryonic (ESC) and extra-embryonic (XEN and TSC) stem cells to self-organize into structures that morphologically and transcriptionally resemble post-implantation mouse embryos (Harrison et al., 2017; Sozen et al., 2018). In these models, referred to as ET and ETX embryos (reflecting the constituent stem cell types), cells adopt ‘‘primed’’ states of the natural post-implantation embryo. These primed states permit embryonic patterning and cell rearrangements resulting in formation of egg cylinder-like structures. Thus, ET and ETX embryos effectively bypass the pre- or peri-implantation remodelling steps.
Recent studies demonstrate the ability of stem cells to form structures resembling pre-implantation blastocysts, termed blastoids (Rivron et al., 2018) or blastocyst-like cysts (iBCs; Kime et al., 2019). The system we describe here also generates blastocyst-like structures but utilizes stem cells grown under conditions that enhance their pluripotent state. Our results indicate that this improves the generation of blastoids containing all 3 founding blastocyst lineages. Importantly, PE-like cells of EPS-blastoids can further differentiate into PaE and VE, and their TSCs segregate into polar and mural types, extending blastoid development beyond that previously described. Our results indicate that hypoxic (5% O2) conditions during TSC and EPSC aggregation promote generation of cavitated structures, in accord with reports of increased blastocyst formation and stem cell self-renewal under low oxygen tension (Simon and Keith, 2008; Wale and Gardner, 2010). Significantly, these experimental conditions result in generation of all three blastocyst lineages and initiation of formation of their descendants (Figure 7).
Figure 7. Generation of Blastocyst Lineages and Descendants from Stem Cells with Extended Pluripotency.
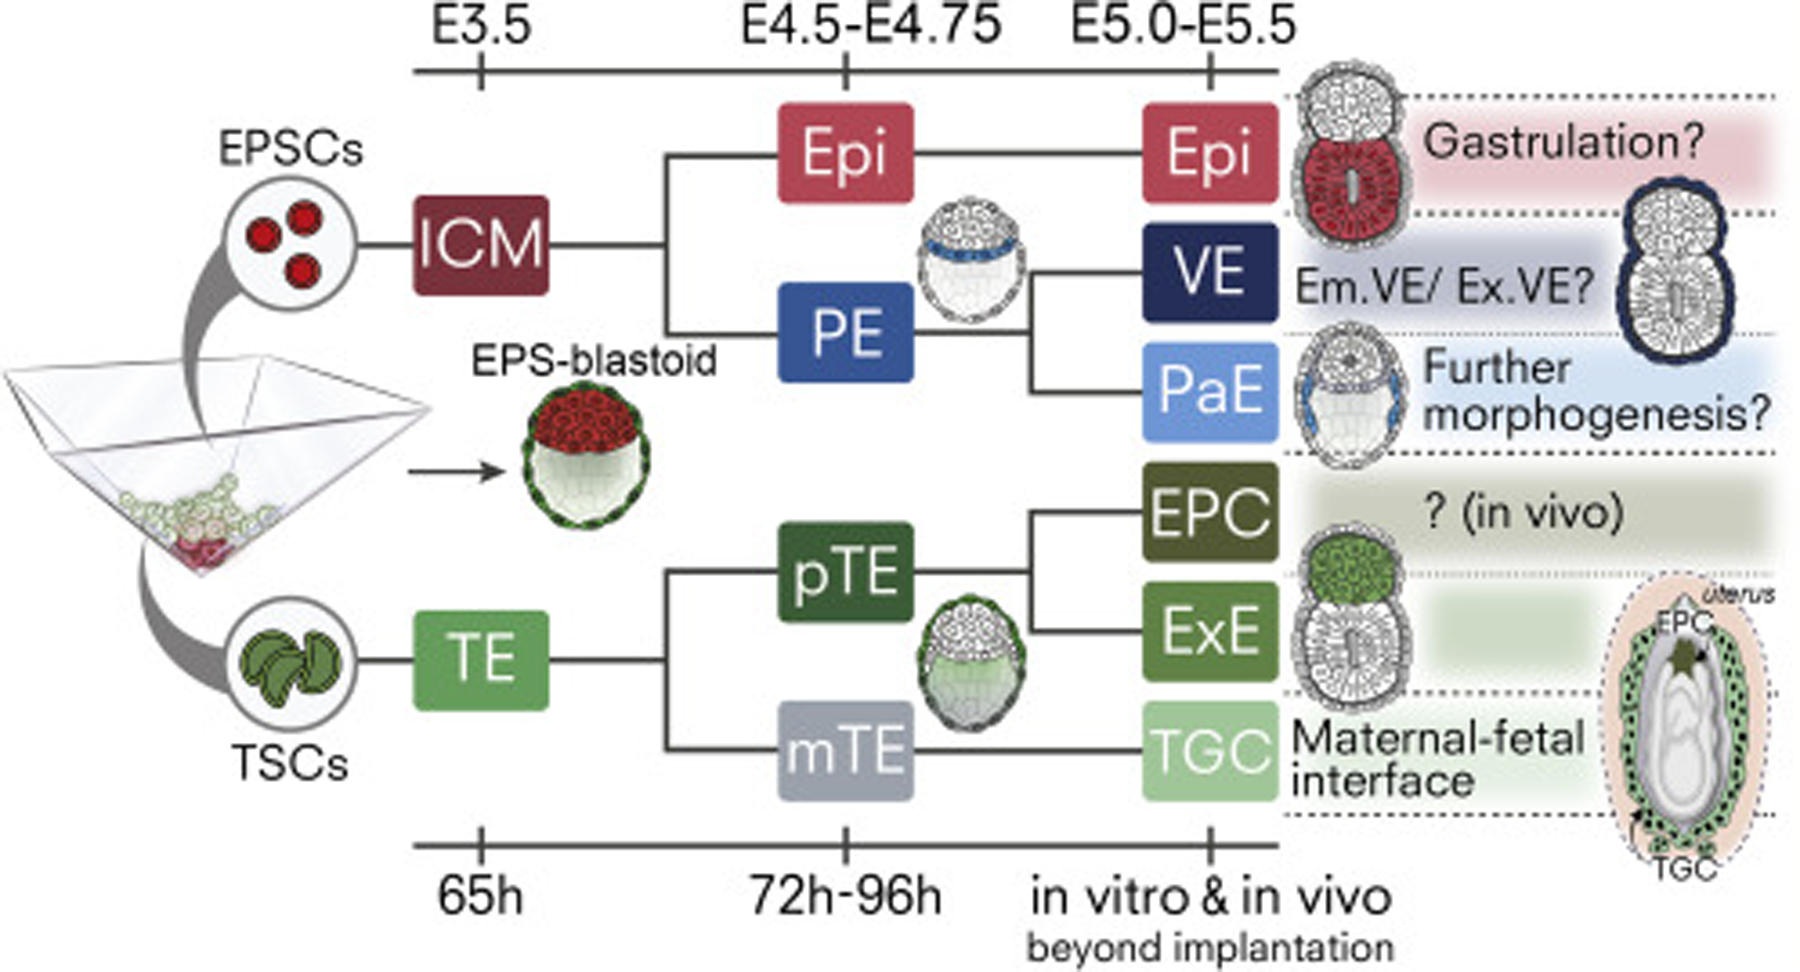
EPS-blastoids produce lineages resembling naïve Epiblast (Epi; Red) and primitive endoderm (PE; light blue) progenitors. Upon development in vitro, Epi-like lineage transforms into primed, cavitating post-implantation Epi. PE-like progenitors give rise to two PE-derivatives, parietal endoderm (PaE; cyan) and visceral endoderm (VE; dark blue) that facilitate post-implantation remodelling. Concomitantly, TSCs first generate an epithelium resembling the preimplantation trophectoderm (TE; green). TE layer specifies polar (pTE; dark green) and mural identity (mTE; gray), establishing the embryonic-abembryonic axis. pTE having a high cell renewal capacity generates extra-embryonic ectoderm (ExE; green) beyond implantation in vivo and in vitro. Cells with mural identity invade maternal tissue and transform into trophoblast giant cells (TGCs; light green) that form the maternal-fetal interface in vivo. (EPC, Ectoplacental cone; brown).
Conventional ESCs do not generally contribute to extra-embryonic TE or PE lineages, despite their ability to differentiate into PE cells when externally directed (Anderson et al., 2017; Tam and Rossant, 2003; Ying et al., 2008). It is known that endodermal identity within ESCs and embryonic bodies (EBs), can be induced either genetically by overexpression of GATA transcription factors (Capo-Chichi et al., 2005; Fujikura et al., 2002) or by treatment with external stimuli such as retinoic acid, cAMP, or Fgf (Lin et al., 1994; Strickland and Mahdavi, 1978). After such treatments, these cells do not self-renew indefinitely in contrast to recently established protocols which stably convert ESCs to EPSCs with potency for both embryonic and extra-embryonic lineages (Gao et al., 2019; Yang et al., 2017a, 2017b). In our study, use of this EP conversion protocol allowed cell fate to spontaneously bifurcate to form EPI and PE-like lineages. We cannot discount that bi-potency of our EPSCs is a consequence of culture conditions alone. That said, there is a continuum between ESC and EPSC fate that reflects, at least in part, how cells are cultured. The influence of culture conditions is evident when EPSCs are aggregated in the serum/Lif condition reducing the potential of the cells to generate PE. This is perhaps unsurprising as the factors that maintain the EP state are removed from culture, leading cells to exit this state.
Studies in both cell lines and the embryo revealed that Gata6 is the earliest regulator of endoderm gene expression in PE formation (Hermitte and Chazaud, 2014). Gata6 is a dose-dependent activator of a hierarchy of transcription factors that regulate PE development (Artus et al., 2011; Schrode et al., 2014). Indeed, Gata6 expression is elevated in EPS-blastoids compared to ES-blastoids together with its endoderm target genes including Sox17, Gata4, Sox7 and Pdgfra. In accord with this and in contrast to ES-blastoids, EPS-blastoids can generate PE, initiate early PaE specification, and subsequently develop VE in vitro. Thus, commitment to PE lineage formation and subsequent endoderm programming is more fully achieved in the descendants of EPSCs than ESCs. This appears to enable at least initiation of the pre- to post-implantation morphogenesis by specifying a VE-like layer, which generates the basement membrane that is critical for EPSCs to polarize and switch from a naive to a primed state as occurs in natural development (Shahbazi et al., 2017).
In parallel with the ability of the EPSCs to form 2 separate lineages, the outer TSC-epithelium also develops into 2 developmentally distinct sub-populations, which differ from each other spatially and transcriptionally. The EPS-blastoids display continued proliferation of polar TE leading to formation of ExE as in natural development. At the abembryonic pole, the mural TE cells cease division and form differentiating giant cells (TGCs). Embryo attachment to the endometrial epithelium occurs through mural TE which forms the primary interface with the maternal tissue (Aplin and Ruane, 2017). When EPS-blastoids were transplanted into foster mothers, we found PLF and KRT18-positive primary TGCs at the initial endometrial contact site where epithelial cells were lost, suggesting mural TE-like cells invade the maternal stroma to initiate the maternal-fetal interface. Although EPS-blastoids can establish typical interactions with the maternal environment, the PaE is not fully formed, and structures lack Reichert’s membrane. Reichert’s membrane is normally formed between the mural TE and PaE after implantation and is required to create a physical barrier to protect the conceptus in utero. The developmental failure of implanted EPS-blastoids resembles embryonic death at E5.5 when Riechert’s membrane fails to form in embryos lacking Laminin β1 or γ1 chains (Schéele et al., 2005; Williamson et al., 1997). Further studies will be required to relate developmental status with the physical environment to assess the impact of force generation upon ECM and thereby Reichart’s membrane assembly.
In conclusion, the EPS-blastoids we describe here can develop to generate cylindrical structures with abutting ExE and EPI compartments enveloped by a VE-like cell layer, which resemble the ETX embryos we previously generated through self-organization of ESCs, TSCs and XEN cells (Sozen et al., 2018). Here, however, we generate these structures by utilizing extended potential properties of EPSCs combined with TSCs. Whereas blastoids derived from ESCs or EPSCs initially appear similar, they develop to display differences in gene expression that reflect differences in their developmental potential. Hence, this platform for modelling pre-implantation development has a potential to offer in future a quantitative tool to functionally assess mammalian early embryogenesis.
STAR★METHODS
LEAD CONTACT AND MATERIALS AVAILABILITY
Further information and requests for resources and reagents should be directed to and will be fulfilled by the Lead Contact, Magdalena Zernicka-Goetz (mz205@cam.ac.uk). This study did not generate new unique reagents. All stem cell lines generated in this study are available from the Lead Contact with a completed Materials Transfer Agreement.
EXPERIMENTAL MODEL AND SUBJECT DETAILS
Embryo Recovery
Mice were maintained in accordance with national and international guidelines. All experiments have been regulated by the Animals (Scientific Procedures) Act 1986 Amendment Regulations 2012 following ethical review by the University of Cambridge Animal Welfare and Ethical Review Body (AWERB). Experiments were approved by the Home Office. Animals were inspected daily and those that showed health concerns were culled by cervical dislocation. All experimental mice were maintained in specific pathogen-free conditions on a 12–12 -hr light-dark cycle temperature-controlled facility with free access to water and food, and used from 6 weeks of age. To prepare pseudopregnant surrogates, CD-1 female mice (6 weeks old) in the estrus were mated with vasectomized CD-1 male mice. To collect in vivo embryos, six-week-old female CD-1 mice were naturally mated and sacrificed 3.5, 4.5 or 4.75 days post coitum. Uteri were recovered and embryos dissected from deciduae in M2 medium. Blastocysts were recovered by uterine flushing.
Cell Culture
All cells were cultured at 37°C in 20% O2 or 5% CO2 and passaged once they had reached 80% confluency. Cells were routinely tested for mycoplasma contamination by PCR.
ESCs were cultured on gelatinized tissue-culture–grade plates, in N2B27 medium with 2i/LIF (1μM MEK inhibitor PD0325901 (Stem Cell Institute, Cambridge, UK), 3μM GSK-3 inhibitor CHIR99021 (Stem Cell Institute) and 10ng ml−1 LIF (Stem Cell Institute)). N2B27 medium comprised a 1:1 mix of DMEM/F12 (21331–020, Thermo Fisher Scientific) and Neurobasal A (10888–022, Thermo Fisher Scientific) supplemented with 1% v/v B27 (10889–038, Thermo Fisher Scientific), 0.5% v/v N2 (made in house), 100 μM βmercaptoethanol (31350–010, Thermo Fisher Scientific), penicillin–streptomycin (15140122, Thermo Fisher Scientific) and GlutaMAX (35050–061, Thermo Fisher Scientific). N2 supplement contained DMEM F12 medium (21331–020, Thermo Fisher Scientific), 2.5 mg ml−1 insulin (I9287, Sigma-Aldrich), 10 mg ml−1 apotransferrin (T1147, Sigma-Aldrich), 0.75% bovine albumin fraction V (15260037, Thermo Fisher Scientific), 20 μg ml−1 progesterone (p8783, Sigma-Aldrich), 1.6 mg ml−1 putrescine dihydrochloride (P5780, Sigma-Aldrich) and 6 μg ml−1 sodium selenite (S5261, Sigma-Aldrich). Where indicated differentiation was triggered by removal of 2i.
EPSCs were cultured on mitotically inactivated CF1 mouse embryonic fibroblasts (MEFs), in LCDM-KSR/N2B27 medium. KSR/N2B27 medium was prepared from: DMEM/F12 (Thermo Fisher Scientific, 21331–020), Neurobasal-A (Thermo Fisher Scientific, 10888–022), N2 supplement (Thermo Fisher Scientific, 17502–048), B27 supplement (Thermo Fisher Scientific, 10889–038), 1% GlutaMAX (Thermo Fisher Scientific, 35050–061), 1% nonessential amino acids (Thermo Fisher Scientific, 11140–050), 0.1 mM b-mercaptoethanol (Thermo Fisher Scientific, 31350–010), penicillin-streptomycin (Thermo FisherScientific, 15140–122) and 5% knockout serum replacement (KSR, Thermo Fisher Scientific, A3181502). LCDM supplementation was added as indicated at the following concentrations: 10 ng ml−1 recombinant human LIF (L, 10 ng ml−1; Peprotech, 300–05), CHIR99021 (C, 3 mM; Stem Cell Institute, Cambridge, UK), (S)-(+)-Dimethindenemaleate (D, 2 mM; Tocris, 1425) and Minocycline hydrochloride (M, 2 mM; Santa Cruz Biotechnology, sc-203339).
TSCs were were cultured on mitotically inactivated CF1 mouse embryonic fibroblasts (MEFs) in TSF4H medium with RPMI 1640 (Sigma, M3817) containing 20% FBS, 2 mM L-glutamine, 0.1 m-M2-ME, 1 mM sodium pyruvate, and 1% penicillin-streptomycin, plus FGF4 (25 ng/mL; R&D Systems, 5846-F4) and heparin (1 μg ml−1; Sigma, H3149).
Cell Lines
Experiments were performed using mouse Pdgfra ESCs or EPSCs (Hamilton et al., 2003), CAG:GFP ESCs or EPSCs (Rhee et al., 2006) ROSA-mTmG ESCs or EPSCs (Muzumdar et al., 2007) (all derived in M.Zernicka-Goetz’s lab); wild-type TSCs (derived in M.Zernicka-Goetz’s lab) and EGFP TSCs. EGFP TSCs were a gift from Janet Rossant (Hospital for Sick Children, University of Toronto).
METHOD DETAILS
Preparing and Plating Cell Suspensions for ‘‘AggreWell’’ Aggregation Experiments
AggreWell 400 format plates were prepared following the manufacturer’s protocol. Briefly, wells were rinsed with the rinsing solution (Stem Cell Technologies), centrifuged for 5 min at 2000g and incubated at room temperature in the tissue culture hood for 20 min. The wells were then washed with 2 ml of 1X PBS. After PBS removal, 500 μl of filtered EP-FBS medium was added to each well and the plate was centrifuged for 5 min at 2000g and then placed at 37°C and 5% CO2 until ready to use.
Blastocyst-like Structure Generation on ‘‘AggreWells’’
At the outset, ESC or EPSC colonies were dissociated to single cells by incubation with 0.05% trypsin-EDTA at 37°C for 4 min. Cells were pelleted by centrifugation for 4 min at 1000 rpm and EPSCs (for EPS-blastoid generation) suspended in LCDM-FBS medium comprising: DMEM/F12 (Thermo Fisher Scientific, 11330–032), Neurobasal (Thermo Fisher Scientific, 10888–022), N2 supplement (Thermo Fisher Scientific, 17502–048), B27 supplement (Thermo Fisher Scientific, 12587–010), 1% GlutaMAX (Thermo Fisher Scientific, 35050–061), 1% nonessential amino acids (Thermo Fisher Scientific, 11140–050), 0.1 mM b-mercaptoethanol (Thermo FisherScientific, 31350–010), penicillin-streptomycin (Thermo Fisher Scientific, 15140–122) and 5% Embryonic Stem Cell Tested Fetal Bovine Serum (FBS, Gibco, 10270–106). LCDM supplements were added at the following concentrations: 10 ng ml−1 recombinant human LIF (L, 10ng ml−1; Peprotech, 300–05), CHIR99021 (C, 3 mM; Stem Cell Institute, Cambridge, UK), (S)-(+)-Dimethindenemaleate (D, 2 mM; Tocris, 1425) and Minocycline hydrochloride (M, 2 mM; Santa Cruz Biotechnology, sc-203339). For EPSCs, the cell suspension was pre-incubated at 37°C in an atmosphere of 5% CO2 on gelatinized tissue-culture-grade plates for 30 min to remove inactive MEFs. ESCs (for ES-blastoid generation) were suspended in FC-Lif medium comprising: Dulbecco’s modified Eagle’s medium (DMEM) with 15% FBS, 2 mM L-glutamine, 0.1 mM 2-mercaptoethanol (2-ME), 0.1-mM nonessential amino acids, 1 mM sodiumpyruvate, and 1% penicillin-streptomycin, and leukemia inhibitory factor (0.1 mM, LIF).
After incubation, cells were counted using a haemocytometer and a total of 4800 ESCs or EPSCs added per well. Cell suspensions were added dropwise to the Aggrewells. The AggreWell plate was centrifuged for 3 min at 100g, the outer wells were filled with PBS to humidify the local atmosphere to minimize evaporation from wells containing cells, and the plate placed at 37°C, 5% CO2 or 20% O2 as appropriate. After 20–24h, TSC colonies were dissociated to single cells, centrifuged and pre-plated for removal of inactive MEFs as described above. Cells were counted using a haemocytometer and a total of 9600 TSCs added per well. The ESC media (LCDM-FBS for EPSCs; FC-Lif for ESCs) was largely removed and TSCs added dropwise in TX media prepared as follows (Final media mix 1:5 (LCDM-FBS:TX)): DMEM/F12 without HEPES (Thermo Fisher Scientific, 21041–025), 64 mg l−1 l-ascorbic acid-2-phosphate magnesium (Sigma-Aldrich, A8960), 14 mg l−1 sodium selenite (Sigma-Aldrich, S5261), 19.4 mg l−1 insulin (Sigma-Aldrich, I9278), 543 mg/l NaHCO3 (Sigma-Aldrich, S5761), 10.7 mg l−1 holo-transferrin (Sigma-Aldrich, T4132), 25 ng ml−1 human recombinant FGF4 ( R&D systems, 5846-F4), 2 ng ml−1 human recombinant TGF-ß1 (PeproTech, 100–21), 1 mg ml−1 heparin (Sigma-Aldrich, H3149), 2 mM L-glutamine, 1% penicillin, and streptomycin (all Sigma-Aldrich), Y27632 (20 μM; Stemcell technologies, 72304), CHIR99021 (3 μM; Stem Cell Institute, Cambridge, UK), 8Br-cAMP (1 mM; Biolog Life Science Institute, B-007), IL-11 (30 ng ml−1; PeproTech, 200–11). Upon TSC seeding, the plate was placed at 37°C, 5% CO2 and 5% O2.
ETX Embryo Generation
ETX embryos were generated as described previously (Sozen et al., 2018). Briefly, A total of 7200 ES cells, 19200-TS cells and 5400 XEN cells were added per well of Aggrewell 400 format (1200 microwells per well). The ES, TS and XEN cell suspensions were mixed and repelleted. The cell mixture was resuspended in ETX medium (C-ETX medium) consisting of 70% MEF-conditioned DMEM with 12.5% FBS, 2 mM GlutaMAX, 0.1 mM 2-mercaptoethanol (2-ME), 0.1-mM nonessential amino acids, 1 mM sodium pyruvate, 0.02 M HEPES (Thermo Fisher Scientific, 15630056), plus ROCK inhibitor (Y27632, 5 nM; StemCell Technologies, 72304), and added dropwise to the well. The AggreWell plate was centrifuged for 3 min at 100 g and the outer wells were filled with PBS to minimize evaporation from wells with cells, and the plates were placed at 37°C in an atmosphere containing 5% CO2. On the following day (day 1), 1 ml of medium was slowly removed from each well and replaced with 1 ml of fresh medium without ROCK inhibitor. This step was repeated to fully remove the ROCK inhibitor. On day 2, 1 ml of C-ETX medium was replaced with 1 ml of fresh medium. On day 3, the media was changed to IVC1 (Cell Guidance Systems) by removing 1.2 ml of media and replacing it with 1.5 ml of IVC1 medium. On day 4, IVC1 was replaced with IVC2 by removing 1.2 ml of media and replacing it with 1.5 ml of IVC2 (Cell Guidance Systems).
IVC Culture of Blastocysts and Blastocyst-like Structures
IVC on 2D
2D IVC culture of natural and synthetic blastocysts was carried out on ibidi-u plates (for time-lapse movies) or agarose microwells in IVC1 and IVC2 media (Cell Guidance Systems) as previously (Bedzhov et al., 2014). The agarose microwells were prepared according to the previous study (Bao et al., 2017). Briefly, a silicon master with circular patterns of 200 microns in lateral dimension and 100 microns in height was fabricated by photolithography and inductively coupled plasma etching technique, then treated with 1H,1H,2H,2H Perfluordecyltriethoxysilan. 1.5% ultrapure agarose (Thermo Fisher Scientific 11560166) solution after filter-sterilized was directly added on the silicon master and cooled down to the room temperature to form the hydrogel with microwells. Natural blastocysts were recovered at E4.5 by uterine flushing, their mural trophectoderm dissected away before transferring into IVC.
IVC on Matrigel
Briefly, blastocyst-like structures were seeded onto Matrigel (BD, 356234) coated ibidi-u plates and cultured in CMRL 1066 (Thermo Fisher Scientific, 11530037) containing 10% FBS (Millipore, ES-009B), 1 mM sodium pyruvate (Invitrogen, 11360070), 100 units ml−1 penicillin-streptomycin (Thermo Fisher Scientific, 15140–122), 2 mM L-Glutamine (Invitrogen, 25030081), N2 (Thermo Fisher Scientific, 17502048) and B27 supplement (Invitrogen, 17504044) (IVC1) at 37°C in a humidified atmosphere of 5% CO2. Second day FBS concentration increased to 20% (IVC2).
Whole Mount Immunofluorescence Staining
Natural embryos and stem cell-derived structures were fixed in 4% paraformaldehyde (Electron Microscopy Sciences, 15710) for 20 min at room temperature, washed twice in PBT [phosphate-buffered saline (PBS) plus 0.05% Tween-20] and permeabilized for 30 min at room temperature in 0.3% Triton-X-100, 0.1% glycine. Primary antibody incubation was performed overnight at 4°C in blocking buffer [PBS containing 10% fetal bovine serum (FBS), 1% Tween-20]. The following day, embryos were washed twice in PBT, then incubated overnight with secondary antibody (1:500) in blocking buffer at 4°C. On day 3, embryos were washed twice in PBT and incubated for 1 h at room temperature in 4′,6-diamidino-2-phenylindole (DAPI) plus PBT (5mg ml−1). Embryos were transferred to PBT drops in oil-filled optical plates before confocal imaging. The antibodies used are given in Key Resources Table.
KEY RESOURCES TABLE
| REAGENT or RESOURCE | SOURCE | IDENTIFIER |
|---|---|---|
| Antibodies | ||
|
| ||
| Goat anti- AP-2 gamma Polyclonal | R&D systems | Cat# AF5059; RRID:AB_2255891 |
| Mouse Anti-Cdx2 Monoclonal | BioGenex | Cat# MU392-UC; RRID:AB_2335627 |
| Rabbit Anti-Collagen IV Polyclonal | Abcam | Cat# ab19808; RRID:AB_445160 |
| Rabbit Anti-COX2/Ptgs2 Polyclonal | Abcam | Cat# ab15191; RRID:AB_2085144 |
| Mouse Anti-Cytokeratin 18/KRT18 Monoclonal | Abcam | Cat# ab668; RRID:AB_305647 |
| Mouse Anti- Cytokeratin 8/KRT8 Monoclonal | Novus Biologicals | Cat# NBP2–44941 |
| Rat Anti-E-cadherin Monoclonal | Thermo Fisher Scientific | Cat# 13–1900; RRID:AB_2533005 |
| Rabbit Anti- FoxA2/HNF3 Monoclonal | Cell Signaling Technology | Cat# 8186; RRID:AB_10891055 |
| Goat Anti-GATA-4 Polyclonal | Santa Cruz | Cat# sc-1237; RRID:AB_2108747 |
| Goat Anti-GATA-6 Polyclonal | R&D systems | Cat# AF1700; RRID:AB_2108901 |
| Rat Anti-GFP Monoclonal | Nacalai Tesque | Cat# 04404–84; RRID:AB_10013361 |
| Rabbit Anti Ki-67 Monoclonal | Cell Signaling Technology | Cat# 12202; RRID:AB_2620142 |
| Rabbit Anti-Laminin Polyclonal | Sigma-Aldrich | Cat# L9393; RRID:AB_477163 |
| Rabbit Anti-Nanog Polyclonal | Abcam | Cat# ab80892; RRID:AB_2150114 |
| Mouse Anti-Oct-3/4 Monoclonal | Santa Cruz | Cat# sc-5279, RRID:AB_628051 |
| Mouse Anti-PKC zeta Monoclonal | Santa Cruz | Cat# sc-17781; RRID:AB_628148 |
| Rat Anti-Podocalyxin Monoclonal | R&D Systems | Cat# MAB1556; RRID:AB_2166010 |
| Mouse Anti- Proliferin Monoclonal | Santa Cruz | Cat# sc-271891; RRID:AB_10710396 |
| Goat Anti-Human Sox17 Polyclonal | R&D Systems | Cat# AF1924; RRID:AB_355060 |
| Rabbit Anti-Tbr2/Eomes Polyclonal | Abcam | Cat# ab23345; RRID:AB_778267 |
| Mouse Anti-ZO-1/ Tjp1 Monoclonal | Thermo Fisher Scientific | Cat# 33–9100; RRID:AB_2533147 |
| Donkey Anti-Goat IgG (H+L) Alexa Fluor 647 | Thermo Fisher Scientific | Cat# A-21447; RRID:AB_2535864 |
| Donkey Anti-Mouse IgG (H+L) Alexa Fluor 568 | Thermo Fisher Scientific | Cat# A10037; RRID:AB_2534013 |
| Donkey Anti-Rabbit IgG (H+L) Alexa Fluor 647 | Thermo Fisher Scientific | Cat# A-31573; RRID:AB_2536183 |
| Donkey Anti-Rat IgG (H+L) Alexa Fluor 488 | Thermo Fisher Scientific | Cat# A-21208; RRID:AB_2535794 |
| Goat Anti-Mouse IgG (H+L) Biotinylated | Vector Laboratories | Cat# BA-9200; RRID:AB_2336171 |
| Goat Anti-Rabbit IgG Biotinylated | Vector Laboratories | Cat# BA-1000; RRID:AB_2313606 |
|
| ||
| Chemicals, Peptides, and Recombinant Proteins | ||
|
| ||
| 2-Mercaptoethanol (50 mM) | Thermo Fisher Scientific | Cat# 31350–010 |
| Apo-transferrin human | Sigma-Aldrich | Cat# T1147 |
| L-Ascorbic acid | Sigma-Aldrich | Cat# A4403 |
| B-27 supplement (50X), minus antioxidants | Thermo Fisher Scientific | Cat# 10889–038 |
| B-27™ Supplement (50X), minus vitamin A | Thermo Fisher Scientific | Cat# 12587–010 |
| Bovine albumin fraction V | Thermo Fisher Scientific | Cat# 15260–037 |
| 8-Br-cAMP | Biolog Life Science Institute | Cat# B 007 |
| CHIR99021 - GSK3 inhibitor, WNT activator | Stem Cell Institute, Cambridge, UK | N/A |
| CMRL Medium | Thermo Fisher Scientific | Cat# 11530–037 |
| Diaminobenzidine (DAB) | Thermo Fisher Scientific | Cat# TL-015-HD |
| (S)-(+)-Dimethindene Maleate | Tocris Bioscience | Cat# 1425 |
| DMEM/F-12, HEPES | Thermo Fisher Scientific | Cat# 1330–032 |
| DMEM/F-12, no glutamine | Thermo Fisher Scientific | Cat# 21331–020 |
| DMEM/F-12, no phenol red | Thermo Fisher Scientific | Cat# 21041–025 |
| Fetal Bovine Serum | Thermo Fisher Scientific | Cat# 31350–010 |
| FGF-4 Protein, Recombinant Mouse | R&D Systems | Cat# 5846-F4 |
| GlutaMAX supplement | Thermo Fisher Scientific | Cat# 35050–061 |
| Heparin | Sigma-Aldrich | Cat# H3149 |
| HEPES (1M) | Thermo Fisher Scientific | Cat# 15630056 |
| holo-Transferrin | Sigma-Aldrich | Cat# T4132 |
| IL-11 Recombinant Human | PeproTech | Cat# 200–11 |
| Insulin Solution Human | Sigma-Aldrich | Cat# I9278 |
| IVC1 medium | Cell Guidance Systems | Cat M11–25 |
| IVC2 medium | Cell Guidance Systems | Cat M12–25 |
| KnockOut Serum Replacement | Thermo Fisher Scientific | Cat# A31815–02 |
| LIF (Leukemia inhibitory factor) Recombinant Human | PeproTech | Cat# 300–05 |
| LIF Recombinant Mouse | Stem Cell Institute, Cambridge, UK | N/A |
| Matrigel® Basement Membrane Matrix | Corning | Cat# 356234 |
| Hematoxylin Solution (Mayer’s, Modified) | Abcam | Cat# ab220365 |
| MEM Non-Essential Amino Acids | Sigma-Aldrich | Cat# 11140–050 |
| Minocycline, Hydrochloride | Santa Cruz | Cat# sc-203339 |
| N-2 supplement | Made In-house | https://experiments.springernature.com/articles/10.1038/s41596-018-0005-x |
| N-2 Supplement (100X) | Thermo Fisher Scientific | Cat# 17502–048 |
| Neurobasal-A medium | Thermo Fisher Scientific | Cat# 10888–022 |
| Paraformaldehyde | Electron Microscopy Sciences | Cat# 15710 |
| PD0325901 - MEK/ERK pathway inhibitor | Stem Cell Institute, Cambridge, UK | N/A |
| Penicillin-Streptomycin | Thermo Fisher Scientific | Cat# 15140–122 |
| Progesterone | Sigma-Aldrich | Cat# P8783 |
| Putrescine dihydrochloride | Sigma-Aldrich | Cat# P5780 |
| RPMI-1640 Medium | Sigma-Aldrich | Cat# M3817 |
| Sodium Pyruvate | Thermo Fisher Scientific | Cat# 11360–070 |
| Sodium selenite | Sigma-Aldrich | Cat# S5261 |
| Streptavidin Peroxidase Conjugated | Rockland Immunochemicals | Cat# S000–03 |
| TGF-ß1, Recombinant Human | PeproTech | Cat# 100–21 |
| Trypsin-EDTA | Thermo Fisher Scientific | Cat# 25300–054 |
| Y-27632, RHO/ROCK pathway inhibitor | Stemcell Technologies | Cat# 72304 |
|
| ||
| Critical Commercial Assays | ||
|
| ||
| Qubit HS dsDNA assay kit | Thermo Fisher Scientific | Cat# Q32854 |
| Agilent High Sensitivity DNA Kit | Agilent | Cat# 5067–4626 |
| Agilent RNA 6000 Pico Kit | Agilent | Cat# 5067–1513 |
| NextSeq 500/550 High Output Kit v2.5 (75 Cycles) | Illumina | Cat# 20024906 |
|
| ||
| Deposited Data | ||
|
| ||
| Sc-RNA sequencing data | In this study | GEO: GSE134240 |
| Sc-RNA sequencing data | Nowotschin et al., 2019 [https://doi.org/10.1038/s41586-019-1127-1] | GEO: GSE123046 |
|
| ||
| Experimental Models: Cell Lines | ||
|
| ||
| CF1 Mouse Embryonic Fibroblasts (MEFs) | Stem Cell Institute, Cambridge, UK | N/A |
| Pdgfra:eGFP Mouse Embryonic Stem Cells | This Paper | N/A |
| ROSA mT/mG Mouse Embryonic Stem Cells | This Paper | N/A |
| CAG-GFP Mouse Embryonic Stem Cells | This Paper | N/A |
| TS-eGFP Mouse Trophoblast Stem Cells | Tanaka et al., 1998 | [https://doi.org/10.1126/science.282.5396.2072] |
| Mouse Trophoblast Stem Cells | This Paper | N/A |
| Extra-embryonic-endoderm (XEN) Cells | Sozen et al., 2018 | [https://doi.org/10.1038/s41556-018-0147-7] |
|
| ||
| Experimental Models: Organisms/Strains | ||
|
| ||
| Mouse: C57Bl6/J xCBA/J | Charles River | Strain Code #027 |
| Mouse: Pdgfratm11(EGFP)Sor | Hamilton et al., 2003 | [https://doi.org/10.1128/mcb.23.11.4013-4025.2003] |
| Mouse: Tg(CAG-GFP*)1Hadj/J | Rhee et al., 2006 | [https://doi.org/10.1002/dvg.20203] |
| Mouse: ROSA mT/mG: Gt(ROSA) 26Sortm4(ACTB-tdTomato,-EGFP)Luo | Muzumdar et al., 2007 | [https://doi.org/10.1002/dvg.20335] |
|
| ||
| Oligonucleotides | ||
|
| ||
| Indrop v3 2×384 barcode plates | Veres et al., 2019 | [https://doi.org/10.1038/s41586-019-1168-5] |
| Indrop final library PCR primers | This paper | Table S1 |
| Indrop reverse transcription primer: AATGATACGGCGACCACCGAGATCTACACNNNNNNNN | Zilionis et al., 2017 | [https://doi.org/10.1038/nprot.2016.154] |
|
| ||
| Software and Algorithms | ||
|
| ||
| Adobe Illustrator CC 2018 | Adobe | N/A |
| Adobe Photoshop CC 2018 | Adobe | N/A |
| ImageJ, Fiji | NIH | Open source image processing software Schindelin et al., 2012 |
| Prism, v8.1.0 | GraphPad Software Inc | https://www.graphpad.com |
| Indrops processing pipeline | Klein et al., 2015 | https://github.com/indrops/indrops |
| Seurat v3 | Stuart et al., 2019 | [https://doi.org/10.1016/j.cell.2019.05.031] |
| Scrublet | Wolock et al., 2019 | [https://doi.org/10.1016/j.cels.2018.11.005] |
| Harmony | Korsunsky et al., 2018 | [https://doi.org/10.1101/461954] |
| STRINGv10 | Szklarczyk et al., 2015 | [https://doi.org/10.1093/nar/gku1003] |
|
| ||
| Other | ||
|
| ||
| AggreWell 400 Microwell Culture Plates | Stemcell Technologies | Cat# 34415 |
| Anti-Adherence Rinsing Solution | StemCell Technologies | Cat# 07010 |
| μ-Slide 8 well, ibiTreat, chambered slide | Thistle Scientific | Cay# IB-80826 |
| Indrop v3 single-cell barcoding reagents | Zilionis et al., 2017 | [https://doi.org/10.1038/nprot.2016.154] |
Tissue Processing, Paraffin Sectioning, and Immunohistochemistry
All decidual tissue was fixed overnight in 4% paraformaldehyde (Electron Microscopy Sciences, 15710), and transferred through a series of ethanol baths of increasing concentrations before processing. Serial sections of 5 μm were cut for each paraffin-embedded decidua block. Paraffin sections were deparaffinised in fresh xylene, then rehydrated in a series of decreasing ethanol concentrations. Epitope retrieval was done in sodium citrate buffer by holding the specimen in a boiling water bath for 5 mins and subsequent cooling over 25 min to toom temperature in the same buffer. Subsequently, endogenous peroxidase activity was quenched by incubating sections in 3% H2O2 in methanol for 15 min at RT. Following several washes with phosphate-buffered saline (PBS), sections were blocked with Ultra V Block (LabVision) at room temperature for 5 min. Primary antibody incubation was carried out overnight at 4°C. After several rinses in PBS, biotinylated secondary antibodies were applied for 1 h at room temperature. Following several rinses in PBS, the slides were incubated with streptavidin–peroxidase complex for 1h (Rockland Lab). The antibody complex was visualized by incubation with diaminobenzidine (DAB) chromogen (Thermo Fisher Scientific, TL-015-HD) prepared according to the manufacturer’s instructions. Slides were counterstained with Mayer’s hematoxylin (Abcam, ab220365) prior to permanent mounting and then examined by bright-field microscopy. The antibodies used are given in Key Resources Table.
Image Data Acquisition, Processing, and Quantification
Immunohistochemistry images were acquired with NanoZoomer (Hamamatsu). Fluorescence images were acquired with an inverted Leica SP8 confocal microscope (Leica Microsystems), using a Leica Fluotar VISIR 0.95 NA 25x objective. Fluorophores were excited with a 405-nm diode laser (DAPI), a 488-nm argon laser (GFP), a 543-nm HeNe laser (Alexa Fluor-543/555) and a 633-nm HeNe laser (Alexa Fluor-633/647). Images were acquired with 0.5–1.2 μm z-separation. Raw data were processed using open-source image analysis software ‘‘Fiji’’ or ‘‘Imaris’’ software (Bitplane) and assembled in Photoshop CC 2017 (Adobe). Digital quantifications and immunofluorescence signal intensity graphs were obtained using Fiji software.
Time-Lapse Imaging
Confocal time-lapse imaging during embryoid culture was performed using a spinning-disc microscope (3i) with a Zeiss EC Plan-NEOFLUAR 20x/0.5 objective in a humidified chamber with 37 °C, 5% CO2. The structures were imaged every 45 min in 100 μm image stacks of 4 μm z-planes. Images were processed using Slidebook 5.0 (3i).
Sample Collection for Single Cell RNA Sequencing (scRNA-Seq)
ES- and EPS-blastoids generated as described above. Blastoids (n=100 per group) and E4.5 natural blastocysts (n=20) were exposed to Tryple Express Select ×10 (ThermoFisher A1217701) for 15 mins in 37°C, and subsequently dissected with glass capillaries of different diameters. For ESC-derived blastoid group; total of 1,154 cells including 752 ESCs, 350 TSCs 52 PE-like cells extracted. For EPSC-derived blastoid group; total of 2,350 cells including 1,087 EPSC, 1,140 TSCs 123 PE-like cells extracted. For E4.5 blastocyst a total of 138 cells were extracted.
Droplet Microfluidics scRNA-Seq and Library Preparation
Cells were diluted to a concentration of 120,000 cells/ml in 1×PBS 15% (v/v) optiprep and processed according to the inDrop protocol (Zilionis et al., 2017) with v3 barcoding design (Briggs et al., 2018). Briefly, cells were co-encapsulated with barcode beads, lysis and RT Buffer and incubated for two hours at 50°C. After de-emulsification, the libraries were cleaned up and amplified using IVT. The RNA was then fragmented, reverse transcribed and purified. The cDNA of each library was then amplified and barcoded using limited cycle PCR. The barcode diversity for these experiments was 147,456, and polyacrylamide barcoded bead batches were quality controlled using FISH on the extended primers and species mixing experiments were performed to define cross-contamination levels and capture efficiency for each batch (human HEK293 and mouse 3T3 fibroblasts). Each of the collection fractions aimed to contain 2,949 cells, resulting in a theoretical barcode collision rate of 1%. Limited-cycle PCR was employed to amplify and barcode the libraries and the quality of the latter was inspected using a BioAnalyzer HS kit. Samples were pooled at equi-molar ratios using both the BioAnalyzer HS and Qubit HS metrics for size distribution and DNA concentration. The final library was purified using AmpureXP beads (1.5× volumetric ratio) and final molarity was addressed using a BioAnalyzer HS kit and a Kapa NGS library quantification kit. The oligonucleotide sequences used to barcode the final library were can be found in Table S1.
Library Sequencing, Data Pre-processing, RNA-Sequencing, and Mapping of Reads
The libraries were sequenced using a 75 bp Illumina NextSeq 400M high output kit (parameters of the sequencing run can be found in Table S2). In addition, 5% PhiX were used as a spike-in control. Illumina’s bcl2fastq script was used to generate the fastq files, which were subsequently quality controlled using FastQC (Andrews, 2010). The data was further filtered, quantified (ran with the option–min-reads 1000 to discard sequencing background from the downstream analysis), and sorted using the inDrop analysis pipeline (parameters of the yaml can be found in Table S2).
Quality Assessment and Pre-processing of scRNA-Seq Data
The count matrices were used as an input for the Scrublet package (Wolock et al., 2019) to identify cell doublets. Samples with low expected doublet rates (<5%) were filtered for predicted doublets using a threshold defined as the local minima in the bimodal distribution based on the classifier scores as recommended. The filtered matrices were split into three files: a barcodes.tsv, genes.tsv and matrix.mtx file containing the barcode names, gene names, and the count values for each cell in each single-cell dataset respectively. The datasets were then loaded into the Seurat (Stuart et al., 2019) tool using the ‘‘Read10x’’ function. Barcode inflection points to discriminate cell signal from background were further used with the ‘‘SubsetByBarcodeInflections’’ function. Single-cell gene expression counts from different batches where then merged using the ‘‘merge’’ function. The datasets were quality controlled by plotting the distributions for the proportion of mitochondrial genes, number of genes detected and number of UMIs detected for each single-cell. The cells with high (> 12%) and low mitochondrial reads (< 3%) were discarded as they were outliers to the cell distributions and likely contain dead cells or nuclei stripped from their cytoplasmic compartment respectively. The cells with high (> 12%) and low mitochondrial reads (< 3%) were discarded as they were outliers to the the cell distributions and likely contain dead cells or nuclei stripped from their cytoplasmic compartment respectively. The outlier cells containing high number of UMIs and detected genes were discarded (number of genes > 2000 and number of UMIs > 4000) as they could potentially be embedded cell doublets (Wolock et al., 2019). A lower threshold for the number of genes was set to 500 genes, but no cells were found to match this criterion because of pre-filtering during quantification using the inDrop data pre-processing pipeline. Cell cycle scores were then assigned to each single-cell using the ‘‘CellCycleScoring’’ function from the Seurat package. The latter was then used and regressed out along with mitochondrial genes as instructed in the Seurat package. The data was log-normalized using the ‘‘NormalizeData’’ function.
Batch-Effect Correction and UMAP Dimensional Reduction
Dimensional reduction of the normalized matrices was achieved using the ‘‘RunPCA’’ command. Small technical batch-effects between different batches of scRNA-seq datasets were observed during downstream dimensional reductions, the latter were corrected using the Harmony software (Korsunsky et al., 2018). Scoring of the Principal Components was achieved using the ‘‘JackStrawPlot’’ function which returned the 20 first Principal Components as significant. UMAP dimensional reduction plotting and cluster identification was then performed using the commands found in Table S3.
ScRNA-Seq Data Integration for Primitive and Definitive Endoderm Analysis
scRNA-seq datasets from Nowotschin et al. for E3.5, E4.5 and E7.5 stages were downloaded from Gene Expression Omnibus (GEO accession GSE123046). The dataset was integrated with the synthetic embryo datasets by merging the Seurat objects, scaling the genes by regressing out cell-cycle genes and proportion of mitochondrial reads and batch-corrected using Harmony (RunHarmony(‘‘assay’’,plot_convergence = TRUE, theta=0.8, tau = 300) to account for the variability introduced by differing library preparation methods (Indrop for our dataset and 10x Genomics for Nowotschin et al. dataset). The Epi-L and TE-L compartments from our synthetic dataset were then excluded by subsetting the data using the ‘CellSelector’ function in Seurat v3. The proportion of DE and PE cells was then computed using the ‘WhichCells’ function in Seurat v3 according to PE marker expression levels (Gata6 > 0.5 and Sox7> 0.5 and Rhox5 > 0.5) and DE cells on DE markers (Nnat>0.5 and Apela> 0.5 and Cer1 > 0.5) and dividing by the total amount of cells in the subsetted dataset.
Differentially Expressed Genes (DEGs) and Gene Ontology (GO) Analysis
Data Presented in Figures 4H and 4J
Differentially expressed genes were identified using the ‘‘FindMarkers’’ function with a Wilcoxon rank sum test on either the identified clusters or selected cells using the ‘‘CellSelector’’ function. Differentially expressed genes were then plotted on a Volcano plot using the EnhancedVolcano package (Blighe, 2018). For the TSC polarization analysis, the ‘‘CellSelector’’ tool was used to select polar cells on a ‘‘FeatureScatter’’ of Cdx2 vs. Gata2. For mural cells, cells were selected if they had a log2 normalized expression higher than 3 for Gata2. For polar cells, Cdx2 log2 normalized expression higher than 2 was used as a threshold for selection. For the Gata6 co-expression analysis, cells from the PE clusters with detectable expression (gene expression > 1) were isolated and co-expression (any feature that also had a gene expression > 1) levels were measured by subsetting the data using the ‘‘WhichCells’’ function and performing ‘‘AverageExpression’’ on the subset. The proportion of cells matching the criterions were then divided between conditions to look at fold enrichments between both conditions. For fold differences (in % of cells) analysis on PE and PaE markers, the percentages of cells where the gene was detected in each of the two samples were used as input for computing the fold changes. Both percentages and log fold-change of the average expression were obtained as an output of the ‘‘FindMarkers’’ on the PE subset between the two groups.
Data Presented in Figures S2D–S2F
For lineage-specific pairwise comparison of EPS-blastoid to the natural embryo at E4.5, the datasets were merged in Seurat v3 and the data was subsetted, scaled and normalized as previously mentioned. Cells from each lineage were found to cluster in three different clusters, with the expected lineage markers allowing for cell-type identification. Each lineage for each sample was selected using ‘CellSelector’ on the UMAP dimensional reduction plot. To match the natural embryo’s sample size, the synthetic embryo lineages were downsampled using the ‘sample’ function to the following numbers, matching the number of cells found for the natural embryo sample: PE-L = 68 cells, Epi-L = 32 cells, TE-L = 38 cells. A phylogenetic tree was built using the ‘BuildClusterTree’ function with default settings to create a distance matrix of average gene expression for each downsampled lineage for each sample. DEGs were identified using a Wilcoxon rank sum test, and further loaded into the STRING v10 (Szklarczyk et al., 2015) protein-protein interaction analysis tool after removal of mitochondrial and ribosomal genes, which were found to be differentially expressed due to the divergences in cell harvesting protocols, thus likely constituting technical noise.
QUANTIFICATION AND STATISTICAL ANALYSIS
Criteria for Selecting Blastocyst-like Structures
Cystic structures having a single layered TSC-derived epithelium and containing an acentric EPSC or ESC-derived inner compartment were considered as blastocyst-like structures and included in further analyses. Structures did not fulfil these criteria were excluded from downstream analyses.
Image Data Acquisition, Processing, and Quantification
Immunohistochemistry images were acquired with NanoZoomer (Hamamatsu). Fluorescence images were acquired with an inverted Leica SP8 confocal microscope (Leica Microsystems), using a Leica Fluotar VISIR 0.95 NA 25× objective. Fluorophores were excited with a 405-nm diode laser (DAPI), a 488-nm argon laser (GFP), a 543-nm HeNe laser (Alexa Fluor-543/555) and a 633-nm HeNe laser (Alexa Fluor-633/647). Images were acquired with 0.5–1.2 μm z-separation. Raw data were processed using open-source image analysis software ‘‘Fiji’’ and assembled in Photoshop CC 2017 (Adobe). Digital quantifications and immunofluorescence signal intensity graphs were obtained using Fiji software.
Statistics and Reproducibility
Statistical tests were performed on GraphPad Prism8.0 software. Where appropriate, Student’s t-tests (two groups) or analysis of variance (multiple groups) were performed with Welch’s correction if variance between groups was not equal. Error bars represent s.e.m. as specified. Figure legends indicate the number of independent experiments performed in each analysis. Unless otherwise noted, each experiment was performed at least two times.
DATA AND CODE AVAILABILITY
The accession number for the sc-RNA sequencing data is available at Gene Expression Omnibus (GEO) dataset under accession number GSE134240. The accession number for E3.5, E4.5 and E7.5 data assembled from GSE123046 (Nowotschin et al., 2019) (data presented in Figures 2E–2G and S3).
Supplementary Material
Highlights.
Cell fate under extended potential conditions bifurcate to form EPI and PE-like lineages
EPSCs and TSCs self-organize into EPS-blastoids, resembling the late-stage blastocysts
EPS-blastoids undertake pre- to post-implantation transition in vitro
EPS-blastoids initiate implantation in vivo
ACKNOWLEDGMENTS
This work was supported by the European Research Council (669198), the Wellcome Trust (098287/Z/12/Z), Open Philanthropy Project, and the Curci Foundation. J.D. is supported by the BBSRC-DTP. The authors are grateful to Bill Mansfield, Lars Wittler, and Manuela Scholze-Wittler for their help with experiments to transfer embryos to the foster mothers. The authors are also thankful to Neophytos Christodoulou, Can Aztekin, Meng Zhu, and Marta Shahbazi for discussions.
Footnotes
SUPPLEMENTAL INFORMATION
Supplemental Information can be found online at https://doi.org/10.1016/j.devcel.2019.11.014.
DECLARATION OF INTERESTS
The authors declare no competing interests.
REFERENCES
- Anderson KGV, Hamilton WB, Roske FV, Azad A, Knudsen TE, Canham MA, Forrester LM, and Brickman JM (2017). Insulin fine-tunes self-renewal pathways governing naive pluripotency and extra-embryonic endoderm. Nat. Cell Biol 19, 1164–1177. [DOI] [PubMed] [Google Scholar]
- Andrews S (2010). FastQC a quality control to tool for high throughput sequence data
- Aplin JD, and Ruane PT (2017). Embryo-epithelium interactions during implantation at a glance. J. Cell Sci 130, 15–22. [DOI] [PubMed] [Google Scholar]
- Artus J, Piliszek A, and Hadjantonakis AK (2011). The primitive endoderm lineage of the mouse blastocyst: sequential transcription factor activation and regulation of differentiation by Sox17. Dev. Biol 350, 393–404. [DOI] [PMC free article] [PubMed] [Google Scholar]
- Bao M, Xie J, Piruska A, and Huck WTS (2017). 3D microniches reveal the importance of cell size and shape. Nat. Commun 8, 1962. [DOI] [PMC free article] [PubMed] [Google Scholar]
- Beccari L, Moris N, Girgin M, Turner DA, Baillie-Johnson P, Cossy AC, Lutolf MP, Duboule D, and Arias AM (2018). Multi-axial self-organization properties of mouse embryonic stem cells into gastruloids. Nature 562, 272–276. [DOI] [PubMed] [Google Scholar]
- Bedzhov I, Leung CY, Bialecka M, and Zernicka-Goetz M (2014). In vitro culture of mouse blastocysts beyond the implantation stages. Nat. Protoc 9, 2732–2739. [DOI] [PubMed] [Google Scholar]
- Bedzhov I, and Zernicka-Goetz M (2014). Self-organizing properties of mouse pluripotent cells initiate morphogenesis upon implantation. Cell 156, 1032–1044. [DOI] [PMC free article] [PubMed] [Google Scholar]
- Blighe K (2018). Publication-ready volcano plots with enhanced colouring and labeling
- Briggs JA, Weinreb C, Wagner DE, Megason S, Peshkin L, Kirschner MW, and Klein AM (2018). The dynamics of gene expression in vertebrate embryogenesis at single-cell resolution. Science 360, eaar5780. [DOI] [PMC free article] [PubMed] [Google Scholar]
- Capo-Chichi CD, Rula ME, Smedberg JL, Vanderveer L, Parmacek MS, Morrisey EE, Godwin AK, and Xu XX (2005). Perception of differentiation cues by GATA factors in primitive endoderm lineage determination of mouse embryonic stem cells. Dev. Biol 286, 574–586. [DOI] [PubMed] [Google Scholar]
- Carnegie JA, and Cabaca O (1991). The influence of extracellular matrix components on the proliferation and migration of inner cell mass-derived parietal endodermal cells. Biol. Reprod 45, 572–580. [DOI] [PubMed] [Google Scholar]
- Christodoulou N, Kyprianou C, Weberling A, Wang R, Cui G, Peng G, Jing N, and Zernicka-Goetz M (2018). Sequential formation and resolution of multiple rosettes drive embryo remodelling after implantation. Nat. Cell Biol 20, 1278–1289. [DOI] [PubMed] [Google Scholar]
- Eckert JJ, McCallum A, Mears A, Rumsby MG, Cameron IT, and Fleming TP (2004). PKC signalling regulates tight junction membrane assembly in the pre-implantation mouse embryo. Reproduction 127, 653–667. [DOI] [PubMed] [Google Scholar]
- Evans MJ, and Kaufman MH (1981). Establishment in culture of pluripotential cells from mouse embryos. Nature 292, 154–156. [DOI] [PubMed] [Google Scholar]
- Fujikura J, Yamato E, Yonemura S, Hosoda K, Masui S, Nakao K, Miyazaki Ji J, and Niwa H (2002). Differentiation of embryonic stem cells is induced by GATA factors. Genes Dev 16, 784–789. [DOI] [PMC free article] [PubMed] [Google Scholar]
- Gao X, Nowak-Imialek M, Chen X, Chen D, Herrmann D, Ruan D, Chen ACH, Eckersley-Maslin MA, Ahmad S, Lee YL, et al. (2019). Establishment of porcine and human expanded potential stem cells. Nat. Cell Biol 21, 687–699. [DOI] [PMC free article] [PubMed] [Google Scholar]
- Hagan JH (1982). Looking to the future. J. Mo. Dent. Assoc 62, 10–15. [PubMed] [Google Scholar]
- Hamilton TG, Klinghoffer RA, Corrin PD, and Soriano P (2003). Evolutionary divergence of platelet-derived growth factor alpha receptor signaling mechanisms. Mol. Cell. Biol 23, 4013–4025. [DOI] [PMC free article] [PubMed] [Google Scholar]
- Harrison SE, Sozen B, Christodoulou N, Kyprianou C, and Zernicka-Goetz M (2017). Assembly of embryonic and extraembryonic stem cells to mimic embryogenesis in vitro. Science 356, eaal1810. [DOI] [PubMed] [Google Scholar]
- Hermitte S, and Chazaud C (2014). Primitive endoderm differentiation: from specification to epithelium formation. Philos. Trans. R. Soc. Lond. B Biol. Sci 369, 20130537. [DOI] [PMC free article] [PubMed] [Google Scholar]
- Klein AM, Mazutis L, Akartuna I, Tallapragada N, Veres A, Li V, Peshkin L, Weitz DA, and Kirschner MW (2015). Droplet barcoding for single-cell transcriptomics applied to embryonic stem cells. Cell 161, 1187–1201. [DOI] [PMC free article] [PubMed] [Google Scholar]
- Korsunsky I, Fan J, Slowikowski K, Zhang F, Wei K, Baglaenko Y, Brenner M, Loh P-R, and Raychaudhuri S (2018). Fast, sensitive, and accurate integration of single cell data with Harmony. bioRxiv, 461954. [DOI] [PMC free article] [PubMed]
- Kime C, Kiyonari H, Ohtsuka S, Kohbayashi E, Asahi M, Yamanaka S, Takahashi M, and Tomoda K (2019). Induced 2C expression and implantation-competent blastocyst-like cysts from primed pluripotent stem cells. Stem Cell Rep 13, 485–498. [DOI] [PMC free article] [PubMed] [Google Scholar]
- Kubaczka C, Senner C, Araúzo-Bravo MJ, Sharma N, Kuckenberg P, Becker A, Zimmer A, Brüstle O, Peitz M, Hemberger M, et al. (2014). Derivation and maintenance of murine trophoblast stem cells under defined conditions. Stem Cell Rep 2, 232–242. [DOI] [PMC free article] [PubMed] [Google Scholar]
- Kunath T, Arnaud D, Uy GD, Okamoto I, Chureau C, Yamanaka Y, Heard E, Gardner RL, Avner P, and Rossant J (2005). Imprinted X-inactivation in extra-embryonic endoderm cell lines from mouse blastocysts. Development 132, 1649–1661. [DOI] [PubMed] [Google Scholar]
- Latos PA, Sienerth AR, Murray A, Senner CE, Muto M, Ikawa M, Oxley D, Burge S, Cox BJ, and Hemberger M (2015). Elf5-centered transcription factor hub controls trophoblast stem cell self-renewal and differentiation through stoichiometry-sensitive shifts in target gene networks. Genes Dev 29, 2435–2448. [DOI] [PMC free article] [PubMed] [Google Scholar]
- Laurie GW, Leblond CP, and Martin GR (1982). Localization of type IV collagen, laminin, heparan sulfate proteoglycan, and fibronectin to the basal lamina of basement membranes. J. Cell Biol 95, 340–344. [DOI] [PMC free article] [PubMed] [Google Scholar]
- Lehtonen E, Lehto VP, Paasivuo R, and Virtanen I (1983). Parietal and visceral endoderm differ in their expression of intermediate filaments. EMBO J 2, 1023–1028. [DOI] [PMC free article] [PubMed] [Google Scholar]
- Li Y, Sun X, and Dey SK (2015). Entosis allows timely elimination of the luminal epithelial barrier for embryo implantation. Cell Rep 11, 358–365. [DOI] [PMC free article] [PubMed] [Google Scholar]
- Lin TP, Labosky PA, Grabel LB, Kozak CA, Pitman JL, Kleeman J, and MacLeod CL (1994). The Pem homeobox gene is X-linked and exclusively expressed in extraembryonic tissues during early murine development. Dev. Biol 166, 170–179. [DOI] [PubMed] [Google Scholar]
- Meder D, Shevchenko A, Simons K, and Füllekrug J (2005). Gp135/podocalyxin and NHERF-2 participate in the formation of a preapical domain during polarization of MDCK cells. J. Cell Biol 168, 303–313. [DOI] [PMC free article] [PubMed] [Google Scholar]
- Muzumdar MD, Tasic B, Miyamichi K, Li L, and Luo L (2007). A global double-fluorescent Cre reporter mouse. Genesis 45, 593–605. [DOI] [PubMed] [Google Scholar]
- Nakamura T, Yabuta Y, Okamoto I, Aramaki S, Yokobayashi S, Kurimoto K, Sekiguchi K, Nakagawa M, Yamamoto T, and Saitou M (2015). SC3-seq: a method for highly parallel and quantitative measurement of single-cell gene expression. Nucleic Acids Res 43, e60. [DOI] [PMC free article] [PubMed] [Google Scholar]
- Nowotschin S, Setty M, Kuo YY, Liu V, Garg V, Sharma R, Simon CS, Saiz N, Gardner R, Boutet SC, et al. (2019). The emergent landscape of the mouse gut endoderm at single-cell resolution. Nature 569, 361–367. [DOI] [PMC free article] [PubMed] [Google Scholar]
- Rhee JM, Pirity MK, Lackan CS, Long JZ, Kondoh G, Takeda J, and Hadjantonakis AK (2006). In vivo imaging and differential localization of lipid-modified GFP-variant fusions in embryonic stem cells and mice. Genesis 44, 202–218. [DOI] [PMC free article] [PubMed] [Google Scholar]
- Rivron NC, Frias-Aldeguer J, Vrij EJ, Boisset JC, Korving J, Vivié J, Truckenmüller RK, van Oudenaarden A, van Blitterswijk CA, and Geijsen N (2018). Blastocyst-like structures generated solely from stem cells. Nature 557, 106–111. [DOI] [PubMed] [Google Scholar]
- Rossant J, and Tam PP (2009). Blastocyst lineage formation, early embryonic asymmetries and axis patterning in the mouse. Development 136, 701–713. [DOI] [PubMed] [Google Scholar]
- Saiz N, Grabarek JB, Sabherwal N, Papalopulu N, and Plusa B (2013). Atypical protein kinase C couples cell sorting with primitive endoderm maturation in the mouse blastocyst. Development 140, 4311–4322. [DOI] [PMC free article] [PubMed] [Google Scholar]
- Salamat M, Miosge N, and Herken R (1995). Development of Reichert’s membrane in the early mouse embryo. Anat. Embryol. (Berl) 192, 275–281. [DOI] [PubMed] [Google Scholar]
- Schéele S, Falk M, Franzén A, Ellin F, Ferletta M, Lonai P, Andersson B, Timpl R, Forsberg E, and Ekblom P (2005). Laminin alpha1 globular domains 4–5 induce fetal development but are not vital for embryonic basement membrane assembly. Proc. Natl. Acad. Sci. USA 102, 1502–1506. [DOI] [PMC free article] [PubMed] [Google Scholar]
- Schindelin J, Arganda-Carreras I, Frise E, Kaynig V, Longair M, Pietzsch T, Preibisch S, Rueden C, Saalfeld S, Schmid B, et al. (2012). Fiji: an open-source platform for biological-image analysis. Nat. Methods 9, 676–682. [DOI] [PMC free article] [PubMed] [Google Scholar]
- Schrode N, Saiz N, Di Talia S, and Hadjantonakis AK (2014). GATA6 levels modulate primitive endoderm cell fate choice and timing in the mouse blastocyst. Dev. Cell 29, 454–467. [DOI] [PMC free article] [PubMed] [Google Scholar]
- Shahbazi MN, Scialdone A, Skorupska N, Weberling A, Recher G, Zhu M, Jedrusik A, Devito LG, Noli L, Macaulay IC, et al. (2017). Pluripotent state transitions coordinate morphogenesis in mouse and human embryos. Nature 552, 239–243. [DOI] [PMC free article] [PubMed] [Google Scholar]
- Sheth B, Fesenko I, Collins JE, Moran B, Wild AE, Anderson JM, and Fleming TP (1997). Tight junction assembly during mouse blastocyst formation is regulated by late expression of ZO-1 alpha+ isoform. Development 124, 2027–2037. [DOI] [PubMed] [Google Scholar]
- Simmons DG, Fortier AL, and Cross JC (2007). Diverse subtypes and developmental origins of trophoblast giant cells in the mouse placenta. Dev. Biol 304, 567–578. [DOI] [PubMed] [Google Scholar]
- Simon MC, and Keith B (2008). The role of oxygen availability in embryonic development and stem cell function. Nat. Rev. Mol. Cell Biol 9, 285–296. [DOI] [PMC free article] [PubMed] [Google Scholar]
- Sozen B, Amadei G, Cox A, Wang R, Na E, Czukiewska S, Chappell L, Voet T, Michel G, Jing N, et al. (2018). Self-assembly of embryonic and two extra-embryonic stem cell types into gastrulating embryo-like structures. Nat. Cell Biol 20, 979–989. [DOI] [PubMed] [Google Scholar]
- Strickland S, and Mahdavi V (1978). The induction of differentiation in teratocarcinoma stem cells by retinoic acid. Cell 15, 393–403. [DOI] [PubMed] [Google Scholar]
- Stuart T, Butler A, Hoffman P, Hafemeister C, Papalexi E III, Marlon Stoeckius WMM, Smibert P, and Satija R (2019). Comprehensive integration of single cell data. Cell 177, 1888–1902. [DOI] [PMC free article] [PubMed] [Google Scholar]
- Szklarczyk D, Franceschini A, Wyder S, Forslund K, Heller D, Huerta-Cepas J, Simonovic M, Roth A, Santos A, Tsafou KP, et al. (2015). STRING v10: protein-protein interaction networks, integrated over the tree of life. Nucleic Acids Res 43, D447–D452. [DOI] [PMC free article] [PubMed] [Google Scholar]
- Tam PP, and Rossant J (2003). Mouse embryonic chimeras: tools for studying mammalian development. Development 130, 6155–6163. [DOI] [PubMed] [Google Scholar]
- Tamai Y, Ishikawa T, Bösl MR, Mori M, Nozaki M, Baribault H, Oshima RG, and Taketo MM (2000). Cytokeratins 8 and 19 in the mouse placental development. J. Cell Biol 151, 563–572. [DOI] [PMC free article] [PubMed] [Google Scholar]
- Tanaka S, Kunath T, Hadjantonakis AK, Nagy A, and Rossant J (1998). Promotion of trophoblast stem cell proliferation by FGF4. Science 282, 2072–2075. [DOI] [PubMed] [Google Scholar]
- Veres A, Faust AL, Bushnell HL, Engquist EN, Kenty JH, Harb G, Poh YC, Sintov E, Gürtler M, Pagliuca FW, et al. (2019). Charting cellular identity during human in vitro b-cell differentiation. Nature 569, 368–373. [DOI] [PMC free article] [PubMed] [Google Scholar]
- Wale PL, and Gardner DK (2010). Time-lapse analysis of mouse embryo development in oxygen gradients. Reprod. Biomed. Online 21, 402–410. [DOI] [PubMed] [Google Scholar]
- Waltman L, and Eck N.J.v. (2013). A smart local moving algorithm for large-scale modularity-based community detection. Eur. Phys. J. B 86, 471. [Google Scholar]
- Warmflash A, Sorre B, Etoc F, Siggia ED, and Brivanlou AH (2014). A method to recapitulate early embryonic spatial patterning in human embryonic stem cells. Nature Methods 11, 847–854. [DOI] [PMC free article] [PubMed] [Google Scholar]
- Williamson RA, Henry MD, Daniels KJ, Hrstka RF, Lee JC, Sunada Y, Ibraghimov-Beskrovnaya O, and Campbell KP (1997). Dystroglycan is essential for early embryonic development: disruption of Reichert’s membrane in Dag1-null mice. Hum. Mol. Genet 6, 831–841. [DOI] [PubMed] [Google Scholar]
- Wolock SL, Lopez R, and Klein AM (2019). Scrublet: computational identification of cell doublets in single-cell transcriptomic data. Cell Syst 291, 281–291.e9. [DOI] [PMC free article] [PubMed] [Google Scholar]
- Yang J, Ryan DJ, Wang W, Tsang JC, Lan G, Masaki H, Gao X, Antunes L, Yu Y, Zhu Z, et al. (2017a). Establishment of mouse expanded potential stem cells. Nature 550, 393–397. [DOI] [PMC free article] [PubMed] [Google Scholar]
- Yang Y, Liu B, Xu J, Wang J, Wu J, Shi C, Xu Y, Dong J, Wang C, Lai W, et al. (2017b). Derivation of pluripotent stem cells with in vivo embryonic and extraembryonic potency. Cell 169, 243–257.e25. [DOI] [PMC free article] [PubMed] [Google Scholar]
- Ying QL, Wray J, Nichols J, Batlle-Morera L, Doble B, Woodgett J, Cohen P, and Smith A (2008). The ground state of embryonic stem cell self-renewal. Nature 453, 519–523. [DOI] [PMC free article] [PubMed] [Google Scholar]
- Zheng Y, Xue X, Yue S, Sicong W, Esfahani SN, Li Z, Muncie JM, Lakins JN, Weaver VM, Gumucio DL, and Fu J (2019). Controlled modelling of human epiblast and amnion development using stem cells. Nature 573, 421–425. [DOI] [PMC free article] [PubMed] [Google Scholar]
- Zilionis R, Nainys J, Veres A, Savova V, Zemmour D, Klein AM, and Mazutis L (2017). Single-cell barcoding and sequencing using droplet microfluidics. Nat. Protoc 12, 44–73. [DOI] [PubMed] [Google Scholar]
Associated Data
This section collects any data citations, data availability statements, or supplementary materials included in this article.
Supplementary Materials
Data Availability Statement
The accession number for the sc-RNA sequencing data is available at Gene Expression Omnibus (GEO) dataset under accession number GSE134240. The accession number for E3.5, E4.5 and E7.5 data assembled from GSE123046 (Nowotschin et al., 2019) (data presented in Figures 2E–2G and S3).