

Abstract
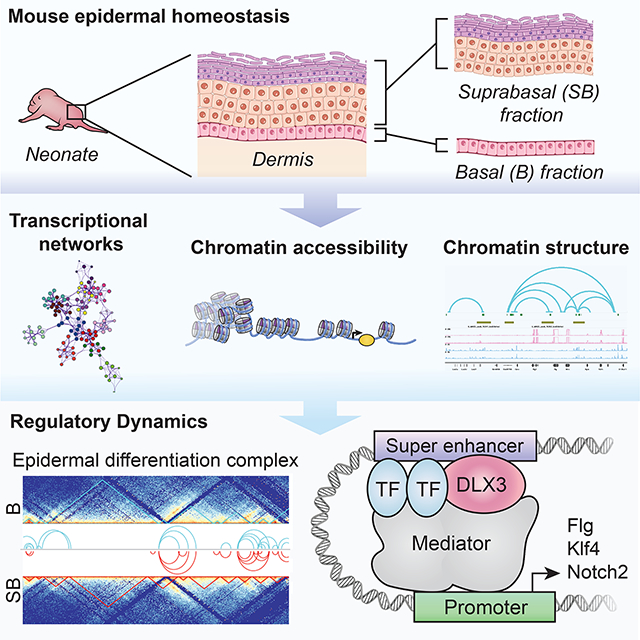
Chromatin landscape and regulatory networks are determinant in lineage specification and differentiation. To define the temporospatial differentiation axis in murine epidermal cells in vivo, we generated datasets profiling expression dynamics (RNA-Seq), chromatin accessibility (ATAC-Seq), architecture (Hi-C), and histone modifications (ChIP-Seq) in the epidermis. We show that many differentially regulated genes are suppressed during the differentiation process, with super-enhancers (SEs) controlling differentiation-specific epigenomic changes. Our data shows the relevance of the Dlx/Klf/Grhl combinatorial regulatory network in maintaining correct temporospatial gene expression during epidermal differentiation. We determined differential open compartments, topologically associating domain (TAD) score and looping in the Basal cell (B) and Suprabasal cell (SB) epidermal fractions, with the evolutionarily conserved Epidermal Differentiation Complex (EDC) region showing distinct SB-specific TAD and loop formation that coincided with SE sites. Overall, our study provides a global genome-wide resource of chromatin dynamics that define unrecognized regulatory networks and the epigenetic control of Dlx3-bound SE elements during epidermal differentiation.
Keywords: chromatin, Hi-C, mouse epidermis, Dlx3, combinatorial Dlx/Grhl/Klf network, super-enhancers, EDC, skin differentiation
Graphical Abstract
INTRODUCTION
Chromatin structure, in combination with major epigenetic remodeling, control gene expression and differentiation (Meshorer et al., 2006). Skin epidermis is an excellent model to study cellular differentiation, a homeostatic process of equilibrium between self-renewal and differentiation. The epidermis, broadly divided into proliferating basal (B) and differentiated suprabasal (SB) fractions, presents distinct morphologic stratification accompanied by temporospatial gene expression (Blanpain and Fuchs, 2009, Koster and Roop, 2007). Characterizing the unique genomic regulatory modules of these fractions will be key to understanding the chromatin dynamics maintaining cutaneous homeostasis.
The interaction of transcription factors (TFs), signaling pathways, and epigenomic regulation are vital for the homeostatic balance. Key TFs involved in epidermal differentiation include Klf4, p63, ZNF750, TFAP2C, GRHL3/GET1, Dlx3, polycomb and trithorax complexes (Hopkin et al., 2012, Hwang et al., 2011, Li et al., 2019, Segre et al., 1999, Sen et al., 2012). Together with crucial signaling pathways including Notch and Wnt (Veltri et al., 2018, Watt et al., 2008), the dynamics of chromatin rearrangement between epidermal transitional states, interplay between p63, chromatin architectural protein Satb1 and ATP-dependent chromatin remodeler Brg1, and Epidermal Differentiation Complex (EDC) locus (Fessing et al., 2011, Klein et al., 2017, Mardaryev et al., 2014, Mary Elizabeth Mathyer, 2018, Poterlowicz et al., 2017) have been shown to be determinants in the stratification of the epidermis.
While the heterogeneity and gene regulation dynamics of proliferating and differentiated cells was focus of various studies in human and mouse (Dube et al., 2021, Kim et al., 2021, Rubin et al., 2017), a complete view of the chromatin structure and epigenetic landscape of in vivo murine epidermis remains unknown. To date, majority of available epidermal datasets were derived from in-vitro cultured primary cells, immortalized cell lines or mixed cell population from whole skin or epidermis (Lopez-Pajares et al., 2015, Mulder et al., 2012, Rubin et al., 2017). Our study provides an integrated analysis of transcriptome (RNA-Seq), chromatin accessibility (ATAC-Seq), architecture (Hi-C), and histone modifications (ChIP-Seq) in epidermal fractions in vivo. Furthermore, we elucidate Dlx3-mediated epigenetic regulation of epidermis. Collectively, our work constitutes a resource that will allow in-depth characterization of epigenetic remodeling directed transcription critical to skin development. This will open avenues to better understand chromatin dysregulation in the context of skin stratification disorders and inflammatory diseases.
RESULTS
Transcriptome analysis reveals repressed gene expression in suprabasal
To investigate how chromatin and gene expression govern the epidermal equilibrium, we profiled basal (B) and suprabasal (SB) cells from neonatal mice (P0-P2) with RNA-Seq, ATAC-Seq and Hi-C data (Fig 1a). There is an intrinsic limitation in the percoll separation protocol that does not permit to distinguish cell populations in transitionary differentiation state. Morevoer, we acknowledge that the profiling potentially includes transcripts derived from hair follicle cells that may be present in the B fraction obtained through the percoll gradient isolation protocol. However, it is an efficient method to obtain substantial material while preserving inherent physiological states.
Figure 1: Transcriptomic analysis reveals prevalence of repressed gene expression in suprabasal (SB) fraction.

A) Schematic of the study design. B) Snapshots from Integrative Genome Browser (IGV) showing examples of specific basal (B) (Krt5 and Krt14) and suprabasal (SB) (Krt1 and Krt10) genes as captured from the transcriptomic profiling. Specific colors have been used to specify the individual fractions (purple for B and pink for SB). C) Volcano plot showing differentially expressed genes in B and SB fractions. X-axis is log2 ratio in SB fraction and Y-axis is −log10 p-value. The blue dots represent down-regulated genes (fold change < 2; p-value < 0.05), and the coral dots represent up-regulated genes (fold change > 2; p-value < 0.05). D) Heatmap showing relative expression of genes from the EDC and other genes crucial in skin differentiation in both fractions of the epidermis. E) Gene ontology (GO) enrichment analysis of the up- and down-regulated genes in the SB fraction of skin epidermis. The color scale is from grey to brown from low to high significance (−log 10 p-value). F) Network depiction of the pathways enriched in the down-regulated genes in SB. The size of the nodes represents the number of genes contributing to the list. Each pathway is colored uniquely to assist better identification of the interactions. G) Heatmap showing relative expression of chromatin regulatory factors in B and SB fractions of epidermis. The relative expression for all heatmaps is log2 fold transformed and the color scale is from blue to red for low to high expression respectively.
RNA-seq analysis revealed 9118 genes significantly expressed in both epidermal fractions (RPKM > 1, p-val ≦ 0.05) and detected specific B (Krt5, Krt14) and SB (Krt1, Krt10) genes (Fig 1b). We determined 5417 differentially expressed (DE) genes, of which 82% (4463; fold change ≦ −2) were down-regulated and 17.6% (954; fold change ≧ 2) up-regulated (Fig 1c; Supplementary Table S1). As expected, an overall higher expression pattern of the EDC genes was observed in SB samples, despite some sample heterogenity (Fig 1d).
Up-regulated genes in SB were enriched in pathways like keratinization, lipid metabolism, and regulation of water loss (Supplementary Figure S1; Supplementary Table S1). Downregulated genes were enriched for chromatin-related categories: chromosome maintenance, DNA conformation change, mitotic cell cycle process (Fig 1e-f; Supplementary Table S1). Of the 35 DE chromatin regulatory factors identified with AnimalDB 2.0, 31 were repressed in SB (Fig 1g). The four upregulated chromatin regulators in SB have been associated with gene repression, including Cbx4 (Mardaryev et al., 2016). These results support a predominant suppressive transcriptomic state for epidermal cells during the differentiation process.
Integrative analysis of epidermal transcriptome and chromatin accessibility
ATAC-Seq analysis showed strong enrichment of accessible chromatin (Fig 2a) at transcription start sites (TSS). A subset of peaks was specifically enriched in each fraction (B: 19784; SB: 22812), while 84% (88739) of ATAC-Seq peaks were shared between both fractions (Supplementary Table S2). B-specific regions were associated with genes related to cell fate commitment and cell migration. SB-unique regions yielded ontologies like regulation of secretion and negative regulation of cell proliferation (Fig 2b; Supplementary Table S2). GO analysis of shared accessible genes resulted in kinase activity, Rho GTPase cycle, and protein phosphorylation (Supplementary Figure S2a; Supplementary Table S2).
Figure 2: Integrative analysis of transcriptome and chromatin accessibility.

A) Heatmap showing enrichment of ATAC-Seq peaks in B and SB, centered at the peaks and 2.5kb flanking on either side. Color scale is from black to red, representing tag density (read count per million mapped reads) from low to high. B) GO analysis of nearest genes (+/− 2.5kb) related to the unique peaks in B and SB fractions of epidermis. The color scale is from grey (low) to brown (high) for significance (−log 10 p-value). C) Motif analysis for unique ATAC-Seq peaks in B and SB fractions. D) Representative genes with differential chromatin accessibility in B and SB fractions. Specific colors have been used to specify the individual fractions (purple for B and pink for SB). E) Dot plot showing GO enrichment analysis of nearest genes having higher accessibility in SB fraction. The x-axis is the ratio of number of genes from our list to that of the total genes reported in the pathway. The size of the dots represents the count of genes from our list contributing to the pathway, and the color scale is from green to red for low to high significance (−log 10 q-value). F) Volcano plot showing the integrative analysis of ATAC-Seq and RNA-Seq data from DiffTF analysis. The x-axis is weighted mean difference, and positive and negative values represent activity in the SB and the B fractions of the epidermis, respectively. The colors represent transcription factor (TF) activity either as an activator (green), repressor (red) or undetermined (black). Y-axis represents significance (−log10 of adjusted p-value). G) Dot plot showing presence of more activators in B fraction as compared to SB, taking the top 10 TF activity in each fraction (excluding the factors with undetermined activity). Green represents activator and red represents repressor activity.
TF binding at accessible target sites is necessary to establish and maintain cell identity and specification. Motif analysis of the unique peaks identified TF family for p53, NF-κB-p65, Gata, Jun and Grhl enriched in the B fraction, whereas SB-specific TF family were Ap2, Twist, Runx, Oct and Grhl (Fig 2c). Among shared peaks, we found motifs enriched for family members of Fra, Ctcf, Dlx, Klf, and Nf (Supplementary Figure S2b). Some (14%) of shared ATAC peaks exhibited differential accessibility (fold change ≦ 0.5 in SB: 9745 peaks; fold change ≧ 1.5 in SB: 3567 peaks) between the epidermal fractions. Among the identified genes, Hrnr (a well-known differentiation-associated gene) had higher accessibility in SB while Ccl27a (a B keratinocyte marker) was more accessible in B keratinocytes (Fig 2d). Genes associated with SB-specific peaks were enriched in growth factor cell response and Notch signaling (Fig 2e; Supplementary Table S2).
Integrated analysis of transcriptional profiles and chromatin accessibility showed there was significant overlap of differentially expressed genes having open TSS-sites in the shared ATAC-seq peaks among B and SB (Supplementary Figure 2c and Supplementary Table S2). Utilizing DiffTF (Berest et al., 2019) allowed for classification of enriched TFs as activators or repressors in the epidermal fractions (Fig 2f; Supplementary Table S2). Some notable SB-enriched TFs were Klf4, Jun, Myc (activators), and Fos, Creb1, and Sp3 (repressors), whereas B-enriched TFs were p63, p73, Nfkb1, Ap2a (activators) and Ovol1, Twist1 and Gata2 (repressors). The lack of Grhl3 motifs in the ATAC-seq data is potentially attributed to the absence of its motif in the HOMER motif database. Additionally, we identified more repressors in SB and a significant enrichment of activators in B (Fig 2g). Altogether, these data support complex cell-specific combinatorial signatures drive epidermal differentiation.
Chromosome Conformation Profiling in Epidermis: EDC displays differential chromatin structure
To decipher the chromatin architecture overseeing gene expression in epidermal fractions, we performed Hi-C-Seq. The fractions showed broadly similar chromatin organizations but revealed significant structural differences at specific loci (Fig 3a). A higher density of DE genes (Fig 3b) was observed in the topologically associated domains (TADs) of SB. Despite both fractions having a similar domain count in 5Kb blocks (8143 in B and 8182 in SB), SB had a lower number of loops (8021) compared to the B (11129) and an overall higher proportion of inter-chromosomal interactions (~14% in SB compared to ~8% in B) (Supplementary Table S3).
Figure 3: Chromosome conformation profiling in skin epidermis: EDC region displays differential chromatin structure.

HiC experiments were done in duplicate and visualization shown here is based on one representative sample. A) Heatmap showing contact matrices of the genome from B and SB Hi-C-Seq, followed by zoomed-in view of Chr3 in both the fractions at 250kb resolution. B) Box plot showing distribution of density of differentially expressed genes in the TADs identified in B (cyan) and SB (red) fraction. NS, not statistically significant. C) Hi-C contact map showing differential TADs in the EDC region in B (cyan) and SB (red) fraction at 10kb resolution. The TAD boundaries have been marked with black lines in both samples. Plot below shows differential TAD score in the EDC region between B and SB fractions. D) Plot showing differential loop intensity in the EDC region between B and SB fractions.
Selective loci like the EDC region had distinct structural differences in the two fractions (Supplementary Figure S3), where crucial terminal differentiation genes were seen in the open compartment in SB and closed compartment in B (Supplementary Figure S3). Performing a comparative analysis we show that the chromatin structure around the EDC region is conserved, when evaluated against Dixon et al and Poterlowicz et al (Dixon et al., 2012, Poterlowicz et al., 2017), as shown in Supplementary Table S3.
Moreover, SB had a higher looping intensity and TADscore for the Sprr and Lce clusters, Flg and Hrnr (Fig 3c). Interestingly, the TADscore calculated for those regions correlated with the differential looping observed in both fractions (Fig 3d).
Enhancer profiling in the suprabasal (SB) fraction
We next investigated the SB epigenetic landscape, analyzing the histone mark H3k4me3 and Pol2 using ChIP-Seq. Binding profiles showed heightened intensity near the TSS of expressed genes (Supplementary Figure S4a). H3k4me3 was prevalently (88%) associated with TSS regions (+/− 2.5kb). Among the expressed genes marked by H4K4me3, 6% (9303) were up-regulated in SB (FC>2; enriched in skin development, water loss regulation, cornified envelope formation pathways) and 33% were down-regulated (FC<−2; enriched in cell cycle, chromatin organization, histone development, Rho GTPase signaling; Supplementary Figure S4b; Supplementary Table S4). To identify TFs driving gene expression in SB cells, we integrated SB-ATAC-Seq data with the binding profile of H3k4me3. Chromatin accessibility highly correlated with our epigenetic data: 95% of the H3k4me3-positive promoters showed open chromatin profile. Promoter regions of major EDC proteins revealed alignment of open chromatin and active promoter marks with gene expression (Fig 4a). We observed 56% of genes up-regulated in SB are occupied by Pol2 (Supplementary Figure S4c). Distinct motifs were enriched for Pol2 peaks (Runx and Klf4) and H3k4me3 sites (Nrf, Elk and Sp) (Supplementary Figure S4d). These results underscore the role of TFs like Klf and Runx in epidermal gene regulation, reinforcing the critical role of Klf4 as an established epidermal core promoter element potentially acting as a recruitment hub for other TFs.
Figure 4: Enhancer profiling in the suprabasal fraction.

A) IGV snapshots for Lor and Flg highlighting chromatin and expression profile in SB fraction; the boxed area shows the gene under consideration. B) Summary plot showing distribution of tag density of H3k27ac and H3k27me3 at active enhancers. The x-axis is genomic region centered around the peak center, with +/− 5kb flanking, and the Y-axis is tag density (read count per million mapped reads). C) Summary plots showing distribution of tag density of H3k27ac and H3k27me3 at top 750 up- and down-regulated genes as identified from RNA-Seq data. The x-axis is genomic region centered at TSS, with +/− 5kb flanking, and the Y-axis is tag density (read count per million mapped reads). D) Heatmap showing GO analysis for nearest gene related to active and poised enhancers. The color scale is from grey to brown from low to high significance (-log 10 p-value). E) Super-enhancers (SE) plotted in increasing order based on the H3k27ac ChIP-Seq peak intensity. 898 super-enhancers were identified, as shown above the inflection point of the curve. F) Hi-C contact maps for neighboring areas of Lor and Flg showing differential TADs and TAD-score profile in both fractions at 10kb resolution. G) Differential loops detected in both the fractions at above loci in panel 4f (genomic regions containing Lor and Flg genes), followed by IGV snapshot showing SB SE sites.
Gene expression is strongly affected by enhancer-mediated regulation. While enhancer-promoter remodeling during differentiation has been reported in human cells (Rubin et al., 2017), a complete view of the enhancer landscape in murine differentiated cells in vivo is unavailable. Herein, we present an epigenomic landscape for SB cells, with ChIP-Seq data for H3k4me1, H3k27ac, and H3k27me3 to identify and classify enhancers (Supplementary Figure S4a). TF family motifs enriched for H3k27ac were Atf, Grhl, Klf, Dlx, ROR (Supplementary Figure S4d), emphasizing probable synergistic gene modulation by differentiation drivers like Klf4, Grhl3 and Dlx3. H3k4me1 peaks were enriched for TF like Fos, Klf, p53, Rbpj and Runx, while H3k27me3 marks were enriched for TF families of Lhx, Gata, Irf, Oct, Ets:Runx (Supplementary Figure S4d). We observed 9822 poised enhancers (Calo and Wysocka, 2013) marked by H3k4me1 and H3k27me3 (79% having open chromatin profile) and 13104 active enhancers enriched for H3k4me1 and H3k27ac (88% having open chromatin profile) (Fig 4b; Supplementary Table S4). The overlay of the H3k27ac marks with the top 750 DE genes showed high correlation of active enhancers with gene expression (Fig 4c).
Ontologies enriched for active enhancer-linked genes included epithelial cell differentiation, cell junction organization, and transmembrane RTK signaling. Distinct pathways were found for poised enhancers: regulation of cell differentiation, growth factor response, cell fate commitment (Fig 4d; Supplementary Table S4). Importantly, using H3k27ac peaks we classified super-enhancers (SEs), which are larger regulatory enhancer elements controlling cell identity genes important via ROSE. ((Loven et al., 2013, Whyte et al., 2013); Fig 4e). Of the 898 regions classified (corresponding to 861 genes), 713 were devoid of promoter regions and had the characteristics of SEs (Supplementary Table S4). RNA-Seq data revealed higher expression of SE-related genes compared to typical enhancer-related (TE) genes (Supplementary Figure S4e).
Analysis of the EDC revealed a complex regulatory neighborhood with high degree of correlation between enhancer sites and active gene transcription, highlighting strong enhancer-mediated regulation in this region. As expected, the TADs in EDC were abundant with histone marks (Supplementary Table S3). Hi-C data overlayed for two of the crucial SE-coupled EDC genes, Lor and Flg, showed differential TAD and loop formation, consistent with differential gene expression (Fig 4f-g).
Comparing with published human cultured keratinocytes data (Rubin et al., 2017), we found 49 (Day 3 of induced differentiation) and 54 (Day 6 of induced differentiation) common loci in the EDC region (Supplementary Table S4). This underlines the significance of enhancer-mediated gene regulation in the evolutionarily conserved EDC locus during skin differentiation.
Dlx3 binding is enriched in differentiation-linked super-enhancers
With prior knowledge on the role of Dlx3 in epidermal differentiation and hair follicle development (Hwang et al., 2011, Hwang et al., 2008, Park and Morasso, 1999), we performed Dlx3 ChIP-Seq in SB cells. Dlx3 occupied 7224 loci of which, 15% were at TSS (Fig 5a; Supplementary Table S5 and Supplementary Figure S5a). Motif analysis confirmed the presence of Dlx3 motif and revealed additional motifs for Klf, Grhl, NF-κB-p65, ROR, and Lhx family of TFs (Fig 5b). Recent findings show that Dlx, Klf and Grhl form a regulatory network determining epidermal fate in chordate ectoderm specification (Leon et al., 2022). These results and our findings support an evolutionarily conserved mechanism where Dlx3 functions in a multifactorial fashion with specific TFs, particularly Klf4 and Grhl3, in regulating skin differentiation.
Figure 5: Dlx3 is enriched in super-enhancers.

A) Summary plot showing distribution of tag density of Dlx3 centered at TSS and +/− 5kb flanking. B) Motifs enriched for Dlx3 bound regions in the SB fraction. C) Venn diagram showing intergenic regions sharing Dlx3 and H3k27ac co-occurrence along with Dlx3 motif. This is followed by network representation of GO analysis of those regions. The size of the nodes represents the number of genes contributing to the list. Each pathway is colored uniquely to assist better identification of the interactions. Epidermal-specific pathways are bolded and italicized. D) Snapshot from IGV showing the region of EDC with the distribution of active enhancers and occupancy of both Dlx3 and Pol2 along with tracks showing expression and chromatin accessibility in SB. E) Summary plot showing tag density distribution of Dlx3 at typical and SEs. F) Hi-C contact maps for neighboring areas of Maml3 showing differential TADs and TAD-score profile in both fractions at 10kb resolution. G) Differential loops detected in both the fractions at above loci in panel 5f. H) IGV snapshot showing SB SE sites and Dlx3 binding at the loci in panel 5f. I) ChromHMM analysis results overlayed with data from ATAC-Seq, gene expression, Dlx3 and Pol2 ChIP-Seq binding. The heatmap shows emission parameters, displaying fold enrichment of various genomic annotations (in a column-specific coloring scale). The color corresponds to a greater probability (dark blue) of observing the mark in the state. Each row corresponds to a state, and each column corresponds to either one of the defining marks (on the left) or a genomic location (on the right). Candidate-state descriptions for each state are shown to the right of the heatmaps.
Interestingly, Dlx3 was prevalent in intergenic regions (47%; Supplementary Figure S5a; 15% in proximal promoters [+/− 2.5kb of TSS]), suggesting a role of Dlx3 in long-range chromatin interactions. GO analysis of Dlx3-positive TSSs revealed pathways of water loss regulation, EGFR signaling, and cornified envelope. These pathways intrinsically related to epidermal differentiation, support an indispensable regulatory role for Dlx3-bound core TFs at TSS in the cornification process. In contrast, genes related to intergenic-Dlx3 peaks were enriched for cell proliferation regulation, cell-cell adhesion, and growth factor response (Supplementary Figure S5b; Supplementary Table S5), supporting a more generalized anti-proliferative role for the functional binding of Dlx3 in these regulatory regions.
To identify Dlx3-regulated active enhancers, we sought intergenic sites bound by both Dlx3 and H3k27ac and looked at the proximal genes having Dlx3 motif. These genes (1223) were enriched in epidermal differentiation, cornified envelope, and water loss regulation (Fig 5c; Supplementary Table S5). Key EDC genes like Lor, Ivl, Lce-genes, Flg2, Hrnr, and S100a, were all bound by Dlx3 (Fig 5d) and proximal H3k27ac binding. Of note, Dlx3 binding was enriched in the SEs as compared to TEs (Fig 5e). Altogether, our data establishes Dlx3 as a critical the pro-differentiation TF in maintaining the cell identity of SB cells via long-range cis-regulation.
An epidermal-specific role of Klf4 in establishing the skin barrier has been reported (Segre et al., 1999, Sen et al., 2012). We performed ChIP-Seq for Klf4 in SB and show that binding was equitable in proximal promoters (35%) and gene bodies (36%), followed by binding in intergenic (30%) regions (Supplementary Table S5). Motif analysis revealed enrichment for TF families like Klf, Fos, Stat, and Nf (Supplementary Figure S5c). In contrast to Dlx3, GO analysis of Klf4-bound loci yielded similar ontologies for both proximal-TSS peaks and intergenic peaks (Supplementary Figure S5d; Supplementary Table S5). Comparable to Dlx3, we also find a higher tag density for Klf4 in SEs (Supplementary Figure S5e). Notwithstanding some overlap, altogether our results underscore a distinct functionality for Dlx3 binding.
When complemented with Hi-C data, the EDC exhibited more open compartments in SB that coincided with Dlx3/Klf4 binding (Supplementary Fig S5f). Additionally, a SE site proximal to both Dlx3 and Klf4 binding (Supplementary Fig S5g) encompassed a well-characterized conserved non-coding element (CNE293; (de Guzman Strong et al., 2010)). One of the SE regions and a downstream effector of Notch signaling, Maml3, had Dlx3 binding overlapping with SE sites. Our Hi-C analysis revealed this area coincides with the formation of TADs and loops (Fig 5f-h).
ChromHMM integrative analysis (Ernst and Kellis, 2012) was used to identify and define different chromatin states in the SB fraction. Employing the four histone marks profiled in SB, we identified 12 chromatin states (Fig 5i; Supplementary Table S5). To define these states, we overlayed the genomic features derived from ChromHMM with RNA-Seq, ATAC-Seq, and Pol2 ChIP-Seq data. As expected, the repressed regions and the low signal states had closed chromatin, and Pol2 signals were highest for the active promoter states, and the poised enhancer states had low expression despite the presence of Pol2. This model presents a comprehensive view of the epigenetic and transcriptomic landscape of the SB cells in vivo, highlighting the molecular dynamics involved during epidermal differentiation. This analysis further underlined the co-occupancy of Dlx3 and H3k27ac on critical loci and the role of Dlx3/Klf4 in SB gene regulation.
Conditional ablation of Dlx3 disrupts epidermal differentiation driver genes and affects Notch signaling
We have previously reported the effects of Dlx3 epidermal ablation on skin (Hwang et al., 2011) using a Krt14cre-Dlx3 conditional knock-out (cKO) mice model. As captured by electron-microscopy, Dlx3 cKO skin (neonatal stage P1) showed structural differences underpinning an altered epidermal differentiation (Fig 6a). RNA-Seq of WT and Dlx3 cKO B and SB cells identified 356 (175 up- and 181 down-regulated) and 286 (181 up- and 105 down-regulated) DE genes in SB and B fractions, respectively. Keratinocyte differentiation and cornified envelope genes were significantly downregulated in the cKO SB cells (Supplementary Table S6). Despite the absence of pro-differentiation Dlx3, these cells have a “quasi-barrier” formation (Hwang et al., 2011). We hypothesize a possible functional compensation by other epidermal differentiation modulators like Klf4 or Grhl3. Putative Dlx3 target genes bound by Dlx3 at enhancers exhibited differential expression levels when comparing WT and Dlx3 cKO SB fractions (Fig 6b, Supplementary Figure S6a).
Figure 6: Dlx3 ablation disrupts chromatin accessibility, affecting epidermal specific genes.

A) Electron microscopy of neonates (p1) of Dlx3 WT and Dlx3 cKO mice showing changes in skin structure. Bar, 2mm B) Heatmap showing relative expression of selected Dlx3 target genes in SB fraction of Dlx3 WT and Dlx3 cKO mice. C) Summary plot showing differential chromatin accessibility in SB fraction between Dlx3 WT and Dlx3 cKO mice, looking at regions with Dlx3 occupancy and Dlx3 motifs. D) Boxplot showing expression of SE- and TE-related genes in SB fraction of epidermis from Dlx3 WT and Dlx3 cKO mice. E) Immunofluorescence showing representative SE-related genes in Dlx3 WT and Dlx3 cKO mice. Green channel was used for the protein of interest and red channel for Krt5. F) GO enrichment analysis for upregulated genes exclusively seen in Dlx3 overexpressing primary cells derived from Dlx3 cKO neonates. The color scale is from grey to brown from low to high significance (−log 10 p-value). G) Heatmap of a subset of crucial epidermal genes showing log2 ratio in Dlx3-overexpressing cells over control in WT and cKO condition. The color scale is from blue to red for low to high relative expression respectively.
To further explore the role of Dlx3 in chromatin regulation during differentiation, we performed ATAC-Seq on WT and Dlx3 cKO SB cells. Remarkably, analysis of regions enriched for Dlx3 motifs and bound by Dlx3 in SB cells showed loss of their chromatin accessibility upon epidermal Dlx3 ablation. This suggests a putative role of Dlx3 in establishing chromatin accessibility and controlling gene expression of genes involved in skin homeostasis (Fig 6c). The regions that lost chromatin accessibility were enriched in pathways like epithelial cell differentiation, skin development and cornified envelope formation (Supplementary Table S6). Although the overall expression level of TE- and SE-related genes was not affected in Dlx3 cKO samples, we did observe significant expression changes in specific SE-related genes, including Klf4 and Notch2 (Fig 6d-e; Supplementary Figure S6b).
We next reintroduced Dlx3 to primary WT and cKO keratinocytes in vitro by adenoviral transduction of either control (AdGFP) or Dlx3-encoding construct (AdDlx3) and subsequently profiled the transcriptomes via RNA-Seq (Supplementary Figure S6c). When comparing WT-AdDlx3 to WT-AdGFP and cKO-AdDlx3 to cKO-AdGFP, more than 90% of the 1410 DE genes were upregulated (Supplementary Table S6). Notch signaling is one of the ontologies enriched in exclusively upregulated genes (n=234) seen in the cKO-AdDlx3 condition (Fig 6f; Supplementary Table S6). This correlates with the higher Notch2 expression determined in cKO neonate skin (Fig 6e). The EDC region (S100s, Lces, Rptn, Hrnr, Crnn, Iv1, Lor, and Flg2), key-epidermal specific keratins (Krt1, Krt10, Krt5, and Krt14), differentiation drivers (Grhl3), chromatin regulators (Lats2, Zfp750, Pou2f3), and Notch signaling genes (Notch2 and Jag1) were among the DE genes, further highlighting a regulatory role of Dlx3 for proper epidermal differentiation and skin homeostasis (Fig 6g; Supplementary Table S6; Supplementary Figure S6d).
DISCUSSION
Herein we present a comprehensive topographic, transcriptomic, and epigenomic analysis of murine epidermis through profiling of proliferating basal (B) and differentiated suprabasal (SB) cells in vivo. The study was designed to create an invaluable resource providing details of the complex epigenomic landscape of epidermal differentiation.
Analysis of SB transcriptome identified an unexpected overrepresentation of downregulated genes. Interestingly, the generalized ‘suppressive transcriptomic state’ was specified by chromatin pathways like “chromosome maintenance” and “DNA conformation change”. The role of chromatin accessibility and epigenome regulation is known to be fundamental for cell identity, with chromatin-binding factors cooperatively regulating gene expression (Klemm et al., 2019). Our observation is consistent with data previously reported (Gdula et al., 2013) that showed higher frequency of pericentromeric heterochromatic clusters in SB keratinocytes. We document distinct transcriptomic profiles of the epidermal fractions with strikingly similar chromatin accessibility, where the landscape of accessibility changing dynamically only in one-fifth of peaks specifically enriched in either of the fractions.
Expression pattern of the chromatin regulatory factors showed Klf4 and Dlx3 motifs enriched in shared ATAC peaks between the two fractions, strongly supporting gene regulation via Dlx3-Klf4 synergistic interaction. The architectural function of KLF4 as a somatic cell reprogramming TF in regulating chromatin contacts at specific genomic loci has been reported (Di Giammartino et al., 2019) as well as its role in recruiting SWI/SNF to increase chromatin accessibility (Jan-Renier A.J. Moonen1238, 2020). Specifically in human epidermal cells, Rubin et al showed KLF4’s role in regulating long-range chromatin contacts at specific genomic loci like HOPX gene (Rubin et al., 2017). Additionally, the regulatory function DLX family members (Dlx1, 2 and 5) is known to orchestrate transcriptomic networks and epigenomic changes crucial for neuronal specification (Lindtner et al., 2019). Our findings reveal Dlx3 as a putative new combinatorial player in regulating the chromatin architecture and accessibility during epidermal differentiation.
We also document enhancer element occupancy in SB cells, with motif enrichment for three TFs: Dlx3, KLf4 and another important keratinocyte pro-differentiation regulator: Grhl3 (Lin et al., 2020). The interplay of Dlx, Klf and Grhl factors is determinant during epidermal fate in chordate ectoderm specification (Leon et al., 2022). In human keratinocytes, KLF4 acts on SEs (Cavazza et al., 2016) and differential association of Grhl3 to distinct subsets of SEs correlate with keratinocyte differentiation (Klein et al., 2017). Parallel to H3k27ac ChIP seq, our Dlx3 ChIP-Seq in SB yielded motifs for Klf and Grhl family members in addition to Dlx3. Interestingly, our data identified Dlx3 showing significantly higher tag density in SB SEs compared to TEs. Altogether, our data underscore an unrecognized role for Dlx3 as a crucial component in the multi-TF complexes associated to SE regions and the relevance of the Dlx/Klf/Grhl combinatorial regulatory network in maintaining correct temporospatial gene expression during epidermal differentiation.
Advances in chromatin spatial organization studies have revealed that genes within distinct chromosomal territories are non-randomly positioned in relation to each other and other sub-nuclear organelles (Cremer and Cremer, 2010, Naumova and Dekker, 2010, Sanyal et al., 2011). This non-random organization might be linked to tissue-specific gene expression or shared regulatory mechanisms with neighboring loci for effective transcription. Inter- and intra-chromosomal interactions between distinct loci are crucial for generation of a dynamic “transcriptional interactome”, essential for tissue-specific gene expression programs (Schoenfelder et al., 2010). To our knowledge, our data presents previously unreported spatial data on chromatin interactions in murine epidermal fractions in vivo, presenting cell-type specific TADs and loops. Exploration of the EDC region showed differential open compartments, TAD score and looping in the epidermal fractions. In particular, loricrin and filaggrin showed distinct SB-specific TAD and loop formation that coincided with SE sites. These results reinforce the tight enhancer-mediated regulation of the the evolutionarily conserved EDC locus.
Altogether, our datasets will be a valuable resource to the epithelial community, providing advanced epigenomic knowledge of epidermal fractions along the temporospatial differentiation axis, where we present a global epigenomic differentiation-specific map. Furthermore, our work reveals unique functionalities for Dlx3 and its targets participating in the homeostatic control of skin development.
METHODS
Experimental model
Mice of either Fvb/N or mixed CD-1 and C57BL/6 background were used according to the animal procedures approved by the Animal Care and Use Committee of the National Institute of Arthritis and Musculoskeletal and Skin Diseases at NIH. Murine neonates of either Fvb/N or mixed CD-1 and C57BL/6 background were used for epidermal isolation (Lichti et al., 2008) followed by percoll gradient separation (Palazzo et al., 2017) of basal and suprabasal fractions as previously described. The fractions were processed further for various profilings using RNA-Seq, ATAC-Seq, HiC-Seq and ChIP-Seq.
The detailed methods are described in Supplementary Materials and Methods.
Supplementary Material
ACKNOWLEDGEMENTS
This work was supported by the Intramural Research Program of the National Institute of Arthritis and Musculoskeletal and Skin Diseases, NIH (ZIA-AR041124 to M.I.M). We thank all members of the Laboratory of Skin Biology for their continuous support. M. I. Morasso and Stefania Dell’Orso contributed equally to this work. We are grateful to Dr. Stuart H. Yuspa and Dr. Christophe Cataisson of National Cancer Institute for donating the Fvb/N neonates used in the study. We also thank Kunio Nagashima and Ferri Soheilian of the National Cancer Institute for their assistance with the TEM data. We thank Dr. Hong-Wei Sun of the Biodata Mining Section, G. Gutierrez-Cruz of the NIAMS Genome Analysis Core Facility and members of the NIAMS Light Imaging Core Facility. This work used the computational resources of the NIH High-Performance Computing Biowulf Cluster. We thank Alan Hoofring and Erina He of the NIH Medical Arts Section.
Footnotes
Publisher's Disclaimer: This is a PDF file of an unedited manuscript that has been accepted for publication. As a service to our customers we are providing this early version of the manuscript. The manuscript will undergo copyediting, typesetting, and review of the resulting proof before it is published in its final form. Please note that during the production process errors may be discovered which could affect the content, and all legal disclaimers that apply to the journal pertain.
CONFLICT OF INTEREST
The authors state no conflict of interest.
Data availability statement
Datasets related to this article can be found at https://www.ncbi.nlm.nih.gov/geo/query/acc.cgi?acc=GSE197024, hosted at NCBI with GEO accession number GSE197024.
REFERENCES
- Berest I, Arnold C, Reyes-Palomares A, Palla G, Rasmussen KD, Giles H, et al. Quantification of Differential Transcription Factor Activity and Multiomics-Based Classification into Activators and Repressors: diffTF. Cell Rep 2019;29(10):3147–59 e12. [DOI] [PubMed] [Google Scholar]
- Blanpain C, Fuchs E. Epidermal homeostasis: a balancing act of stem cells in the skin. Nat Rev Mol Cell Biol 2009;10(3):207–17. [DOI] [PMC free article] [PubMed] [Google Scholar]
- Calo E, Wysocka J. Modification of enhancer chromatin: what, how, and why? Mol Cell 2013;49(5):825–37. [DOI] [PMC free article] [PubMed] [Google Scholar]
- Cavazza A, Miccio A, Romano O, Petiti L, Malagoli Tagliazucchi G, Peano C, et al. Dynamic Transcriptional and Epigenetic Regulation of Human Epidermal Keratinocyte Differentiation. Stem Cell Reports 2016;6(4):618–32. [DOI] [PMC free article] [PubMed] [Google Scholar]
- Cremer T, Cremer M. Chromosome territories. Cold Spring Harb Perspect Biol 2010;2(3):a003889. [DOI] [PMC free article] [PubMed] [Google Scholar]
- de Guzman Strong C, Conlan S, Deming CB, Cheng J, Sears KE, Segre JA. A milieu of regulatory elements in the epidermal differentiation complex syntenic block: implications for atopic dermatitis and psoriasis. Hum Mol Genet 2010;19(8):1453–60. [DOI] [PMC free article] [PubMed] [Google Scholar]
- Di Giammartino DC, Kloetgen A, Polyzos A, Liu Y, Kim D, Murphy D, et al. KLF4 is involved in the organization and regulation of pluripotency-associated three-dimensional enhancer networks. Nat Cell Biol 2019;21(10):1179–90. [DOI] [PMC free article] [PubMed] [Google Scholar]
- Dixon JR, Selvaraj S, Yue F, Kim A, Li Y, Shen Y, et al. Topological domains in mammalian genomes identified by analysis of chromatin interactions. Nature 2012;485(7398):376–80. [DOI] [PMC free article] [PubMed] [Google Scholar]
- Dube CT, Jahan FRS, Lim CY. Key changes in chromatin mark mammalian epidermal differentiation and ageing. Epigenetics 2021:1–16. [DOI] [PMC free article] [PubMed] [Google Scholar]
- Ernst J, Kellis M. ChromHMM: automating chromatin-state discovery and characterization. Nat Methods 2012;9(3):215–6. [DOI] [PMC free article] [PubMed] [Google Scholar]
- Fessing MY, Mardaryev AN, Gdula MR, Sharov AA, Sharova TY, Rapisarda V, et al. p63 regulates Satb1 to control tissue-specific chromatin remodeling during development of the epidermis. J Cell Biol 2011;194(6):825–39. [DOI] [PMC free article] [PubMed] [Google Scholar]
- Gdula MR, Poterlowicz K, Mardaryev AN, Sharov AA, Peng Y, Fessing MY, et al. Remodeling of three-dimensional organization of the nucleus during terminal keratinocyte differentiation in the epidermis. J Invest Dermatol 2013;133(9):2191–201. [DOI] [PMC free article] [PubMed] [Google Scholar]
- Hopkin AS, Gordon W, Klein RH, Espitia F, Daily K, Zeller M, et al. GRHL3/GET1 and trithorax group members collaborate to activate the epidermal progenitor differentiation program. PLoS Genet 2012;8(7):e1002829. [DOI] [PMC free article] [PubMed] [Google Scholar]
- Hwang J, Kita R, Kwon HS, Choi EH, Lee SH, Udey MC, et al. Epidermal ablation of Dlx3 is linked to IL-17-associated skin inflammation. Proc Natl Acad Sci U S A 2011;108(28):11566–71. [DOI] [PMC free article] [PubMed] [Google Scholar]
- Hwang J, Mehrani T, Millar SE, Morasso MI. Dlx3 is a crucial regulator of hair follicle differentiation and cycling. Development 2008;135(18):3149–59. [DOI] [PMC free article] [PubMed] [Google Scholar]
- Moonen1238 JC Jan-Renier A.J., Shi4 Minyi, Shinohara123 Tsutomu, Li123 Dan, Mumbach45 Maxwell R., Zhang13 Fan, Nasser6 Joseph, Mai3 Daniel H., Taylor123 Shalina, Wang123 Lingli, Metzger13 Ross J., Chang45 Howard Y., Engreitz67 Jesse M., Snyder4 Michael P. and Rabinovitch Marlene. KLF4 Recruits SWI/SNF to Increase Chromatin Accessibility and Reprogram the Endothelial Enhancer Landscape under Laminar Shear Stress. biorxiv 2020. [Google Scholar]
- Kim DS, Risca VI, Reynolds DL, Chappell J, Rubin AJ, Jung N, et al. The dynamic, combinatorial cis-regulatory lexicon of epidermal differentiation. Nat Genet 2021;53(11):1564–76. [DOI] [PMC free article] [PubMed] [Google Scholar]
- Klein RH, Lin Z, Hopkin AS, Gordon W, Tsoi LC, Liang Y, et al. GRHL3 binding and enhancers rearrange as epidermal keratinocytes transition between functional states. PLoS Genet 2017;13(4):e1006745. [DOI] [PMC free article] [PubMed] [Google Scholar]
- Klemm SL, Shipony Z, Greenleaf WJ. Chromatin accessibility and the regulatory epigenome. Nat Rev Genet 2019;20(4):207–20. [DOI] [PubMed] [Google Scholar]
- Koster MI, Roop DR. Mechanisms regulating epithelial stratification. Annu Rev Cell Dev Biol 2007;23:93–113. [DOI] [PubMed] [Google Scholar]
- Leon A, Subirana L, Magre K, Cases I, Tena JJ, Irimia M, et al. Gene Regulatory Networks of Epidermal and Neural Fate Choice in a Chordate. Mol Biol Evol 2022;39(4). [DOI] [PMC free article] [PubMed] [Google Scholar]
- Li L, Wang Y, Torkelson JL, Shankar G, Pattison JM, Zhen HH, et al. TFAP2C- and p63-Dependent Networks Sequentially Rearrange Chromatin Landscapes to Drive Human Epidermal Lineage Commitment. Cell Stem Cell 2019;24(2):271–84 e8. [DOI] [PMC free article] [PubMed] [Google Scholar]
- Lichti U, Anders J, Yuspa SH. Isolation and short-term culture of primary keratinocytes, hair follicle populations and dermal cells from newborn mice and keratinocytes from adult mice for in vitro analysis and for grafting to immunodeficient mice. Nat Protoc 2008;3(5):799–810. [DOI] [PMC free article] [PubMed] [Google Scholar]
- Lin Z, Jin S, Chen J, Li Z, Lin Z, Tang L, et al. Murine interfollicular epidermal differentiation is gradualistic with GRHL3 controlling progression from stem to transition cell states. Nat Commun 2020;11(1):5434. [DOI] [PMC free article] [PubMed] [Google Scholar]
- Lindtner S, Catta-Preta R, Tian H, Su-Feher L, Price JD, Dickel DE, et al. Genomic Resolution of DLX-Orchestrated Transcriptional Circuits Driving Development of Forebrain GABAergic Neurons. Cell Rep 2019;28(8):2048–63 e8. [DOI] [PMC free article] [PubMed] [Google Scholar]
- Lopez-Pajares V, Qu K, Zhang J, Webster DE, Barajas BC, Siprashvili Z, et al. A LncRNA-MAF:MAFB transcription factor network regulates epidermal differentiation. Dev Cell 2015;32(6):693–706. [DOI] [PMC free article] [PubMed] [Google Scholar]
- Loven J, Hoke HA, Lin CY, Lau A, Orlando DA, Vakoc CR, et al. Selective inhibition of tumor oncogenes by disruption of super-enhancers. Cell 2013;153(2):320–34. [DOI] [PMC free article] [PubMed] [Google Scholar]
- Mardaryev AN, Gdula MR, Yarker JL, Emelianov VU, Poterlowicz K, Sharov AA, et al. p63 and Brg1 control developmentally regulated higher-order chromatin remodelling at the epidermal differentiation complex locus in epidermal progenitor cells. Development 2014;141(1):101–11. [DOI] [PMC free article] [PubMed] [Google Scholar]
- Mardaryev AN, Liu B, Rapisarda V, Poterlowicz K, Malashchuk I, Rudolf J, et al. Cbx4 maintains the epithelial lineage identity and cell proliferation in the developing stratified epithelium. J Cell Biol 2016;212(1):77–89. [DOI] [PMC free article] [PubMed] [Google Scholar]
- Mary Elizabeth Mathyer CdGS. Dynamic Chromatin Architecture of the Epidermal Differentiation Complex (EDC). eLS John Wiley & Sons, Ltd: Chichester: 2018. [Google Scholar]
- Meshorer E, Yellajoshula D, George E, Scambler PJ, Brown DT, Misteli T. Hyperdynamic plasticity of chromatin proteins in pluripotent embryonic stem cells. Dev Cell 2006;10(1):105–16. [DOI] [PMC free article] [PubMed] [Google Scholar]
- Mulder KW, Wang X, Escriu C, Ito Y, Schwarz RF, Gillis J, et al. Diverse epigenetic strategies interact to control epidermal differentiation. Nat Cell Biol 2012;14(7):753–63. [DOI] [PubMed] [Google Scholar]
- Naumova N, Dekker J. Integrating one-dimensional and three-dimensional maps of genomes. J Cell Sci 2010;123(Pt 12):1979–88. [DOI] [PMC free article] [PubMed] [Google Scholar]
- Palazzo E, Kellett MD, Cataisson C, Bible PW, Bhattacharya S, Sun HW, et al. A novel DLX3-PKC integrated signaling network drives keratinocyte differentiation. Cell Death Differ 2017;24(4):717–30. [DOI] [PMC free article] [PubMed] [Google Scholar]
- Park GT, Morasso MI. Regulation of the Dlx3 homeobox gene upon differentiation of mouse keratinocytes. J Biol Chem 1999;274(37):26599–608. [DOI] [PMC free article] [PubMed] [Google Scholar]
- Poterlowicz K, Yarker JL, Malashchuk I, Lajoie BR, Mardaryev AN, Gdula MR, et al. 5C analysis of the Epidermal Differentiation Complex locus reveals distinct chromatin interaction networks between gene-rich and gene-poor TADs in skin epithelial cells. PLoS Genet 2017;13(9):e1006966. [DOI] [PMC free article] [PubMed] [Google Scholar]
- Rubin AJ, Barajas BC, Furlan-Magaril M, Lopez-Pajares V, Mumbach MR, Howard I, et al. Lineage-specific dynamic and pre-established enhancer-promoter contacts cooperate in terminal differentiation. Nat Genet 2017;49(10):1522–8. [DOI] [PMC free article] [PubMed] [Google Scholar]
- Sanyal A, Bau D, Marti-Renom MA, Dekker J. Chromatin globules: a common motif of higher order chromosome structure? Curr Opin Cell Biol 2011;23(3):325–31. [DOI] [PMC free article] [PubMed] [Google Scholar]
- Schoenfelder S, Clay I, Fraser P. The transcriptional interactome: gene expression in 3D. Curr Opin Genet Dev 2010;20(2):127–33. [DOI] [PubMed] [Google Scholar]
- Segre JA, Bauer C, Fuchs E. Klf4 is a transcription factor required for establishing the barrier function of the skin. Nat Genet 1999;22(4):356–60. [DOI] [PubMed] [Google Scholar]
- Sen GL, Boxer LD, Webster DE, Bussat RT, Qu K, Zarnegar BJ, et al. ZNF750 is a p63 target gene that induces KLF4 to drive terminal epidermal differentiation. Dev Cell 2012;22(3):669–77. [DOI] [PMC free article] [PubMed] [Google Scholar]
- Veltri A, Lang C, Lien WH. Concise Review: Wnt Signaling Pathways in Skin Development and Epidermal Stem Cells. Stem Cells 2018;36(1):22–35. [DOI] [PubMed] [Google Scholar]
- Watt FM, Estrach S, Ambler CA. Epidermal Notch signalling: differentiation, cancer and adhesion. Curr Opin Cell Biol 2008;20(2):171–9. [DOI] [PMC free article] [PubMed] [Google Scholar]
- Whyte WA, Orlando DA, Hnisz D, Abraham BJ, Lin CY, Kagey MH, et al. Master transcription factors and mediator establish super-enhancers at key cell identity genes. Cell 2013;153(2):307–19. [DOI] [PMC free article] [PubMed] [Google Scholar]
Associated Data
This section collects any data citations, data availability statements, or supplementary materials included in this article.
Supplementary Materials
Data Availability Statement
Datasets related to this article can be found at https://www.ncbi.nlm.nih.gov/geo/query/acc.cgi?acc=GSE197024, hosted at NCBI with GEO accession number GSE197024.