

Abstract
Introduction:
Asian American subgroups experience heterogeneity in cardiovascular disease (CVD), but differences in hypertension-related CVD mortality between Asian American subgroups is not known.
Methods:
Among 1,194,648 deaths in the United States in 2018–2021 with CVD as an underlying cause and hypertension-related diseases as contributing cause, sex-specific age-standardized mortality rates (ASMR), proportional mortality, and proportional mortality ratios (PMR) for non-Hispanic Asian and Asian subgroups (Asian Indian, Chinese, Filipino, Japanese, Korean, Vietnamese), Hispanic individuals, and non-Hispanic Black individuals were compared with non-Hispanic White individuals. The analysis was conducted in August 2022.
Results:
There were 37,746; 95,404; 193,899; and 867,599 hypertension-related CVD deaths in non-Hispanic Asian; Hispanic; non-Hispanic Black; and non-Hispanic White groups, respectively. Among non-Hispanic Asian females, ASMR ranged from 41.6 (95% CI 40.0–43.3) per 100,000 population in Japanese to 52.6 (51.0–54.2) per 100,000 in Filipina individuals. Among non-Hispanic Asian males, ASMR ranged from 45.8 (43.3–48.2) per 100,000 in Korean to 81.0 (78.5–83.5) per 100,000 in Filipino individuals. Proportional mortality was higher for all Asian American subgroups when compared to non-Hispanic White individuals. Relative to their non-Hispanic White counterparts, proportional mortality ratios ranged from 1.11 (in Korean males, proportional mortality was 10.2% [95% CI 9.7–10.8] of all deaths) to 1.38 (in Filipino males, proportional mortality was 12.7% [12.4–13.1] of all deaths in males; in Chinese females, proportional mortality was 11.9% [11.6–12.3] of all deaths; and in Filipina females, proportional mortality was 11.9% [12.3–13.0] of all deaths).
Conclusions:
There was up to two-fold variation in hypertension-related CVD mortality among Asian American subgroups. All Asian subgroups experienced higher proportional mortality for hypertension-related CVD compared with non-Hispanic White individuals.
Introduction
There is considerable heterogeneity in mortality from cardiovascular diseases (CVD) among Asian American subgroups in the US, that is masked by aggregating Asian Americans into one category. Among Asian subgroups, Asian Indian adults experience the highest age-standardized mortality rates (ASMR) from ischemic heart disease (77 per 100,000 among women and 133 per 100,000 among men in 2017), while Vietnamese adults experience the highest ASMR from cerebrovascular disease (46 per 100,000 among women and 47 per 100,000 among men in 2017).1 All Asian American subgroups experience higher proportional mortality from ischemic heart disease compared with non-Hispanic White individuals.2
Hypertension is an important risk factor for both ischemic heart disease and cerebrovascular disease, and its prevalence differs across Asian American subgroups. Among middle- and older-age Asian adults surveyed in a regional electronic health record, the prevalence of hypertension in women ranged from 32% in Chinese and Korean American adults to 57% in Filipina American adults, while hypertension prevalence in men ranged from 36% in Chinese and Korean American adults to 57% in Filipino American adults.3 Estimating hypertension-related CVD mortality in Asian American subgroups may guide tailored prevention strategies for earlier diagnosis, treatment, and control. In this study, we characterized patterns of hypertension-related CVD mortality in Asian American subgroups between 2018–2021.
Methods
Decedents were identified from death certificate records in the Centers for Disease Control and Prevention’s Wide-Ranging Online Data for Epidemiologic Research (CDC WONDER) database among all deaths between 2018–2021, with CVD (International Classification of Diseases (ICD)-10 codes I00-I99) as the underlying cause and hypertensive diseases (ICD-10 codes I10-I15) as underlying or contributing cause. The analysis was restricted to this period since data on Asian subgroups were not publicly available before 2018. Race and ethnicity groups included non-Hispanic Asian adults overall and in subgroups (Asian Indian, Chinese, Filipino, Japanese, Korean, Vietnamese), Hispanic adults, non-Hispanic Black adults, and non-Hispanic White adults. Concurrent race and ethnicity- and sex-specific population estimates were obtained from the Integrated Public Use Microdata Series (IPUMS) Current Population Survey.4 Race and ethnicity on death certificates were identified by the medical examiner or next of kin, and self-identified in population size data.
Among race and ethnicity groups, sex-stratified ASMR per 100,000 population were calculated (standardized to the age distribution of the 2000 US standard population, per the analytic recommendations of the CDC WONDER dataset) with 95% confidence intervals (CI), proportional mortality (number of deaths due to hypertension-related CVD mortality, divided by number of deaths from all causes) with 95% CI, and proportional mortality ratios (proportional mortality in race and ethnicity subgroup divided by proportional mortality in non-Hispanic White decedents). Subgroup analyses for proportional mortality were conducted in age strata: 0–44 years, 45–64 years, and ≥65 years. For these population-level data, non-overlapping confidence intervals indicated statistically significant differences. Z-tests for comparison of proportions were used to identify the statistical significance of differences in proportional mortality in race and ethnic groups compared with non-Hispanic White decedents. Two-tailed p<0.05 indicated statistical significance. This study was exempt from Institutional Review Board review due to use of de-identified public data.
Results
Between 2018–2021, there were 95,404, 37,746, 193,899, and 867,599 deaths in Hispanic, non-Hispanic Asian, non-Hispanic Black, and non-Hispanic White groups. Among non-Hispanic Asian females, ASMR of hypertension-related CVD mortality ranged from 41.6 (95% CI 40.0–43.3) per 100,000 in Japanese to 52.6 (51.0–54.2) per 100,000 in Filipina women. Among non-Hispanic Asian males, ASMR ranged from 45.8 (43.3–48.2) per 100,000 in Korean to 81.0 (78.5–83.5) in Filipino men (Table 1). For females and males, the proportional mortality was higher in all non-Hispanic Asian subgroups compared with non-Hispanic White females and males (proportional mortality 9.3% and 9.2%, respectively).
Table 1.
Hypertension-related cardiovascular mortality in racial and ethnic subgroups in the United States, 2018–2021
| Race & Ethnic Group | Female | Male | ||||
|---|---|---|---|---|---|---|
| N | ASMR | PM | N | ASMR | PM | |
| Non-Hispanic Asian | 18,709 | 46.4 (45.7–47.1) | 12.0% (11.9–12.2) | 19,037 | 57.7 (56.9–58.6) | 11.4% (11.3–11.6) |
| Asian Indian | 2,054 | 42.2 (40.4–44.0) | 11.5% (11.0–12.0) | 2,831 | 52.2 (50.3–54.1) | 10.6% (10.2–11.0) |
| Chinese | 4,436 | 45.0 (43.7–46.3) | 12.8% (12.4–13.1) | 4,485 | 53.0 (51.5–54.9) | 11.9% (11.6–12.3) |
| Filipino | 4,092 | 52.6 (51.0–54.2) | 12.7% (12.4–13.1) | 3,913 | 81.0 (78.5–83.5) | 12.7% (12.3–13.0) |
| Japanese | 2,508 | 41.6 (40.0–43.3) | 11.4% (11.0–11.8) | 1,644 | 53.3 (50.7–55.9) | 11.9% (11.3–12.4) |
| Korean | 1,681 | 43.2 (41.1–45.2) | 10.9% (10.4–11.4) | 1,353 | 45.8 (43.3–48.2) | 10.2% (9.7–10.8) |
| Vietnamese | 1,711 | 42.6 (40.6–44.6) | 12.6% (12.0–13.1) | 2,107 | 55.5 (53.2–57.9) | 11.0% (10.6–11.5) |
| Hispanic | 43,354 | 51.3 (50.8–51.8) | 9.6% (9.5–9.7) | 52,050 | 75.8 (71.5–76.5) | 8.9% (8.8–8.9) |
| Non-Hispanic Black | 91,034 | 98.6 (97.9–99.2) | 12.1% (12.0–12.2) | 102,865 | 154.4 (153.4–155.4) | 12.3% (12.2–12.4) |
| Non-Hispanic White | 422,215 | 57.8 (57.7–58.0) | 9.3% (9.2–9.3) | 445,384 | 84.1 (83.8–84.3) | 9.2% (9.2–9.2) |
ASMR: Age-standardized mortality rates per 100,000 (95% confidence interval); PM: Proportional mortality, indicating the percent of deaths from all causes between 2018–2021 attributed to hypertension-related cardiovascular disease deaths (95% confidence interval). Boldface indicates proportional mortality significantly different (p<0.01) compared with non-Hispanic White decedents. N represents number of deaths in each race and ethnicity subgroup attributed to any cardiovascular disease as underlying cause and hypertension as a contributing cause, 2018–2021.
Overall, the highest proportional mortality in females was in Chinese decedents with hypertension-related CVD mortality accounting for 12.8% of all deaths and a proportional mortality ratio = 1.38 compared with non-Hispanic White decedents [Figure 1]). In males, Filipino decedents had the highest proportional mortality with hypertension-related CVD mortality accounting for 12.7% of all deaths and a proportional mortality ratio = 1.38 compared with non-Hispanic White decedents [Figure 1]). In age stratified analyses of non-Hispanic Asian subgroups (Table 2), proportional mortality from hypertension-related CVD among women was highest in decedents age ≥65 years compared with other age groups. Among women, proportional mortality was highest among Vietnamese (14.5%), Chinese (14.4%), and Filipina (14.2%) adults age ≥65 years. Among men, proportional mortality from hypertension-related CVD was highest in decedents age 45–64 and ≥65 years (highest proportional mortality among Asian subgroups in Filipino American men aged 45–64 years, at 14.3%).
Figure 1. Proportional mortality ratios for hypertension-related cardiovascular mortality in racial and ethnic subgroups in the United States, 2018–2021.
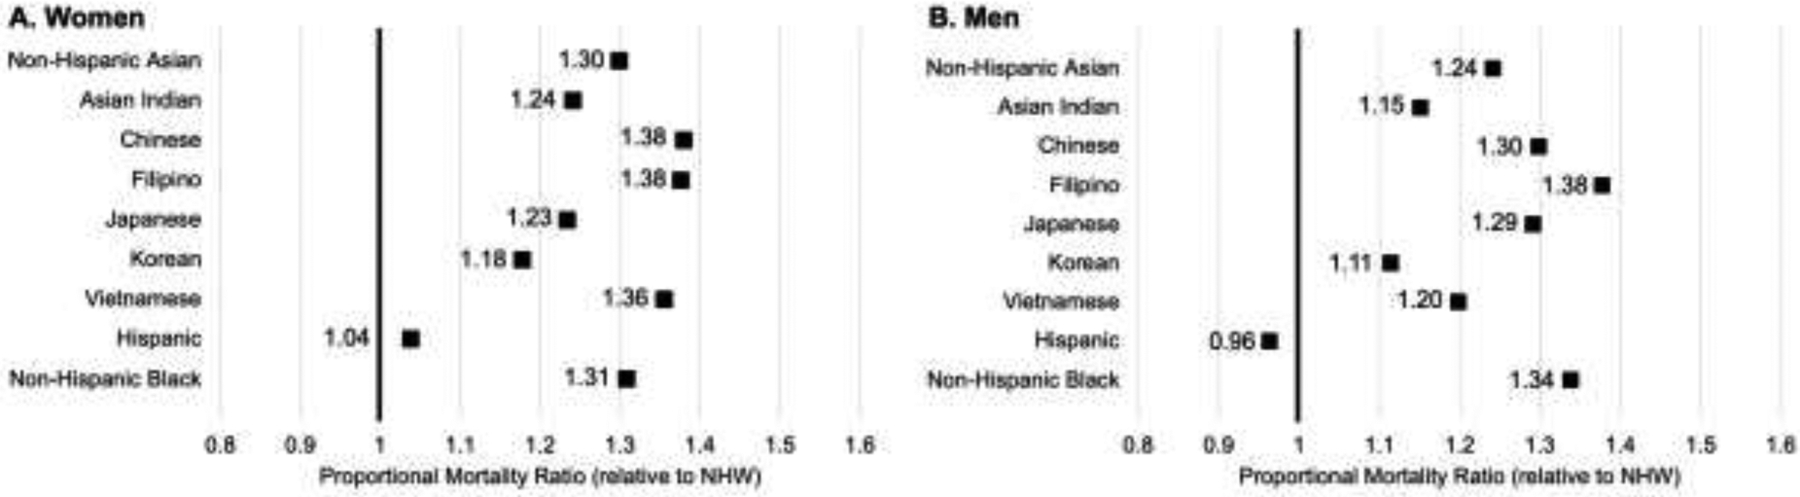
Proportional mortality ratio represents the proportion of deaths due to hypertension-related cardiovascular disease in racial and ethnic subgroups relative to the proportion of deaths due to hypertension-related cardiovascular disease in non-Hispanic White (NHW) individuals. Proportional mortality in each group is shown in the Table.
Table 2.
Proportional mortality from hypertension-related cardiovascular disease across age groups, 2018–2021
| Race & Ethnic Group | Age 0–44 years | Age 45–64 years | Age 65+ years |
|---|---|---|---|
| Women | |||
| Non-Hispanic Asian | 2.1% (1.8 – 2.5) | 6.4% (6.0 – 6.7) | 13.5% (13.4 – 13.7) |
| Asian Indian | 0.9% (0.4 – 1.3) | 6.2% (5.2 – 7.1) | 13.5% (13.0 – 14.1) |
| Chinese | 1.7% (1.0 – 2.4) | 4.3% (3.7 – 5.0) | 14.4% (14.0 – 14.8) |
| Filipina | 4.4% (3.3 – 5.5) | 7.7% (6.9 – 8.3) | 14.2% (13.7 – 14.6) |
| Japanese | -- | 5.8% (4.4 – 7.2) | 11.8% (11.4 – 12.3) |
| Korean | -- | 4.5% (3.6 – 5.4) | 12.3% (11.7 – 12.8) |
| Vietnamese | 1.3% (0.5 – 2.1) | 6.5% (5.4 – 7.5) | 14.5% (13.9 – 15.2) |
| Hispanic | 1.8% (1.7 – 1.9) | 6.6% (6.5 – 6.8) | 11.7% (11.5 – 11.8) |
| Non-Hispanic Black | 5.0% (4.9 – 5.2) | 11.8% (11.6 – 11.9) | 13.2% (13.1 – 13.3) |
| Non-Hispanic White | 2.0% (2.0 – 2.1) | 6.5% (6.4 – 6.5) | 10.0% (10.0 – 10.1) |
| Men | |||
| Non-Hispanic Asian | 4.7% (4.4 – 5.1) | 11.6% (11.3 – 12.0) | 12.1% (12.0 – 12.3) |
| Asian Indian | 3.0% (2.4 – 3.6) | 10.5% (9.7 – 11.3) | 11.9% (11.5 – 12.4) |
| Chinese | 5.8% (4.7 – 6.8) | 11.3% (10.5 – 12.2) | 12.4% (12.1 – 12.8) |
| Filipino | 8.4% (7.2 – 9.5) | 14.3% (13.4 – 15.1) | 12.6% (12.2 – 13.1) |
| Japanese | -- | 13.7% (12.1 – 15.4) | 11.8% (11.2 – 12.4) |
| Korean | 5.3% (3.9 – 6.6) | 10.2% (9.0 – 11.4) | 10.8% (10.2 – 11.4) |
| Vietnamese | 2.6% (3.0 – 4.9) | 10.3% (9.5 – 11.1) | 12.2% (11.6 – 12.7) |
| Hispanic | 2.6% (2.5 – 2.7) | 9.4% (9.3 – 9.5) | 10.9% (10.8 – 11.0) |
| Non-Hispanic Black | 4.8% (4.7 – 5.0) | 14.9% (14.7 – 15.0) | 13.2% (13.0 – 13.2) |
| Non-Hispanic White | 2.8% (2.7 – 2.8) | 10.0% (10.0 – 10.0) | 9.6% (9.5 – 9.6) |
Data shown is proportional mortality (95% confidence interval). Proportional mortality not available in some subgroups at age 0–44 years due to relatively few deaths in these groups.
Conclusions
There was substantial heterogeneity in hypertension-related CVD ASMR and proportional mortality across Asian American subgroups in 2018–2021. Filipino adults had the highest ASMR from hypertension-related CVD mortality compared with other Asian subgroups. While ASMR were lower in Asian subgroups relative to non-Hispanic White adults, the proportion of deaths that occurred due to hypertension-related CVD was higher in all Asian subgroups compared with the non-Hispanic White group. Among men, proportional mortality from hypertension-related CVD was high in middle age.
The heterogeneous mortality patterns in Asian subgroups observed are consistent with prior studies that have documented differences in CVD mortality in both national and regional samples of Asian American individuals.5 The highest burden of hypertension-related CVD mortality in Filipino individuals aligns with disproportionately higher rates of other cardiometabolic risk factors in this group, including obesity and diabetes.6 Such heterogeneity may be related to differences in social determinants among Asian American subgroups that may influence the detection and management of hypertension. These factors may include socioeconomic position, language and health literacy, and access to preventive health care services.7 Furthermore, differences among Asian subgroups in health behaviors that are related to HTN and CVD risk, such as dietary pattern and physical activity, may contribute to a higher burden of hypertension and consequent CVD mortality.8 Asian Americans also have lower hypertension awareness and control rates compared with White Americans, so improving screening and management is particularly important to reduce the observed excess burden of hypertension-related CVD mortality.9
Limitations
The primary strength of this analysis is estimation of national-level mortality patterns in disaggregated Asian subgroups, which is consistent with appropriate representation of this population.10 However, several limitations of this analysis are noted. Death certificate data may be subject to potential miscoding of hypertensive diseases or CVD, misclassification of race or ethnicity, or underestimation of the burden of hypertension-related CVD mortality if hypertension is not listed as a contributing cause. Additionally, since these data focus on mortality ascertained from death certificates, we were unable to evaluate the role of hypertension in non-fatal CVD. This analysis focused on the six largest Asian subgroups in the US, but there are additional Asian populations that may also experience disparities that are not available in vital statistics data. Further, disaggregation of Hispanic subgroups was not available.
These findings provide robust, and contemporary estimates of hypertension-related CVD mortality patterns in Asian American subgroups, a population that is rapidly growing but largely underrepresented and typically aggregated in cardiovascular research. There was considerable heterogeneity in ASMR and proportional mortality from hypertension-related CVD among Asian American subgroups. Community and clinical prevention efforts tailored to the factors that contribute to hypertension and CVD risk in disproportionately affected Asian American groups are necessary to reduce their burden of CVD.
Study Funding:
This study was supported in part by National Heart, Lung, and Blood Institute grants K23HL157766 to NSS, and R01HL161514 and R01HL159250 to SSK.
Financial Disclosures:
MDH has pending patents for heart failure polypills. George Health Enterprises Pty Ltd (GH) and its subsidiary, George Medicines Pty Ltd, have received investment funds to develop fixed-dose combination products, including combinations of blood pressure-lowering drugs. GH is the social enterprise arm of The George Institute for Global Health. No other financial disclosures have been reported by other authors of this paper.
Footnotes
Publisher's Disclaimer: This is a PDF file of an unedited manuscript that has been accepted for publication. As a service to our customers we are providing this early version of the manuscript. The manuscript will undergo copyediting, typesetting, and review of the resulting proof before it is published in its final form. Please note that during the production process errors may be discovered which could affect the content, and all legal disclaimers that apply to the journal pertain.
Conflicts of Interest: The authors report no conflicts of interest.
References
- 1.Shah NS, Xi K, Kapphahn KI, et al. Cardiovascular and Cerebrovascular Disease Mortality in Asian American Subgroups. Circ Cardiovasc Qual Outcomes. 2022;15(5):e008651. [DOI] [PMC free article] [PubMed] [Google Scholar]
- 2.Shah NS, Palaniappan LP, Khan SS. Proportional Mortality From Ischemic Heart Disease Among Asian American Subgroups, From 2018 to 2020. JAMA Intern Med. 2022;182(10):1101–1103. [DOI] [PMC free article] [PubMed] [Google Scholar]
- 3.Gordon NP, Lin TY, Rau J, Lo JC. Aggregation of Asian-American subgroups masks meaningful differences in health and health risks among Asian ethnicities: an electronic health record based cohort study. BMC Public Health. 2019;19(1):1551. [DOI] [PMC free article] [PubMed] [Google Scholar]
- 4.Flood S, King M, Rodgers R, Ruggles S, Warren JR, Westberry M. Integrated Public Use Microdata Series, Current Population Survey: Version 9.0 [dataset]. Minneapolis, MN: IPUMS, 2021. 10.18128/D030.V9.0 [DOI] [Google Scholar]
- 5.Jung MY, Lee S, Thomas SB, Juon HS. Hypertension Prevalence, Treatment, and Related Behaviors Among Asian Americans: An Examination by Method of Measurement and Disaggregated Subgroups. J Racial Ethn Health Disparities. 2019;6(3):584–593. [DOI] [PMC free article] [PubMed] [Google Scholar]
- 6.Shah NS, Luncheon C, Kandula NR, Cho P, Loustalot F, Fang J. Self-Reported Diabetes Prevalence in Asian American Subgroups: Behavioral Risk Factor Surveillance System, 2013–2019. J Gen Intern Med. 2022;37(8):1902–1909. [DOI] [PMC free article] [PubMed] [Google Scholar]
- 7.Powell-Wiley TM, Baumer Y, Baah FO, et al. Social Determinants of Cardiovascular Disease. Circ Res. 2022;130(5):782–799. [DOI] [PMC free article] [PubMed] [Google Scholar]
- 8.Satish P, Sadaf MI, Valero-Elizondo J, et al. Heterogeneity in cardio-metabolic risk factors and atherosclerotic cardiovascular disease among Asian groups in the United States. Am J Prev Cardiol. 2021;7:100219. [DOI] [PMC free article] [PubMed] [Google Scholar]
- 9.Aggarwal R, Chiu N, Wadhera RK, et al. Racial/Ethnic Disparities in Hypertension Prevalence, Awareness, Treatment, and Control in the United States, 2013 to 2018. Hypertension. 2021;78(6):1719–1726. [DOI] [PMC free article] [PubMed] [Google Scholar]
- 10.Shah NS, Kandula NR. Addressing Asian American Misrepresentation and Underrepresentation in Research. Ethn Dis. 2020;30(3):513–516. [DOI] [PMC free article] [PubMed] [Google Scholar]