

Abstract
Organisms display a considerable variety of body sizes and shapes, and macroevolutionary investigations help to understand the evolutionary dynamics behind such variations. Turtles (Testudinata) show great body size disparity, especially when their rich fossil record is accounted for. We explored body size evolution in turtles, testing which factors might influence the observed patterns and evaluating the existence of long‐term directional trends. We constructed the most comprehensive body size dataset for the group to date, tested for correlation with paleotemperature, estimated ancestral body sizes, and performed macroevolutionary model‐fitting analyses. We found no evidence for directional body size evolution, even when using very flexible models, thereby rejecting the occurrence of Cope's rule. We also found no significant effect of paleotemperature on overall through‐time body size patterns. In contrast, we found a significant influence of habitat preference on turtle body size. Freshwater turtles display a rather homogeneous body size distribution through time. In contrast, terrestrial and marine turtles show more pronounced variation, with terrestrial forms being restricted to larger body sizes, up to the origin of testudinids in the Cenozoic, and marine turtles undergoing a reduction in body size disparity after the extinctions of many groups in the mid‐Cenozoic. Our results, therefore, suggest that long‐term, generalized patterns are probably explained by factors specific to certain groups and related at least partly to habitat use.
Keywords: ancestral states estimation, Cope's rule, evolutionary models, Testudinata
In this work, we characterize deep‐time patterns of body evolution in turtles (Testudinata), using the most comprehensive dataset to date and employing different comparative methods. Our results suggest that through‐time patterns of turtle body evolution were determined by lineage‐specific specializations, such as habitat choice. In contrast, global trends were rejected, such as the presence of Cope's rule and an overall influence of environmental temperature on body size.

1. INTRODUCTION
Organisms have evolved a remarkable disparity of body plans, sizes, and functions (Smith et al., 2016), and the relationship between phenotypic evolution and species diversification is a widely discussed subject in evolutionary biology (e.g., Cooney & Thomas, 2021; Stanley, 1973). Body size in particular has been shown to affect several traits in organisms, especially life history (Brown et al., 1993; White et al., 2022), metabolic rates (Blanckenhorn, 2000; Clauss et al., 2007; D'Amico et al., 2001), and ecology (Brown & Maurer, 1986; Smith et al., 2018; White et al., 2007). For such reasons, the topic has always intrigued researchers, and its role in microevolution (i.e., natural and artificial selection) and macroevolution (e.g., acquisition of new traits or production of ecological opportunities) has been extensively debated (Blanckenhorn, 2000; Maurer et al., 1992; Peters, 1983; Schmidt‐Nielsen & Knut, 1984; Stanley, 1973).
The evolution of body size is commonly explained in the light of different hypotheses that attempt to elucidate patterns of disparity, such as Cope's rule (or Deperet's rule; Stanley, 1973), a hypothesized tendency lineages to evolve toward larger body sizes (Cope, 1896). Although directional trends of increasing body size have been identified in a few groups, including medium‐ to large‐bodied mammals (Alroy, 1998) and pterosaurs (Benson et al., 2014), non‐directional patterns are present in many other groups (Benson et al., 2018; Godoy et al., 2019; Laurin, 2004; Moen, 2006). The generalization of hypothesized evolution toward large body sizes has also been questioned, because there is no apparent need for selection to produce ever larger sizes in most lineages (Gould, 1988).
In spite of the presence of hypotheses to explain evolutionary variation of body size in ectothermic vertebrates, few groups have been studied in a comprehensive manner (but see Gearty & Payne, 2020; Godoy et al., 2019; Heim et al., 2015; Smith et al., 2016), with most studies focusing on groups of overall higher metabolic rates, such as mammals and dinosaurs, including birds (Benson et al., 2014, 2018; Cooper & Purvis, 2010; Cullen et al., 2020; Gearty et al., 2018; Kubo et al., 2019; Raia & Meiri, 2011). Turtles, in particular, have a rich fossil record and relatively stable phylogenetic relations, which provide a reliable framework for macroevolutionary studies. The presence of fossils is particularly important because the inclusion of deep‐time data can have a large effect on the outcomes of macroevolutionary analyses.
Turtles include 357 living species (Rhodin et al., 2021), but the fossil record of crown‐group Testudines, and that of the more inclusive group Testudinata, reveals a much richer history (Gaffney et al., 2006; Joyce et al., 2013). The early evolution of the turtle stem‐lineage is thought to have occurred in terrestrial habitats (Joyce, 2017; Joyce & Gauthier, 2004; Lautenschlager et al., 2018; Scheyer et al., 2022; Scheyer & Sander, 2007), but aquatic habits evolved toward the crown group, and represents the ancestral condition for Testudines (Joyce, 2017; Joyce & Gauthier, 2004; Sterli et al., 2018). Therefore, possibly reflecting the different habitats occupied through time (although not only for that reason), the group shows considerable morphological disparity in their limbs, skull, carapace shape, and body size (Benson et al., 2011; Dickson & Pierce, 2019; Foth et al., 2017; Hermanson et al., 2022; Jaffe et al., 2011; Joyce & Gauthier, 2004; Lautenschlager et al., 2018; Vlachos & Rabi, 2018).
Considering the relatively low extant diversity of turtles, particularly when compared to mammals, birds, or squamates, the body size disparity of the group is striking. The smallest living testudine, Homopus signatus, has an adult carapace length of about 100 mm, and the largest one, Dermochelys coriacea, reaches more than 2200 mm (Rhodin et al., 2021). Furthermore, fossils display an even broader range of body sizes, including the South American Stupendemys geographicus, with a carapace length of more than 2800 mm (Cadena et al., 2020). This emphasizes the importance of including the available fossil diversity when characterizing patterns of body size evolution in Testudinata (and see Finarelli & Flynn, 2006; Fritz et al., 2013), which has been largely disregarded in most previous attempts (Eastman et al., 2011; Jaffe et al., 2011; Moen, 2006; Uyeda & Harmon, 2014).
Using data from living species only, previous studies presented several hypotheses to explain the observed body size variation of turtles. For example, it has been suggested that such variation is intrinsically related to habitat, with marine species and island tortoises usually possessing larger sizes than freshwater and mainland taxa (Jaffe et al., 2011). This resembles the large body size attained by marine mammals (e.g., Gearty et al., 2018) and, in some aspects, the “island rule” seen in some mammals, reptiles, and birds (Lomolino, 2005). However, Uyeda and Harmon (2014) analyzed turtle body size using unconstrained evolutionary models and suggested that the scenario for turtle optimal body size is more complex than simple differences in habitats, with multiple macroevolutionary body size shifts along the tree. Furthermore, analysis of tortoise (Testudinidae) body size, including fossils, did not find support for the island effect (Vlachos & Rabi, 2018). Moen (2006) tested for evolutionary trends in extant cryptodires, but found no support for directional body size evolution. Moreover, it is not currently clear how temperature influenced long‐term body size patterns in turtles, with ongoing discussion about the group following overall rules such as a latitudinal gradient, with larger body sizes seen in colder regions (Angielczyk et al., 2015; Ashton & Feldman, 2003). Yet, except for Vlachos and Rabi (2018) and Sterli et al. (2018), these hypotheses have yet to be tested in a framework including both extinct and extant taxa. In this study, we compiled the largest body size dataset ever assembled for Testudinata, which was used to investigate the tempo and mode of body size evolution in the group, as well as test for possible biotic and abiotic drivers.
2. METHODS
2.1. Body size data
Straight‐line maximum dorsal carapace length (SCL) was used as a proxy for turtle body size (Jaffe et al., 2011). Aiming to maximize sampling, we also used linear regressions to estimate SCL from the ventral skull length (measured from the rostral tip of the premaxillae to the caudal tip of the occipital condyle) for some specimens lacking carapace. About 7.5% of the SCL data in our dataset was estimated from the ventral skull length. Measurements were collected from photographs (personal archive or the literature), using software ImageJ (Schneider et al., 2012). The final dataset includes body size data for 795 taxa, considerably more than in previous studies (e.g., Angielczyk et al., 2015 = 245 taxa; Jaffe et al., 2011 = 226 taxa; Moen, 2006 = 201 taxa; Vlachos & Rabi, 2018 = 59 taxa). In addition, we also collected habitat preference and chronostratigraphic information for these same taxa using the literature and the Paleobiology Database (PBDB).
2.2. Supertree construction and time calibration
To account for major uncertainties within the phylogenetic relations of the main groups of Testudinata, two informal supertrees were manually assembled using Mesquite version 3.61 (Maddison & Maddison, 2018). These were based on two phylogenetic hypotheses, Evers et al. (2019) and Sterli et al. (2018), hereafter referred to as “Ev19” and “St18,” respectively. The most significant differences between the two supertrees are the positions of Protostegidae and Thalassochelyidia (sensu Joyce et al., 2021). Protostegids are stem‐Chelonioidea and Thalassochelyidia are stem‐Pleurodira in “Ev19,” whereas both groups belong to the turtle stem‐lineage in “St18” (in which they are originally represented only by Santanachelys gaffneyi and Solnhofia parsoni, respectively). Less inclusive groups were positioned based on several additional hypotheses (Table A1). Both supertrees include four outgroup taxa (Eunotosaurus africanus, Eorhynchochelys sinensis, Pappochelys rosinae, and Odontochelys semitestacea), which were used for calibration purposes. Each supertree includes a total of 846 taxa, 659 of which are shared with our body size dataset.
Both supertrees were time‐scaled using Bayesian inference under a fossilized birth death process (Heath et al., 2014; Stadler, 2010), performed with MrBayes version 3.2.7 (Ronquist et al., 2012). We used R (version 4.0.2; R Core Team, 2021) package paleotree (Bapst, 2012) to create a MrBayes command for time‐calibration analyses. The function createMrBayesTipDatingNexus() allows the use of “empty” morphological matrices in clock‐less tip‐dating analyses (Bapst, 2012; Gearty & Payne, 2020; Godoy et al., 2019). The two supertrees (“Ev19” and “St18”) were entered as topological constraints (i.e., for two separate time‐scaling analyses) and data on occurrence times (= tip ages) were obtained from the primary literature and supplemented by the PBDB. We used uniform constraints on the tip ages, and the tree age prior was set as a uniform distribution defined between the Kungurian and Roadian stages of the Permian (283.5 and 268.8 million years ago, Ma), as this would represent a maximum possible age for the origin of the group. All other priors were unaltered from the default setting of the createMrBayesTipDatingNexus() function, which were guided by the best practices of Matzke and Wright (2016; see Gearty & Payne, 2020 for more details). Two MCMC runs, with four chains each, were set for 20,000,000 generations, with 25% of the trees discarded as burn‐in. Convergence of both runs was verified when values of potential scale reduction factors approached 1.0 and average standard deviation of split frequencies was below 0.01. For both supertrees, we used either the maximum clade credibility (MCC) tree or a set of 10 randomly selected trees from the post‐burn‐in posterior to perform subsequent analyses.
2.3. Characterizing body size patterns in Testudinata
The entire body size dataset of 795 taxa was used to construct body size through‐time plots. Welch's two sample t‐tests (Welch, 1947) were used to assess significant changes across different time intervals (i.e., Triassic, Jurassic, Early Cretaceous, Late Cretaceous, Paleogene, Neogene, and Quaternary), focusing on mean body size and disparity, using the standard deviation as a metric of body size disparity. To assess the influence of ecology on the body size distribution, habitat preference information (i.e., terrestrial, freshwater, and marine) was also incorporated into the body size through‐time plots. To further test the influence of ecology, we used analysis of variance (ANOVA), performed with R function aov(), as well as the RRPP approach (randomizing residuals in a permutation procedure; Adams & Collyer, 2018), which accounts for phylogenetic dependency (i.e., “phylogenetic ANOVA”), performed with the lm.rrpp() function, from the R package RRPP (Collyer & Adams, 2018, 2019), and using the MCC tree of each supertree (“Ev19” and “St18”).
We also tested for the presence of phylogenetic signal in the body size data using the R function phyloSignal() (Keck et al., 2016), using 10 randomly selected trees from the posterior distribution of trees of both supertrees. We used 1000 replicates and estimated Pagel's lambda (λ) as our metric of phylogenetic signal given that this index is robust when using trees with poorly resolved branch length information (Molina‐Venegas & Rodríguez, 2017; Münkemüller et al., 2012).
To further characterize body size evolution within Testudinata, we used maximum likelihood to estimate ancestral body sizes under Brownian motion (BM), using the fastAnc() function of the R package phytools (Revell, 2012). Inferred ancestral sates were performed with both the complete supertrees (i.e., using the MCCT trees with all 659 taxa, including fossils and extant species) and a subtree with only extant taxa (i.e., dataset reduced to 312 taxa).
2.4. Testing for the presence of Cope's rule
To test if Cope's rule played an important role in turtle body size evolution, we fitted different evolutionary models to our body size data in both supertrees. To account for temporal and phylogenetic uncertainties, 10 time‐scaled versions of each alternative supertree (“Ev19” and “St18”) were used.
We fitted four uniform phenotypic models to our data, starting with the uniform BM model, in which body size undergoes an unconstrained, single‐rate random walk along phylogenetic lineages, resulting in diffusive evolutionary expansion (Felsenstein, 1973, 1985; Freckleton & Harvey, 2006). This pattern is consistent with several possible causes, including genetic drift or wandering adaptive optima (Felsenstein, 2003), between which genetic drift seems a less likely explanation at macroevolutionary scales. The model has two parameters: sigma squared (σ 2), which indicates evolutionary rate, and the root state of the trait at time zero, sometimes represented by X(0) (Felsenstein, 1973).
We also fitted three other uniform models: (1) the “mean_trend” (or “drift”) model, which is a modification of the BM model that incorporates a parameter (μ) describing an uniform directional trend along all branches of the phylogeny (Pagel, 2002); (2) the EB model (also known as “ACDC model”; Blomberg et al., 2003), in which lineages experience a burst of rapid increase in trait variation in the beginning of their evolutionary history, followed by a deceleration (Harmon et al., 2010); (3) the Ornstein–Uhlenbeck (OU) model, which incorporates attraction of trait values (represented by the α parameter) toward an optimum (θ) (Butler & King, 2004; Hansen, 1997). In the case of the OU model fitted here, the parameters (α and θ) were not allowed to vary along the tree.
We also fitted 13 non‐uniform trend‐like models to our data. Unlike uniform “mean_trend” model, these multi‐regime models allow the μ parameter—the amount of directional change in a trait through time (Hunt & Carrano, 2010; Pagel, 2002)—to vary along the tree in temporal or node shifts (“time‐shift model” and “node‐shift model,” respectively). We fitted “time‐shift” models (which allow shifts in all branches after a determined point in time) allowing the number of shifts to vary from one to three; and “node‐shift” models (which allow shifts in some branches) allowing the number of shifts to vary from 1 to 10, resulting in a total of 13 multi‐trend models (3 “time‐shift” and 10 “node‐shift” models). In this study, both uniform trend and multi‐trend models were fitted as a representation of the Cope's rule, given that it is described as a multi‐lineage directional trend toward larger sizes (Cope, 1887, 1896; Stanley, 1973). Moreover, among mammals, the foundational example of Cope's rule, directional body size evolution is only present in some lineages (e.g., Alroy, 1999), more consistent with a “node‐shift” model, with multiple independent origins of directional evolution.
Akaike's information criterion for finite sample sizes (AICc) was used for the selection of the best fit (Akaike, 1974). Model‐fitting analyses were performed using R package geiger (Harmon et al., 2008) and the scripts made available by Benson et al. (2018) for fitting the multi‐trend models, using the R packages mnormt (Azzalini & Genz, 2022), ape (Paradis & Schliep, 2019), geiger (Harmon et al., 2008), phytools (Revell, 2012), phangorn (Schliep, 2011), and surface (Ingram & Mahler, 2013).
2.5. Influence of paleotemperature
We used regressions to test for the possible influence of global paleotemperature on turtle body size (795 taxa). As a proxy for paleotemperature, we compiled δ18O data (lower δ18O values indicate higher environmental temperature) from two different sources. First, we used tropical isotopic data collected in tropical regions by Prokoph et al. (2008), who assembled isotopic information from marine organisms, extending from Precambrian to recent. Furthermore, we also used global paleotemperature data from Zachos et al. (2008), which compiled information about isotopic ratios in foraminifer shells from the Maastrichtian to the recent. We tested for correlation between both temperature curves and our body size indices, including maximum, minimum, and mean body size, as well as body size disparity (= standard deviation).
Correlation between body size data and paleotemperature was initially assessed using ordinary least squares. In addition, to avoid potential issues created by temporal autocorrelation, we used generalized least squares with a first‐order autoregressive model incorporated (tsGLS; Fox & Weisberg, 2018), using the R package nlme (Pinheiro et al., 2022). The data were divided into time intervals, using approximately equal‐length (~9 million years) stratigraphic time bins (from Mannion et al., 2015). For each time bin, we calculated body size indices (disparity [= standard deviation], maximum, minimum, and mean body size) and weighted mean δ18O values using R package disparity (Guillerme, 2018).
The figures presented by this study were made using the R packages palaeoverse (Jones et al., 2023) and deeptime (Gearty, 2023).
3. RESULTS
3.1. Inferred ancestral states
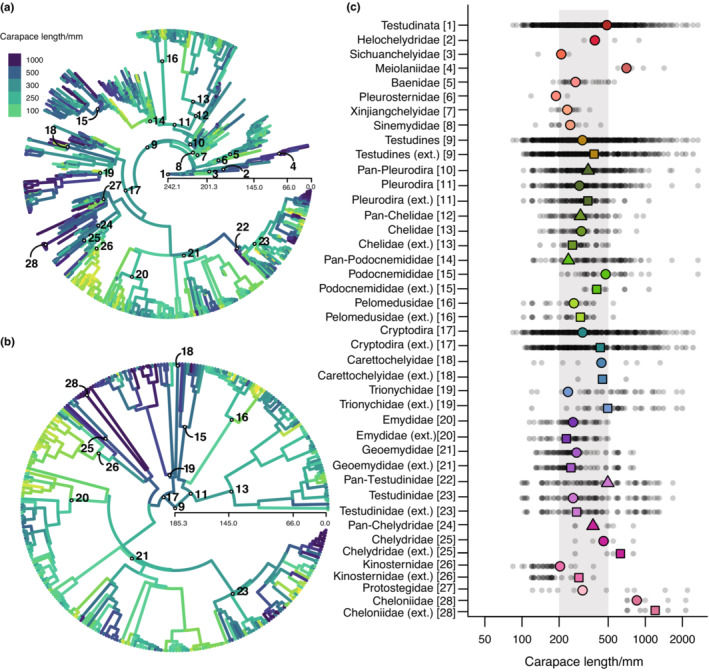
Inferred ancestral states based on both supertrees (“Ev19” or “St18”; Figure A3 and Figure 1) show similar results. For this reason, the description below is based solely on “St18” (Figure 1).
FIGURE 1.
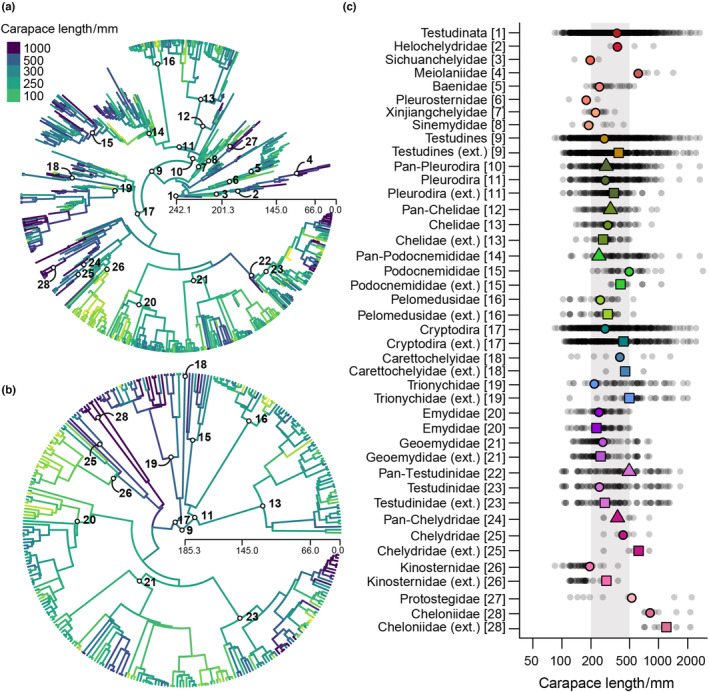
Ancestral body sizes (log10 maximum dorsal carapace length in millimeters) mapped onto Testudinata phylogeny (“St18”), with (a) complete tree and (b) extant‐only subtree. Ancestral body size for different taxonomic groups (c); small gray dots indicate all taxa within that lineage; colored triangles represent the ancestral estimates of stem‐groups; circles represent ancestral estimates of the crown groups; and squares represent ancestral estimates of the crown groups without the fossil taxa. Gray area indicates sizes between 200 and 500 mm. The numbers indicate the same groups in a–c.
When fossil taxa are included in the analysis, ancestral size estimates for most major (= more diverse) turtle subgroups (e.g., Testudines, Pleurodira, Chelidae, Pelomedusidae, Cryptodira, Trionychidae, and Testudinidae) were broadly similar to one another, with SCL values between 500 and 230 mm (Figure 1c). Similar ancestral values are also seen among stem‐turtles, with paracryptodires remaining within approximately this body size range throughout their evolution and meiolaniids increasing their body size over time, from an ancestral body size estimated in 645 mm (Figure 1). Among pleurodires, several extinct branches splitting before the origin of Podocnemididae show smaller body sizes (between 100 and 250 mm; Figure 1a,c), although the estimated ancestral body size for Podocnemididae is larger (between 300 and 500 mm; Figure 1c). Within Cryptodira, crown‐groups Testudinidae, Geoemydidae, and Emydidae have similar ancestral body sizes (about 250 mm; Figure 1c). Chelonioidea show ancestral body sizes above 500 mm, and Kinosternidae was one of the few main clades with an estimated ancestral body size close to (or slightly above) 200 mm.
The inclusion of fossils affects ancestral body size estimate for most major lineages (compare square symbols [ignoring fossils] to circles [including fossils] in Figure 1c). No specific directional influence is noted when paleontological data are included. For some groups (e.g., Chelidae, Podocnemididae, Emydidae, Geoemydidae), the inclusion of extinct taxa results in a slight increase in estimated body sizes, whereas for others (e.g., Pelomedusidae, Trionychidae, Testudinidae, Chelydridae, Kinosternidae, Cheloniidae), a decrease is observed. The magnitude of this effect varies; the largest changes were seen in the nodes circumscribing Cryptodira, Trionychidae, Chelydridae, Kinosternidae, and Cheloniidae (Figure 1). It is worth noting that even a slight increase in fossil sampling changed the estimates in relation to previous studies. For instance, the ancestral body size for Pan‐Testudinidae—based on 78 taxa (53 living and 25 extinct)—is 496.3 mm. Larger than the 370 mm estimated by Vlachos and Rabi (2018), which included 59 taxa (23 living and 36 extinct). Moreover, our ancestral body size estimate for Testudines (345 mm) is smaller than that estimated by Sterli et al. (2018; 359 mm), whereas our Testudinata ancestral body size is much smaller (396 mm, in comparison to 570 mm estimated by Sterli et al., 2018). More importantly, however, some similar patterns are observed between our results and those by Sterli et al. (2018), such as the body size increase seen in Podocnemididae and the decrease seen in Kinosternidae.
3.2. Model fitting
The AICc scores for all the evolutionary models fitted to the turtle trees and body size data show an overwhelmingly stronger support (i.e., lower AICc values) for the uniform OU model, even when compared to the non‐uniform multi‐trend models. Consistently, this stronger support for the OU model was found when using both “Ev19” and “St18” topologies (Table 1). These results rule out the presence of trend‐like processes (either uniform or multi‐trend) in the body size evolution of Testudinata, at least when the entire tree is considered.
TABLE 1.
Results of model‐fitting analyses, depicting model parameters and AICc scores for the models fitted to our body size dataset of Testudinata (log10 maximum dorsal carapace length) and 10 time‐calibrated trees for each of the two initial supertree topologies (“St18,” based on the hypothesis of Sterli et al., 2018, and “Ev19,” based on the hypothesis of Evers et al., 2019).
| Supertree | St18 | Ev19 | ||||||
|---|---|---|---|---|---|---|---|---|
| Parameter | BM | EB | OU | “Best” trend | BM | EB | OU | “Best” trend |
| AICc | 782.09 | 784.11 | 96.69 | 665.15 | 976.62 | 978.64 | 105.28 | 861.80 |
| σ 2 | 0.0142 | 0.0142 | 0.5833 | 0.0128 | 0.0185 | 0.0185 | 1.7895 | 0.432 |
| X(0) | 474.68 | 474.68 | 325.39 | 411.91 | 466.66 | 466.66 | 324.56 | 401.61 |
| α | – | – | 0.807 | – | – | – | 1.1089 | – |
| μ 1 | – | – | – | 0.0023 | – | – | – | 0.0024 |
| μ 2 | – | – | – | −0.7601 | – | – | – | – |
| μ 3 | – | – | – | −0.0238 | – | – | – | – |
| μ 4 | – | – | – | −0.3237 | – | – | – | – |
| μ 5 | – | – | – | −0.7850 | – | – | – | – |
Note: Models: BM (Brownian Motion model), EB (Early Burst/ACDC model), OU (Ornstein–Uhlenbeck model), and “best” trend (the model with best fit [AICc scores] among the 14 trend‐like models fitted [1 uniform and 13 non‐uniform models], which in the case of “St18” is represented by the non‐uniform trend model with 4 “time‐shifts,” and in the case of “Ev19” is represented by the uniform trend model). Mean values of model parameters are shown for the 10 time‐calibrated trees: σ 2 (sigma squared, the Brownian variance, or rate parameter), X(0) (estimated trait value [back‐transformed to mm] at the root of the tree, also known as Z 0; for the OU model, this is the same as the optimum value or θ), α (alpha, the strength of attraction), and μ (the trend parameters, describing a uniform directional trend along all branches of the phylogeny, with the number of parameters varying according to the number of shifts). The mean AICc scores indicate overwhelming support (i.e., lower AICc values) to the OU model over the other models.
3.3. Correlation with paleotemperature
No significant correlation was observed between global paleotemperature and mean, minimum, or maximum body size of Testudinata through time (Table A2). However, we did find a significant, but weak correlation between body size disparity (= standard deviation of body sizes) and paleotemperature (Table 2; Figure 2), with disparity increasing at lower temperatures (i.e., higher δ18O values). Although significant, this correlation is relatively weak when palaeotemperature data from Prokoph et al. (2008) are used, but it becomes slightly stronger when using data from Zachos et al. (2008), which is restricted to the Late Cretaceous‐Recent time interval. This may suggest that the influence of environmental temperatures on turtle body size was stronger during the Cenozoic.
TABLE 2.
Results of time series generalized least squares (tsGLS) and ordinary least squares (OLS) regressions using turtle body size disparity and paleotemperature data.
| tsGLS | OLS | ||||||||||||
|---|---|---|---|---|---|---|---|---|---|---|---|---|---|
| Phi | p. R 2 | AIC | Var. | Coef. | t‐Value | p‐Value | p. R 2 | AIC | Var. | Coef. | t‐Value | p‐Value | |
| Body size SD | 0.701 | −.006 | −68.168 | interc. | 0.242 | 6.508 | <.000 | −.019 | −55.638 | interc. | 0.261 | 10.152 | <.000 |
| ~δ18O (Prokoph) | δ18O | 0.025 | 1.766 | .091 | δ18O | 0.038 | 2.240 | .036 | |||||
| Body size SD | −0.297 | −.001 | −52.563 | interc. | 0.248 | 38.476 | <.000 | −.002 | −53.951 | interc. | 0.251 | 30.528 | <.000 |
| ~δ18O (Zachos) | δ18O | 0.014 | 3.811 | .005 | δ18O | 0.012 | 2.662 | .028 | |||||
Note: Body size disparity (standard deviation of log10 maximum dorsal carapace length in millimeters) and paleotemperature (δ18O data as a proxy for paleotemperature from two different sources: Prokoph et al., 2008; Zachos et al., 2008) data were divided into time bins (24 time‐bins when the Prokoph et al., 2008 δ18O data were used and 10 time‐bins when the Zachos et al., 2008 data were used).
Abbreviations: Coef., coefficient; interc., intercept; p.R 2, Nagelkerke pseudo R‐squared; SD, standard deviation; Var., variable.
FIGURE 2.
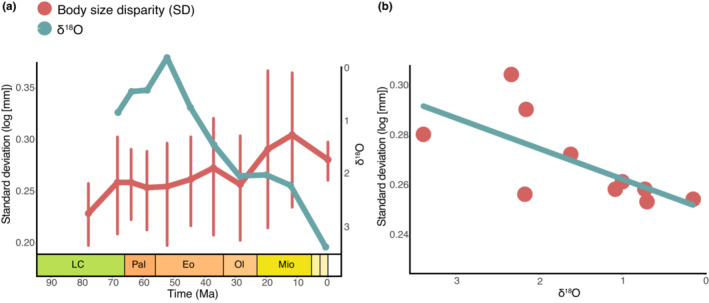
(a) Through‐time patterns of Testudinata body size disparity (standard deviation of log10 maximum dorsal carapace length in millimeters) and paleotemperature (δ18O isotopic data from Zachos et al., 2008) during the last ~70 Ma. Error bars were calculated by bootstrapping the disparity data 500 times. δ18O is used as proxy for paleotemperature and is inversely proportional to temperature. (b) Linear regression (OLS) between turtle body size disparity and δ18O data (regression results shown in Table 2).
3.4. Differences among ecological habitats
Freshwater is the most common habitat occupied by turtles from the Jurassic onwards, and this category is therefore the most influential to the aggregated pattern of turtle body size variation through time. No significant changes in either disparity or mean body size of freshwater turtles occurred since the Late Cretaceous (Figure 3b,d). A significant increase in mean body size in freshwater turtles was identified between the Early (234 mm) and the Late Cretaceous (346 mm) (p‐value = .001146). In general, freshwater turtles are more frequently represented among the smallest body sizes, and only rarely among the largest ones (Figure 3b).
FIGURE 3.

Temporal distribution of body sizes (log10 maximum dorsal carapace length in millimeters) in turtles for different ecological habitats. Gray dots represent all taxa, whereas colored dots represent taxa subdivided into three ecological categories. (a) terrestrial taxa (red dots); (b) freshwater taxa (light green dots); (c) and marine taxa (light blue dots). Horizontal gray segments represent the range of occurrence of each taxon; (d) Boxplot showing body size of different ecological categories divided into time intervals. Silhouettes adapted from Jaffe et al. (2011).
Diversity in terrestrial turtles is low until the Paleogene, when the first tortoises (Testudinidae) appear in the fossil record (Figure 3a). The mean body size of terrestrial turtles is consistently larger than that of freshwater species through time, except during the Neogene (Figure 3d). From the Triassic to the Late Cretaceous, terrestrial turtles experienced a significant increase in mean body size (from 272 to 443 mm; p‐value = .02865). However, body size disparity is low, as expected from the low number of species, and the group is mostly represented by medium‐ or large‐bodied forms (Figure 3a).
The first marine turtles appeared at the end of the Jurassic, with body sizes like those of other groups (Figure 3c). There is a noteworthy (although not significant; p‐value = .3872) increase in the mean body size of marine turtles from the Jurassic to the Early Cretaceous, and a small drop in the Late Cretaceous (Figure 3c,d), but the latter interval witnessed the highest variability in body sizes among marine turtles in the series (Figure 3c). After the K‐Pg transition, the range of body sizes decreased substantially, although the mean remains similar. After that, from the Neogene to the Quaternary, a significant increase in mean body size (p‐value = .003958), from 413 to 1036 mm, was detected for marine turtles (Figure 3c,d).
We found that ecological habitat is significantly linked to body size in turtles using ANOVA (Table 3). However, when the phylogenetic structure of the data is taken into account (using phylogenetic ANOVA; Table 3), this association is only significant for the freshwater and terrestrial ecological categories. Moreover, for all trees tested here, we found a strong phylogenetic signal in body size data (λ > 0.856; p < .001).
TABLE 3.
Results of ANOVA and PhyloANOVA exploring the relationship between Testudinata body size (log10 maximum dorsal carapace length in millimeters) and different ecological categories: terrestrial (n = 145), freshwater (n = 563), and marine (n = 87).
| ANOVA results | df | SS | MS | F‐value | p‐Value |
|---|---|---|---|---|---|
| ANOVA | 2 | 4.77 | 2.3868 | 36.55 | <.0001* |
| PhyloANOVA | 2 | 0.0323 | 0.0161295 | 1.8106 | .109 |
| Pairwise comparison (p‐values) | Marine–fresh. | Terrestrial–fresh. | Terrestrial–Marine |
|---|---|---|---|
| ANOVA | <.0001* | <.0001* | .502 |
| PhyloANOVA | .801 | .04* | .176 |
Note: Pairwise comparisons between ecological categories also shown.
Abbreviations: df, degrees of freedom; MS, mean squares; SS, sum of squares.
Significant at alpha = .05.
4. DISCUSSION
4.1. Body size patterns and ancestral estimates: The effect of including fossils
Despite previous controversies (e.g., Patterson, 1981), it has become increasingly clear that the paleontological record is crucial to answer macroevolutionary questions (Fritz et al., 2013; Louca & Pennell, 2020; Quental & Marshall, 2010). In particular, it is well documented that the inclusion of fossils affects the estimation of ancestral states and evolutionary rates (e.g., Puttick, 2016; Slater et al., 2012). Nevertheless, extinct taxa are often neglected in such analyses, having so far been included in only two macroevolution studies of turtle body size (Sterli et al., 2018; Vlachos & Rabi, 2018).
As already noted by Jaffe et al. (2011), examining the evolution of body size in the fossil record of turtles might provide new insights not revealed by previous analyses. Based on a sample of 536 extinct taxa, our study was the first comprehensive attempt in that direction, confirming the impact of including fossils on estimates of both divergence times (Figures A1 and A2) and ancestral body sizes (Figure 1 and Figure A3). The latter has been affected for most lineages assessed here, but to different degrees (Figure 1), with no directional effect on the estimates (Figure 1). This differs from the pattern seen in mammals, for which ancestors have considerably larger body sizes when estimated using fossils (e.g., Finarelli & Flynn, 2006; Finarelli & Goswami, 2013). For mammals, these results were explained by the widespread occurrence of directional evolution toward large body sizes from small ancestors (Alroy, 1999; Smith et al., 2010), a pattern not observed in turtles (see below).
4.2. Cope's rule and directional trends of body size evolution
We found no evidence for directional patterns of body size evolution in turtles (Table 1), given that none of our trend‐like models (either the uniform trend or the multi‐trend models) received more support than the uniform OU model. This result is consistent with previous investigation by Moen (2006), which also found no support for Cope's rule when analyzing extant cryptodires (even though directional evolution may be difficult to detect on extant‐only datasets; Finarelli & Flynn, 2006; Schnitzler et al., 2017; Slater et al., 2012). Therefore, our results provide no support for the hypothesis that Cope's rule explain the evolution of large body sizes in Testudinata. They also add to the growing evidence that directional body size evolution is rare among vertebrates (Benson et al., 2018; Godoy et al., 2019; Huttenlocker, 2014; Sookias et al., 2012), with the exception of mammals and pterosaurs (Alroy, 1998; Benson et al., 2014), once again challenging the generality of Cope's rule.
4.3. Influence of environmental temperature on turtle body size evolution
The relationship between abiotic factors and body size has been extensively studied, with distinct vertebrate groups being differently affected by them, especially when it comes to comparing endothermic and ectothermic organisms (Angielczyk et al., 2015; Angilletta et al., 2004; Ashton & Feldman, 2003; Mousseau, 1997; Partridge & Coyne, 1997; van der Have & de Jong, 1996; Van Voorhies, 1996). Large‐scale trends such as Bergmann's rule (i.e., the tendency of having larger body sizes at higher latitudes within a species) may play an important role for within‐species variation of body size in endotherms (Ashton et al., 2000; James, 1970; Zink & Remsen, 1986), and may explain patterns of maximum size during mammal evolution (Saarinen et al., 2014). Yet, results for ectothermic reptiles are less consistent (Angielczyk et al., 2015; Ashton & Feldman, 2003; Mousseau, 1997).
We evaluated the correlation between turtle body size distributions and paleotemperature variation through time. In general, no significant influence of temperature on mean, minimum, or maximum body size in the group was found (Table A2). Similar results were reported for crocodylomorphs, for which no significant correlation between paleotemperature and body size (mean, maximum, and minimum values) was found when the entire group is analyzed, even though a strong association between both variables is observed when only the crown group is considered (Godoy et al., 2019). Therefore, although our results indicate no overall influence of paleotemperature on the through‐time distribution of turtle mean, maximum, and minimum body sizes, we cannot rule out an influence of environmental temperatures at smaller temporal and phylogenetic scales. Indeed, environmental temperature has been a commonly proposed explanation for body size variation in different turtle clades and species, particularly affecting disparity, diversity, or distribution of less inclusive groups (e.g., Böhme, 2003; Ferreira et al., 2018; Georgalis & Kear, 2013; Vitek, 2012).
We did find a significant correlation between paleotemperature and turtle body size disparity (= standard deviation) during the Cenozoic, with periods of higher disparity associated with lower temperatures (or higher δ18O values; Figure 2). We suggest three potential explanations for this seemingly counterintuitive result. First, low temperatures might have restricted niche availability for turtles and, consequently, driven body size specialization—toward larger or smaller body sizes—to avoid competition, as seen in some extant lineages (Cunha et al., 2020; Pritchard, 2001). Conversely, colder and dryer environments could have increased availability of coastal habitats (by sea level drops), which has been associated with higher diversification rates in turtles (Thomson et al., 2021). Higher species richness might have also led to higher disparity levels in body size. Finally, the significant correlation might be an artifact from the coincidental drop in temperature over the Cenozoic and a continuous expansion in body size in turtles. Disparity constantly increases since the origin of the group, punctuated only by small drops (e.g., in the Oligocene and present time bins, Figure 2). A slow, steady disparity increase has been also noted in cranial morphology by Foth and Joyce (2016), particularly during the Mesozoic in different lineages. That would also explain the stronger correlation with the Zachos et al. (2008) curve—restricted to Cenozoic δ18O values—in relation to that using Prokoph et al. (2008), which includes the period of increasing temperatures in the Mesozoic. In any case, it seems that environmental temperature did not play a major role in determining large‐scale patterns of Testudinata body size variation through time, at least not when considering the entire group.
4.4. Body size evolution and ecological habitats
Our ANOVA results (Table 3) indicate a significant association between habitat preference and body size in turtles. This is seen in the phylogenetic ANOVA, specifically for freshwater and terrestrial habitats, indicating that evolutionary shifts of habitat correlate with directional evolutionary shifts of body size. Accordingly, through‐time body size patterns for distinct habitat categories (Figure 3) can help understanding patterns observed in different turtle subgroups, which emphasizes the importance of independently examining each of the three main turtle ecologies: freshwater, terrestrial, and marine.
Since the Jurassic, most turtles have had freshwater ecologies (Figure 3b; Joyce & Gauthier, 2004), with these turtles keeping a fairly homogeneous body size disparity (= standard deviation) through time (Figure 3b). Their wide and constant disparity of body sizes might be explained by distinct evolutionary scenarios within such habitats (Jaffe et al., 2011), with different species, closely related or not, inhabiting several disparate freshwater environments (Bonin et al., 2006). For instance, different pleurodiran and cryptodiran lineages acquired resistance to estuarine or brackish water (Agha et al., 2018; Bower et al., 2016). Also, closely related taxa occupying the same areas are known to avoid competition through body size divergence, such as extant podocnemidids (Cunha et al., 2020) and trionychids (Pritchard, 2001).
Terrestrial and marine turtles, on the other hand, are represented by fewer lineages, with more restrict evolutionary histories. The earliest turtles were terrestrial, ranging from medium‐ to large‐sized during the Mesozoic (Figure 3a–d). Meiolaniformes is the only of these stem‐lineage groups to survive until recently (until the Holocene; Sterli, 2015), displaying large to gigantic body sizes, especially after the Mesozoic. Testudinids—the only extant lineage of terrestrial turtles—appeared in the fossil record during the Paleogene and remained relatively small until at least the end of that period (Figure 3c). The Eocene–Oligocene witnessed a peak of diversity, related to the origin of crown‐group Testudinidae (Lourenço et al., 2012; Vlachos & Rabi, 2018), after which the group spread from Eurasia to most of the world. Therefore, the recent high variation in body size within tortoises might be also related to the expansion of occupied habitats (as in freshwater turtles), also associated with specific diversification and extinction dynamics within the group (e.g., Joos et al., 2022).
Extant marine turtles (Chelonioidea) exhibit low disparity, but remarkably large body sizes (Figure 3b), which might be related to morphological adaptations to a pelagic lifestyle, given that other groups of sea turtles (e.g., Thalassochelydia and Bothremydidae) are not as strongly associated with larger sizes and were probably not pelagic. The large size of marine turtles might also be explained by either physiological constraints (e.g., thermoregulation; Mrosovsky, 1980) or the need for higher dispersal abilities associated with migration (Jaffe et al., 2011). It has been previously proposed that thermoregulation and other physiological aspects (e.g., lung capacity while diving) play an important role in determining the larger body sizes of aquatic mammals and reptiles (Benson et al., 2012; Davis, 2014; Gearty et al., 2018; Gearty & Payne, 2020; Gutarra et al., 2022; Pyenson & Vermeij, 2016; Williams, 2001), by posing a minimum body size limit on these species. However, in the case of marine turtles, the fossil record shows that smaller species also existed in the past (Figure 3c,d), with Santanachelys gaffneyi from the Early Cretaceous of Brazil as one of the oldest and smallest sea turtles (200 mm; Hirayama, 1998). Therefore, in the case of Testudinata, perhaps the lower body size limit imposed by physiological constraints was not as strict as those inferred for other secondarily aquatic tetrapods (e.g., mammals). On the other hand, the shell and the necessity to lay eggs on land possibly pose constraints on the maximum body sizes achieved by marine turtles (Benson et al., 2012), which are, in general, smaller than other Mesozoic marine reptiles and extant cetaceans (Benson et al., 2012; Smith & Lyons, 2011).
Finally, intrinsic factors might also influence body size evolution in turtles. Sterli et al. (2018), for example, suggested that a reduction in size in Mesochelydia (the clade including all post‐Triassic turtles)—which is confirmed by our ancestral state estimates (Figure 1)—could be explained by paedomorphic processes, which are also evidenced by other morphological traits. The shell might also constrain the maximum body size of turtles inhabiting terrestrial and semiaquatic environments (Golubović et al., 2017; Lyson et al., 2014). It could hamper turtles from attaining sizes as large as giant mammals and dinosaurs due to a different relation between weight and body size. Moreover, minimum body sizes in turtles are overall larger than that of the smallest lissamphibians, squamates, mammals, and birds. Endothermy could explain the smaller sizes of mammals and birds (Lovegrove, 2017), but not of lissamphibians or squamates. Hence, it is possible that the shell also imposes a lower body size limit to testudinatans.
5. CONCLUSIONS
Turtle body sizes showed low disparity early in their evolutionary history. They reached substantial disparity only in the Early Cretaceous, concomitantly with the lowest mean body sizes. Habitat preference is only weakly linked to body size variation in turtles. Nevertheless, ecological transitions provide a partial explanation for differences in the body size distribution of turtle subgroups. Freshwater turtles show a constant range of body sizes and higher disparity through time, which might be related to the ecological diversity associated with these habitats. Body size in terrestrial turtles is explained by their ecological diversity, in addition to the higher dispersal ability in giant species. In sea turtles, upper and lower body size limits seem to be associated with physiological (e.g., thermoregulation) and morphological (e.g., the shell) constraints, as well as with adaptations to the pelagic lifestyle during the Quaternary.
We did not find support for a general trend‐like process leading to larger body sizes, discarding Cope's rule as an explanation for body size evolution in turtles. Also, we did not find a significant influence of paleotemperature on mean, maximum, and minimum body size. Although we found a significant, moderate correlation between temperature and body size disparity through time, this association might be an artifact caused by a join constant increasing of disparity and continuous drop in temperatures during the Cenozoic.
AUTHOR CONTRIBUTIONS
Bruna M. Farina: Conceptualization (equal); data curation (lead); formal analysis (equal); investigation (lead); methodology (equal); writing – original draft (lead); writing – review and editing (equal). Pedro L. Godoy: Conceptualization (equal); formal analysis (equal); investigation (equal); methodology (equal); supervision (equal); writing – review and editing (equal). Roger B. J. Benson: Methodology (equal); supervision (equal); writing – review and editing (equal). Max C. Langer: Funding acquisition (equal); supervision (equal); writing – review and editing (equal). Gabriel S. Ferreira: Conceptualization (equal); data curation (equal); project administration (equal); resources (equal); supervision (equal); writing – original draft; writing – review and editing (equal).
CONFLICT OF INTEREST STATEMENT
The authors have no conflicts of interest to declare.
OPEN RESEARCH BADGES
This article has earned an Open Data badge for making publicly available the digitally‐shareable data necessary to reproduce the reported results. The data is available at https://osf.io/a45hv/?view_only=ffa79065eff54a848f17168c11f3e4f6.
ACKNOWLEDGMENTS
This study was funded by São Paulo Research Foundation (FAPESP grants 2018/10276‐7, 2019/06119‐6, to BMF, 2022/05697‐9, to PLG, and 2020/07997‐4, to MCL), Swiss Government Excellence Scholarship (2021.0350 to BMF), and the National Science Foundation (NSF DEB 1754596 to PLG).
APPENDIX 1.
FIGURE A1.
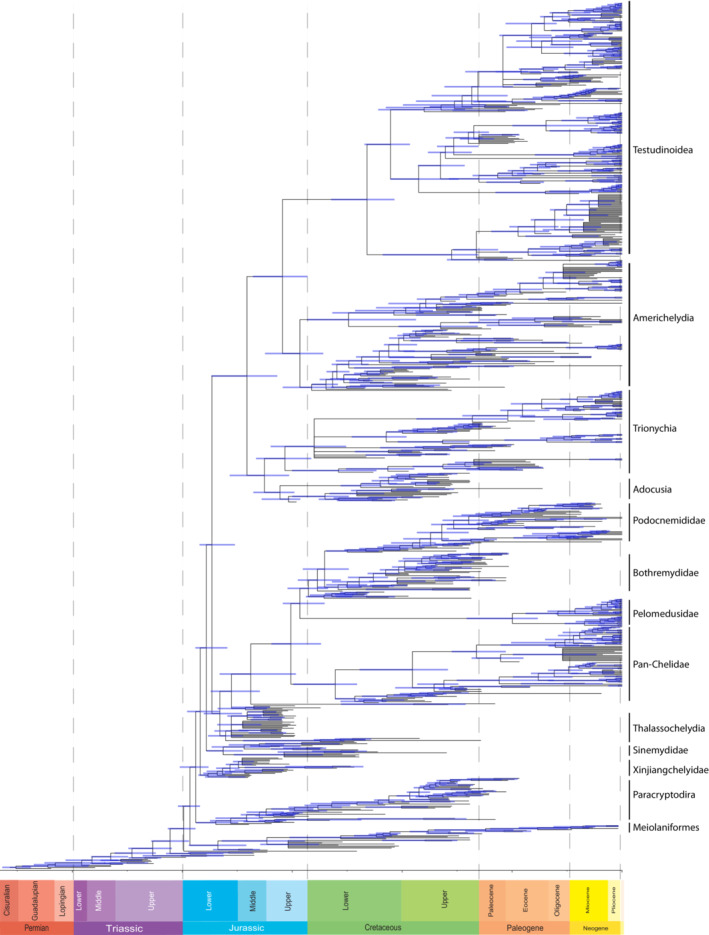
The “Ev19” time‐calibrated supertree, represented by the 50% majority rule tree. Blue bars represent the 95% highest posterior density (HPD) age ranges for each node.
FIGURE A2.
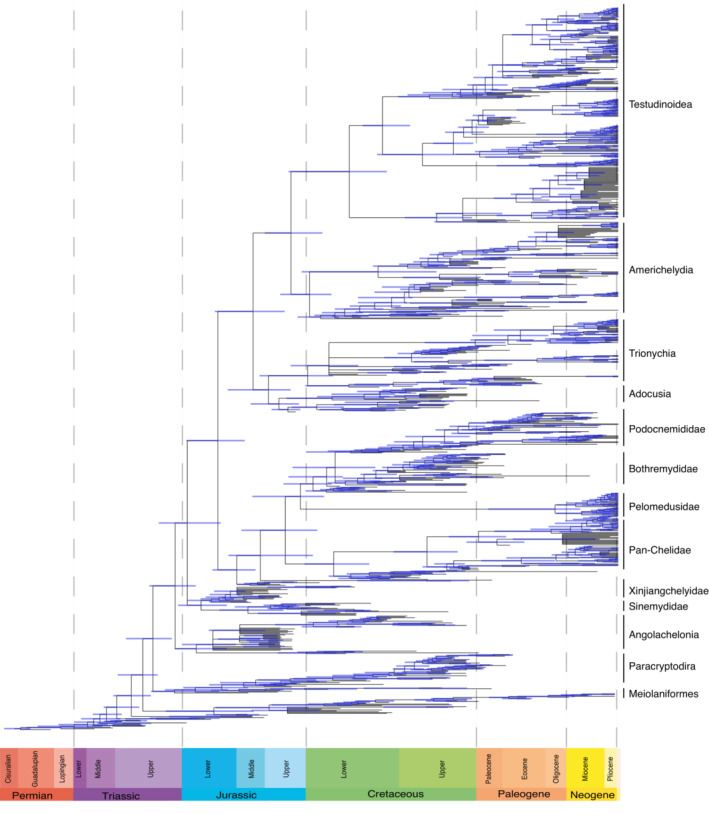
The “St18” time‐calibrated supertree, represented by the 50% majority rule tree. Blue bars represent the 95% highest posterior density (HPD) age ranges for each node.
FIGURE A3.
Ancestral body sizes (log10 maximum dorsal carapace length in millimeters) mapped onto Ev19 supertree, with (a) complete tree and (b) extant‐only subtree. Ancestral body size for different taxonomic groups (c); small gray dots indicate all taxa within that lineage; colored triangles represent the ancestral estimates of stem‐groups; circles represent ancestral estimates of the crown groups; and squares represent ancestral estimates of the crown groups without the fossil taxa. Gray area indicates sizes between 200 and 500 mm. The numbers indicate the same groups in a–c.
TABLE A1.
Sources of phylogenetic information for supertrees construction.
| Group | References |
|---|---|
| Testudinata |
Evers et al. (2019), Sterli et al. (2018) Obs 1: Joyce (2017): used to include taxa that were not sampled by the above topologies |
| Meiolaniformes |
Sterli (2015), Sterli et al. (2018) Obs 1: In “Ev19”: the position of Chubutemys and Kallokibotion was defined according to Evers et al. (2019) |
| Helochelydridae |
Joyce (2017) Obs 1: Aragochersis: according to Pérez‐Garcia, Espílez, et al. (2020) |
| Sichuanchelyidae | Joyce (2017) |
| Compsemydidae |
Joyce and Anquetin (2019) Obs 1: Peltochelys duchastelii: according to Joyce and Rollot (2020) |
| Paracryptodira |
Joyce and Rollot (2020) Obs 1: Position of Dinochelys, Compsemydidae, Uluops e Baenoidea |
| Baenidae |
Joyce and Lyson (2015) Obs 1: Eubaeninae (Lyson et al., 2019) + “Baena” escavada (Joyce & Lyson, 2015) |
| Pleurosternidae |
Joyce and Rollot (2020) Siamochelys peninsularis: according to Sterli et al. (2018). Obs 1: Sister group of Paracryptodira |
| Xinjiangchelyidae |
Rabi et al. (2013) Obs 1: Xinjianchelys (less inclusive clade) according to Evers et al. (2019) Sampled made by Evers and Benson (2018) and Evers et al. (2019) include Xinjianchelys radiplicatoides, Xinjianchelys wusu, Annemys IVPP V18106, Annemys levensis, and Annemys latiens. A. latiens and A. levensis are included in Rabi et al. (2013) as Xinjianchelys latiens e Xinjianchelys levensis, but other Xinjianchelys in Evers et al. (2019) are not. Because Xinjianchelys is monophyletic in Rabi et al. (2013) (if Larachelus and Brodiechelys are included), we assume the Evers et al.'s (2019) topology includes only taxa from this clade (i.e., clade that includes Xinjianchelys, Larachelus e Brodiechelys, but not Protoxinjiangchelys or Tienfuchelys), thus the relationship between other xinjiangchelidis follows Rabi et al. (2013) |
| Sinemydidae |
Evers et al. (2019), Shao et al. (2018) Obs 1: Hoyasemys jimenezi: according to Pérez‐García, Fuent, et al. (2012) Obs 2: Galvechelone lopezmartinezae: according to Pérez‐Garcia and Murelaga (2012) |
| Angolachelonia | Evers et al. (2019) |
| Thelassochelydia |
Anquetin et al. (2017) Obs 1: In “St18,” Santanachelys is included within Eurysternidae |
| Sandownidae | Evers et al. (2019) |
| Platychelyidae | López‐Conde et al. (2017) |
| Dortokidae | Cadena and Joyce (2015) |
| Pan‐Chelidae |
Holley et al. (2020), Pereira et al. (2017) Obs 1: Linderochelys and Salamanchelys: according to Hermanson et al. (2020) Obs 2: Yaminuechelys sulcipeculiaris: according to Oriozabala et al. (2020) |
| Pelomedusidae | Pereira et al. (2017), Petzold et al. (2014) |
| Pan‐Podocnemididae | Hermanson et al. (2020) |
| Adocidae |
Syromyatnikova and Danilov (2013) Obs 1: Adocus inexpectatus: according to Danilov et al. (2013) |
| Nanhsiungchelyidae |
Tong and Li (2019) Obs 1: Basilemys gaffney, Basilemys morriensis, and Zangerlia testudinomorpha: Mallon and Brinkman (2018) |
| Pan‐Carettochelys | Havlik et al. (2014) |
| Trionychia |
Pereira et al. (2017), Brinkman et al. (2017; implied weighting tree); other added according to Georgalis and Joyce (2017) and Vitek and Joyce (2015) Obs 1: Plastomenidae according to Joyce et al. (2018) Obs 2: Axestemys according to Vitek and Joyce (2015) Obs 3: Apalone amorense: according to Valdes et al. (2017) Obs 4: Aspideretoides foveatus and Gobiapalone orlovi: according to Brinkman et al. (2017) |
| Pan‐Testudinoidea |
Pereira et al. (2017), Vlachos (2018) (general topology) Pan‐Emydidae: Pereira et al. (2017), Vlachos (2018) Obs 1: Polytomy within Pseudemys, Graptemys and Trachemys Pan‐Geoemydidae: Pereira et al. (2017), Vlachos (2018) Obs 2: Banhxeochelys and Guangdongemys according to Garbin et al. (2019) Obs 3: Hardella siamensis: according to Claude et al. (2007) Obs 4: Pangshura tatrotia: according to Joyce and Lyson (2010) Pan‐Testudinidae: Pereira et al. (2017), Vlachos (2018), and Vlachos and Rabi (2018) Obs 5: Extant taxa were included following Pereira et al. (2017); extinct taxa were positioned according to Vlachos and Rabi (2018) and Vlachos (2018) Obs 6: Gopherus: Vlachos (2018) Obs 7: Polytomy within Chelonoidis Geochelona: Pereira et al. (2017), Pérez‐García, Vlachos, et al. (2020), and Vlachos and Rabi (2018) Pan‐Testudona: Vlachos and Tsoukala (2016) Obs 8: Impregnochelys and Gigantochersina: according to Pérez‐García et al. (2020) |
| Pan‐Chelydridae | Joyce (2016) |
| Pan‐Kinosternoidea |
Joyce and Bourque (2016) Obs 1: Kinosternon: polytomy (we added taxa from Pereira et al.'s, 2017 topology) Obs 2: Yelmochelys rosarioae: according to Brinkman et al. (2016) Obs 3: Lutemys warren: according to Lyson et al. (2019) Obs 4: Kinosterninae: Joyce and Bourque (2016) |
| Pan‐Chelonioidea |
Evers et al. (2019), Gentry et al. (2019) Obs 1: Mexichelys, Argillochelys antiqua, and Procolpochelys: according to Zvonok and Danilov (2017) Obs 2: Prionochelys, Euclastes wielandi**, Asmodochelys: according to Gentry et al. (2019) Obs 3: Osonachelus decorata: according to Lapparent de Broin et al. (2014) Obs 4: Allopleuron qazaqstanense and Allopleuron lipsiensis according to Karl et al. (2012) Obs 5: Rhinochelys amaberti according to Scavezzoni and Fischer (2018) Obs 6: Ctenochelyidae: Evers et al. (2019) Obs 7: Santanachelys: Protostegidae, according to Gentry et al. (2019), Evers et al. (2019), and Scavezzoni and Fisher (2018), closely related to Solnhofia (Thalassochelyidae according to Anquetin et al., 2017; Evers et al., 2019), Protostegidae become more basal, within Thalassochelyidae Obs 8: The position of Cheloniidae and Ctenochelyidae according to Evers et al. (2019) Obs 9: Carolinochelys and Trachyaspis closely related to Cheloniidae is supported by Weems and Brown (2017) and Zvonok and Danilov (2017) Obs 10: Pacifichelys, Erquelinnesia, Tasbacka spp., “Argillochelys” africana and Euclastes is supported partially by Weems and Brown (2017) and based on Zvonok and Danilov (2017) Obs 11: Lophochelyinae as sister group of those groups, excluding Toxochelys, and Mexichelys is supported by Parham and Pyenson (2010), Weems and Brown (2017), and Zvonok and Danilov (2017) |
TABLE A2.
Results of generalized least squares (tsGLS) and ordinary least squares (OLS) regressions using turtle mean, maximum, and minimum body size and paleotemperature data.
| tsGLS | OLS | ||||||||||||
|---|---|---|---|---|---|---|---|---|---|---|---|---|---|
| Phi | p. R 2 | AIC | Var. | Coef. | t‐Value | p‐Value | p. R 2 | AIC | Var. | Coef. | t‐Value | p‐Value | |
| Body size mean | 0.761 | −.004 | −57.426 | interc. | 2.494 | 46.05 | <.000 | −.009 | −40.37 | interc. | 2.47 | 69.942 | <.000 |
| ~δ18O (Prokoph) | δ18O | −0.01 | −1.140 | .266 | δ18O | −0.025 | −1.061 | .300 | |||||
| Body size mean | 0.121 | −.0003 | −36.809 | interc. | 2.558 | 132.713 | <.000 | −.0004 | −38.663 | interc. | 2.558 | 144.934 | <.000 |
| ~δ18O (Zachos) | δ18O | −0.004 | −0.452 | .663 | δ18O | 0.01 | −0.508 | .626 | |||||
| Body size max. | 0.859 | −.038 | −14.857 | interc. | 3.12 | 16.439 | <.000 | .185 | 13.608 | interc. | 3.132 | 28.813 | <.000 |
| ~δ18O (Prokoph) | δ18O | 0.046 | 1.130 | .271 | δ18O | 0.085 | 1.166 | .256 | |||||
| Body size max. | 0.469 | −.043 | −8.991 | interc. | 3.163 | 29.724 | <.000 | −.161 | −8.652 | interc. | 3.130 | 39.545 | <.000 |
| ~δ18O (Zachos) | δ18O | 0.070 | 1.348 | .214 | δ18O | 0.085 | 1.923 | .091 | |||||
| Body size min. | 0.937 | −.011 | −45.143 | interc. | 2.155 | 12.262 | <.000 | −.237 | −17.639 | interc. | 1.978 | 34.891 | <.000 |
| ~δ18O (Prokoph) | δ18O | 0.03 | −1.417 | .171 | δ18O | −2.661 | .014 | ||||||
| Body size min. | 0.420 | −.0003 | −26.379 | interc. | 1.988 | 46.845 | <.000 | −.00001 | −27.545 | interc. | 1.994 | 64.800 | <.000 |
| ~δ18O (Zachos) | δ18O | 0.007 | 0.33 | .75 | δ18O | −0.001 | −0.048 | .963 | |||||
Note: Body size (log10 maximum dorsal carapace length in millimeters) and paleotemperature (δ18O data as a proxy for paleotemperature from two different sources: Prokoph et al., 2008; Zachos et al., 2008) data were divided into time bins (24 time‐bins when the Prokoph et al., 2008 δ18O data were used and 10 time‐bins when the Zachos et al., 2008 data were used).
Abbreviations: Coef., coefficient; interc., intercept; p.R 2, Nagelkerke pseudo R‐squared; SD, standard deviation; Var., variable.
Farina, B. M. , Godoy, P. L. , Benson, R. B. J. , Langer, M. C. , & Ferreira, G. S. (2023). Turtle body size evolution is determined by lineage‐specific specializations rather than global trends. Ecology and Evolution, 13, e10201. 10.1002/ece3.10201
DATA AVAILABILITY STATEMENT
The complete dataset, supertrees, and scripts used for the analyses in this study are available on OSF: https://osf.io/a45hv/?view_only=ffa79065eff54a848f17168c11f3e4f6.
REFERENCES
- Adams, D. C. , & Collyer, M. L. (2018). Phylogenetic ANOVA: Group‐clade aggregation, biological challenges, and a refined permutation procedure. Evolution, 72(6), 1204–1215. 10.1111/evo.13492 [DOI] [PubMed] [Google Scholar]
- Agha, M. , Ennen, J. R. , Bower, D. S. , Nowakowski, A. J. , Sweat, S. C. , & Todd, B. D. (2018). Salinity tolerances and use of saline environments by freshwater turtles: Implications of sea level rise. Biological Reviews, 93(3), 1634–1648. 10.1111/brv.12410 [DOI] [PubMed] [Google Scholar]
- Akaike, H. (1974). A new look at the statistical model identification. IEEE Transactions on Automatic Control, 19(6), 716–723. 10.1109/TAC.1974.1100705 [DOI] [Google Scholar]
- Alroy, J. (1998). Cope's rule and the dynamics of body mass evolution in North American fossil mammals. Science, 280(5364), 731–734. 10.1126/science.280.5364.731 [DOI] [PubMed] [Google Scholar]
- Alroy, J. (1999). The fossil record of North American mammals: Evidence for a Paleocene evolutionary radiation. Systematic Biology, 48(1), 107–118. 10.1080/106351599260472 [DOI] [PubMed] [Google Scholar]
- Angielczyk, K. D. , Burroughs, R. W. , & Feldman, C. R. (2015). Do turtles follow the rules? Latitudinal gradients in species richness, body size, and geographic range area of the world's turtles. Journal of Experimental Zoology Part B: Molecular and Developmental Evolution, 324(3), 270–294. 10.1002/jez.b.22602 [DOI] [PubMed] [Google Scholar]
- Angilletta, M. J., Jr. , Steury, T. D. , & Sears, M. W. (2004). Temperature, growth rate, and body size in ectotherms: Fitting pieces of a life‐history puzzle. Integrative and Comparative Biology, 44(6), 498–509. 10.1093/icb/44.6.498 [DOI] [PubMed] [Google Scholar]
- Anquetin, J. , Püntener, C. , & Joyce, W. G. (2017). A review of the fossil record of turtles of the clade Thalassochelydia. Bulletin of the Peabody Museum of Natural History, 58(2), 317–369. 10.3374/014.058.0205 [DOI] [Google Scholar]
- Ashton, K. G. , & Feldman, C. R. (2003). Bergmann's rule in nonavian reptiles: Turtles follow it, lizards and snakes reverse it. Evolution, 57(5), 1151–1163. 10.1111/j.0014-3820.2003.tb00324.x [DOI] [PubMed] [Google Scholar]
- Ashton, K. G. , Tracy, M. C. , & de Queiroz, A. (2000). Is Bergmann's rule valid for mammals? The American Naturalist, 156(4), 390–415. 10.1086/303400 [DOI] [PubMed] [Google Scholar]
- Azzalini, A. , & Genz, A. (2022). The R package ‘mnormt’: The multivariate normal and ‘t’ distributions (version 2.1.1) .
- Bapst, D. W. (2012). paleotree: An R package for paleontological and phylogenetic analyses of evolution. Methods in Ecology and Evolution, 3(5), 803–807. 10.1111/j.2041-210X.2012.00223.x [DOI] [Google Scholar]
- Benson, R. B. J. , Domokos, G. , Várkonyi, P. L. , & Reisz, R. R. (2011). Shell geometry and habitat determination in extinct and extant turtles (Reptilia: Testudinata). Paleobiology, 37(4), 547–562. 10.1666/10052.1 [DOI] [Google Scholar]
- Benson, R. B. J. , Evans, M. , & Druckenmiller, P. S. (2012). High diversity, low disparity and small body size in plesiosaurs (Reptilia, Sauropterygia) from the Triassic–Jurassic boundary. PLoS One, 7(3), e31838. 10.1371/journal.pone.0031838 [DOI] [PMC free article] [PubMed] [Google Scholar]
- Benson, R. B. J. , Frigot, R. A. , Goswami, A. , Andres, B. , & Butler, R. J. (2014). Competition and constraint drove Cope's rule in the evolution of giant flying reptiles. Nature Communications, 5(1), Article 1. 10.1038/ncomms4567 [DOI] [PMC free article] [PubMed] [Google Scholar]
- Benson, R. B. J. , Hunt, G. , Carrano, M. T. , & Campione, N. (2018). Cope's rule and the adaptive landscape of dinosaur body size evolution. Palaeontology, 61(1), 13–48. 10.1111/pala.12329 [DOI] [Google Scholar]
- Blanckenhorn, W. U. (2000). The evolution of body size: What keeps organisms small? The Quarterly Review of Biology, 75(4), 385–407. 10.1086/393620 [DOI] [PubMed] [Google Scholar]
- Blomberg, S. P. , Garland, T. , & Ives, A. R. (2003). Testing for phylogenetic signal in comparative data: Behavioral traits are more labile. Evolution; International Journal of Organic Evolution, 57(4), 717–745. 10.1111/j.0014-3820.2003.tb00285.x [DOI] [PubMed] [Google Scholar]
- Böhme, M. (2003). The Miocene climatic optimum: Evidence from ectothermic vertebrates of Central Europe. Palaeogeography, Palaeoclimatology, Palaeoecology, 195(3), 389–401. 10.1016/S0031-0182(03)00367-5 [DOI] [Google Scholar]
- Bonin, F. , Devaux, B. , & Dupré, A. (2006). Turtles of the World. A & C Black. [Google Scholar]
- Bower, D. S. , Scheltinga, D. M. , Clulow, S. , Clulow, J. , Franklin, C. E. , & Georges, A. (2016). Salinity tolerances of two Australian freshwater turtles, Chelodina expansa and Emydura macquarii (Testudinata: Chelidae). Conservation Physiology, 4(1), cow042. 10.1093/conphys/cow042 [DOI] [PMC free article] [PubMed] [Google Scholar]
- Brinkman, D. , Aguillon‐Martinez, M. C. , Hutchison, J. H. , & Brown, C. (2016). Yelmochelys rosarioae gen. et sp. nov., a stem kinosternid (Testudines; Kinosternidae) from the Late Cretaceous of Coahuila, Mexico. Paleo Bios, 33. 10.5070/p9331030601 [DOI] [Google Scholar]
- Brinkman, D. , Rabi, M. , & Zhao, L. (2017). Lower Cretaceous fossils from China shed light on the ancestral body plan of crown softshell turtles (Trionychidae, Cryptodira). Scientific Reports, 7, 6719. 10.1038/s41598-017-04101-0 [DOI] [PMC free article] [PubMed] [Google Scholar]
- Brown, J. H. , Marquet, P. A. , & Taper, M. L. (1993). Evolution of body size: Consequences of an energetic definition of fitness. The American Naturalist, 142(4), 573–584. 10.1086/285558 [DOI] [PubMed] [Google Scholar]
- Brown, J. H. , & Maurer, B. A. (1986). Body size, ecological dominance and Cope's rule. Nature, 324(6094), Article 6094. 10.1038/324248a0 [DOI] [Google Scholar]
- Butler, M. A. , & King, A. A. (2004). Phylogenetic comparative analysis: A modeling approach for adaptive evolution. The American Naturalist, 164(6), 683–695. 10.1086/426002 [DOI] [PubMed] [Google Scholar]
- Cadena, E.‐A. , Scheyer, T. M. , Carrillo‐Briceño, J. D. , Sánchez, R. , Aguilera‐Socorro, O. A. , Vanegas, A. , Pardo, M. , Hansen, D. M. , & Sánchez‐Villagra, M. R. (2020). The anatomy, paleobiology, and evolutionary relationships of the largest extinct side‐necked turtle. Science . Advances, 6(7), eaay4593. 10.1126/sciadv.aay4593 [DOI] [PMC free article] [PubMed] [Google Scholar]
- Cadena, E. , & Joyce, W. G. (2015). A Review of the Fossil Record of Turtles of the Clades Platychelyidae and Dortokidae. Bulletin of the Peabody Museum of Natural History, 56(1), 3–20. 10.3374/014.056.0101 [DOI] [Google Scholar]
- Claude, J. , Suteethorn, V. , & Tong, H. (2007). Turtles from the late Eocene – early Oligocene of the Krabi Basin (Thailand). Bulletin de La Société Géologique de France, 178(4), 305–316. 10.2113/gssgfbull.178.4.305 [DOI] [Google Scholar]
- Clauss, M. , Schwarm, A. , Ortmann, S. , Streich, W. J. , & Hummel, J. (2007). A case of non‐scaling in mammalian physiology? Body size, digestive capacity, food intake, and ingesta passage in mammalian herbivores. Comparative Biochemistry and Physiology Part A: Molecular & Integrative Physiology, 148(2), 249–265. 10.1016/j.cbpa.2007.05.024 [DOI] [PubMed] [Google Scholar]
- Collyer, M. L. , & Adams, D. C. (2018). RRPP: An R package for fitting linear models to high‐dimensional data using residual randomization .
- Collyer, M. L. , & Adams, D. C. (2019). RRPP: Linear model evaluation with randomized residuals in a permutation procedure. R package version 0.4.0.
- Cooney, C. R. , & Thomas, G. H. (2021). Heterogeneous relationships between rates of speciation and body size evolution across vertebrate clades. Nature Ecology & Evolution, 5(1), 101–110. 10.1038/s41559-020-01321-y [DOI] [PubMed] [Google Scholar]
- Cooper, N. , & Purvis, A. (2010). Body size evolution in mammals: Complexity in tempo and mode. The American Naturalist, 175(6), 727–738. 10.1086/652466 [DOI] [PubMed] [Google Scholar]
- Cope, E. D. (1896). The primary factors of organic evolution. Open Court Publishing Company. [Google Scholar]
- Cope, E. D. (1887). The origin of the fittest: Essays on evolution. Appleton Press. [Google Scholar]
- Cullen, T. M. , Canale, J. I. , Apesteguía, S. , Smith, N. D. , Hu, D. , & Makovicky, P. J. (2020). Osteohistological analyses reveal diverse strategies of theropod dinosaur body‐size evolution. Proceedings of the Royal Society B: Biological Sciences, 287(1939), 20202258. 10.1098/rspb.2020.2258 [DOI] [PMC free article] [PubMed] [Google Scholar]
- Cunha, F. L. R. , Bernhard, R. , & Vogt, R. C. (2020). Diet of an assemblage of four species of turtles (Podocnemis) in the Rio Uatumã, Amazonas, Brazil. Copeia, 108(1), 103–115. 10.1643/CE-18-117 [DOI] [Google Scholar]
- D'Amico, L. J. , Davidowitz, G. , & Nijhout, H. F. (2001). The developmental and physiological basis of body size evolution in an insect. Proceedings of the Royal Society of London Series B: Biological Sciences, 268(1476), 1589–1593. 10.1098/rspb.2001.1698 [DOI] [PMC free article] [PubMed] [Google Scholar]
- Danilov, I. G. , Syromyatnikova, E. V. , Skutschas, P. P. , Kodrul, T. M. , & Jin, J. (2013). The First ‘True’ Adocus (Testudines, Adocidae) from the Paleogene of Asia. Journal of Vertebrate Paleontology, 33(5), 1071–1080. [Google Scholar]
- Davis, R. W. (2014). A review of the multi‐level adaptations for maximizing aerobic dive duration in marine mammals: From biochemistry to behavior. Journal of Comparative Physiology B, 184(1), 23–53. 10.1007/s00360-013-0782-z [DOI] [PubMed] [Google Scholar]
- Dickson, B. V. , & Pierce, S. E. (2019). Functional performance of turtle humerus shape across an ecological adaptive landscape. Evolution, 73(6), 1265–1277. 10.1111/evo.13747 [DOI] [PubMed] [Google Scholar]
- Eastman, J. M. , Alfaro, M. E. , Joyce, P. , Hipp, A. L. , & Harmon, L. J. (2011). A novel comparative method for identifying shifts in the rate of character evolution on trees. Evolution, 65(12), 3578–3589. 10.1111/j.1558-5646.2011.01401.x [DOI] [PubMed] [Google Scholar]
- Evers, S. W. , Barrett, P. M. , & Benson, R. B. J. (2019). Anatomy of Rhinochelys pulchriceps (Protostegidae) and marine adaptation during the early evolution of chelonioids. PeerJ, 7, e6811. 10.7717/peerj.6811 [DOI] [PMC free article] [PubMed] [Google Scholar]
- Evers, S. W. , & Benson, R. B. J. (2018). A new phylogenetic hypothesis of turtles with implications for the timing and number of evolutionary transitions to marine lifestyles in the group. Palaeontology, 62(1), 93–134. 10.1111/pala.12384 [DOI] [Google Scholar]
- Felsenstein, J. (1973). Maximum‐likelihood estimation of evolutionary trees from continuous characters. American Journal of Human Genetics, 25(5), 471–492. [PMC free article] [PubMed] [Google Scholar]
- Felsenstein, J. (1985). Phylogenies and the comparative method. The American Naturalist, 125(1), 1–15. [Google Scholar]
- Felsenstein, J. (2003). Inferring phylogenies. Sinauer. [Google Scholar]
- Ferreira, G. S. , Bronzati, M. , Langer, M. C. , & Sterli, J. (2018). Phylogeny, biogeography and diversification patterns of side‐necked turtles (Testudines: Pleurodira). Royal Society Open Science, 5(3), 171773. 10.1098/rsos.171773 [DOI] [PMC free article] [PubMed] [Google Scholar]
- Finarelli, J. A. , & Flynn, J. J. (2006). Ancestral state reconstruction of body size in the Caniformia (Carnivora, Mammalia): The effects of incorporating data from the fossil record. Systematic Biology, 55(2), 301–313. 10.1080/10635150500541698 [DOI] [PubMed] [Google Scholar]
- Finarelli, J. A. , & Goswami, A. (2013). Potential pitfalls of reconstructing deep time evolutionary history with only extant data, a case study using the canidae (mammalia, carnivora). Evolution; International Journal of Organic Evolution, 67(12), 3678–3685. 10.1111/evo.12222 [DOI] [PubMed] [Google Scholar]
- Foth, C. , & Joyce, W. G. (2016). Slow and steady: The evolution of cranial disparity in fossil and recent turtles. Proceedings of the Royal Society B: Biological Sciences, 283(1843), 20161881. 10.1098/rspb.2016.1881 [DOI] [PMC free article] [PubMed] [Google Scholar]
- Foth, C. , Rabi, M. , & Joyce, W. G. (2017). Skull shape variation in extant and extinct Testudinata and its relation to habitat and feeding ecology. Acta Zoologica, 98(3), 310–325. 10.1111/azo.12181 [DOI] [Google Scholar]
- Fox, J. , & Weisberg, S. (2018). An R Companion to Applied Regression. SAGE Publications. [Google Scholar]
- Freckleton, R. P. , & Harvey, P. H. (2006). Detecting non‐brownian trait evolution in adaptive radiations. PLoS Biology, 4(11), e373. 10.1371/journal.pbio.0040373 [DOI] [PMC free article] [PubMed] [Google Scholar]
- Fritz, S. A. , Schnitzler, J. , Eronen, J. T. , Hof, C. , Böhning‐Gaese, K. , & Graham, C. H. (2013). Diversity in time and space: Wanted dead and alive. Trends in Ecology & Evolution, 28(9), 509–516. 10.1016/j.tree.2013.05.004 [DOI] [PubMed] [Google Scholar]
- Gaffney, E. S. , Tong, H. , & Meylan, P. (2006). Evolution of the side‐necked turtles: The families Bothremydidae, Euraxemydidae, and Araripemydidae. Bulletin of the American Museum of Natural History, 300, 1–698. 10.1206/0003-0090(2006)300[1:EOTSTT]2.0.CO;2 [DOI] [Google Scholar]
- Garbin, R. C. , Böhme, M. , & Joyce, W. G. (2019). A new testudinoid turtle from the middle to late Eocene of Vietnam. Peer Journal, 7, e6280. Portico. 10.7717/peerj.6280 [DOI] [PMC free article] [PubMed] [Google Scholar]
- Gearty, W. (2023). Plotting tools for anyone working in deep time .
- Gearty, W. , McClain, C. R. , & Payne, J. L. (2018). Energetic tradeoffs control the size distribution of aquatic mammals. Proceedings of the National Academy of Sciences of the United States of America, 115(16), 4194–4199. 10.1073/pnas.1712629115 [DOI] [PMC free article] [PubMed] [Google Scholar]
- Gearty, W. , & Payne, J. L. (2020). Physiological constraints on body size distributions in Crocodyliformes. Evolution, 74(2), 245–255. 10.1111/evo.13901 [DOI] [PubMed] [Google Scholar]
- Gentry, A. D. , Ebersole, J. A. , & Kiernan, C. R. (2019). Asmodochelys parhami, a new fossil marine turtle from the Campanian Demopolis Chalk and the stratigraphic congruence of competing marine turtle phylogenies. Royal Society Open Science, 6(12), 191950. 10.1098/rsos.191950 [DOI] [PMC free article] [PubMed] [Google Scholar]
- Georgalis, G. L. , & Kear, B. P. (2013). The fossil turtles of Greece: An overview of taxonomy and distribution. Geobios, 46(4), 299–311. 10.1016/j.geobios.2013.05.001 [DOI] [Google Scholar]
- Georgalis, G. L. , & Joyce, W. G. (2017). A Review of the Fossil Record of Old World Turtles of the Clade Pan‐Trionychidae. Bulletin of the Peabody Museum of Natural History, 58(1), 115–208. 10.3374/014.058.0106 [DOI] [Google Scholar]
- Godoy, P. L. , Benson, R. B. J. , Bronzati, M. , & Butler, R. J. (2019). The multi‐peak adaptive landscape of crocodylomorph body size evolution. BMC Evolutionary Biology, 19(1), 167. 10.1186/s12862-019-1466-4 [DOI] [PMC free article] [PubMed] [Google Scholar]
- Golubović, A. , Anđelković, M. , Arsovski, D. , Bonnet, X. , & Tomović, L. (2017). Locomotor performances reflect habitat constraints in an armoured species. Behavioral Ecology and Sociobiology, 71(6), 93. 10.1007/s00265-017-2318-0 [DOI] [Google Scholar]
- Gould, S. J. (1988). Trends as changes in variance: A new slant on progress and directionality in evolution. Journal of Paleontology, 62(3), 319–329. 10.1017/S0022336000059126 [DOI] [Google Scholar]
- Guillerme, T. (2018). dispRity: A modular R package for measuring disparity. Methods in Ecology and Evolution, 9(7), 1755–1763. 10.1111/2041-210X.13022 [DOI] [Google Scholar]
- Gutarra, S. , Stubbs, T. L. , Moon, B. C. , Palmer, C. , & Benton, M. J. (2022). Large size in aquatic tetrapods compensates for high drag caused by extreme body proportions. Communications Biology, 5(1), Article 1. 10.1038/s42003-022-03322-y [DOI] [PMC free article] [PubMed] [Google Scholar]
- Hansen, T. F. (1997). Stabilizing selection and the comparative analysis of adaptation. Evolution, 51(5), 1341–1351. 10.1111/j.1558-5646.1997.tb01457.x [DOI] [PubMed] [Google Scholar]
- Harmon, L. J. , Losos, J. B. , Jonathan Davies, T. , Gillespie, R. G. , Gittleman, J. L. , Bryan Jennings, W. , Kozak, K. H. , McPeek, M. A. , Moreno‐Roark, F. , Near, T. J. , Purvis, A. , Ricklefs, R. E. , Schluter, D. , Schulte Ii, J. A. , Seehausen, O. , Sidlauskas, B. L. , Torres‐Carvajal, O. , Weir, J. T. , & Mooers, A. Ø. (2010). Early bursts of body size and shape evolution are rare in comparative data. Evolution; International Journal of Organic Evolution, 64(8), 2385–2396. 10.1111/j.1558-5646.2010.01025.x [DOI] [PubMed] [Google Scholar]
- Harmon, L. J. , Weir, J. T. , Brock, C. D. , Glor, R. E. , & Challenger, W. (2008). GEIGER: Investigating evolutionary radiations. Bioinformatics, 24(1), 129–131. 10.1093/bioinformatics/btm538 [DOI] [PubMed] [Google Scholar]
- Havlik, P. E. , Joyce, W. G. , & Böhme, M. (2014). Allaeochelys libyca, a New Carettochelyine Turtle from the Middle Miocene (Langhian) of Libya. Bulletin of the Peabody Museum of Natural History, 55(2), 201. 10.3374/014.055.0207 [DOI] [Google Scholar]
- Heath, T. A. , Huelsenbeck, J. P. , & Stadler, T. (2014). The fossilized birth–death process for coherent calibration of divergence‐time estimates. Proceedings of the National Academy of Sciences of the United States of America, 111(29), E2957–E2966. 10.1073/pnas.1319091111 [DOI] [PMC free article] [PubMed] [Google Scholar]
- Heim, N. A. , Knope, M. L. , Schaal, E. K. , Wang, S. C. , & Payne, J. L. (2015). Cope's rule in the evolution of marine animals. Science, 347(6224), 867–870. 10.1126/science.1260065 [DOI] [PubMed] [Google Scholar]
- Hermanson, G. , Benson, R. B. J. , Farina, B. M. , Ferreira, G. S. , Langer, M. C. , & Evers, S. W. (2022). Cranial ecomorphology of turtles and neck retraction as a possible trigger of ecological diversification. Evolution, 76, 2566–2586. 10.1111/evo.14629 [DOI] [PMC free article] [PubMed] [Google Scholar]
- Hermanson, G. , Iori, F. V. , Evers, S. W. , Langer, M. C. , & Ferreira, G. S. (2020). A small podocnemidoid (Pleurodira, Pelomedusoides) from the Late Cretaceous of Brazil, and the innervation and carotid circulation of side‐necked turtles. Papers in Palaeontology, 6(2), 329–347. 10.1002/spp2.1300 [DOI] [Google Scholar]
- Hirayama, R. (1998). Oldest known sea turtle. Nature, 392(6677), Article 6677. 10.1038/33669 [DOI] [Google Scholar]
- Holley, A. J. , Sterli, J. , & Basso, N. G. (2020). Dating the origin and diversification of Pan‐Chelidae (Testudines, Pleurodira) under multiple molecular clock approaches. Contributions to Zoology, 89(2), 146–174. 10.1163/18759866-20191419 [DOI] [Google Scholar]
- Hunt, G. , & Carrano, M. T. (2010). Models and methods for analyzing phenotypic evolution in lineages and clades. The Paleontological Society Papers, 16, 245–269. 10.1017/S1089332600001893 [DOI] [Google Scholar]
- Huttenlocker, A. K. (2014). Body size reductions in nonmammalian eutheriodont therapsids (Synapsida) during the end‐Permian mass extinction. PLoS One, 9(2), e87553. 10.1371/journal.pone.0087553 [DOI] [PMC free article] [PubMed] [Google Scholar]
- Ingram, T. , & Mahler, D. L. (2013). SURFACE: Detecting convergent evolution from comparative data by fitting Ornstein‐Uhlenbeck models with stepwise Akaike Information Criterion. Methods in Ecology and Evolution, 4(5), 416–425. 10.1111/2041-210X.12034 [DOI] [Google Scholar]
- Jaffe, A. L. , Slater, G. J. , & Alfaro, M. E. (2011). The evolution of island gigantism and body size variation in tortoises and turtles. Biology Letters, 7(4), 558–561. 10.1098/rsbl.2010.1084 [DOI] [PMC free article] [PubMed] [Google Scholar]
- James, F. C. (1970). Geographic size variation in birds and its relationship to climate. Ecology, 51(3), 365–390. 10.2307/1935374 [DOI] [Google Scholar]
- Jones, L. A. , Gearty, W. , Allen, B. J. , Eichenseer, K. , Dean, C. D. , Galván, S. , Kouvari, M. , Godoy, P. L. , Nicholl, C. S. C. , Buffan, L. , Dillon, E. M. , Flannery‐Sutherland, J. T. , & Chiarenza, A. A. (2023). palaeoverse: A community‐driven R package to support palaeobiological analysis. Methods in Ecology and Evolution. 10.1111/2041-210X.14099 [DOI] [Google Scholar]
- Joos, J. , Pimiento, C. , Miles, D. B. , & Müller, J. (2022). Quaternary megafauna extinctions altered body size distribution in tortoises. Proceedings of the Royal Society B: Biological Sciences, 289, 20221947. 10.1098/rspb.2022.1947 [DOI] [PMC free article] [PubMed] [Google Scholar]
- Joyce, W. (2017). A review of the fossil record of basal mesozoic turtles. Bulletin of the Peabody Museum of Natural History, 58, 65–113. 10.3374/014.058.0105 [DOI] [Google Scholar]
- Joyce, W. G. , Anquetin, J. , Cadena, E.‐A. , Claude, J. , Danilov, I. G. , Evers, S. W. , Ferreira, G. S. , Gentry, A. D. , Georgalis, G. L. , Lyson, T. R. , Pérez‐García, A. , Rabi, M. , Sterli, J. , Vitek, N. S. , & Parham, J. F. (2021). A nomenclature for fossil and living turtles using phylogenetically defined clade names. Swiss Journal of Palaeontology, 140(1), 5. 10.1186/s13358-020-00211-x [DOI] [Google Scholar]
- Joyce, W. G. , & Gauthier, J. A. (2004). Palaeoecology of Triassic stem turtles sheds new light on turtle origins. Proceedings of the Royal Society of London Series B: Biological Sciences, 271(1534), 1–5. 10.1098/rspb.2003.2523 [DOI] [PMC free article] [PubMed] [Google Scholar]
- Joyce, W. G. , Parham, J. F. , Lyson, T. R. , Warnock, R. C. M. , & Donoghue, P. C. J. (2013). A divergence dating analysis of turtles using fossil calibrations: An example of best practices. Journal of Paleontology, 87(4), 612–634. 10.1666/12-149 [DOI] [Google Scholar]
- Joyce, W. G. (2016). A review of the Fossil record of Turtles of the Clade Pan‐Chelydridae . Bulletin of the Peabody Museum of Natural History, 57(1), 21–56. 10.3374/014.057.0103 [DOI] [Google Scholar]
- Joyce, W. G. , & Anquetin, J. (2019). A review of the fossil record of Nonbaenid Turtles of the Clade Paracryptodira . Bulletin of the Peabody Museum of Natural History, 60(2), 129. 10.3374/014.060.0204 [DOI] [Google Scholar]
- Joyce, W. G. , & Bourque, J. R. (2016). A review of the Fossil Record of Turtles of the Clade Pan‐Kinosternoidea . Bulletin of the Peabody Museum of Natural History, 57(1), 57–95. 10.3374/014.057.0104 [DOI] [Google Scholar]
- Joyce, W. G. , & Lyson, T. R. (2015). A Review of the Fossil Record of Turtles of the Clade Baenidae. Bulletin of the Peabody Museum of Natural History, 56(2), 147–183. 10.3374/014.056.0203 [DOI] [Google Scholar]
- Joyce, W. G. , & Lyson, T. R. (2010). Pangshura tatrotia, a new species of pond turtle (Testudinoidea) from the Pliocene Siwaliks of Pakistan. Journal of Systematic Palaeontology, 8(3), 449–458. 10.1080/14772019.2010.500879 [DOI] [Google Scholar]
- Joyce, W. G. , & Rollot, Y. (2020). An alternative interpretation of Peltochelys duchastelii as a paracryptodire. Fossil Record, 23(1), 83–93. 10.5194/fr-23-83-2020 [DOI] [Google Scholar]
- Joyce, W. G. , Lyson, T. R. , & Sertich, J. J. W. (2018). A new species of trionychid turtle from the Upper Cretaceous (Campanian) Fruitland. Formation of New Mexico, USA. Journal of Paleontology, 92(6), 1107–1114. 10.1017/jpa.2018.30 [DOI] [Google Scholar]
- Karl, H.‐V. , Groning, E. , & Brauckmann, C. (2012). New materials of the giant sea turtle Allopleuron (Testudines: Chelonioidea) from the marine Late Cretaceous of Central Europe and the Palaeogene of Kazakhstan. Studia Palaeocheloniologica, 4, 153–173. [Google Scholar]
- Keck, F. , Rimet, F. , Bouchez, A. , & Franc, A. (2016). phylosignal: An R package to measure, test, and explore the phylogenetic signal. Ecology and Evolution, 6(9), 2774–2780. 10.1002/ece3.2051 [DOI] [PMC free article] [PubMed] [Google Scholar]
- Kubo, T. , Sakamoto, M. , Meade, A. , & Venditti, C. (2019). Transitions between foot postures are associated with elevated rates of body size evolution in mammals. Proceedings of the National Academy of Sciences of the United States of America, 116(7), 2618–2623. 10.1073/pnas.1814329116 [DOI] [PMC free article] [PubMed] [Google Scholar]
- Lapparent de Broin, F. , Murelaga, X. , Farrés, F. , & Altimiras, J. (2014). An exceptional cheloniid turtle, Osonachelus decorata nov. gen., nov. sp., from the Eocene (Bartonian) of Catalonia (Spain). Geobios, 47(3), 111–132. 10.1016/j.geobios.2014.02.002 [DOI] [Google Scholar]
- Laurin, M. (2004). The evolution of body size, Cope's rule and the origin of amniotes. Systematic Biology, 53(4), 594–622. 10.1080/10635150490445706 [DOI] [PubMed] [Google Scholar]
- Lautenschlager, S. , Ferreira, G. S. , & Werneburg, I. (2018). Sensory evolution and ecology of early turtles revealed by digital endocranial reconstructions. Frontiers in Ecology and Evolution, 6, 1–16. 10.3389/fevo.2018.00007 [DOI] [Google Scholar]
- Lomolino, M. V. (2005). Body size evolution in insular vertebrates: Generality of the island rule. Journal of Biogeography, 32(10), 1683–1699. 10.1111/j.1365-2699.2005.01314.x [DOI] [Google Scholar]
- López‐Conde, O. A. , Sterli, J. , Alvarado‐Ortega, J. , & Chavarría‐Arellano, M. L. (2017). A new platychelyid turtle (Pan‐Pleurodira) from the Late. Jurassic (Kimmeridgian) of Oaxaca, Mexico. Papers in Palaeontology, 3(2), 161–174. 10.1002/spp2.1069 [DOI] [Google Scholar]
- Louca, S. , & Pennell, M. W. (2020). Extant timetrees are consistent with a myriad of diversification histories. Nature, 580(7804), Article 7804. 10.1038/s41586-020-2176-1 [DOI] [PubMed] [Google Scholar]
- Lourenço, J. M. , Claude, J. , Galtier, N. , & Chiari, Y. (2012). Dating cryptodiran nodes: Origin and diversification of the turtle superfamily Testudinoidea. Molecular Phylogenetics and Evolution, 62(1), 496–507. 10.1016/j.ympev.2011.10.022 [DOI] [PubMed] [Google Scholar]
- Lovegrove, B. G. (2017). A phenology of the evolution of endothermy in birds and mammals. Biological Reviews, 92(2), 1213–1240. 10.1111/brv.12280 [DOI] [PubMed] [Google Scholar]
- Lyson, T. R. , Schachner, E. R. , Botha‐Brink, J. , Scheyer, T. M. , Lambertz, M. , Bever, G. S. , Rubidge, B. S. , & de Queiroz, K. (2014). Origin of the unique ventilatory apparatus of turtles. Nature Communications, 5, 5211. 10.1038/ncomms6211 [DOI] [PubMed] [Google Scholar]
- Lyson, T. R. , Sayler, J. L. , & Joyce, W. G. (2019). A new baenid turtle, Saxochelys gilberti, gen. et sp. nov., from the uppermost cretaceous (Maastrichtian) hell creek formation: sexual dimorphism and spatial niche partitioning within the most speciose group of Late Cretaceous turtles. Journal of Vertebrate Paleontology, 39(4), e1662428. 10.1080/02724634.2019.1662428 [DOI] [Google Scholar]
- Maddison, W. , & Maddison, D. (2018). Mesquite: A modular system for evolutionary analysis (3.61).
- Mallon, J. C. , & Brinkman, D. B. (2018). Basilemys morrinensis, a new species of nanhsiungchelyid turtle from the Horseshoe Canyon Formation (Upper Cretaceous) of Alberta, Canada. Journal of Vertebrate Paleontology, 38(2), e1431922. 10.1080/02724634.2018.1431922 [DOI] [Google Scholar]
- Mannion, P. D. , Benson, R. B. J. , Carrano, M. T. , Tennant, J. P. , Judd, J. , & Butler, R. J. (2015). Climate constrains the evolutionary history and biodiversity of crocodylians. Nature Communications, 6(1), Article 1. 10.1038/ncomms9438 [DOI] [PMC free article] [PubMed] [Google Scholar]
- Matzke, N. J. , & Wright, A. (2016). Inferring node dates from tip dates in fossil Canidae: The importance of tree priors. Biology Letters, 12(8), 20160328. 10.1098/rsbl.2016.0328 [DOI] [PMC free article] [PubMed] [Google Scholar]
- Maurer, B. A. , Brown, J. H. , & Rusler, R. D. (1992). The micro and macro in body size evolution. Evolution, 46(4), 939–953. 10.1111/j.1558-5646.1992.tb00611.x [DOI] [PubMed] [Google Scholar]
- Moen, D. S. (2006). Cope's rule in cryptodiran turtles: Do the body sizes of extant species reflect a trend of phyletic size increase? Journal of Evolutionary Biology, 19(4), 1210–1221. 10.1111/j.1420-9101.2006.01082.x [DOI] [PubMed] [Google Scholar]
- Molina‐Venegas, R. , & Rodríguez, M. Á. (2017). Revisiting phylogenetic signal; strong or negligible impacts of polytomies and branch length information? BMC Evolutionary Biology, 17(1), 53. 10.1186/s12862-017-0898-y [DOI] [PMC free article] [PubMed] [Google Scholar]
- Mousseau, T. A. (1997). Ectotherms follow the converse to Bergmann's rule. Evolution, 51(2), 630–632. 10.2307/2411138 [DOI] [PubMed] [Google Scholar]
- Mrosovsky, N. (1980). Thermal biology of sea turtles. American Zoologist, 20(3), 531–547. [Google Scholar]
- Münkemüller, T. , Lavergne, S. , Bzeznik, B. , Dray, S. , Jombart, T. , Schiffers, K. , & Thuiller, W. (2012). How to measure and test phylogenetic signal. Methods in Ecology and Evolution, 3(4), 743–756. 10.1111/j.2041-210X.2012.00196.x [DOI] [Google Scholar]
- Oriozabala, C. , Sterli, J. , & de la Fuente, M. S. (2020). New species of the long‐necked chelid Yaminuechelys from the Upper Cretaceous (Campanian–Maastrichtian) of Chubut, Argentina. Cretaceous Research, 106, 104197. 10.1016/j.cretres.2019.104197 [DOI] [Google Scholar]
- Pagel, M. (2002). Modelling the evolution of continuously varying characters on phylogenetic trees: The case of hominid cranial capacity. In MacLeod N. & Forey P. L. (Eds.), Morphology, shape and phylogeny (pp. 269–286). CRC Press. [Google Scholar]
- Paradis, E. , & Schliep, K. (2019). ape 5.0: An environment for modern phylogenetics and evolutionary analyses in R. Bioinformatics, 35(3), 526–528. 10.1093/bioinformatics/bty633 [DOI] [PubMed] [Google Scholar]
- Parham, J. F. , & Pyenson, N. D. (2010). New sea turtle from the Miocene of Peru and the iterative evolution of feeding ecomorphologies since the Cretaceous. Journal of Paleontology, 84(2), 231–247. 10.1666/09-077r.1 [DOI] [Google Scholar]
- Partridge, L. , & Coyne, J. A. (1997). Bergmann's rule in ectotherms: Is it adaptive? Evolution, 51(2), 632–635. 10.2307/2411139 [DOI] [PubMed] [Google Scholar]
- Patterson, C. (1981). Significance of fossils in determining evolutionary relationships. Annual Review of Ecology and Systematics, 12, 195–223. [Google Scholar]
- Pereira, A. G. , Sterli, J. , Moreira, F. R. R. , & Schrago, C. G. (2017). Multilocus phylogeny and statistical biogeography clarify the evolutionary history of major lineages of turtles. Molecular Phylogenetics and Evolution, 113, 59–66. 10.1016/j.ympev.2017.05.008 [DOI] [PubMed] [Google Scholar]
- Pérez‐García, A. , & Murelaga, X. (2012). Galvechelone lopezmartinezaegen. et sp. nov., a new cryptodiran turtle in the lower cretaceous of Europe. Palaeontology, 55(5), 937–944. 10.1111/j.1475-4983.2012.01154.x [DOI] [Google Scholar]
- Pérez‐García, A. , de la Fuente, M. S. , & Ortega, F. (2012). A new freshwater Basal Eucryptodiran Turtle from the early cretaceous of Spain. Acta Palaeontologica Polonica, 57(2), 285–298. 10.4202/app.2011.0031 [DOI] [Google Scholar]
- Pérez‐García, A. , Espílez, E. , Mampel, L. , & Alcalá, L. (2020). A new basal turtle represented by the two most complete skeletons of Helochelydridae in Europe. Cretaceous Research, 107, 104291. 10.1016/j.cretres.2019.104291 [DOI] [Google Scholar]
- Pérez‐García, A. , Vlachos, E. , & Murelaga, X. (2020). A large testudinid with African affinities in the post‐Messinian (lower Pliocene) record of south‐eastern Spain. Palaeontology, 63(3), 497–512. 10.1111/pala.12468 [DOI] [Google Scholar]
- Peters, R. H. (1983). The ecological implications of body size. Cambridge University Press. [Google Scholar]
- Petzold, A. , Vargas‐Ramírez, M. , Kehlmaier, C. , Vamberger, M. , Branch, W. R. , Preez, L. D. , Hofmeyr, M. D. , Meyer, L. , Schleicher, A. , Široký, P. , & Fritz, U. (2014). A revision of African helmeted terrapins (Testudines: Pelomedusidae: Pelomedusa), with descriptions of six new species. Zootaxa, 3795(5), 523. 10.11646/zootaxa.3795.5.2 [DOI] [PubMed] [Google Scholar]
- Pinheiro, J. , Bates, D. , DebRoy, S. , Sarkar, D. , EISPACK , Heisterkamp, S. , Van Willigen, B. , Ranke, J. , & R Core Team . (2022). nlme: Linear and nonlinear mixed effects models (3.1‐160). https://CRAN.R‐project.org/package=nlme
- Pritchard, P. C. H. (2001). Observations on body size, sympatry, and niche divergence in softshell turtles (Trionychidae). Chelonian Conservation and Biology, 4(1), 5–27. [Google Scholar]
- Prokoph, A. , Shields, G. A. , & Veizer, J. (2008). Compilation and time‐series analysis of a marine carbonate δ18O, δ13C, 87Sr/86Sr and δ34S database through Earth history. Earth‐Science Reviews, 87(3), 113–133. 10.1016/j.earscirev.2007.12.003 [DOI] [Google Scholar]
- Puttick, M. N. (2016). Partially incorrect fossil data augment analyses of discrete trait evolution in living species. Biology Letters, 12(8), 20160392. 10.1098/rsbl.2016.0392 [DOI] [PMC free article] [PubMed] [Google Scholar]
- Pyenson, N. D. , & Vermeij, G. J. (2016). The rise of ocean giants: Maximum body size in Cenozoic marine mammals as an indicator for productivity in the Pacific and Atlantic oceans. Biology Letters, 12(7), 20160186. 10.1098/rsbl.2016.0186 [DOI] [PMC free article] [PubMed] [Google Scholar]
- Quental, T. B. , & Marshall, C. R. (2010). Diversity dynamics: Molecular phylogenies need the fossil record. Trends in Ecology & Evolution, 25(8), 434–441. 10.1016/j.tree.2010.05.002 [DOI] [PubMed] [Google Scholar]
- R Core Team . (2021). R: A language and environment for statistical computing. R Foundation for Statistical Computing. [Google Scholar]
- Rabi, M. , Zhou, C.‐F. , Wings, O. , Ge, S. , & Joyce, W. G. (2013). A new xinjiangchelyid turtle from the Middle Jurassic of Xinjiang, China and the evolution of the basipterygoid process in Mesozoic turtles. BMC Evolutionary Biology, 13(1), 203. 10.1186/1471-2148-13-203 [DOI] [PMC free article] [PubMed] [Google Scholar]
- Raia, P. , & Meiri, S. (2011). The tempo and mode of evolution: Body sizes of island mammals. Evolution; International Journal of Organic Evolution, 65(7), 1927–1934. 10.1111/j.1558-5646.2011.01263.x [DOI] [PubMed] [Google Scholar]
- Revell, L. J. (2012). phytools: An R package for phylogenetic comparative biology (and other things). Methods in Ecology and Evolution, 3(2), 217–223. 10.1111/j.2041-210X.2011.00169.x [DOI] [Google Scholar]
- Rhodin, A. , Iverson, J. , Bour, R. , Fritz, U. , Georges, A. , Shaffer, H. , & Dijk, P. P. (2021). Turtles of the world: Annotated checklist and atlas of taxonomy, synonymy, distribution, and conservation status (9th ed.). 10.3854/crm.8.checklist.atlas.v9.2021 [DOI]
- Ronquist, F. , Teslenko, M. , van der Mark, P. , Ayres, D. L. , Darling, A. , Höhna, S. , Larget, B. , Liu, L. , Suchard, M. A. , & Huelsenbeck, J. P. (2012). MrBayes 3.2: Efficient bayesian phylogenetic inference and model choice across a large model space. Systematic Biology, 61(3), 539–542. 10.1093/sysbio/sys029 [DOI] [PMC free article] [PubMed] [Google Scholar]
- Saarinen, J. J. , Boyer, A. G. , Brown, J. H. , Costa, D. P. , Ernest, S. K. M. , Evans, A. R. , Fortelius, M. , Gittleman, J. L. , Hamilton, M. J. , Harding, L. E. , Lintulaakso, K. , Lyons, S. K. , Okie, J. G. , Sibly, R. M. , Stephens, P. R. , Theodor, J. , Uhen, M. D. , & Smith, F. A. (2014). Patterns of maximum body size evolution in Cenozoic land mammals: Eco‐evolutionary processes and abiotic forcing. Proceedings of the Royal Society B: Biological Sciences, 281(1784), 20132049. 10.1098/rspb.2013.2049 [DOI] [PMC free article] [PubMed] [Google Scholar]
- Scavezzoni, I. , & Fischer, V. (2018). Rhinochelys amaberti Moret (1935), a protostegid turtle from the Early Cretaceous of France. Peer J, 6, e4594. 10.7717/peerj.4594 [DOI] [PMC free article] [PubMed] [Google Scholar]
- Scheyer, T. M. , Klein, N. , Evers, S. W. , Mautner, A.‐K. , & Pabst, B. (2022). First evidence of Proganochelys quenstedtii (Testudinata) from the Plateosaurus bonebeds (Norian, Late Triassic) of Frick, Canton Aargau, Switzerland. Swiss Journal of Palaeontology, 141(1), 17. 10.1186/s13358-022-00260-4 [DOI] [PMC free article] [PubMed] [Google Scholar]
- Scheyer, T. M. , & Sander, P. M. (2007). Shell bone histology indicates terrestrial palaeoecology of basal turtles. Proceedings of the Royal Society B: Biological Sciences, 274(1620), 1885–1893. 10.1098/rspb.2007.0499 [DOI] [PMC free article] [PubMed] [Google Scholar]
- Schliep, K. P. (2011). phangorn: Phylogenetic analysis in R. Bioinformatics, 27(4), 592–593. 10.1093/bioinformatics/btq706 [DOI] [PMC free article] [PubMed] [Google Scholar]
- Schmidt‐Nielsen, K. , & Knut, S.‐N. (1984). Scaling: Why is animal size so important? Cambridge University Press. [Google Scholar]
- Schneider, C. A. , Rasband, W. S. , & Eliceiri, K. W. (2012). NIH Image to ImageJ: 25 years of image analysis. Nature Methods, 9(7), Article 7. 10.1038/nmeth.2089 [DOI] [PMC free article] [PubMed] [Google Scholar]
- Schnitzler, J. , Theis, C. , Polly, P. D. , & Eronen, J. T. (2017). Fossils matter – Understanding modes and rates of trait evolution in Musteloidea (Carnivora). Evolutionary Ecology Research, 18(2), 187–200. [Google Scholar]
- Shao, S. , Li, L. , Yang, Y. , & Zhou, C. F. (2018). Hyperphalangy in a new sinemydid turtle from the Early Cretaceous Jehol Biota. Peer J, 6, e5371. 10.7717/peerj.5371 [DOI] [PMC free article] [PubMed] [Google Scholar]
- Slater, G. J. , Harmon, L. J. , & Alfaro, M. E. (2012). Integrating fossils with molecular phylogenies improves inference of trait evolution. Evolution, 66(12), 3931–3944. 10.1111/j.1558-5646.2012.01723.x [DOI] [PubMed] [Google Scholar]
- Smith, F. A. , Boyer, A. G. , Brown, J. H. , Costa, D. P. , Dayan, T. , Ernest, S. K. M. , Evans, A. R. , Fortelius, M. , Gittleman, J. L. , Hamilton, M. J. , Harding, L. E. , Lintulaakso, K. , Lyons, S. K. , McCain, C. , Okie, J. G. , Saarinen, J. J. , Sibly, R. M. , Stephens, P. R. , Theodor, J. , & Uhen, M. D. (2010). The evolution of maximum body size of terrestrial mammals. Science, 330(6008), 1216–1219. 10.1126/science.1194830 [DOI] [PubMed] [Google Scholar]
- Smith, F. A. , Elliott Smith, R. E. , Lyons, S. K. , & Payne, J. L. (2018). Body size downgrading of mammals over the late Quaternary. Science, 360(6386), 310–313. 10.1126/science.aao5987 [DOI] [PubMed] [Google Scholar]
- Smith, F. A. , & Lyons, S. K. (2011). How big should a mammal be? A macroecological look at mammalian body size over space and time. Philosophical Transactions of the Royal Society B: Biological Sciences, 366(1576), 2364–2378. 10.1098/rstb.2011.0067 [DOI] [PMC free article] [PubMed] [Google Scholar]
- Smith, F. A. , Payne, J. L. , Heim, N. A. , Balk, M. A. , Finnegan, S. , Kowalewski, M. , Lyons, S. K. , McClain, C. R. , McShea, D. W. , Novack‐Gottshall, P. M. , Anich, P. S. , & Wang, S. C. (2016). Body size evolution across the Geozoic. Annual Review of Earth and Planetary Sciences, 44(1), 523–553. 10.1146/annurev-earth-060115-012147 [DOI] [Google Scholar]
- Sookias, R. B. , Butler, R. J. , & Benson, R. B. J. (2012). Rise of dinosaurs reveals major body‐size transitions are driven by passive processes of trait evolution. Proceedings of the Royal Society B: Biological Sciences, 279(1736), 2180–2187. 10.1098/rspb.2011.2441 [DOI] [PMC free article] [PubMed] [Google Scholar]
- Stadler, T. (2010). Sampling‐through‐time in birth–death trees. Journal of Theoretical Biology, 267(3), 396–404. 10.1016/j.jtbi.2010.09.010 [DOI] [PubMed] [Google Scholar]
- Stanley, S. M. (1973). An explanation for Cope's rule. Evolution, 27(1), 1–26. 10.2307/2407115 [DOI] [PubMed] [Google Scholar]
- Sterli, J. (2015). A review of the fossil record of Gondwanan turtles of the clade Meiolaniformes. Bulletin of the Peabody Museum of Natural History, 56(1), 21–45. 10.3374/014.056.0102 [DOI] [Google Scholar]
- Sterli, J. , de la Fuente, M. S. , & Rougier, G. W. (2018). New remains of Condorchelys antiqua (Testudinata) from the Early‐Middle Jurassic of Patagonia: Anatomy, phylogeny, and paedomorphosis in the early evolution of turtles. Journal of Vertebrate Paleontology, 38(4), 1–17. 10.1080/02724634.2018.1480112 [DOI] [Google Scholar]
- Syromyatnikova, E. V. , & Danilov, I. G. (2013). New material and phylogenetic position of Adocus bostobensis, a poorly known adocid turtle from the Late Cretaceous of Kazakhstan. Proceedings of the Zoological Institute RAS, 317(2), 195–201. 10.31610/trudyzin/2013.317.2.195 [DOI] [Google Scholar]
- Thomson, R. C. , Spinks, P. Q. , & Shaffer, H. B. (2021). A global phylogeny of turtles reveals a burst of climate‐associated diversification on continental margins. Proceedings of the National Academy of Sciences of the United States of America, 118(7), e2012215118. 10.1073/pnas.2012215118 [DOI] [PMC free article] [PubMed] [Google Scholar]
- Tong, H. , & Li, L. (2019). A revision of the holotype of Nanhsiungchelys wuchingensis, Ye, 1966 (Testudines: Cryptodira: Trionychoidae: Nanhsiungchelyidae). Cretaceous Research, 95, 151–163. 10.1016/j.cretres.2018.11.003 [DOI] [Google Scholar]
- Uyeda, J. C. , & Harmon, L. J. (2014). A novel Bayesian method for inferring and interpreting the dynamics of adaptive landscapes from phylogenetic comparative data. Systematic Biology, 63(6), 902–918. 10.1093/sysbio/syu057 [DOI] [PubMed] [Google Scholar]
- Valdes, N. , Bourque, J. R. , & Vitek, N. S. (2017). A new soft‐shelled turtle (Trionychidae, Apalone) from the Late Miocene of north‐central Florida. Bulletin of the Florida Museum of Natural History, 55(6), 117–138. [Google Scholar]
- van der Have, T. M. , & de Jong, G. (1996). Adult size in ectotherms: Temperature effects on growth and differentiation. Journal of Theoretical Biology, 183(3), 329–340. 10.1006/jtbi.1996.0224 [DOI] [Google Scholar]
- Van Voorhies, W. A. (1996). Bergmann size clines: A simple explanation for their occurence in ectotherms. Evolution; International Journal of Organic Evolution, 50(3), 1259–1264. 10.1111/j.1558-5646.1996.tb02366.x [DOI] [PubMed] [Google Scholar]
- Vitek, N. S. (2012). Giant fossil soft‐shelled turtles of North America. Palaeontologia Electronica, 15(16), 1–43. 10.26879/299 [DOI] [Google Scholar]
- Vitek, N. S. , & Joyce, W. G. (2015). A review of the fossil record of New World Turtles of the Clade Pan‐Trionychidae . Bulletin of the Peabody Museum of Natural History, 56(2), 185–244. 10.3374/014.056.0204 [DOI] [Google Scholar]
- Vlachos, E. , & Rabi, M. (2018). Total evidence analysis and body size evolution of extant and extinct tortoises (Testudines: Cryptodira: Pan‐Testudinidae). Cladistics, 34(6), 652–683. 10.1111/cla.12227 [DOI] [PubMed] [Google Scholar]
- Vlachos, E. (2018). A review of the fossil record of North American Turtles of the Clade Pan‐Testudinoidea . Bulletin of the Peabody Museum of Natural History, 59(1), 3. 10.3374/014.059.0101 [DOI] [Google Scholar]
- Vlachos, E. , & Tsoukala, E. (2016). The diverse fossil chelonians from Milia (late Pliocene, Grevena, Greece) with a new species of Testudo Linnaeus, 1758 (Testudines: Testudinidae). Papers in Palaeontology, 2(1), 71–86. 10.1002/spp2.1031 [DOI] [Google Scholar]
- Weems, R. E. , & Brown, K. M. (2017). More‐complete remains of Procolpochelys charlestonensis (Oligocene, South Carolina), an occurrence of Euclastes (upper Eocene, South Carolina), and their bearing on Cenozoic pancheloniid sea turtle distribution and phylogeny. Journal of Paleontology, 91(6), 1228–1243. 10.1017/jpa.2017.64 [DOI] [Google Scholar]
- Welch, B. L. (1947). The generalization of ‘student's’ problem when several different population variances are involved. Biometrika, 34(1/2), 28–35. 10.2307/2332510 [DOI] [PubMed] [Google Scholar]
- White, C. R. , Alton, L. A. , Bywater, C. L. , Lombardi, E. J. , & Marshall, D. J. (2022). Metabolic scaling is the product of life‐history optimization. Science, 377(6608), 834–839. 10.1126/science.abm7649 [DOI] [PubMed] [Google Scholar]
- White, E. P. , Ernest, S. K. M. , Kerkhoff, A. J. , & Enquist, B. J. (2007). Relationships between body size and abundance in ecology. Trends in Ecology & Evolution, 22(6), 323–330. 10.1016/j.tree.2007.03.007 [DOI] [PubMed] [Google Scholar]
- Williams, T. M. (2001). Intermittent swimming by mammals: A strategy for increasing energetic efficiency during diving. American Zoologist, 41(2), 166–176. 10.1093/icb/41.2.166 [DOI] [Google Scholar]
- Zachos, J. C. , Dickens, G. R. , & Zeebe, R. E. (2008). An early Cenozoic perspective on greenhouse warming and carbon‐cycle dynamics. Nature, 451(7176), Article 7176. 10.1038/nature06588 [DOI] [PubMed] [Google Scholar]
- Zink, R. M. , & Remsen, J. (1986). Evolutionary processes and patterns of geographic variation in birds. Current Ornithology, 4, 1–69. [Google Scholar]
- Zvonok, E. A. , & Danilov, I. G. (2017). A revision of fossil turtles from the Kiev clays (Ukraine, middle Eocene) with comments on the history of the collection of fossil vertebrates of A.S. Rogovich. Proceedings of the Zoological Institute RAS, 321(4), 485–516. 10.31610/trudyzin/2017.321.4.485 [DOI] [Google Scholar]
Associated Data
This section collects any data citations, data availability statements, or supplementary materials included in this article.
Data Availability Statement
The complete dataset, supertrees, and scripts used for the analyses in this study are available on OSF: https://osf.io/a45hv/?view_only=ffa79065eff54a848f17168c11f3e4f6.