Abstract
Simple Summary
This study refers to the mapping the dairy sheep and goat industry in Greece, in which information was obtained from 325 sheep and 119 goat farms. The findings can be used as baseline measurements; individual farms and cohorts of farms can be compared against the current results to draw conclusions against the countrywide situation. The results can also be used as reference points for the future, in order to assess changes that might have occurred in the meantime. Finally, the findings can be useful in the health management of small ruminants, in providing evidence-based support, within the scope of health management.
Abstract
The small ruminant industry is the most important branch of Greek agriculture. Nevertheless, despite the importance of small ruminant farming for Greece, no detailed mapping of the respective farms has been undertaken and published. The present work refers to mapping the dairy sheep and goat industry in Greece through an extensive, countrywide cross-sectional study, in which information was obtained from 325 sheep and 119 goat farms. The objectives were the collection, the classification and the presentation of data obtained from all these farms through interviews, using a questionnaire and through examination of samples collected during the visits. All the farms enrolled in the study were visited by the investigators. Initially, information was obtained by means of a detailed, structured questionnaire with 442 questions. Moreover, samples of milk were collected from the bulk-tank of each farm and faecal samples were collected from female animals in each farm. The milk samples were processed for cytological and microbiological examination. Staphylococcus spp. and Listeria spp. isolates were recovered and identified at a species level; furthermore, a full antibiotic sensitivity pattern assessment was conducted. Faecal samples were processed by standard parasitological tests for the identification of protozoan, trematode, cestode and gastrointestinal and respiratory nematode parasites. The paper presents the cumulative findings of the study, i.e., the answers to the questions during the interviews and the results of the laboratory examinations performed in the samples; the findings are presented separately for sheep and goat farms. The findings can be used as baseline measurements; individual farms and cohorts of farms can be compared against the current results to draw conclusions against the countrywide situation. Moreover, the current results can be used as reference points for the future, in order to assess changes that might have occurred in the meantime. The study also described the differences between farms with sheep or goats; in total, differences in 137 parameters were identified. Some of these can be attributed to the different management systems practiced; sheep flocks are managed mostly under the intensive or semi-intensive system, whilst goat herds are managed mostly under the semi-extensive or extensive system. These findings can be useful in the health management of small ruminants, in providing evidence-based support and within the scope of precise livestock medicine and health management.
Keywords: dairy, goat, mastitis, milk quality, parasitology, sheep
1. Introduction
Greece has a high number of sheep (8,400,000 animals) and goats (3,600,000 animals) [1]. The relevant populations of these species amount to approximately 6.5% and 22.0% of the respective numbers of small ruminants in Europe [2]. Thus, sheep and goat farming constitutes the most important animal farming industry in Greece. The sector generates 18% of the total gross product of the primary sector and 0.8% of the total annual gross domestic product of the country [3].
Sheep and goats follow a dairy production system in the majority of farms (>98% of such farms in the country) [3]. In 2022, annual milk production from sheep and goats in Greece was 716,000 and 160,000 tons, respectively [4]. It is noteworthy that, in Greece, small ruminant milk production exceeds milk production from cattle [5], which, in 2022, amounted to 643,000 tons [6], and, in this context, Greece is unique in Europe. In Greece (as well as in Europe), the greater proportion (>90%) of the milk collected from small ruminants is used for the manufacturing of dairy products (mainly cheese and yoghurt) [2].
However, and despite the importance of small ruminant farming for Greece, no detailed countrywide mapping of the respective farms has been undertaken and published. Previous papers reported limited information, for example, only regarding specific practices applied in sheep and goat farms or with narrow geographical coverage. For example, previous studies reported information about management practices performed only in farms in some parts of the country (e.g., island of Lesvos: Kizos et al. [7], Peloponnese: Manolopoulou et al. [8], Central Greece: Perucho et al. [9]); other studies reported information only about farms with specific animal breeds (e.g., sheep of the Friesarta breed: Kominakis et al. [10], sheep of the Chios breed: Gelasakis et al. [11]).
Thus far, an extensive investigation of the countrywide coverage in Greece of sheep flocks and goat herds, aiming to assess and evaluate many variables, has not been performed. Such an extensive study can contribute valuably to the small ruminant industry.
In this respect, an extensive cross-sectional study of the dairy sheep and goat industry in Greece was performed. During the study, information was obtained from 325 sheep and 119 goat farms throughout the country. The objectives were the collection, the classification and the presentation of the data obtained from all these farms. Cumulatively, over 215,000 data were collected during the study.
2. Materials and Methods
2.1. Sheep and Goat Farms and Collection of Information and Samples
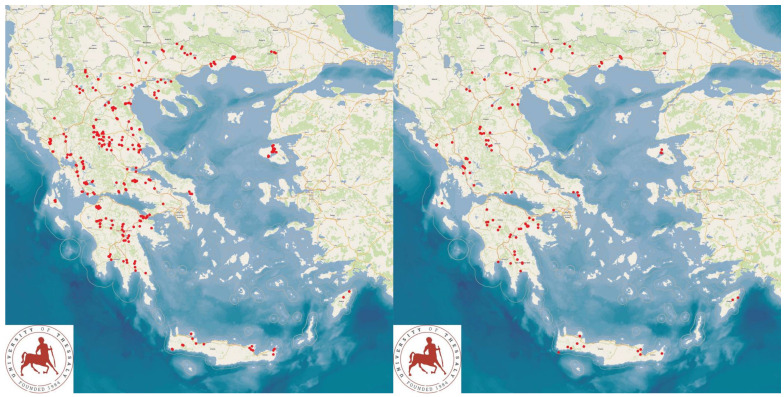
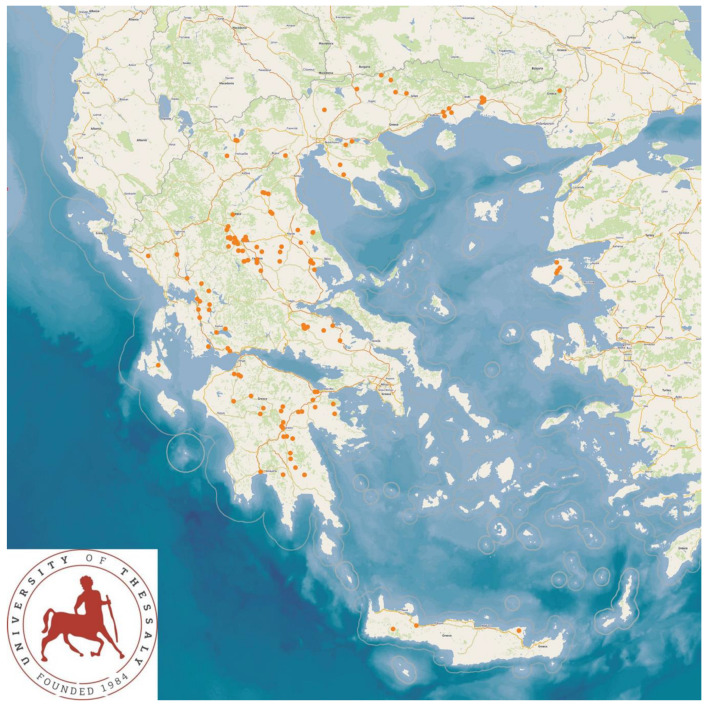
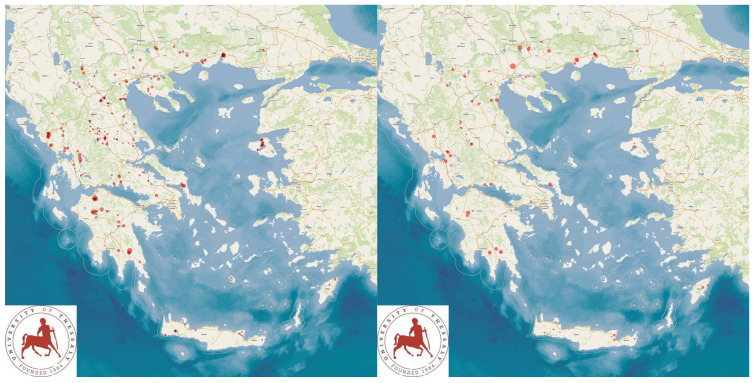
The study was performed in 325 sheep flocks and 119 goat herds (Figure 1) throughout Greece, during the period April 2019 to July 2020. Initially, professional veterinarians, active in the field of sheep/goat health management practice across Greece, were contacted by telephone and were asked about their interest and willingness to collaborate in the project. Thus, in total, 48 veterinarians were contacted and, among them, 47 (97.9%) agreed to collaborate.
Figure 1.
Locations (red dots) of the 325 sheep (left figure) and 119 goat (right figure) farms around Greece, which were visited for a detailed and extensive interview and for collection of samples.
The farms were selected by the collaborating veterinarians and were enrolled in the study on a convenience basis (i.e., the acceptance by farmers to receive a visit by academic veterinary staff for a detailed and extensive interview and for the collection of samples). Each of these veterinarians had a stable, although not contractual, association with the respective farm, among those selected for visitation, and were responsible for their decisions and actions in relation to the health and welfare of the animals therein, in full accordance with the relevant veterinary conduct codes. Farm visits were arranged by the collaborating veterinarians. The three investigators travelled across Greece and personally visited all the farms included in this study, in order to collect information and samples. In total, visits had been scheduled to 446 farms; however, in two farms (0.4%), upon the arrival of the investigators to the respective farms, the farmers declined the visit and the interview and did not agree to collaborate.
Upon arrival at the farm, the veterinarian accompanying the investigators introduced them to the farmer. The senior investigator in the party explained in detail to all the farmers the background, the objectives and the characteristics of the study, as well as the aims of the interview and the sampling procedures; moreover, he introduced the farmer to the two junior investigators.
A structured detailed questionnaire was employed to carry out the interview. This questionnaire had been previously tested for the validity of its content [12]. In the questionnaire, there were general questions, as well as questions about the socio-demographic characteristics of farmers, about the animals, about the health management and the production characteristics of the farm, as well as about the infrastructure [12]. If farmers requested the clarification of the questions asked during the interview, appropriate answers and relevant clarifications were provided immediately by the interviewer. In total, the questionnaire included 442 questions [12].
During the visits to the farms, samples of bulk-tank milk were also collected [13]. For sampling, after stirring the content of the tank, milk samples were collected by means of plastic, sterile pipettes, following the aseptic technique. Four bulk-tank samples were collected from the tank of each farm. Faecal samples were subsequently obtained from the female animals (ewes/does) on each farm [14]. Faecal samples were obtained directly from the rectum of animals, following the standard technique. In each flock or herd, 20, 30, 40, or 50 females were selected for sampling (respectively, for farms with 165, 166–330, 331–500, or >500 ewes/does). Finally, animals in the farm were assessed for body condition; this was performed by a certified European Veterinary Specialist in Small Ruminant Health Management, in order to maintain uniform and consistent scoring results (0–5, including half scores), based on the appropriate published standards [15].
Samples were stored at 0.0 to 4.0 °C (milk) or at 8.0 to 10.0 °C (feces) by using portable refrigerators. Transportation of the samples to the laboratory was made by the investigators and by car; samples collected from farms in the islands were also transported as accompanying luggage by airplane or by boat.
2.2. Laboratory Examinations
Milk samples were processed for somatic cell counting and for measuring chemical composition [13], and were performed on the samples within 4 h after collection. From each milk sample obtained, two subsamples were created and processed; therefore, each separate test was performed four times (each one in different subsamples). Somatic cell counting (Lactoscan SCC; Milkotronic Ltd., Nova Zagora, Bulgaria) and measurement of milk composition (Lactoscan Farm Eco; Milkotronic Ltd., Nova Zagora, Bulgaria) were performed on each of the four subsamples [13] within 4 h after sample collection.
Bacteriological examinations started within 24 h after collection of samples. The milk samples were processed for total bacterial count. Total bacterial counts in milk were obtained by following the standardized procedures of the American Public Health Association [16].
Bacteriological examinations were also performed for isolation of Staphylococcus spp. (by using standard techniques [17,18]) and for identification of these bacteria on a species level, which was performed by means of Matrix-Assisted Laser Desorption/Ionization Time-of-Flight Mass Spectrometry (VITEK MS; BioMerieux, Marcy-l’-Étoile, France). Examination was also performed for the isolation of Listeria spp. (by using the officially acceptable ISO 11290-1:2017 [19], which is the currently valid and standardized protocol for this task) and the identification of the isolated organisms at species level (by using MALDI-TOF as above).
Staphylococcal isolates were tested in vitro for evaluation of potential slime production and biofilm formation. For this, the combination of (a) the appearance of colonies on Congo Red agar plates and (b) the findings of the microplate adhesion test, as detailed by Vasileiou et al. [20], were used.
Staphylococcal isolates were processed for testing antibiotic susceptibility to 20 antibiotics (amikacin, ampicillin, ceftaroline, ciprofloxacin, clindamycin, erythromycin, fosfomycin, fucidic acid, gentamicin, linezolid, moxifloxacin, mupirocin, mupirocin high level, oxacillin, penicillin G, rifampin, teicoplanin, tetracycline, tobramycin and trimethoprim–sulfamethoxazole). Susceptibility testing was carried out by using the automated system BD Phoenix™ M50 (BD Diagnostic Systems, Sparks, MD, USA). The criteria of the European Committee on Antimicrobial Susceptibility Testing (EUCAST) (http://www.eucast.org) were considered for the interpretation of the results.
The susceptibility of the Listeria spp. isolates to five antibiotics (benzylpenicillin, ampicillin, meropenem, erythromycin and trimethoprim/sulfamethoxazole) was tested by means of the disk diffusion method, also by following the relevant recommendations of EUCAST.
Parasitological examinations started within 48 h after the collection of samples and were performed as detailed before [13]. In brief, 5 g of each of the individual animal’s faecal sample from a farm were taken initially and mixed to form a pooled faecal sample from the farm, which was then processed in a homogenizing blender. The usefulness of pooling ovine faecal samples, as a rapid procedure for the identification of gastrointestinal helminths at a farm level, has been confirmed by Rinaldi et al. [21].
In the pooled faecal samples, the following parasitological tests were performed: the McMaster technique (3 g), the flotation method (1 g), the sedimentation technique (1 g) and coproculturing (remaining quantity). Also, a faecal smear was performed and stained according to the Ziehl–Neelsen technique for microscopic observation [22]. Each of the first three techniques were applied in quadruplicate samples (each 5 g) obtained from the pooled faecal sample, whilst coproculture was performed once. Parasitological examinations aimed for identification of protozoan, trematode, cestode and gastrointestinal and respiratory nematode parasites.
2.3. Data Management and Analysis
Data were curated and processed in Microsoft Excel and analyzed using SPSS v. 21 (IBM Analytics, Armonk, NY, USA). Initially, basic descriptive analyses were carried out and descriptive statistical measures appropriate for each type of data were obtained. Results obtained from sheep flocks and goat herds were considered separately for the presentation of the findings and the analysis. Moreover, in order to evaluate potential associations with the location of farms, the 13 administrative regions of Greece were clustered into four main areas: North, Central, South and Islands (Table S1, Figure S1).
Comparisons between the results obtained for sheep flocks and goat herds were performed using Pearson’s chi-squared test, Fisher exact test, z-test for proportions, analysis of variance or Kruskal–Wallis test, as appropriate. For results of somatic cell counts and total bacterial counts in milk, appropriate logarithmic transformations were performed before the analysis [23]. In all analyses, statistical significance was defined at p < 0.05.
3. Results
The study presents the detailed results for small ruminant dairy farms, sheep flocks (n = 325) and goat herds (n = 119), as obtained from farms located in all the 13 administrative regions of Greece. The farms studied in the present work represented 0.84% and 0.91% of the total sheep flocks and goat herds, respectively, which delivered milk at the time of the investigation [4]. The farms from which the data were obtained included, in total, 110,228 sheep and 30,192 goats. In total, over 215,000 data were collected. It is noted that, for their collection, approximately 35,000 km in total were driven across Greece and, additionally, six domestic flights and six domestic sails were also taken. The cumulative findings are in Tables S2 and S3. Selected variables among those findings are shown in Table 1 and Table 2 and in Figure 1, Figure 2, Figure 3, Figure 4, Figure 5, Figure 6, Figure 7, Figure 8, Figure 9, Figure 10, Figure 11 and Figure 12.
Table 1.
Selected cumulative data collected during the mapping of 444 small ruminant farms in a countrywide investigation in Greece, classified according to animal species in the farms.
| Sheep Flocks (n = 325) | Goat Herds (n = 199) | p-Value 1 | |
|---|---|---|---|
| General Details | |||
| Management system 2 | Intensive: 13.5%, semi-intensive: 43.1%, semi-extensive: 35.7%, extensive: 7.7% | Intensive: 7.5%, semi-intensive: 24.4%, semi-extensive: 51.3%, extensive: 16.8% |
<0.0001 3 |
| Infrastructure | |||
| Year of the initial establishment of the farm | X: year 1981 ± 1 year 3 | X: year 1977 ± 1 year | 0.09 |
| Availability of a main building for animals | Yes: 97.8%, no: 2.2% 4 | Yes: 98.3%, no: 1.7% | 0.75 |
| Availability of a milking parlour | Yes: 78.5%, no: 21.5% | Yes: 55.5%, no: 44.5% | <0.0001 |
| Type of milking parlour | Fishbone: 0.4%, circular: 3.9%, linear parallel: 35.7%, linear one-sided: 59.6%, other: 0.4% | Fishbone: 0.0%, circular: 6.1%, linear parallel: 31.8%, linear one-sided: 62.1%, other: 0.0% | 0.85 |
| Number of animal positions in the parlour | X: 25 ± 1 positions | X: 25 ± 2 positions | 0.65 |
| Total number of feed troughs available | X: 28 ± 2 troughs | X: 26 ± 3 troughs | 0.71 |
| Total number of drinking points available | X: 10 ± 0.5 points | X: 9 ± 1.0 points | 0.46 |
| Total grazing land | X: 510 ± 50 acres | X: 1322 ± 390 acres | 0.002 |
| Animals | |||
| No. of female animals (small ruminants) in the farm | X: 325 ± 13 ewes | X: 237 ± 20 does | 0.0006 |
| No. of male animals (small ruminants) in the farm | X: 15 ± 0.5 rams | X: 16 ± 1.5 bucks | 0.47 |
| Breed of female animals | Assaf: 9.2%, Awassi: 0.3%, Boutsko: 0.6%, Chios: 13.5%, Crossbreds: 13.2%, Friesarta: 3.7%, Friesian: 4.0%, Karagouniko: 1.5%, Kefallinia: 0.3%, Lacaune: 29.2%, ‘Local’: 16.9%, Mytilini: 5.5%, Sfakia: 1.8% |
Alpine: 7.6%, Crossbreds: 15.1%, Damascus: 15.1%, Kefallinia: 0.8%, Indigenous Greek (Capra prisca): 42.0%, Murciano-Granadina: 10.9%, Saanen: 4.2%, Skopelos: 4.2% |
n/a |
| Average age of culling ewes/does | X: 5.9 ± 0.1 years | X: 6.9 ± 0.1 years | <0.0001 |
| Production Characteristics | |||
| Month of the start of the lambing/kidding season | October (January–December) 5 |
October (January–December) |
0.11 |
| Annual milk quantity per animal obtained during the preceding milking period | X: 207 ± 5 L | X: 201 ± 10 L | 0.55 |
| Total number of lambs/kids born per female animal during the preceding lambing/kidding season | X: 1.33 ± 0.1 lambs | X: 1.30 ± 0.2 kids | 0.15 |
| Average age of lambs/kids at slaughter | X: 50 ± 1 days | X: 65 ± 3 days | <0.0001 |
| Average carcass weight of lambs/kids at slaughter | X: 10.0 ± 0.1 kg | X: 9.4 ± 0.2 days | 0.012 |
| Health Management | |||
| The two health problems in lambs/kids considered to be of higher importance (top three outcomes presented) | Diarrhoea: 71.7%, pneumonia: 27.4%, contagious ecthyma: 7.7% | Diarrhoea: 69.7%, pneumonia: 22.7%, clostridial infection: 10.1% | n/a |
| The two health problems in adult animals considered to be of higher importance (top three outcomes presented) | Mastitis: 66.2%, pneumonia: 17.5%, lameness: 6.2% | Mastitis: 42.9%, paratuberculosis: 19.3%, pneumonia: 14.3% | n/a |
| Incidence rate of total deaths, of any cause, in adult animals during the preceding season | 5.2% (5.0–5.5%) 6 | 5.9% (5.8–6.0%) | 0.023 |
| Collaboration with a veterinarian | Yes: 87.1%, no: 12.9% | Yes: 84.9%, no: 15.1% | 0.55 |
| Use of laboratory diagnostic examinations | Yes: 40.9%, no: 59.1% | Yes: 43.7%, no: 56.3% | 0.60 |
| Maintenance of prescribed withdrawal periods after administration of pharmaceuticals | Yes: 98.8%, no: 1.2% | Yes: 98.3%, no: 1.7% | 0.72 |
| Overall incidence of mastitis during the preceding season | 3.9% (3.8–4.0%) | 2.8% (2.6–3.0%) | <0.0001 |
| Overall incidence of abortion during the preceding season | 2.0% (1.9–2.1%) | 2.5% (2.7–2.9%) | <0.0001 |
| Overall incidence of lameness during the preceding season | 2.8% (2.7–2.9%) | 1.2% (1.1–1.4%) | <0.0001 |
| Overall incidence of respiratory problems in young animals during the preceding season | 1.4% (1.3–1.5%) | 1.1% (1.0–1.2%) | <0.0001 |
| Overall incidence of diarrhoea in young animals during the preceding season | 7.9% (7.8–8.0%) | 10.4% (10.0–10.7%) | <0.0001 |
| Reproductive management | No hormonal control: 66.8%, administration of melatonin: 7.1%, administration of progestogens: 27.4% | No hormonal control: 83.2%, administration of melatonin: 4.2%, administration of progestogens: 13.4% | 0.0007 |
| Duration of mating period | 2 (1–12) months | 2 (1–12) months | 0.09 |
| Age for lamb/kid removal from their dams | X: 50 ± 1 days | X: 65 ± 3 days | <0.0001 |
| Daily number of milking sessions | 2 (1–3) | 2 (1–3) | 0.0001 |
| Duration of the dry-period | X: 3.0 ± 0.1 months | X: 2.9 ± 0.1 months | 0.84 |
| Vaccination against Chlamydia infection | Yes: 40.0%, no: 60.0% | Yes: 32.8%, no: 67.2% | 0.16 |
| Vaccination against Brucella infection | Yes: 100.0%, no: 0.0% | Yes: 100.0%, no: 0.0% | n/a |
| Vaccination against clostridial infection | Yes: 97.2%, no: 2.8% | Yes: 99.2%, no: 0.8% | 0.23 |
| Vaccination against mastitis | Yes: 39.7%, no: 61.2% | Yes: 28.6%, no: 71.4% | 0.047 |
| Vaccination against contagious agalactia | Yes: 57.2%, no: 42.8% | Yes: 54.6%, no: 45.4% | 0.62 |
| Vaccination against bacterial respiratory infections | Yes: 44.3%, no: 55.7% | Yes: 32.8%, no: 67.2% | 0.028 |
| Vaccination against paratuberculosis | Yes: 3.4%, no: 96.6% | Use: 26.1%, no: 73.9% | <0.0001 |
| Administration of anthelmintics to sheep/goats in the farm | Yes: 99.1%, no: 0.9% | Yes: 98.3%, no: 1.7% | 0.50 |
| Administration of ectoparasiticides to sheep/goats in the farm | Yes: 33.5%, no: 66.5% | Yes: 58.0%, no: 42.0% | <0.0001 |
| Application of disinfections in the farm | Yes: 91.1%, no: 8.9% | Yes: 85.7%, no: 14.3% | 0.10 |
| Foot care | Yes: 68.9%, no: 31.1% | Yes: 60.5%, no: 39.5% | 0.10 |
| Nutrition | |||
| Provision of hay as fodder to animals | Yes: 99.7%, no: 0.3% | Yes: 97.5%, no: 2.5% | 0.029 |
| Total quantity of hay consumed during the preceding season | X: 84 ± 5 tons | X: 46 ± 7 tons | 0.0003 |
| Provision of straw to animals | Yes: 79.4%, no: 20.6% | Yes: 65.5%, no: 34.5% | 0.003 |
| Provision of silage to adult animals | Yes: 22.2%, no: 77.8% | Yes: 15.1%, no: 84.9% | 0.10 |
| Total quantity of silage consumed during the preceding season | X: 142 ± 31 tons | X: 98 ± 35 tons | 0.50 |
| Provision of finished feed to animals | Yes: 93.5%, no: 6.5% | Yes: 86.6%, no: 13.4% | 0.018 |
| Total quantity of finished feed (concentrate) consumed during the preceding season | X: 86 ± 6 tons | X: 66 ± 8 tons | 0.12 |
| Premix purchase for use in diets | Yes: 88.0%, no: 12.0% | Yes: 81.5%, no: 18.5% | 0.08 |
| Human Resources | |||
| Age | X: 47 ± 1 years | X: 47 ± 1 years | 0.64 |
| Length of previous animal farming experience | X: 24 ± 1 years | X: 25 ± 1 years | 0.80 |
| Highest level of general education | Primary: 17.5%, secondary: 69.2%, tertiary: 13.2% | Primary: 16.8%, secondary: 74.8%, tertiary: 8.4% | 0.35 |
| Farmer by profession | Yes: 89.8%, no: 10.2% | Yes: 88.2%, no: 11.8% | 0.63 |
| Personal opinion regarding occurrence of transmission of diseases from animals to the farmer or members of the family | Yes: 13.5%, no: 86.5% | Yes: 22.7%, no: 77.3% | 0.020 |
| Farm worker employment | Yes: 37.8%, no: 62.2% | Yes: 28.6%, no: 71.4% | 0.07 |
1 p-value for comparison between sheep flocks and goat herds; 2 Management system classified according to the system of the European Food Safety Authority [24]; 3 Figures present mean ± standard error of the mean (X ± σM.); 4 Figures present proportions of farms for each category within the variable; 5 Figures present median (minimum–maximum) value; 6 Figures present average (95% confidence interval) value.
Table 2.
Selected cumulative results obtained during field and laboratory examinations in samples collected from 444 small ruminant farms in a countrywide investigation in Greece, classified according to animal species in the farms.
| Sheep Flocks (n = 325) | Goat Herds (n = 199) | p-Value 1 | |
|---|---|---|---|
| Clinical Examinations of Animals at the Farms | |||
| Body condition scoring | X: 2.38 ± 0.02 (scale: 0–5) 2 | X: 2.54 ± 0.03 (scale: 0–5) | <0.0001 |
| Laboratory Examinations in Bulk-Tank Milk Samples | |||
| Somatic cell counts | 0.488 × 10⁶ (0.451 × 10⁶–0.529 × 10⁶) cells mL−1 3 | 0.838 × 10⁶ (0.759 × 10⁶–0.933 × 10⁶) cells mL−1 | <0.0001 |
| Total bacterial counts | 398 × 103 (331 × 103–479 × 103) cfu 4 mL−1 | 581 × 103 (447 × 103–741 × 103) cfu mL−1 | <0.0001 |
| Staphylococcal isolation | Yes: 63.4%, no: 36.6% 5 | Yes: 63.0%, no: 37.0% | 0.94 |
| Listeria isolation | Yes: 1.2%, no: 98.8% | Yes: 0.0%, no: 100.0% | 0.22 |
| Fat content | X: 6.16% ± 0.05% | X: 4.77% ± 0.44% | 0.0005 |
| Protein content | X: 4.43% ± 0.01% | X: 3.23% ± 0.30% | 0.0008 |
| Parasitological Examinations in Faecal Samples | |||
| epg counts | X: 214 ± 13 | X: 219 ± 22 | 0.77 |
1 p-value for comparison between sheep flocks and goat herds; 2 Figures present mean ± standard error of the mean (X ± σM.); 3 Figures present mean (95% confidence intervals); 4 cfu: colony-forming units; 5 Figures present proportions of farms for each category within the variable.
Figure 2.
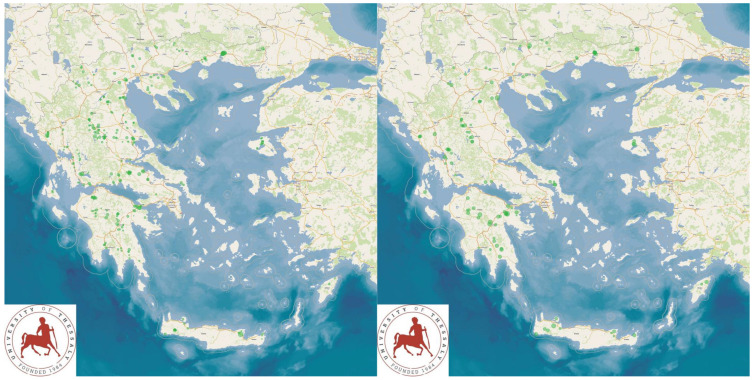
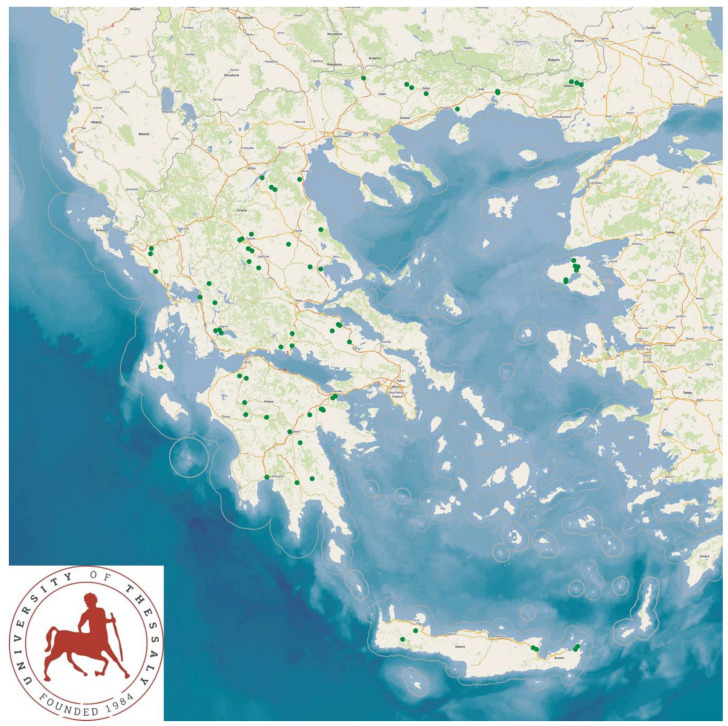
Locations (green dots) of 325 sheep flocks (left figure) and 119 goat herds (right figure) around Greece, in accordance with somatic cell counts in bulk-tank milk (diameter of dots on maps is proportionate to cell counts).
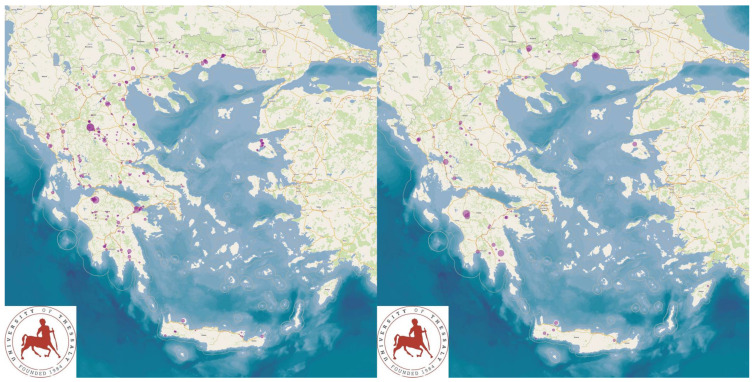
Figure 3.
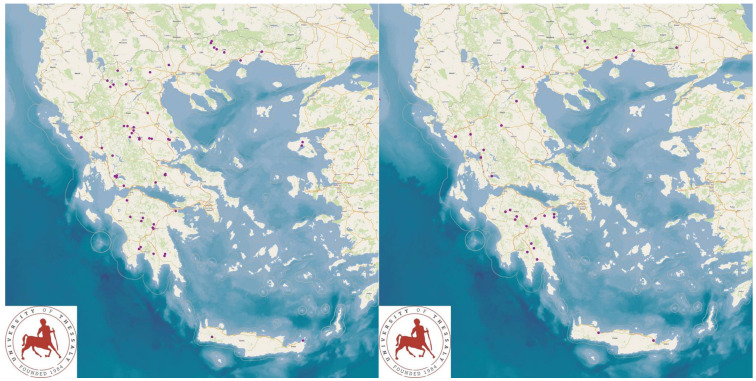
Locations (purple dots) of sheep flocks (left figure) and goat herds (right figure) around Greece, in which total bacterial counts over 1500 × 103 cfu mL−1 in bulk-tank milk were detected.
Figure 4.
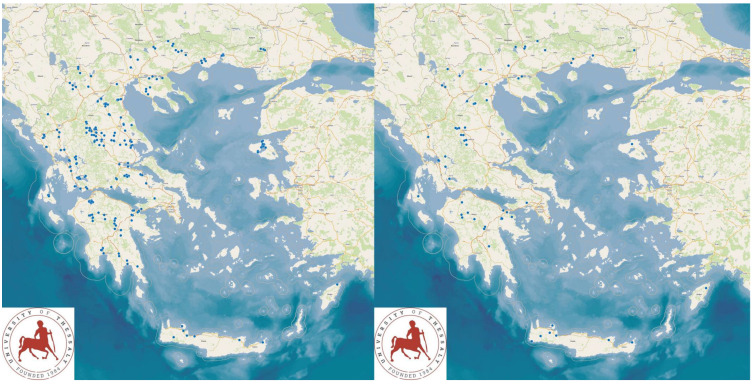
Locations (blue dots) of sheep flocks (left figure) and goat herds (right figure) around Greece, in which machine-milking was practiced.
Figure 5.
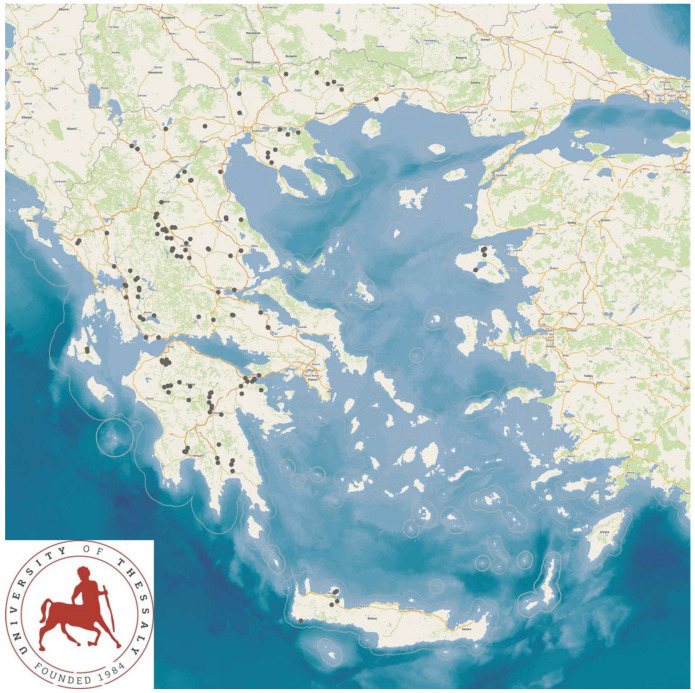
Locations (orange dots) of sheep flocks and goat herds around Greece, in which staphylococci resistant to at least one antibiotic were isolated from bulk-tank milk.
Figure 6.
Locations (purple dots) of sheep flocks (left figure) and goat herds (right figure) around Greece, in accordance with the incidence of clinical mastitis in ewes/does (diameter of dots on maps is proportionate to incidence of the pathological condition).
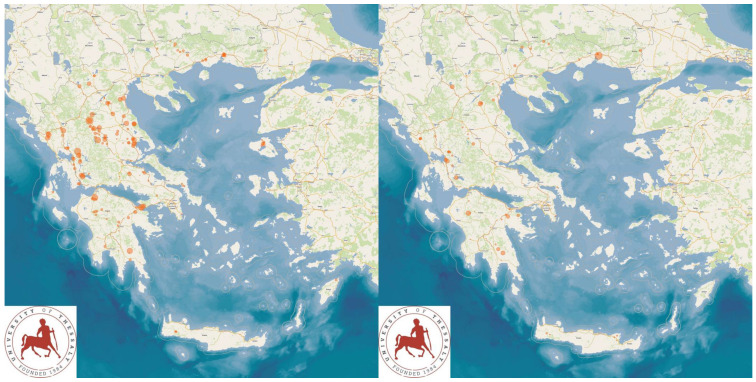
Figure 7.
Locations (orange dots) of sheep flocks (left figure) and goat herds (right figure) around Greece, in accordance with incidence of diarrhoea in lambs/kids (diameter of dots on maps is proportionate to incidence of the pathological condition.
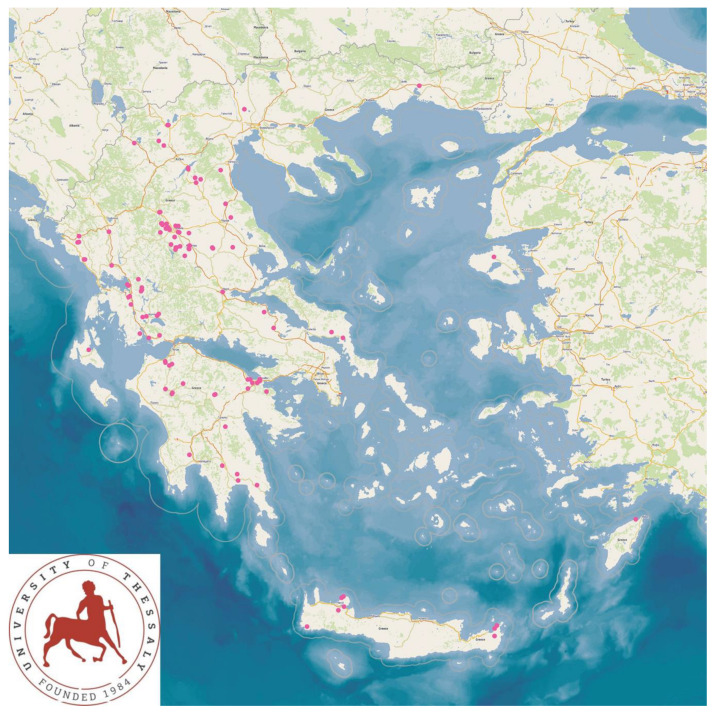
Figure 8.
Locations (pink dots) of sheep flocks and goat herds around Greece, in which reproductive control techniques were employed.
Figure 9.
Locations (black dots) of sheep flocks and goat herds around Greece, in which vaccination against staphylococcal mastitis was performed.
Figure 10.
Locations (green dots) of sheep flocks and goat herds around Greece, in which D. dendriticum was detected in pooled faecal samples.
Figure 11.
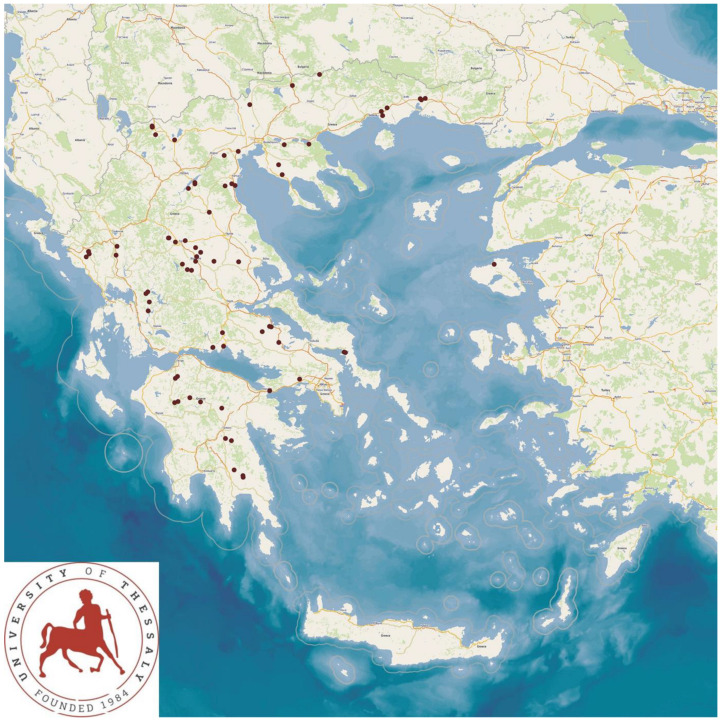
Locations (brown dots) of sheep flocks and goat herds around Greece, in which Nematodirus spp. was detected in pooled faecal samples.
Figure 12.
Locations (red dots) of 280 sheep flocks (left figure) and 90 goat herds (right figure) around Greece, in which no anthelmintic treatment was carried out during the two months prior to sampling, in accord with epg counts in pooled faecal samples (diameter of dots on maps is proportionate to epg counts).
There was a seasonality in the visits to the farm (Table S4), with a significantly smaller proportion of farms visited during the autumn (p < 0.0001), although there was no difference in the proportion of farms visited during each of the other three seasons (p = 0.07).
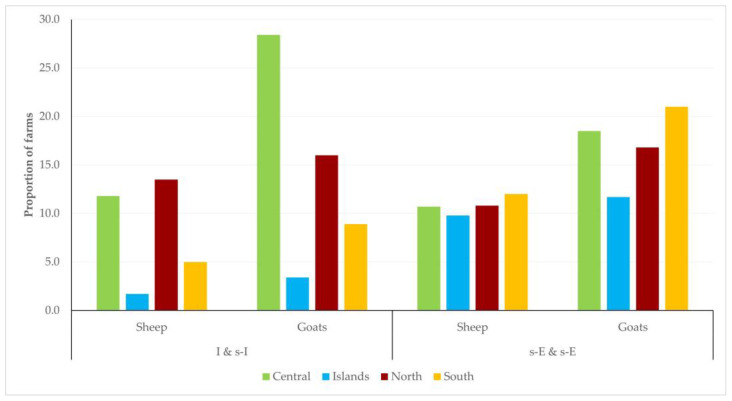
There was clear evidence of significant differences in the distribution of farms in the country in accordance with the management system and the geographical area (p < 0.0001 for sheep flocks and p = 0.010 for goat herds). Most farms managed under the intensive or semi-intensive system were located in the central or north areas of the country, whilst farms managed under the semi-extensive or extensive system were, in general, equally distributed among the four geographical areas (Figure 13, Table S5).
Figure 13.
Management system applied in 444 small ruminant farms in a countrywide investigation in Greece, in accordance with the location of the farms.
There were significant associations between the management system applied in the farms and the breed of animals therein (p < 0.0001) (Table S6). The results indicated that breeds characterized by high milk production (e.g., sheep: Chios, Lacaune; goats: Murciano-Granadina, Saanen) were more frequently present in farms managed under the intensive or semi-intensive system, whilst breeds characterized by low milk production were more frequently present in farms managed under the semi-extensive or extensive system. Furthermore, in farms with breeds with milk production, machine-milking was applied more frequently than in farms with low milk production (p < 0.001 for sheep flocks, p = 0.002 for goat herds) (Figure 14, Table S7).
Figure 14.
Proportion of 444 small ruminant farms applying machine-milking in accordance with the breed of animals in the farms, as found in a countrywide investigation in Greece.
The study also described differences between farms with sheep or goats. In total, differences in 137 parameters were identified between sheep flocks and goat herds (Appendix A and Appendix B).
Finally, there was a clear association between the breeds of animals in sheep flocks and the geographical location of the farms (p < 0.0001) (Table S8). Breeds with high milk production were located mainly in the central and north part of the country. In contrast, no such association was seen for goat herds (p = 0.07).
4. Discussion
The study presents, for the first time in Greece, the detailed results of dairy small ruminant farms with sheep flocks and goat herds. Moreover, to the best of our knowledge, also at international level, this study is one of the largest studies in small ruminant farms ever performed in any country.
In this study, dairy farms in all parts of Greece, and in all the 13 administrative regions of the country, were visited and included herein. Therefore, the conditions applied throughout the country were considered and assessed and, thus, local and regional conditions, factors and particularities weighed less. That way, there was also some stratification in the selection of the farms in the study, as the flocks and herds visited were located in all the 13 administrative regions of the country.
Although farms were enrolled in the study on a convenience basis, this approach nevertheless guaranteed visit acceptance by the farmers and a lack of suspiciousness and distrust for the investigators, resulting in a relaxed interview. Furthermore, our approach allowed the inclusion of flocks and herds with farmers genuinely willing to participate in the study and to provide thoughtful and correct answers. Moreover, and in order to minimize possible bias, the study also used consistent methodologies.
The visits to the farms had to take place during the milking period of the ewes and does, in order to collect samples of bulk-tank milk for laboratory examinations (Table S2). Lambing/kidding of small ruminants in Greece takes place during the autumn (on average, the mating season in Greece starts in May or June [25]), hence only a smaller proportion of farms could have been visited during that season; this was reflected in the significantly smaller proportion of farms visited in autumn. Nevertheless, there was no significant difference in the proportions of farms visited during the other three seasons, which further explains the reason for the reduced proportions of visits to farms during the autumn.
Previous papers discussed associations and interactions between the various variables and focused on establishing predictors for various outcomes related to these results, e.g., [25,26,27,28,29]. The present paper presents the entirety of the findings, thus showing details of the sheep and goat industries in Greece and allowing overall comparisons with the respective animal industries of other countries and regions of the world. Moreover, the current results can be used by farmers, veterinarians, technical advisors, authorities, etc., as baseline measurements, as they cover an important proportion of the respective sector of the country. Furthermore, the findings and outcomes in individual farms or cohorts of farms (e.g., farms in agricultural cooperatives) can be compared against the current findings; that way, conclusions can be drawn regarding the standing of these farms against the national situation.
Moreover, the current results can be used as reference points for the future. Previously, we considered older studies on the milk quality of sheep, performed in the 1990s in the country, for comparisons against the current findings and assess the potential changes; the average values for somatic cell counts in the bulk-tank milk from sheep flocks in the 1990s were reported to exceed 1.0 × 10⁶ cells mL−1 [30,31], whilst the mean value in the current study was found to be 0.488 × 10⁶ (95% confidence intervals: 0.451 × 10⁶–0.529 × 10⁶) cells mL−1. Although those studies included a small number of farms and were of limited geographical coverage, they have made possible a comparison of the present situation with that which was prevalent in the country some years ago, even if it is difficult to make direct comparisons between studies that were performed using different methodologies and over a lengthy span of years. The comparison indicated a clear improvement during the last 25 to 30 years. In the same context, the current findings can be used by future researchers, who will study the situation in the country in 15 to 20 years’ time and will compare it to previous relevant studies to assess the changes that will have taken place during those years.
Some of the differences identified between sheep flocks and goat herds can be attributed to the different management systems practiced between the two types of farms: sheep flocks are managed mostly under the intensive or semi-intensive systems, whilst goat herds are managed mostly under the semi-extensive or extensive systems. Inputs in goat farming are lower than in sheep farming, and this is reflected in the infrastructure (e.g., less frequent use of machine-milking, less frequent connection to the national electricity network and larger areas for grazing) and the animals (e.g., smaller size of farms, lower replacement rate) in the farms. The above are reflected in the production characteristics (e.g., smaller number of newborns produced in goat herds, with lower bodyweight at slaughter) and health problems (e.g., higher incidence rate of deaths, higher rate of attacks by wildlife), although there are cases where the extensive type of management seems to be beneficial for the animals (e.g., lower annual incidence of clinical mastitis).
The associations observed between the management system and the geographical location of the farms reflect the general structure of the country. As a general model, farms following the intensive or semi-intensive management system are primarily based in the mainland of the country, near locations that produce the raw material for feedstuff, e.g., cereals and hay (which are cultivated generally in the large plains of the country in Thessaly, central Greece, or Thrace, northern Greece), or near locations of the large feedstuff factories (e.g., central Macedonia, Thessaly). Such farms are high-input agricultural enterprises (e.g., with extensive infrastructure, employment of additional staff) [29] and thus include animals of high-production breeds, in order to achieve profitability. In contrast, farms following the semi-extensive or extensive management system are located in the uplands of the mainland of the country or in the islands, where the availability of feedstuffs would be more costly (due to transportation expenses) or prime land would be expensive to occupy (due to higher margins if made available for other uses, e.g., for the tourist sector). These farms are generally low-input enterprises, in which low milk production by animals on the farm can still contribute to making the enterprise cost-effective, due to the reduced costs and the payment of subsidies.
5. Conclusions
The study presents, for the first time, detailed and extensive results for dairy sheep and goat farms. The investigation was based on interviews carried out with respective farmers, using a detailed questionnaire to gather data regarding the situation in the farms, and on the examination of samples collected during the farm visits. In all, the findings can be useful in the health management of small ruminants and in providing evidence-based support within the scope of precise livestock medicine and health management. The data contribute to the understanding of sheep/goat farming systems in Greece, to providing information about the situation in the farms, to providing efficiency, to supporting the development of relevant technologies and to optimizing management practices. Further work from our group, along with the work of other researchers in Greece and internationally, may ultimately thus create a vision for the future of the small ruminant industry.
Acknowledgments
Daphne T. Lianou receives a scholarship by the State Scholarship Foundation of Greece.
Supplementary Materials
The following supporting information can be downloaded at: https://www.mdpi.com/article/10.3390/ani13122044/s1, Table S1: Geographical areas of Greece (n = 4), in which administrative regions and regional units of the country were clustered for characterizing the locations of 444 small ruminant farms in a countrywide investigation in Greece; Figure S1: Map of Greece indicating the geographic areas of the country (n = 4), in which administrative regions and regional units of the country were clustered for characterizing the locations of 444 small ruminant farms in a countrywide investigation in Greece; Table S2: Cumulative findings of all data collected during the mapping of 444 small ruminant farms in a countrywide investigation in Greece, classified according to animal species in the farms; Table S3: Cumulative findings of all results obtained during field and laboratory examinations in samples collected from 444 small ruminant farms in a countrywide investigation in Greece, classified according to animal species in the farms; Table S4: Season of the year during which visits were made to 444 small ruminant farms in a countrywide investigation in Greece; Table S5: Management system applied in 444 small ruminant farms in a countrywide investigation in Greece in accordance with the location of the farms; Table S6: Breed of ewes and does in 444 small ruminant farms in a countrywide investigation in Greece in accordance with the management applied therein; Table S7: Breed of ewes and does in 444 small ruminant farms in a countrywide investigation in Greece in accordance with the milking mode applied in the farms; Table S8: Breed of ewes and does in 444 small ruminant farms in a countrywide investigation in Greece in accordance with the location of the farms.
Appendix A
Table A1.
Differences observed in parameters (n = 130) between sheep flocks and goat herds in the cumulative results of data obtained during the mapping of 444 small ruminant farms in a countrywide investigation in Greece.
| Sheep Flocks (n = 325) | Goat Herds (n = 199) | p-Value 1 | |
|---|---|---|---|
| General Details | |||
| Management system 2 | Intensive: 44, semi-intensive: 140, semi-extensive: 116, extensive: 25 3 |
Intensive: 9, semi-intensive: 29, semi-extensive: 61, extensive: 20 |
<0.0001 |
| Infrastructure | |||
| General information | |||
| Accessory building(s) for animals | Yes: 222, no: 103 | Yes: 93, no: 26 | 0.043 |
| Availability of a milking parlour | Yes: 255, no: 70 | Yes: 66, no: 53 | <0.0001 |
| Availability of a waiting area before the milking parlour | Yes: 226, no: 29 | Yes: 64, no: 2 | 0.041 |
| Availability of personnel areas | Yes: 179, no: 145 | Yes: 40, no: 79 | 0.009 |
| Availability of an office | Yes: 128, no: 197 | Yes: 34, no: 85 | 0.036 |
| Availability of a lavatory | Yes: 143, no: 182 | Yes: 38, no: 81 | 0.022 |
| Availability of footbath | Yes: 45, no: 280 | Yes: 10, no: 109 | 0.005 |
| Availability of isolation facilities for animals | Yes: 247, no: 78 | Yes: 77, no: 42 | 0.018 |
| Availability of access road to the farm | Yes: 251, no: 74 | Yes: 78, no: 41 | 0.013 |
| Electricity source | National network: 253, diesel generator: 48, own solar cells: 0 |
National network: 72, diesel generator: 29, own solar cells: 3 |
0.0002 |
| Main building | |||
| Material of the walls | Cinder blocks: 130, tin: 99, bricks: 69, panels: 44, wood: 21, cement: 7, stone: 5, canvas: 4, nylon: 4, plaster: 1, plastic: 1 | Cinder blocks: 57, tin: 38, bricks: 19, panels: 13, wood: 8, cement: 2, stone: 7, canvas: 0, nylon: 1, plaster: 0, plastic: 0 | stone: 0.014 all others: 0.08 |
| Opening in the roof | Yes: 234, no: 84 | Yes: 35, no: 82 | <0.0001 |
| Material of the floor | Soil: 293, concrete: 29, stone: 16, slatted metal: 2, slatted wood: 2, slatted plastic: 1, wood: 1 | Soil: 105, concrete: 12, stone: 1, slatted metal: 1, slatted wood: 2, slatted plastic: 0, wood: 2, | stone: 0.0002, wood: 0.015, all others: >0.22 |
| Availability of straw bedding | Yes: 268, no: 60 | Yes: 76, no: 41 | 0.0002 |
| Annual frequency of removal/clean-up of the straw bedding | X: 3 ± 0.5 occasions 4 | X: 5 ± 0.5 occasions | 0.003 |
| Availability of ventilators | Yes: 47, no: 281 | Yes: 8, no: 109 | 0.035 |
| Availability of artificial lighting | Yes: 278, no: 40 | Yes: 83, no: 34 | <0.0001 |
| Building for lambs/kids | |||
| Availability of milk replacer facilities | Yes: 22, no: 303 | Yes: 1, no: 118 | 0.013 |
| Openings in the walls | Yes: 28, no: 215 | Yes: 1, no: 85 | 0.004 |
| Opening in the roof | Yes: 28, no: 215 | Yes: 1, no: 85 | 0.004 |
| Milking parlour | |||
| Year of initial establishment | X: year 2010 ± 0.5 year | X: year 2012 ± 0.5 year | 0.030 |
| System check-ups performed by technicians | Yes: 219, no: 36 | Yes: 50, no: 16 | 0.047 |
| Availability of a milk tank | Yes: 307, no: 18 | Yes: 103, no: 16 | 0.006 |
| Equipment | |||
| Scale type available | Large: 114, portable: 140 | Large: 28, portable: 59 | <0.015 |
| Availability of a roller crusher | Yes: 163, no: 162 | Yes: 40, no: 79 | 0.002 |
| Availability of a feed mill | Yes: 134, no: 191 | Yes: 34, no: 85 | 0.015 |
| Availability of automatic water filling system in troughs | Yes: 167, no: 158 | Yes: 40, no: 79 | 0.0009 |
| Availability of a tractor | Yes: 235, no: 90 | Yes: 70, no: 49 | 0.007 |
| Land | |||
| Grazing practiced | Yes: 281, no: 44 | Yes: 112, no: 7 | 0.025 |
| Total grazing land | X: 510 ± 50 acres | X: 1322 ± 390 acres | 0.002 |
| Ownership of the grazing land | Farmer’s: 225, other private: 175, public: 103 |
Farmer’s: 86, other private: 55, public: 58 |
public: 0.003, other private: 0.01, farmer’s: >0.20 |
| Private grazing land | X: 152 ± 18 acres | X: 343 ± 113 acres | 0.018 |
| Irrigation of the private grazing land | Yes: 123, no: 115 | Yes: 27, no: 65 | 0.0003 |
| Plant types available in the grazing land | Oat: 151, clover: 55, ryegrass: 53, barley: 50, vetch: 31, corn: 13, sorghum: 10, alfalfa: 6, rye: 4, olive trees: 3, spurges: 2, poppies: 1, wild grass: 1, wheat: 0 |
Oat: 44, clover: 15, ryegrass: 16, barley: 28, vetch: 8, corn: 8, sorghum: 3, alfalfa: 2, rye: 3, olive trees: 0, spurges: 0, poppies: 0, wild grass: 1, wheat: 7 |
oat: 0.005, all others: >0.05 |
| Animals | |||
| Small ruminants | |||
| No. of female animals | X: 325 ± 13 ewes | X: 237 ± 20 does | 0.0006 |
| Average age of culling ewes/does | X: 5.9 ± 0.1 years | X: 6.9 ± 0.1 years | <0.0001 |
| Average age of culling rams/bucks | X: 4.4 ± 0.2 years | X: 4.9 ± 0.2 years | 0.009 |
| Average annual replacement rate of ewes/does | X: 17.0% ± 0.2% | X: 14.5% ± 0.3% | <0.0001 |
| Average annual replacement rate of rams/bucks | X: 22.5% ± 1.0% | X: 20.5% ± 1.0% | 0.009 |
| Source of replacement animals | Own animals: 165, purchase: 24, both sources: 136 | Own animals: 77, purchase: 6, both sources: 35 | 0.026 |
| Other domestic animals in the farm | |||
| Dogs | X: 5.0 ± 0.5 animals | X: 7.0 ± 0.5 animals | 0.001 |
| Sheepdogs | X: 4.0 ± 0.5 animals | X: 6.0 ± 0.5 animals | 0.0001 |
| Avian wildlife | |||
| Avian wildlife identified |
Accipiter brevipes: 10, Anas platyrhynchos: 18, Anser spp.: 2, Aquila chrysaetos ^ Aquila nipalensis ^ Aquila fasciata: 67, Ardeidae family: 3, Athene noctua: 5, Bubo bubo: 5, Carduelis carduelis: 2, Ciconia ciconia: 9, Columba livia: 146, Columba palumbus: 4, Corvus corax: 79, Corvus cornix: 10, Coturnix coturnix: 8, Cuculus canorus: 1, Cygnus cygnus: 2, Erithacus rubecula: 1, Falco spp.: 149, Fringillia coelebs: 3, Galerida crisata: 2, Garrulus glanda-rius: 26, Gypaetus barbatus: 3, Gyps spp.: 12, Hirundo rustica: 179, Laridae family: 11, Luscinia megarhynchos: 1, Passeridae family: 143, Pelecanus onocrotalus: 2, Perdix perdix: 20, Phasianus colchicus: 4, Phoenicopterus roseus: 1, Pica pica: 266, Pyrrhocorax graculus: 8, Scolopax rusticola: 17, Streptopelia decaocto: 227, Streptopelia turtur: 18, Sturnus vulgaris: 2, Turdus merula: 39, Turdus philomelos: 21, Upupa epops: 4 |
Accipiter brevipes: 2, Anas platyrhynchos: 1, Anser spp.: 0, Aquila chrysaetos ^ Aquila nipalensis ^ Aquila fasciata: 30, Ardeidae family: 1, Athene noctua: 4, Bubo bubo: 2, Carduelis carduelis: 1, Ciconia ciconia: 1, Columba livia: 50, Columba palumbus: 3, Corvus corax: 46, Corvus cornix: 3, Coturnix coturnix: 5, Cuculus canorus: 0, Cygnus cygnus: 0, Erithacus rubecula: 1, Falco spp.: 55, Fringillia coelebs: 0, Galerida crisata: 0, Garrulus glanda-rius: 12, Gypaetus barbatus: 3, Gyps spp.: 5, Hirundo rustica: 59, Laridae family: 2, Luscinia megarhynchos: 0, Passeridae family: 45, Pelecanus onocrotalus: 0, Perdix perdix: 15, Phasianus colchicus: 3, Phoenicopterus roseus: 0, Pica pica: 99, Pyrrhocorax graculus: 4, Scolopax rusticola: 6, Streptopelia decaocto: 82, Streptopelia turtur: 7, Sturnus vulgaris: 1, Turdus merula: 16, Turdus philomelos: 11, Upupa epops: 0 |
Corvus cornix: 0.002, Perdix perdix: 0.013, Hirundo rustica: 0.022, Anas platyrhynchos: 0.027, Ciconia ciconia: 0.028, Gypaetus barbatus: 0.034, all others: >0.08 |
| Hunting | |||
| Presence of hunters in the area around the farm within a radius of 2 km of the farm | Yes: 284, no: 41 | Yes: 113, no: 6 | 0.022 |
| Description of hunted mammalian species | Hare: 217, wild boar: 192 | Hare: 95, wild boar: 78 | Hare: 0.047, wild boar: 0.39 |
| Distance from the farm that hunting activity occurs | X: 1.8 ± 0.2 km | X: 1.2 ± 0.2 km | 0.043 |
| Production characteristics 5 | |||
| Average age of lambs/kids at slaughter | X: 50 ± 1 days | X: 65 ± 3 days | <0.0001 |
| Average live bodyweight of lambs/kids at slaughter | X: 17.5 ± 0.2 kg | X: 16.6 ± 0.4 days | 0.043 |
| Average carcass weight of these at slaughter | X: 10.0 ± 0.1 kg | X: 9.4 ± 0.2 days | 0.012 |
| Local manufacturing of dairy products | Yes: 201, no: 124 | Yes: 92, no: 27 | 0.002 |
| Objective of local manufacturing of dairy products | Home consumption: 188, sale: 16 | Home consumption: 80, sale: 13 | Home consumption: 0.031, sale: 0.05 |
| Types of dairy products in local production | Cheese: 186, yoghurt: 81, tarhana: 8, sour milk: 6, ice-cream: 5, cream: 2, pasta: 2, butter: 1, milk-rice pudding: 1 | Cheese: 88, yoghurt: 29, tarhana: 1, sour milk: 2, ice-cream: 5, cream: 1, pasta: 2, butter: 3, milk-rice pudding: 1 |
Butter: <0.0001, all others: >0.06 |
| Health management | |||
| Health parameters | |||
| The two health problems in lambs/kids considered to be of higher importance | Abscesses: 2, acidosis: 1, arthritis–encephalitis: 2, brucellosis: 0, clostridial infection: 24, coliform infections: 12, contagious ecthyma: 25, diarrhoea: 233, endoparasitic infections: 8, injuries: 2, Listeria infections: 1, navel infection: 1, paratuberculosis: 1, pica: 1, pneumonia: 89, selenium deficiency: 10, toxicosis: 1 |
Abscesses: 1, acidosis: 0, arthritis–encephalitis: 1, brucellosis: 1, clostridial infection: 12, coliform infections: 11, contagious ecthyma: 4, diarrhoea: 83, endoparasitic infections: 11, injuries: 0, Listeria infections: 0, navel infection: 0, paratuberculosis: 1, pica: 0, pneumonia: 27, selenium deficiency: 1, toxicosis: 1 |
endoparasitic infections: 0.0009, selenium deficiency: 0.008, contagious ecthyma: 0.034, all others: >0.15 |
| Incidence rate of these two health problems in lambs/kids during the preceding season | 13.0% (12.3–13.6%) 6 | 14.6% (13.7–15.6%) | 0.043 |
| The two health problems in replacement animals considered to be of higher importance | Abortion: 12, acidosis: 2, brucellosis: 1, caseous lymphadenitis: 3, cerebral coenurosis: 44, clostridial infections: 34, contagious agalactia: 3, contagious ecthyma: 1, diarrhoea: 27, endoparasitic infections: 7, enzootic intranasal tumour: 1, lameness: 4, Listeria infections: 1, mastitis: 12, paratuberculosis: 9, pneumonia: 53, pregnancy toxaemia: 1, vaginal prolapse: 2 | Abortion: 7, acidosis: 3, brucellosis: 0, caseous lymphadenitis: 3, cerebral coenurosis: 7, clostridial infections: 7, contagious agalactia: 1, contagious ecthyma: 1, diarrhoea: 8, endoparasitic infections: 1, enzootic intranasal tumour: 2, lameness: 2, Listeria infections: 0, mastitis: 6, paratuberculosis: 7, pneumonia: 13, pre nancy toxaemia: 0, vaginal prolapse: 0 |
acidosis: 0.002, cerebral coenurosis: 0.013, caseous lymphadenitis: 0.033, all others: >0.05 |
| The two health problems in adult animals considered to be of higher importance | Abortion: 17, acidosis: 2, brucellosis: 0, cerebral coenurosis: 5, clostridial infections: 17, contagious agalactia: 19, contagious ecthyma: 2, copper toxicosis: 2, diarrhoea: 8, endoparasitic infections: 6, enzootic intranasal tumour: 1, external myiosis: 0, hypervitaminosis A: 1, hypocalcaemia: 1, injuries: 0, lameness: 20, Lentivirus infections: 6, Listeria infections: 3, mange: 1, mastitis: 215, Oestrus ovis infestation: 1, paratuberculosis: 9, pneumonia: 57, pregnancy toxemia: 3, scrapie: 10, self-suckling: 0, sudden death: 1, toxicosis: 5, udder oedema: 1, wasting disease: 2 |
Abortion: 4, acidosis: 0, brucellosis: 1, cerebral coe- nurosis: 0, clostridial infections: 9, contagious agalactia: 5, contagious ecthyma: 1, copper toxicosis: 0, diarrhoea: 3, endoparasitic infections: 0, enzootic intranasal tumour: 1, external myiosis: 1, hypervitaminosis A: 1, hypocalcaemia: 0, injuries: 1, lameness: 5, Lentivirus infections: 3, Listeria infections: 2, mange: 0, mastitis: 51, Oestrus ovis infestation: 0, paratuberculosis: 23, pneumonia: 17, pregnancy toxemia: 0, scrapie: 0, self-suckling: 1, sudden death: 0, toxicosis: 3, udder oedema: 0, wasting disease: 0 |
mastitis: <0.0001, paratuberculosis: <0.0001, all others: >0.05 |
| Incidence rate of these two health problems in adult animals during the preceding season | 8.0% (7.2–8.7%) | 6.3% (5.8–6.8%) | 0.004 |
| Incidence rate of total deaths, of any cause, in adult animals during the preceding season | 5.2% (5.0–5.5%) | 5.9% (5.8–6.0%) | 0.023 |
| Reasons for the visits of the veterinarians | Administration of pharmaceutical treatments: 115, feedstuff evaluation: 6, overall appraisal of flock: 163, pregnancy diagnosis: 42, vaccinations: 229 |
Administration of pharmaceutical treatments: 42, feedstuff evaluation: 2, overall appraisal of herd: 61, pregnancy diagnosis: 8, vaccina ions: 90 |
vaccinations: 0.030, pregnancy diagnosis: 0.038, all others: >0.30 |
| Animal deaths from attacks by other animals | Yes: 118, no: 207 | Yes: 70, no: 49 | <0.0001 |
| Species of animals that caused animal deaths during the preceding season | Bears: 6, crows: 1, eagles: 1, farm dogs: 23, ferrets: 1, foxes: 8, jackals: 21, wild cats: 1, wolves: 64 | Bears: 3, crows: 1, eagles: 1, farm dogs: 3, ferrets: 0, foxes: 3, jackals: 20, wild cats: 2, wolves: 43 | farm dogs: 0.008, jackals: 0.042, all others: >0.15 |
| Animal deaths from natural disasters | Yes: 32, no: 293 | Yes: 2, no: 97 | 0.014 |
| Diseases of adult animals–mastitis | |||
| Overall incidence rate during the preceding season | 3.9% (3.8–4.0%) | 2.8% (2.6–3.0%) | <0.0001 |
| Antibiotics used for treatment | Amoxicillin: 11, ampicillin: 1, cephalosporins: 10, cloxacillin: 4, enrofloxacin: 7, florfenicol: 2, gentamicin: 4, lincomycin: 7, marbofloxacin: 6, oxytetracycline: 60, penicillin: 218, spectinomycin: 4, streptomycin: 200, tylosin: 11 | Amoxicillin: 3, ampicillin: 1, cephalosporins: 1, cloxacillin: 3, enrofloxacin: 3, florfenicol: 0, gentamicin: 0, lincomycin: 3, marbofloxacin: 0, oxytetracycline: 20, penicillin: 53, spectinomycin: 2, streptomycin: 50, tylosin: 4 | cloxacillin: 0.019, all others: >0.11 |
| Diseases of adult animals–abortion | |||
| Overall incidence rate during the preceding season | 2.0% (1.9–2.1%) | 2.5% (2.7–2.9%) | <0.0001 |
| Antibiotics used for treatment | Cephalosporins: 1, lincomycin: 1, oxytetracycline: 61, penicillin: 9, streptomycin: 3, tylosin: 1 |
Cephalosporins: 1, lincomycin: 1, oxytetracycline: 37, penicillin: 2, streptomycin: 0, tylosin: 0 |
penicillin: 0.011, all others: >0.12 |
| Diseases of adult animals–pregnancy toxemia | |||
| Overall incidence rate during the preceding season | 0.5% (0.4–0.6%) | 0.2% (0.1–0.3%) | <0.0001 |
| Treatment performed | Penicillin: 3, streptromycin: 3, ciprofloxacin: 1, dextrose: 13, oxytetracycline: 1, dexamethasone: 1, calcium: 32, propylene glycol: 11, vitamins: 12, molasses: 3, selenium: 1, trace minerals: 2, sodium: 2, nutritional change: 1 | Penicillin: 0, streptromycin: 0, ciprofloxacin: 0, dextrose: 0, oxytetracycline: 1, dexamethasone: 0, calcium: 5, propylene glycol: 2 vitamins: 1, molasses: 0, selenium: 0, trace minerals: 0, sodium: 0, nutritional change: 0 | dextrose: 0.024, all others: >0.07 |
| Diseases of adult animals–lameness | |||
| Overall incidence rate during the preceding season | 2.8% (2.7–2.9%) | 1.2% (1.1–1.4%) | <0.0001 |
| Treatment performed | Lincomycin: 57, oxytetracycline: 24, cephalosporins: 16, tylosin: 4, penicillin: 2, streptomycin: 0, spectinomycin: 2, prednisolone: 0, dexamethasone: 1, quinolones: 1, non-steroidal anti-inflammatory drugs: 1, alamycin: 1, footbathing in copper/zinc solution: 33, foot pairing: 10, diesel bathing: 3, acid-based solutions: 1 | Lincomycin: 12, oxytetracycline: 8, cephalosporins: 4, tylosin: 0, penicillin: 1, streptomycin: 1, spectinomycin: 0, prednisolone: 1, dexamethasone: 0, quinolones: 0, non-steroidal anti-inflammatory drugs: 0, alamycin: 0, footbathing in copper/zinc solution: 3, foot pairing: 0, diesel bathing:, acid-based solutions: 0 |
lincomycin: 0.0001, foot pairing: 0.001, footbathing in copper/zinc solution: 0.030, oxytetracycline: 0.048, all others: >0.12 |
| Diseases of adult animals–mange | |||
| Overall incidence rate during the preceding season | 1.4% (1.3–1.5%) | 0.1% (0.1–0.1%) | <0.0001 |
| Diseases of adult animals–obstetrical cases | |||
| Overall incidence rate during the preceding season | 1.0% (0.9–1.1%) | 0.6% (0.7–0.8%) | <0.0001 |
| Diseases of young animals–respiratory problems | |||
| Overall incidence rate during the preceding season | 1.4% (1.3–1.5%) | 1.1% (1.0–1.2%) | <0.0001 |
| Diseases of young animals–diarrhoea | |||
| Overall incidence rate during the preceding season | 7.9% (7.8–8.0%) | 10.4% (10.0–10.7%) | <0.0001 |
| Antibiotics used for treatment | Amoxicillin: 35, ampicillin: 4, cephalosporins: 3, cloxacillin: 2, colistin: 1, enrofloxacin: 15, gentamicin: 12, lincomycin: 4, neomycin: 2, oxytetracycline: 46, penicillin: 25, spectinomycin: 13, streptomycin: 17, sulfonamides: 6, tylosin: 13 | Amoxicillin: 13, ampicillin: 0, cephalosporins: 0, cloxacillin: 0, colistin: 1, enrofloxacin: 0, gentamicin: 6, lincomycin: 2, neomycin: 0, oxytetracycline: 19, penicillin: 11, spectinomycin: 5, streptomycin: 5, sulfonamides: 4, tylosin: 1 | enrofloxacin: 0.014, all others: >0.16 |
| Management practices | |||
| Reproductive management | No hormonal control: 217, administration of melatonin: 23, administration of progestogens: 89 | No hormonal control: 99, administration of melatonin: 5, administration of progestogens: 16 | 0.0007 |
| Use of ultrasound for pregnancy diagnosis | Yes: 119, no: 206 | Yes: 20, no: 99 | <0.0001 |
| Nutritional modifications before the lambing period | Yes: 229, no: 96 | Yes: 68, no: 51 | 0.008 |
| Beginning of the mating period for ewes/does | May (February–December) | June (January–December) | <0.0001 |
| Duration of the mating period for ewe-lambs and doelings | 1 (1–9) months 7 | 1 (1–6) months | 0.006 |
| Lamb/kid fostering to female animals other than their dams | Yes: 112, no: 213 | Yes: 86, no: 33 | <0.0001 |
| Reasons for doing this practice | Death of dam: 39, improving nutrition of lambs: 1, inadequate milk availability by dam: 14, increased number of lambs: 112, stimulation of milk production in ewe that aborted: 31 | Death of dam: 18, improving nutrition of kids: 3, inadequate milk availability by dam: 5, increased number of kids: 54, stimulation of milk production in doe that aborted: 9 | increased number of lambs/kids: <0.0001, stimulation of milk production in female that aborted: 0.001, death of dam: 0.016, all others: >0.06 |
| Age for lamb/kid removal from their dams | X: 50 ± 1 days | X: 65 ± 3 days | <0.0001 |
| Daily number of milking sessions | 2 (1–3) | 2 (1–3) | 0.0001 |
| Seasonal transfer of animals to other site | Yes: 49, no: 276 | Yes: 28, no: 91 | 0.037 |
| Disposal of carcasses from dead animals | Burying: 183, disposal by knackers: 3, drop-off at water streams: 35, drop-off away: 52, feeding to birds: 1, feeding to dogs: 49, incineration: 28, slaughterhouse: 0 | Burying: 53, disposal by knackers: 3, drop-off at water streams: 19, drop-off away: 23, feeding to birds: 0, feeding to dogs: 29, incineration: 10, slaughterhouse: 1 | Feeding to dogs: 0.011, burying: 0.014, all others: >0.06 |
| Manure management | Spread to fields: 320, disposal: 5, sale: 1 | Spread to fields: 109, disposal: 7, sale: 3 | <0.007 |
| Security availability at the farm | Yes: 214, no: 111 | Yes: 65, no: 54 | 0.03 |
| Farm security | Alarm: 53, light wire fence: 68, personnel: 5, stoned wall: 1, strong wire fence: 93 | Alarm: 13, light wire fence: 28, personnel: 1, stoned wall: 0, strong wire fence: 26 | Light wire fence: 0.047, all others: >0.19 |
| Vaccinations | |||
| Against mastitis | Yes:126, no: 199 | Yes: 34, no: 85 | 0.047 |
| Against bacterial respiratory infections | Yes: 144, no: 181 | Yes: 39, no: 80 | 0.028 |
| Against paratuberculosis | Yes: 11, no: 314 | Use: 31, no: 88 | <0.0001 |
| Antiparasitic administrations—Anthelmintic treatments to small ruminants | |||
| Timing of administration within the annual production cycle | Before the mating season: 24, continuously: 2, final stage of pregnancy: 221, initial stage of dry period: 170, 1st–2nd month of lactation period: 89, 3rd–6th month of lactation period: 32 | Before the mating season: 7, continuously: 0, final stage of pregnancy: 79, initial stage of dry period: 74, 1st–2nd month of lactation period: 33, 3rd–6th month of lactation period: 10 |
Initial stage of dry period: 0.026, all others: >0.29 |
| Pharmaceutical form administered | Tablet: 221, injectable solution: 183, oral drench: 150, pour-on: 10, premix: 2 | Tablet: 88, injectable solution: 71, oral drench: 47, pour-on: 9, premix: 0 | Pour-on: 0.037, all others: >0.18 |
| Antiparasitic administrations—Ectoparasiticide treatments to small ruminants | |||
| Administration of ectoparasiticides to sheep/goats in the farm | Yes: 109, no: 216 | Yes: 69, no: 50 | <0.0001 |
| Timing of administration within the annual production cycle | Before the mating season: 7, final stage of pregnancy: 60, initial stage of dry-period: 49, 1st–2nd month of lactation period: 8, 3rd–6th month of lactation period: 2 | Before the mating season: 5, final stage of pregnancy: 38, initial stage of dry-period: 31, 1st–2nd month of lactation period: 8, 3rd–6th month of lactation period: 5 | 3rd–6th month of lactation period: 0.002, all others: >0.15 |
| Other health management practices | |||
| Administration of selenium to newborn animals | Yes: 228, no: 97 | Yes: 67, no: 52 | 0.006 |
| Shearing | Yes: 319, no: 6 | Yes: 102, no: 17 | <0.0001 |
| Recording of births–maintenance of a lambing/kidding book | Yes: 182, no: 143 | Yes: 53, no: 66 | 0.032 |
| Disinfection of navel stumps in newborns | Yes: 213, no: 112 | Yes: 65, no: 54 | 0.035 |
| Tail docking in newborns | Yes: 244, no: 81 | Yes: 34, no: 85 | <0.0001 |
| Maintenance of quarantine period for new animals into the farm | Yes: 211, no: 114 | Yes: 61, no: 58 | 0.009 |
| Vectors | |||
| Distance of spots from farm | >50 m: 128, 50–500 m: 58, >500 m: 37 |
>50 m: 57, 50–500 m: 17, >500 m: 9 |
>50 m: 0.036, all others: >0.10 |
| Nutrition | |||
| Grazing practiced | Yes: 281, no: 44 | Yes: 112, no: 7 | 0.025 |
| Duration of grazing during the winter | X: 3.6 ± 0.1 months | X: 4.4 ± 0.2 months | 0.002 |
| Distance from farm of area grazed during the winter | X: 1.3 ± 0.1 km | X: 2.2 ± 0.2 km | 0.0009 |
| Distance from farm of area grazed during the summer | X: 1.6 ± 0.1 km | X: 2.4 ± 0.2 km | 0.004 |
| Type of graze area | Forest: 18, hay: 4, meadow: 204, olive trees: 2, scrub pasture: 83, wetland: 16 |
Forest: 23, hay: 5, meadow: 59, olive trees: 0, scrub pasture: 58, wetland: 5 |
Meadow, scrub pasture, forest: <0.0001, all others: >0.26 |
| Common grazing for sheep and goats | Yes: 48, no: 277 | Yes: 40, no: 79 | <0.0001 |
| Provision of hay as fodder to animals | Yes: 324, no: 1 | Yes: 116, no: 3 | 0.029 |
| Total quantity of hay consumed during the preceding season | X: 84 ± 5 tonnes | X: 46 ± 7 tonnes | 0.0003 |
| Plants included in hay consumed by animals | Avena sativa: 25, Euphorbia pulcherrima: 1, Hordeum vulgare: 22, Lolium: 15, Medicago sativa: 10, Pisum sati-vum: 7, Polygonum aviculare: 2, Trifolium: 295, Triticum: 5, Vicia: 25 |
Avena sativa: 21, Euphorbia pulcherrima: 0, Hordeum vulgare: 8, Lolium: 1, Medi cago sativa: 2, Pisum sati-vum: 2, Polygonum aviculare: 0, Trifolium: 106, Triticum: 0, Vicia: 7 |
Lolium, Medicago sativa, Pisum sativum, Triticum: <0.0001, all others: >0.09 |
| Origin of hay | Own production: 193, purchase: 206 |
Own production: 55, purchase: 81 |
Own production: 0.005, purchase: 0.11 |
| Provision of straw to animals | Yes: 258, no: 67 | Yes: 78, no: 41 | 0.003 |
| Provision of finished feed to animals | Yes: 304, no: 21 | Yes: 103, no: 16 | 0.018 |
| Provision of finished feed (concentrate) to animals throughout the year | Yes: 304, no: 21 | Yes: 103, no: 16 | 0.018 |
| Provision of finished feed (concentrate) to young animals | Yes: 255, no: 70 | Yes: 79, no: 40 | 0.009 |
| Finished feed (concentrate) type provided to young animals | Flakes: 0, mash: 102, pellets: 82, small pellets: 80 | Flakes: 0, mash: 26, pellets: 22, small pellets: 35 | Small pellets: 0.017, all others: >0.12 |
| Raw materials used by the farm in the diets | Barley: 227, bran: 185, cottonseed meal: 84, maize: 294, soyabean meal: 201: sunflower meal: 78, wheat: 104 | Barley: 86, bran: 66, cottonseed meal: 42, maize: 110, soyabean meal: 68: sunflower meal: 28, wheat: 42 |
cottonseed meal: 0.025, all others: >0.18 |
| Raw materials purchased by the farm for use in the diets | Barley: 205, bran: 196, cottonseed meal: 100, maize: 258, soyabean meal: 215, sunflower meal: 87, wheat: 87 | Barley: 84, bran: 68, cottonseed meal: 49, maize: 105, soyabean meal: 68, sunflower meal: 29, wheat: 41 | maize: 0.016, cottonseed meal: 0.020, soyabean meal: 0.040, all others: >0.05 |
| Feed change in animals | Abrupt: 3, progressive: 314 | Abrupt: 2, progressive: 114 | <0.0001 |
| Application of hydroponics cultivations | Yes: 4, no: 321 | Yes: 1, no: 118 | <0.0001 |
| Use of laboratory examinations for quality testing of feeds and raw material | Yes: 79, no: 246 | Yes: 19, no: 100 | <0.0001 |
| Laboratory examinations used | Chemical analysis: 37, microbiological examination: 4, mycotoxin detection: 39, residues analysis: 3 | Chemical analysis: 7, microbiological examination: 1, mycotoxin detection: 8, residues analysis: 2 | Residues analysis: 0.009, all others: >0.21 |
| Use of laboratory examinations for quality testing of water | Yes: 52, no: 273 | Yes: 13, no: 106 | <0.0001 |
| Person responsible for nutritional management | Farmer themselves: 198, veterinarian: 96, animal scientist: 81, other farmer: 0 |
Farmer themselves: 94, veterinarian: 28, animal scientist: 22, other farmer: 0 |
Farmer themselves: 0.0002, all others: >0.07 |
| Human Resources | |||
| Farmer | |||
| Professional education | Yes: 54, no: 171 | Yes: 12, no: 107 | 0.002 |
| Daily period of presence in the farm | X: 11.5 ± 0.2 h | X: 12.3 ± 0.3 h | 0.047 |
| Public health | |||
| Personal opinion regarding occurrence of transmission of diseases from animals to the farmer or members of the family | Yes: 44, no: 281 | Yes: 27, no: 92 | 0.020 |
1 p-value for comparison between sheep flocks and goat herds; 2 Management system classified according to the system of the European Food Safety Authority [24]; 3 Figures present frequency (n) for each category within the variable; 4 Figures present mean ± standard error of the mean (X ± σM.); 5 Figures present frequency (n) for each category within the variable; 6 Figures present average (95% confidence interval) value; 7 Figures present median (minimum–maximum) value.
Appendix B
Table A2.
Differences observed in parameters (n = 7) between sheep flocks and goat herds in the results obtained during field and laboratory examinations during the mapping of 444 small ruminant farms in a countrywide investigation in Greece.
| Sheep Flocks (n = 325) | Goat Herds (n = 199) | p-Value 1 | |
|---|---|---|---|
| Clinical Examinations of Animals at the Farms | |||
| Body condition scoring | X: 2.38 ± 0.02 (scale: 0–5) 2 | X: 2.54 ± 0.03 (scale: 0–5) 3 | <0.0001 |
| Laboratory Examinations in Bulk-Tank Milk | |||
| Somatic cell counting | |||
| Somatic cell counts | 0.488 × 10⁶(0.451 × 10⁶–0.529 × 10⁶) cells mL−1 3 | 0.838 × 10⁶ (0.759 × 10⁶–0.933 × 10⁶) cells mL−1 | <0.0001 |
| Microbiological examinations | |||
| Total bacterial counts | 398 × 103 (331 × 103–479 × 103) cfu mL−1 | 581 × 103 (447 × 103–741 × 103) cfu mL−1 | <0.0001 |
| Resistance of staphylococci to ampicillin, azithromycin, cefoxitin, ciprofloxacin, clarithromycin, clindamycin, erythromycin, fosfomycin, fucidic acid, gentamicin, moxifloxacin, mupirocin, oxaxillin, penicillin, rifampicin, teicoplanin, tetracycline, tobramycin, trimethoprim-sulfamethoxazole | Yes: 79, 0, 0, 2, 0, 41, 21, 31, 14, 2, 1, 1, 27, 79, 1, 0, 28, 2, 2, respectively, no: 153, 232, 232, 230, 232, 191, 211, 201, 218, 230, 231, 231, 205, 153, 231, 232, 204, 230, 230, respectively 4 |
Yes: 33, 0, 0, 0, 0, 19, 16, 22, 3, 0, 0, 0, 6, 33, 0, 1, 12, 1, 0, respectively, no: 47, 80, 80, 80, 80, 61, 64, 58, 77, 80, 80, 80, 74, 47, 80, 79, 68, 79, 80, respectively |
Fosfomycin: 0.002, erythromycin: 0.040, all others: >0.11 |
| Composition analysis | |||
| Fat content | X: 6.16% ± 0.05% | X: 4.77% ± 0.44% | 0.0005 |
| Protein content | X: 4.43% ± 0.01% | X: 3.23% ± 0.30% | 0.0008 |
| Lactose content | X: 4.21% ± 0.02% | X: 4.74% ± 0.03% | <0.0001 |
1 p-value for comparison between sheep flocks and goat herds; 2 Figures present mean ± standard error of the mean (X ± σM.); 3 Figures present mean (95% confidence interval); 4 Figures present frequency (n) for each category within the variable.
Author Contributions
Conceptualization, D.T.L. and G.C.F.; methodology, G.C.F.; formal analysis, D.T.L.; investigation, D.T.L., C.K.M. and G.C.F.; resources, G.C.F.; data curation, D.T.L.; writing—original draft preparation, D.T.L.; writing—review and editing, D.T.L., C.K.M. and G.C.F.; supervision, G.C.F.; project administration, G.C.F. All authors have read and agreed to the published version of the manuscript.
Institutional Review Board Statement
The protocols of the study were approved by the academic board of the Veterinary Faculty of the University of Thessaly, meeting 34/03.04.19.
Informed Consent Statement
Not applicable.
Data Availability Statement
All data presented in this study are in the Supplementary Materials.
Conflicts of Interest
The authors declare no conflict of interest.
Funding Statement
The funding is co-financed by Greece and the European Union (European Social Fund-ESF) through the Operational Program ‘Human Resources Development, Education and LifeLong Learning’, 2014–2020, in the context of the project “Strengthening Human Resources Research Potential via Doctorate Research—sub-action 2: Award of scholarships by State Scholarships Foundation (ΙΚΥ) to PhD students in Higher Education Establishments of Greece”.
Footnotes
Disclaimer/Publisher’s Note: The statements, opinions and data contained in all publications are solely those of the individual author(s) and contributor(s) and not of MDPI and/or the editor(s). MDPI and/or the editor(s) disclaim responsibility for any injury to people or property resulting from any ideas, methods, instructions or products referred to in the content.
References
- 1.Hellenic Statistical Authority Farm Structure Surveys. [(accessed on 12 October 2021)]. Available online: https://www.statistics.gr.
- 2.Pulina G., Milán M.J., Lavín M.P., Theodoridis A., Morin E., Capote J., Thomas D.L., Francesconi A.H.D., Caja G. Invited review: Current production trends, farm structures, and economics of the dairy sheep and goat sectors. J. Dairy Sci. 2018;101:6715–6729. doi: 10.3168/jds.2017-14015. [DOI] [PubMed] [Google Scholar]
- 3.Ministry of Agricultural Development & Food . Greek Agriculture—Animal Production. Ministry of Agricultural Development & Food, General Directorate for Animal Production; Athens, Greece: 2018. p. 16. [Google Scholar]
- 4.Hellenic Agricultural Organisation—Demeter Deliveries of Ovine and Caprine Milk by Region and Regional Authority—Calendar Year 2022. [(accessed on 19 April 2023)]. Available online: https://www.elgo.gr/images/ELOGAK_files/Statistics/ELGO_STATS/1.ΕΛΓO_STATS_ΠAΡAΔ_ΠOΣ__ΠAΡAΓ_ΠΡOΒΕΙOΥ_ΓΙΔΙΝO_AΝA_ΝOΜO__ΜHΝA_2022.pdf.
- 5.Hadjigeorgiou I., Vallerand F., Tsimpoukas K., Zervas G. The socio-economics of sheep and goat farming in Greece and the implications for future rural development. Opt. Méditerran. B Etud. Recherch. 2002;39:83–93. [Google Scholar]
- 6.Hellenic Agricultural Organisation—Demeter Deliveries of Bovine and Bubaline Milk by Region and Regional Authority—Calendar Year 2022. [(accessed on 19 April 2023)]. Available online: https://www.elgo.gr/images/ELOGAK_files/Statistics/ELGO_STATS/1.ΕΛΓO_STATS_ΠAΡAΔ_ΠOΣ__ΠAΡAΓ_AΓΕΛAΔΙΝO_ΒOΥΒAΛΙΣΙO_AΝA_ΝOΜO__ΜHΝA_2022.pdf.
- 7.Kizos T., Plieninger T., Schaich H. “Instead of 40 sheep there are 400”: Traditional grazing practices and landscape change in Western Lesvos, Greece. Landsc. Res. 2013;38:476–498. doi: 10.1080/01426397.2013.783905. [DOI] [Google Scholar]
- 8.Manolopoulou E., Aktypis A., Matara C., Tsiomi P., Konstantinou E., Mountzouris K., Klonaris S., Tsakalidou E. An overview of sheep farming features and management practices in the region of south western Peloponnese and how they reflect on milk microbial load. J. Hell. Vet. Med. Soc. 2018;69:759–770. doi: 10.12681/jhvms.16421. [DOI] [Google Scholar]
- 9.Perucho L., Hadjigeorgiou I., Lauvie A., Moulin C.H., Paoli J.C., Ligda C. Challenges for local breed management in Mediterranean dairy sheep farming: Insights from Central Greece. Trop. Anim. Health Prod. 2019;51:329–338. doi: 10.1007/s11250-018-1688-2. [DOI] [PubMed] [Google Scholar]
- 10.Kominakis A.P., Papavasiliou D., Rogdakis E. Relationships among udder characteristics, milk yield and, non-yield traits in Frizarta dairy sheep. Small Rumin. Res. 2009;84:82–88. doi: 10.1016/j.smallrumres.2009.06.010. [DOI] [Google Scholar]
- 11.Gelasakis A.I., Valergakis G.E., Arsenos G., Banos G. Description and typology of intensive Chios dairy sheep farms in Greece. J. Dairy Sci. 2012;95:3070–3079. doi: 10.3168/jds.2011-4975. [DOI] [PubMed] [Google Scholar]
- 12.Lianou D.T., Chatziprodromidou I.P., Vasileiou N.G.C., Michael C.K., Mavrogianni V.S., Politis A.P., Kordalis N.G., Billinis C., Giannakopoulos A., Papadopoulos E., et al. A detailed questionnaire for the evaluation of health management in dairy sheep and goats. Animals. 2020;10:1489. doi: 10.3390/ani10091489. [DOI] [PMC free article] [PubMed] [Google Scholar]
- 13.Lianou D.T., Michael C.K., Gougoulis D.A., Cripps P.J., Vasileiou N.G.C., Solomakos N., Petinaki E., Katsafadou A.I., Angelidou E., Arsenopoulos K.V., et al. High milk somatic cell counts and increased Teladorsagia burdens overshadow non-infection-related factors as predictors of fat and protein content of bulk-tank raw milk in sheep and goat farms. Foods. 2022;11:443. doi: 10.3390/foods11030443. [DOI] [PMC free article] [PubMed] [Google Scholar]
- 14.Lianou D.T., Arsenopoulos K.V., Michael C.K., Papadopoulos E., Fthenakis G.C. Protozoan parasites in adult small ruminants and potential predictors for their presence in faecal samples. Microorganisms. 2022;10:1931. doi: 10.3390/microorganisms10101931. [DOI] [PMC free article] [PubMed] [Google Scholar]
- 15.Martin W.B., Aitken I.A. Appendix C. In: Martin W.B., Aitken I.A., editors. Diseases of Sheep. 3rd ed. Blackwell Science; Oxford, UK: 2000. p. 502. [Google Scholar]
- 16.Laird D.T., Gambrel-Lenarz S.A., Scher F.M., Graham T.E., Reddy R. Microbiological Count Methods. In: Wehr H.M., Frank J.F., editors. Standard Methods for the Examination of Dairy Products. 17th ed. APHA Press; Washington, DC, USA: 2004. pp. 153–186. [Google Scholar]
- 17.Barrow G.I., Feltham R.K.A. Manual for the Identification of Medical Bacteria. 3rd ed. Cambridge University Press; Cambridge, UK: 1993. [Google Scholar]
- 18.Euzeby J.P. List of bacterial names with standing in nomenclature: A folder available on the Internet. Int. J. Syst. Bacteriol. 1997;47:590–592. doi: 10.1099/00207713-47-2-590. [DOI] [PubMed] [Google Scholar]
- 19.Microbiology of the Food Chain—Horizontal Method for the Detection and Enumeration of Listeria Monocytogenes and of Listeria spp.—Part 1: Detection Method. 2nd ed. International Organization for Standardization; Geneva, Switzerland: 2017. 36p [Google Scholar]
- 20.Vasileiou N.G.C., Chatzopoulos D.C., Gougoulis D.A., Sarrou S., Katsafadou A.I., Spyrou V., Mavrogianni V.S., Petinaki E., Fthenakis G.C. Slime-producing staphylococci as causal agents of subclinical mastitis in sheep. Vet. Microbiol. 2018;224:93–99. doi: 10.1016/j.vetmic.2018.08.022. [DOI] [PubMed] [Google Scholar]
- 21.Rinaldi L., Levecke B., Bosco A., Ianniello D., Pepe P., Charlier J., Cringoli G., Vercruysse J. Comparison of individual and pooled faecal samples in sheep for the assessment of gastrointestinal strongyle infection intensity and anthelmintic drug efficacy using McMaster and Mini-FLOTAC. Vet. Parasitol. 2014;205:216–223. doi: 10.1016/j.vetpar.2014.06.011. [DOI] [PubMed] [Google Scholar]
- 22.Henriksen S.A., Pohlenz J.F.L. Staining of cryptosporidia by a modified Ziehl-Neelsen technique. Acta Vet. Scand. 1981;22:594–596. doi: 10.1186/BF03548684. [DOI] [PMC free article] [PubMed] [Google Scholar]
- 23.Lianou D.T., Michael C.K., Vasileiou N.G.C., Petinaki E., Cripps P.J., Tsilipounidaki K., Katsafadou A.I., Politis A.P., Kor-dalis N.G., Ioannidi K.S., et al. Extensive countrywide field investigation of somatic cell counts and total bacterial counts in bulk-tank raw milk in sheep flocks in Greece. Foods. 2021;10:268. doi: 10.3390/foods10020268. [DOI] [PMC free article] [PubMed] [Google Scholar]
- 24.European Food Safety Authority Scientific opinion on the welfare risks related to the farming of sheep for wool, meat and milk production. EFSA J. 2014;12:3933–4060. [Google Scholar]
- 25.Lianou D.T., Vasileiou N.G.C., Michael C.K., Valasi I., Mavrogianni V.S., Caroprese M., Fthenakis G.C. Patterns of reproductive management in sheep and goat farms in Greece. Animals. 2022;12:3455. doi: 10.3390/ani12243455. [DOI] [PMC free article] [PubMed] [Google Scholar]
- 26.Lianou D.T., Fthenakis G.C. Use of antibiotics against bacterial infections on dairy sheep and goat farms: Patterns of usage and associations with health management and human resources. Antibiotics. 2022;11:753. doi: 10.3390/antibiotics11060753. [DOI] [PMC free article] [PubMed] [Google Scholar]
- 27.Lianou D.T., Michael C.K., Petinaki E., Mavrogianni V.S., Fthenakis G.C. Administration of vaccines in dairy sheep and goat farms: Patterns of vaccination, associations with health and production parameters, predictors. Vaccines. 2022;10:1372. doi: 10.3390/vaccines10091372. [DOI] [PMC free article] [PubMed] [Google Scholar]
- 28.Lianou D.T., Fthenakis G.C. Scientometrics study of research output on sheep and goats from Greece. Animals. 2022;12:2666. doi: 10.3390/ani12192666. [DOI] [PMC free article] [PubMed] [Google Scholar]
- 29.Lianou D.T., Fthenakis G.C. Dairy sheep and goat farmers: Socio-demographic characteristics and their associations with health management and performance on farms. Land. 2021;10:1358. doi: 10.3390/land10121358. [DOI] [Google Scholar]
- 30.Anyfantakis E.M. Cheese Production, Chemistry, Physicochemistry, Microbiology. 2nd ed. Stamoulis Publications; Athens, Greece: 2004. [Google Scholar]
- 31.Papadopoulos A. Master’s Thesis. Aristotle University of Thessaloniki; Thessaloniki, Greece: 2009. Changes of Characteristics of Mechanically Produced Ovine Milk from the Udder to the Bulk-Tank. [Google Scholar]
Associated Data
This section collects any data citations, data availability statements, or supplementary materials included in this article.
Supplementary Materials
Data Availability Statement
All data presented in this study are in the Supplementary Materials.


