SUMMARY
BACKGROUND:
PCOS is a highly prevalent endocrine-metabolic disorder associated with insulin resistance (IR). In IR states noninsulin-mediated glucose uptake (NIMGU) may increase to compensate for declining insulin-mediated glucose uptake (IMGU), although this does not appear to be the case in PCOS. The underlying molecular mechanisms for this deficiency remains unclear.
OBJECTIVES:
To compare adipocyte glucose transporter 1 and 4 (GLUT-1 and GLUT-4) gene expression in PCOS women and matched controls, and to determine whether changes in GLUT-1 and GLUT-4 are associated with concomitant alterations in whole-body glucose uptake.
RESEARCH DESIGN AND METHODS:
In this prospective cross-sectional study, 23 women with PCOS (by NIH 1990 criteria) and 23 matched controls were studied for subcutaneous abdominal adipocyte GLUT-1 and GLUT-4 mRNA expression (by real-time PCR), and basal whole body IR (by HOMA-IR) and insulin secretion (by HOMA-β%). A subset of 6 PCOS women and 6 matched controls also underwent an mFSIVGTT to determine dynamic state glucose uptake (by insulin sensitivity index [Si] and glucose effectiveness [Sg]) and insulin secretion (by the acute insulin response to glucose [AIRg] and the disposition index [Di]).
RESULTS:
For similar adiposity (BMI and waist-hip ratio), PCOS women tended to have higher HOMA-IR and lower Di and Si, and higher HOMA-β% and lower GLUT-4 than controls while GLUT-1 was similar. GLUT-1 was positively associated with Sg (reflecting NIMGU) and GLUT-4 positively with Si (reflecting IMGU). GLUT-4 was associated negatively with HOMA-IR and HOMA-β% and positively with Di for the entire cohort but not with AIRg. Both GLUT-1 and GLU-4 were negatively associated with BMI, but not with each other.
CONCLUSION:
Our results suggest that IR secondary to a lower IMGU and enhanced insulin secretion in PCOS is in part attributable to a reduction in adipocyte GLUT-4 expression that is not accompanied by a compensatory increase in GLUT-1 expression.
Keywords: PCOS, adipocyte GLUT-1, GLUT-4, insulin resistance
INTRODUCTION
The Polycystic Ovary Syndrome (PCOS) is a highly prevalent endocrine-metabolic disorder, affecting 5–15% of women1, and is characterized by ovulatory dysfunction, polycystic ovary morphology, and hyperandrogenism. In addition, ~70% of PCOS patients demonstrate insulin resistance (IR).2 As such, PCOS is an important risk factor for type 2 diabetes mellitus (T2DM) and possibly cardiovascular disease.1
A prominent feature of IR is the impairment of systemic glucose uptake.3 Glucose uptake into tissues is mediated by facilitated diffusion primarily via carrier proteins, i.e. glucose transporters (GLUT).4 To date, 14 glucose transporters with different functions and tissue descriptions have been identified and cloned (GLUT-1 through GLUT-14).5 GLUT-4 is only expressed in insulin-sensitive tissues, such as striated muscles and adipose tissue (AT), where it mediates insulin-mediated glucose uptake (IMGU).6 Alternatively, while GLUT-1 is ubiquitously distributed throughout many tissues, it is principally responsible for basal non-insulin-mediated glucose uptake (NIMGU), or the tendency of glucose to increase its own cellular disposal, a mechanism that operates independently of IMGU.5, 6 NIMGU accounts for ~ 75–85% of whole-body glucose disposal in the fasting state.4
In some insulin-resistant states, such as T2DM7 and adrenocortical hyperactivity,8 NIMGU increases as insulin sensitivity declines, suggesting that this relationship may be a vital compensatory mechanism to ensure that sufficient glucose uptake in the presence of impaired IMGU. The underlying molecular mechanisms for the bivalent relationship between IGMU and NIGMU are further supported by studies in cultured skeletal muscles of transgenic diabetic mice.9 In this murine model, GLUT-1 and GLUT-4 appear to reciprocally regulate each other, presumably to maintain normoglycemia during declining GLUT4-associated IMGU.9
In PCOS, IMGU is significantly impaired, resulting in IR and compensatory hypersecretion of insulin by the pancreatic β-cells. Notwithstanding, we recently demonstrated that the decreased systemic IMGU observed in PCOS does not appear to be accompanied by a compensatory increase in NIMGU.3 These data suggested that the IR of PCOS may, at least in part, be exacerbated by the absence of a compensatory rise in NIMGU.3 The underlying molecular mechanisms for this disconnect remain unknown.
Although diminished GLUT-4 expression in subcutaneous (sc) adipocytes from PCOS patients has previously been demonstrated,10, 11 little is known concerning the expression pattern of GLUT-1 in the AT of these women. In the present study, we have hypothesized that absence of a compensatory increase in NIMGU in PCOS, in the face of a decreased IMGU, is due to a similar defect in adipocyte GLUT-1. Our immediate objectives were to: (a) compare the expression of GLUT-1 and GLUT-4 mRNA in sc abdominal adipocytes obtained from women with PCOS and BMI-matched controls; and (b) to determine whether the levels of GLUT-1 and GLUT-4 gene expression are associated with alterations in whole-body glucose uptake and insulin secretion.
SUBJECTS AND METHODS
Study population and protocol
Forty-six subjects (23 control and 23 PCOS) aged 22–44 years were recruited. Because we were interested in studying metabolic dysfunction, the diagnosis of PCOS was made according to the 1990 National Institutes of Health consensus criteria (i.e., equivalent to Phenotypes A and B of the Rotterdam criteria),12 namely the presence of oligo-ovulation and biochemical or clinical hyperandrogenism, excluding other known endocrinopathies, as previously described.12 Controls recruited comprised healthy premenopausal women with long-term eumenorrhea and no evidence of hyperandrogenism or endocrine disorders. None of the women were pregnant or taking any hormonal medication (including oral contraceptives, metformin) for at least 3 months preceding the evaluation. All subjects had normal thyroid-stimulating hormone, 17-hydroxyprogesterone, and prolactin levels.
Research subjects were recruited through advertisements or, for PCOS, the clinical and research practice of the Center for Androgen-related Disorder at Cedars-Sinai Medical Center (CSMC), Los Angeles, or the reproductive endocrine clinic at Augusta University, Augusta, Georgia. To ensure comparable groups, we began to prospectively recruit PCOS subjects first and matching controls were sought, either from a previously recruited pool of controls or through new recruitment. An attempt was made to closely match PCOS and controls within narrow ranges (i.e. ±3 kg/M2 in BMI, ±5 years in age, and similar race).10, 13 Both the PCOS patients and controls were recruited over a similar period of time.
All subjects underwent a physical examination with blood sampling for hormone measurements, as previously described14 and were normoglycemic. In addition to height, weight, and modified Ferriman-Gallwey (mF-G) score, waist circumference (WC) was measured at the narrowest portion of the torso approximately midway between the lower costal margin and the iliac crest, and the hip circumference was measured over the widest portion of the gluteal and greater trochanteric region. The BMI and waist to hip ratio (WHR) were then calculated.
Fasting blood samples for circulating total testosterone (total T), free testosterone (free T), dehydroepiandrosterone sulfate (DHEAS), insulin, and glucose concentrations were obtained on days 3 through 8 of the menstrual cycle (i.e. the follicular phase). All subjects also underwent a sc AT biopsy (see below).
A subgroup of 12 study subjects (6 PCOS and 6 controls) who had an AT biopsy also agreed to undergo a modified frequently sampled intravenous glucose tolerance test (mFSIVGTT) and assessment of abdominal fat distribution by a single-cut abdominal computed tomography (CT) scan (see below). The study was approved by the Institutional Review Boards/Research Ethics Committee of CSMC and Augusta University. All subjects provided written informed consent before study entry.
Metabolic assessment
Metabolic function in the basal state:
IR and insulin secretion in the basal (static) state were estimated using the homeostasis model assessment for IR (HOMA-IR) and β-cell secretion (HOMA-%β-cell), respectively, as previously described.15
Metabolic function in the dynamic state:
A subset of 12 subjects underwent a modified FSIVGTT (mFSIVGTT) to determine systemic glucose uptake and β-cell function, including IMGU and NIMGU, in the dynamic (stimulated) state, as previously described.16, 17 Briefly, on days 3 through 8 of a spontaneous or induced withdrawal bleed, intravenous (iv) catheters were placed in both forearms between 8:00 and 9:00 am, after an overnight fast. Thereafter, iv administration of glucose (0.3 g/kg) was followed in 20 minutes by the administration of regular insulin (0.03 U/kg). Blood samples (2.0 mL) were collected 34 times from −20 minutes (relative to glucose administration) to +180 minutes. Samples drawn into prechilled tubes containing EDTA (for insulin) or sodium fluoride potassium oxalate (for glucose) and plasma were frozen at −80°C until assayed. Plasma glucose and insulin values were entered into the MINMOD computer program, and data were analyzed using MINMOD of glucose kinetics to establish glucose-insulin interactions in a single assay.16, 17
The calculated components of the modified FSIVGTT were as follows: acute insulin response to glucose (AIRg), which reflects the first phase endogenous insulin secretion in response to a bolus glucose injection; insulin sensitivity index (Si), which reflects the IMGU per unit of insulin evaluated by a bolus injection of known quantity of insulin; the disposition index (Di = Si × AIRg), representing the interaction of insulin sensitivity and the compensatory ability of the β-cell to secrete insulin, and glucose effectiveness index (Sg), reflecting the ability of glucose per se, independent of changes in insulin, to increase glucose uptake and suppress the endogenous glucose production (i.e. a form of NIMGU).
Of note, in insulin-dependent tissues the glucose dynamics are influenced by basal insulin levels, termed the basal insulin effect (BIE), which is quantified as the product of the insulin sensitivity and basal insulin concentration (Si x basal insulin).18 In order to overcome the basal insulin effect on Sg and obtain an estimate of NIMGU, we also calculated the glucose effectiveness at zero insulin concentration (GEZI), quantified as the difference between total Sg and the basal insulin effect (i.e. GEZI = Sg - BIE).18
Isolation of adipocytes, real-time PCR
Approximately 5 gm. tissue was excised from sc AT through a 1.5 cm incision in the lower abdomen as previously described.19 After adipocytes were isolated from AT, RNA was extracted and the proportions of GLUT-1 and GLUT-4 mRNA were assessed by real-times quantitative reverse transcriptase (real-time qRT–PCR) as previously described.10 20–22 Data was normalized to the house-keeping gene human ACTB (i.e. the internal control). Primers for human ACTB, GLUT1, and GLUT4 were purchased from SA Bioscience (Frederick, MD). Relative fold change of mRNA expression of targeted genes (relative to human ACTB expression) was calculated by using delta Ct method, as previously described.10, 21, 22
Biochemical analysis
Total T was measured using high-turbulence liquid chromatography tandem mass spectrometry and free T determined by equilibrium dialysis (Quest Diagnostics, San Juan Capistrano, CA), as previously described.22 The serum levels of DHEAS were measured by a competitive immunoassay (Modular E170; Roche Diagnostics, Indianapolis, IN). Plasma insulin was assayed by chemiluminescence (ADVIA Centaur chemiluminescent immunoassay system; Siemens Healthcare, Deerfield, IN) and glucose levels were measured using the hexokinase/glucose-6-phosphate dehydrogenase method (Roche Applied Sciences, Indianapolis, IN). Samples, except for glucose, were batched at regular intervals for analysis to minimize the impact of inter-assay variability. The intra- and inter-assay variations for total T, SHBG, DHEAS, A4, PRL, TSH, 17-OHP, and P4 have been previously reported and did not exceed 10%.2, 22, 23
Single-slice abdominal CT scan
A single slice CT (Toshiba Aquilion 16, model TSX-101A; Toshiba America Medical Systems, Tustin, California) scan of abdominal visceral and subcutaneous (sc) fat was obtained at the level of the L4-L5 lumbar vertebrae disc space, as previously described.3 Regional abdominal fat stores were identified by creating a closed region of interest surrounding the peritoneal cavity to separate sc and visceral fat stores. Connected voxels within the CT attenuation range of −190 to −30 HU were identified as fat. Fat voxels inside the drawn region of interest were classified as visceral adipose tissue (VAT) and those outside as sc adipose tissue (SAT). The cross-sectional areas of VAT and SAT in square centimeters were quantified using software-derived algorithms. Total abdominal fat (TAT) was calculated as the sum of VAT and SAT.
Statistical analysis
Shapiro-Wilks W test was used to determine whether continuous variables were normally distributed. All continuous variables, but the mF-G score, reasonably followed a parametric distribution on the original or log scale, with nine variables needing log transformation (total T, free T, DHEAS, fasting glucose, fasting insulin, HOMA-IR, and HOMA-%β-cell). Intergroup differences were evaluated using the unpaired t test for normally distributed continuous variables or the Wilcoxon rank-sum test for mF-G score. A χ2 test was used to compare nominal variables. Bivariate correlations between continuous variables and parameters of glucose disposal in PCOS and controls were analyzed using the Pearson correlation coefficient for all variables, except the mF-G score which were analyzed using the Spearman correlation coefficient. The statistical level of significance was set at P = 0.05 and all hypothesis tests were 2-sided.
The previous estimates of mean and variability for each of the groups were available for GLUT-4 but not GLUT-1 mRNA expression in PCOS.10 Therefore, we could not power the study sufficiently for sample size calculation based on a previous estimates of GLUT-1. Using GLUT-4 mRNA expression as the primary outcome for the purpose of determining power, the a priori power calculation indicated that a sample size of at least 17 PCOS patients and 17 control subjects would be sufficient to detect a difference of 198.0 × 10⁻⁵, in GLUT-4 mRNA expression, assuming a β=0.20, an α=0.05, and a standard deviation (SD) of 194.1 × 10⁻⁵, according to data from our previous study.10
To assess if the study were underpowered to detect differences in GLUT-1 receptors, we powered to detect a difference in mean GLUT-1 mRNA levels (3.7 ×10⁻⁵) between PCOS women and controls using Welch-Satterthwaite’s t-statistics. However, the difference in mean GLUT-1 we observed (the median effect size of 0.5 (i.e. [6.1 – 4.1 ×10⁻⁵]/ pooled SD of 4.4 ×10−5 = 2/4.4) between PCOS women and controls is clinically small at ~2.0 ×10⁻⁵, and may not be meaningful, even if we had used a large sample size, given the large pooled SD estimate. Therefore, we chose not to raise the possibility of a false negative result.
RESULTS
Baseline features of the study groups
The basic demographic, endocrine, and metabolic characteristics of the subjects are depicted in Table 1. Subjects’ age and BMI ranged from 22 to 43 years and 21.0 to 35.8 kg/M2 in PCOS, and 21 to 44 years and 19.3 to 40.2 kg/M2 in controls. There were no differences in mean BMI, WHR, or racial/ethnic composition between the two groups, although controls were older than women with PCOS (Table 1). However, age was not associated with either GLUT-1 or GLUT-4 mRNA expression. As expected, mF-G scores and baseline mean serum total T, free T, and DHEAS levels were higher in PCOS than in controls, both before and after adjustment for age.
Table 1:
Baseline anthropometric, endocrine and metabolic characteristics of study subjects
| Variables | PCOS (n=23) | Control (n=23) | p-value | p-value (Age Adjusted) |
|---|---|---|---|---|
| Age (years) | 26.7±1. 0 | 34.3±1.6 | 0.001 | N/A |
| Race (n and %) | ||||
| African-American | 2 (8.7) | 6 (26.1) | 0.145 | N/A |
| Asian-American | 3 (13. 0) | 4 (17.4) | 0.707 | N/A |
| Hispanic White | 11 (47.8) | 6 (26.1) | 0.222 | N/A |
| Non-Hispanic White | 7 (30.4) | 7 (30.4) | 0.999 | N/A |
| Anthropometric Measures | ||||
| Body mass index (kg/m 2 ) | 30.3±0.9 | 28.1±1.2 | 0.139 | 0.130 |
| WHR | 0.89±0.02 | 0.87±0.03 | 0.506 | 0.601 |
| Androgenism Measures | ||||
| mF-G score | 8.1±1.0 | 1.3±0.4 | 0.001 | 0.001 |
| Free Testosterone (pmol/L) a | 16.4 (6.6–38.2) | 7.6 (3.1–19.4) | 0.001 | 0.005 |
| Total Testosterone (nmol/L) a | 1.5 (0.7–3.1) | 0.9 (0.5–1.3) | 0.001 | 0.026 |
| DHEAS (umol/L) | 8.2±0.4 | 4.4±0.7 | 0.001 | 0.004 |
| Metabolic function (Basal State) | ||||
| Fasting glucose(mmol/L) a | 5.0 (3.8–5.9) | 4.9 (2.8–5.9) | 0.46 | 0.149 |
| Fasting Insulin (pmol/L) a | 91.1 (7.2–991.2) | 58.1 (14.4–129.2) | 0.16 | 0.277 |
| HOMA IR a | 2.8 (0.2–29.45) | 1.7 (0.3–3.5) | 0.134 | 0.085 |
| HOMA-β% a | 56.5 (17–483) | 27.9 (7.1–63.5) | 0.042 | 0.044 |
| Glucose Transporters mRNA levels | ||||
| GLUT-1 | 6.1×10⁻⁵ ± 1.2×10⁻⁵ | 4.1×10⁻⁵±0.4×10⁻⁵ | 0.119 | 0.367 |
| GLUT-4 | 161.7×10⁻⁵± 37.2×10⁻⁵ | 271.4×10⁻⁵±35.0×10⁻⁵ | 0.037 | 0.016 |
| Glucose Kinetics (by mFSIVGTT) b | PCOS (n=6) | Control (n=6) | ||
| Si (L min−1 m −1) | 1.67±0.39 | 3.43±0.81 | 0.079 | N/A |
| AIRg (mU L−1 m −1) | 709.35±13.51 | 702.33±123.50 | 0.969 | N/A |
| Di | 1140.33±280.48 | 1968.33±310.94 | 0.076 | N/A |
| Sg (min −1) | 140.2×10⁻⁵± 0.49.2 ×10−5 | 205.5×10⁻⁵± 51.4.2×10−5 | 0.380 | N/A |
| GEZI | 2.04 ×10⁻²±0.27 ×10⁻² | 2.23 ×10⁻² ±0.47×10⁻² | 0.732 | N/A |
| BIE | 2.08 ×10⁻³±0.29 ×10⁻³ | 2.13 ×10⁻³ ±0.38×10⁻³ | 0.923 | N/A |
Values are means ± SE except for race and log-transformed data. P-values bolded and italicized are statistically significant.
Geometric means, the antilog of the log scale mean, is reported for log-transformed data
Assessment of mFSIVGTT parameters was performed in 6 PCOS women and 6 matched controls (see also supplemental Table 1).
To convert the plasma levels of glucose to mg/dL, insulin to μIU/m, Free Testosterone to pg/mL, Total Testosterone to ng/dL and DHEAS to ug/dL, divide the values by 0.0555, 7.175, 3.47, 0.0347 and 0.0271, respectively.14, 38
Abbreviations: AIRg is acute response of insulin to glucose; DHEAS is dehydroepiandrosterone sulfate; Di is disposition index; GLUT is glucose transporter; HOMA-IR is homeostasis model assessment of insulin resistance; HOMA-β% is homeostasis model assessment of β-cell function; mF-G is the modified Ferriman-Gallwey hirsutism score; mFSIVGTT is modified frequently sampled iv glucose tolerance test; N/A is ‘Not applicable’; Si is insulin sensitivity index; Sg is glucose effectiveness index; and WHR is the waist to hip ratio.
Whole-body glucose uptake and pancreatic β-cell function between PCOS and controls
Although not reaching statistical significance, the mean fasting plasma insulin levels (12.7 vs. 8.1 μIU/mL in PCOS vs. controls, resp.) and HOMA-IR values (2.8 vs. 1.7 in PCOS vs. controls, resp.) tended to be higher in PCOS than control women. The mean fasting plasma glucose levels were similar in the two groups while HOMA-%β-cell function was significantly higher in PCOS women than controls (Table 1).
To explore alterations in dynamic measures of whole-body glucose uptake and β-cell function, we examined the parameters of glucose kinetics measured by mFSIVGTT in a subpopulation of 6 PCOS women and 6 matched controls. There were no significant differences between the two groups in terms of mean±SE age (28.25±1.21 vs. 35.30±3.26), BMI (32.38±0.76 vs. 34.1±1.74 Kg/m2), WHR 0.94±0.02 vs. 0.91±0.04), VAT (148.4±22.7 vs. 134.5±14.0 cm2), SAT (428.5±48.5 vs. 481.1±34.2 cm2) and TAT (576.9±53.5 vs. 615.6±43.4 cm2), respectively (Supplemental Table 1). The mean Si and Di tended to be lower in PCOS than in control women, although the difference did not reach significance, while AIRg, Sg, BIE and GEZI were not significantly different between the two groups (Table 1, Supplemental Table 1).
Adipocyte GLUT-1 and GLUT-4 mRNA expression between PCOS and controls
The differences in mean GLUT-1 and GLUT-4 mRNA expression in PCOS and control adipocytes are depicted in Table 1 and Fig. 1. The mean levels in GLUT-4 mRNA expression in adipocytes were lower and decreased by 40.4% in PCOS relative to controls (Table 1; Fig. 1A). However, there was no significant difference in mean GLUT-1 expression between women with PCOS and controls (Table 1; Fig. 1B). Compared to GLUT-4 receptor which decreased by 1.7 fold in PCOS, GLUT-1 was increased 1.5-fold relative to controls. Furthermore, there was no association between GLUT1 and GLUT4 mRNA levels either in women with PCOS or in controls (Table 1; Fig. 1C). The results remain unchanged after adjustment for age.
Fig. 1. Adipocyte GLUT-1 and GLUT-4 mRNA expression (by RT-PCR) in PCOS (n=23) versus controls (n=23).
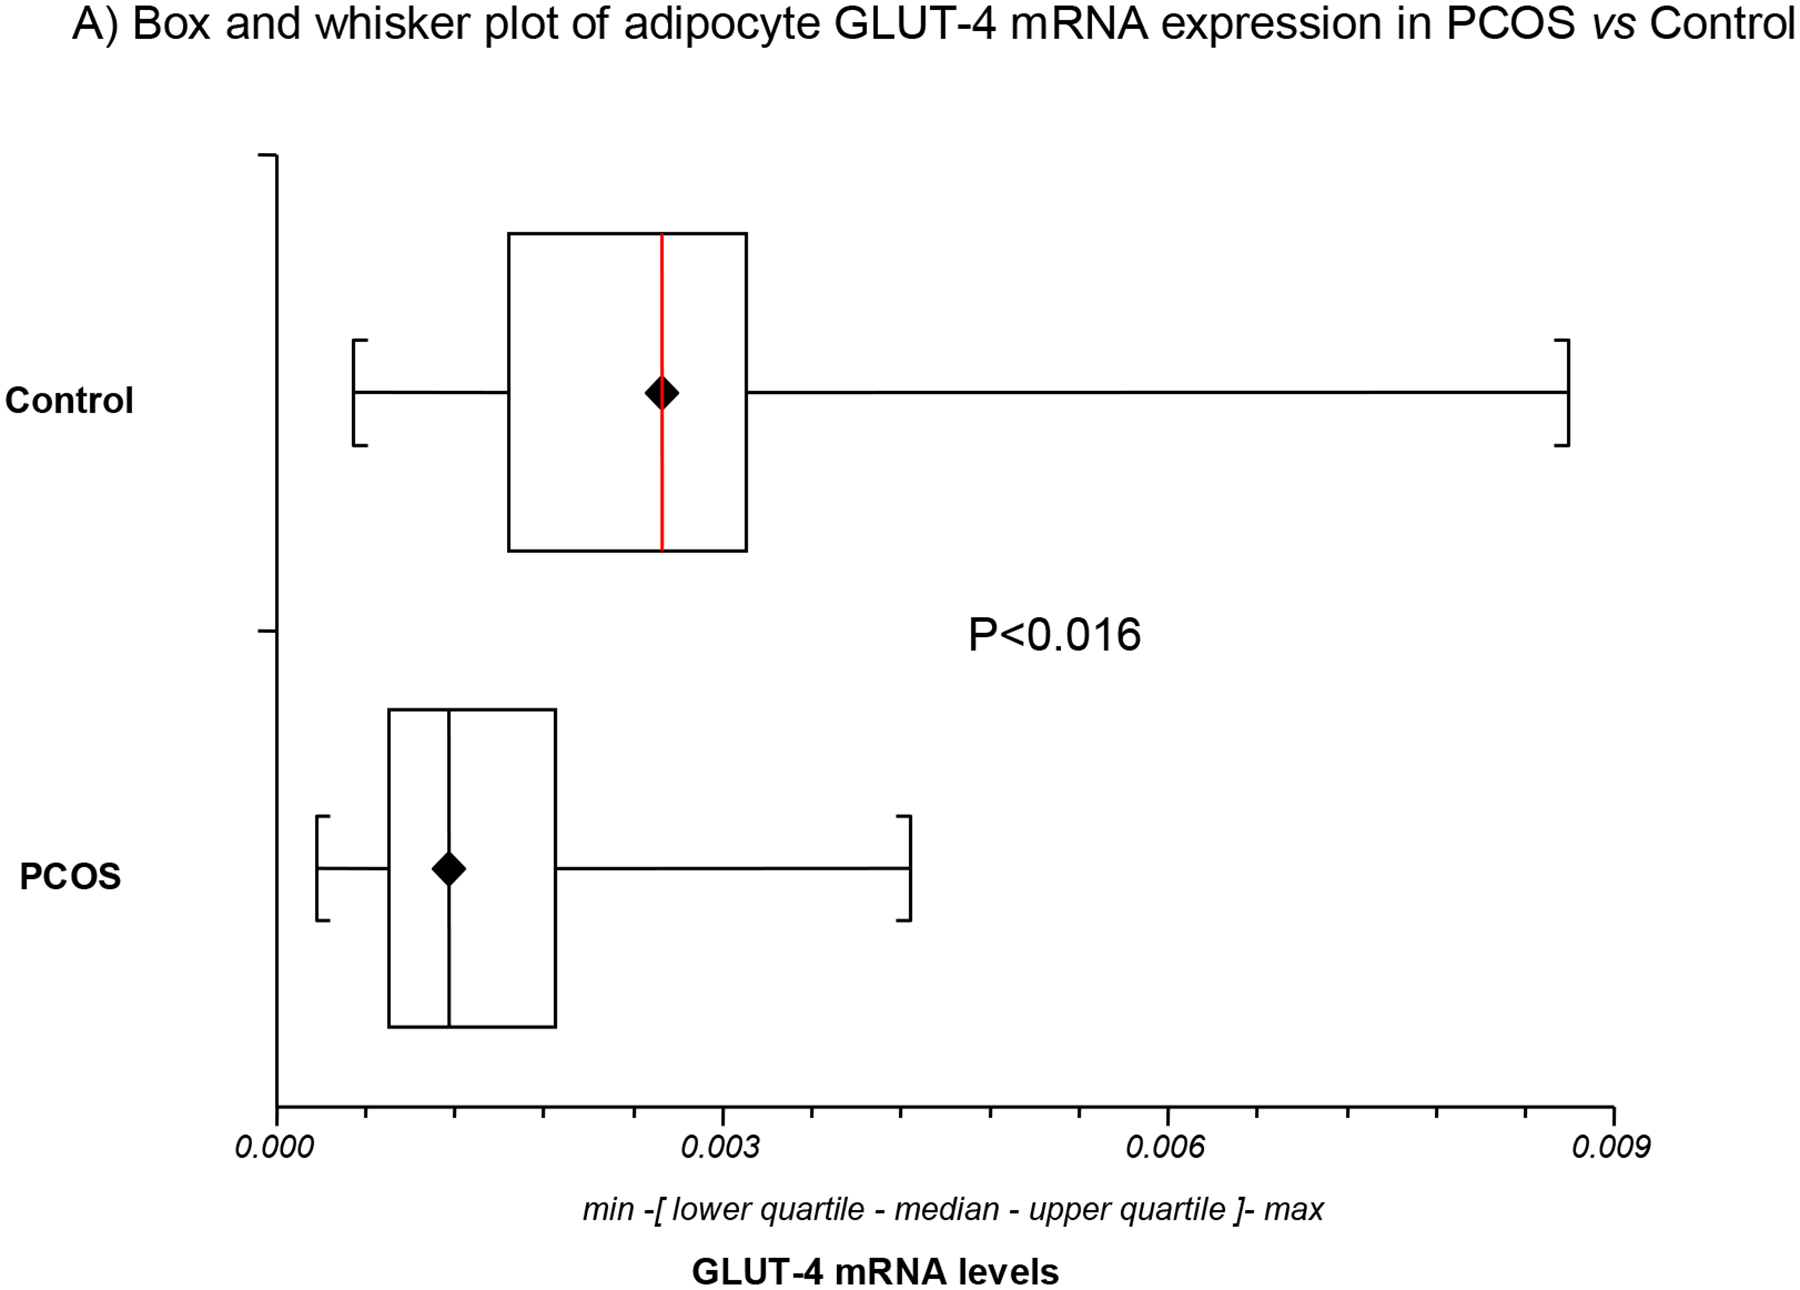
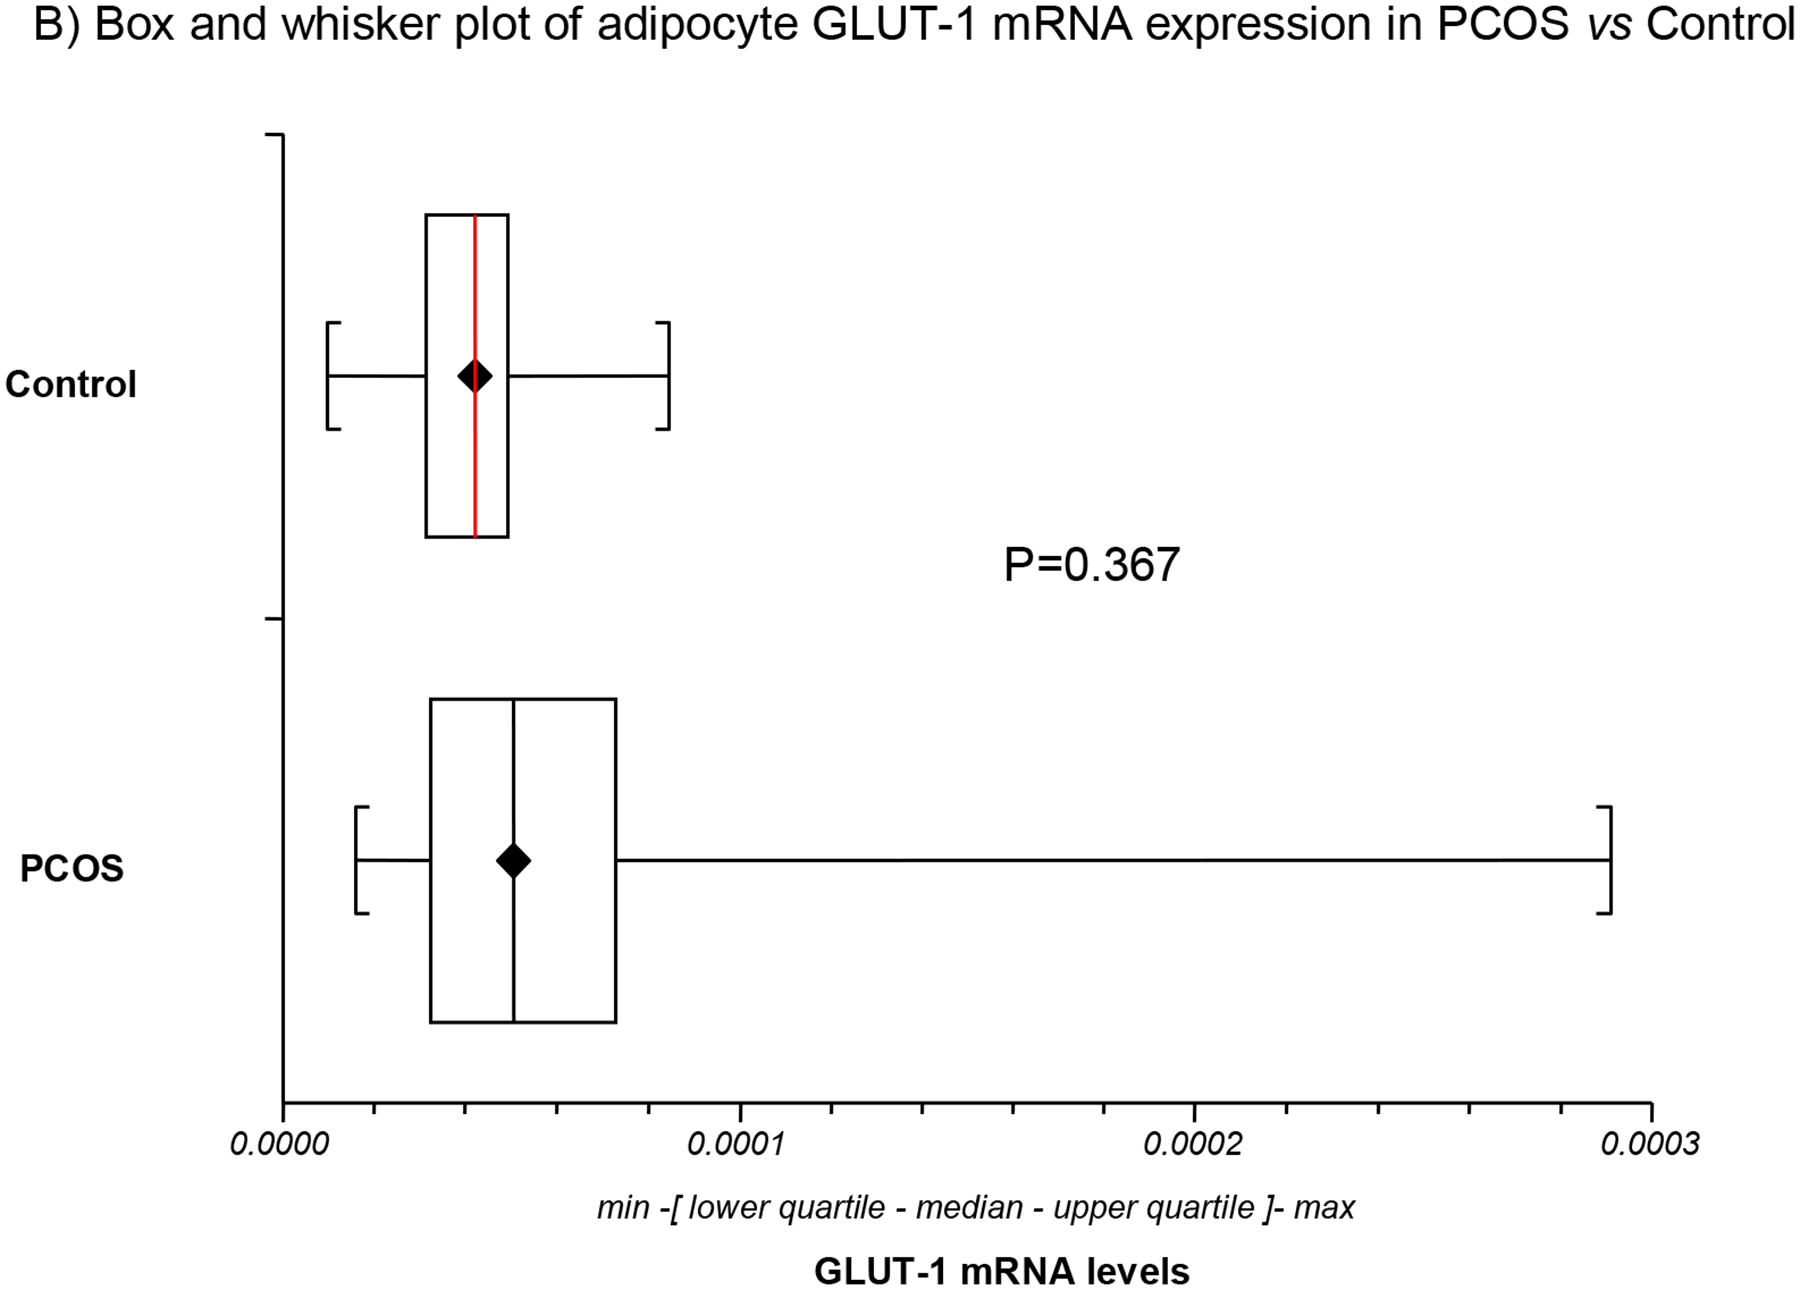
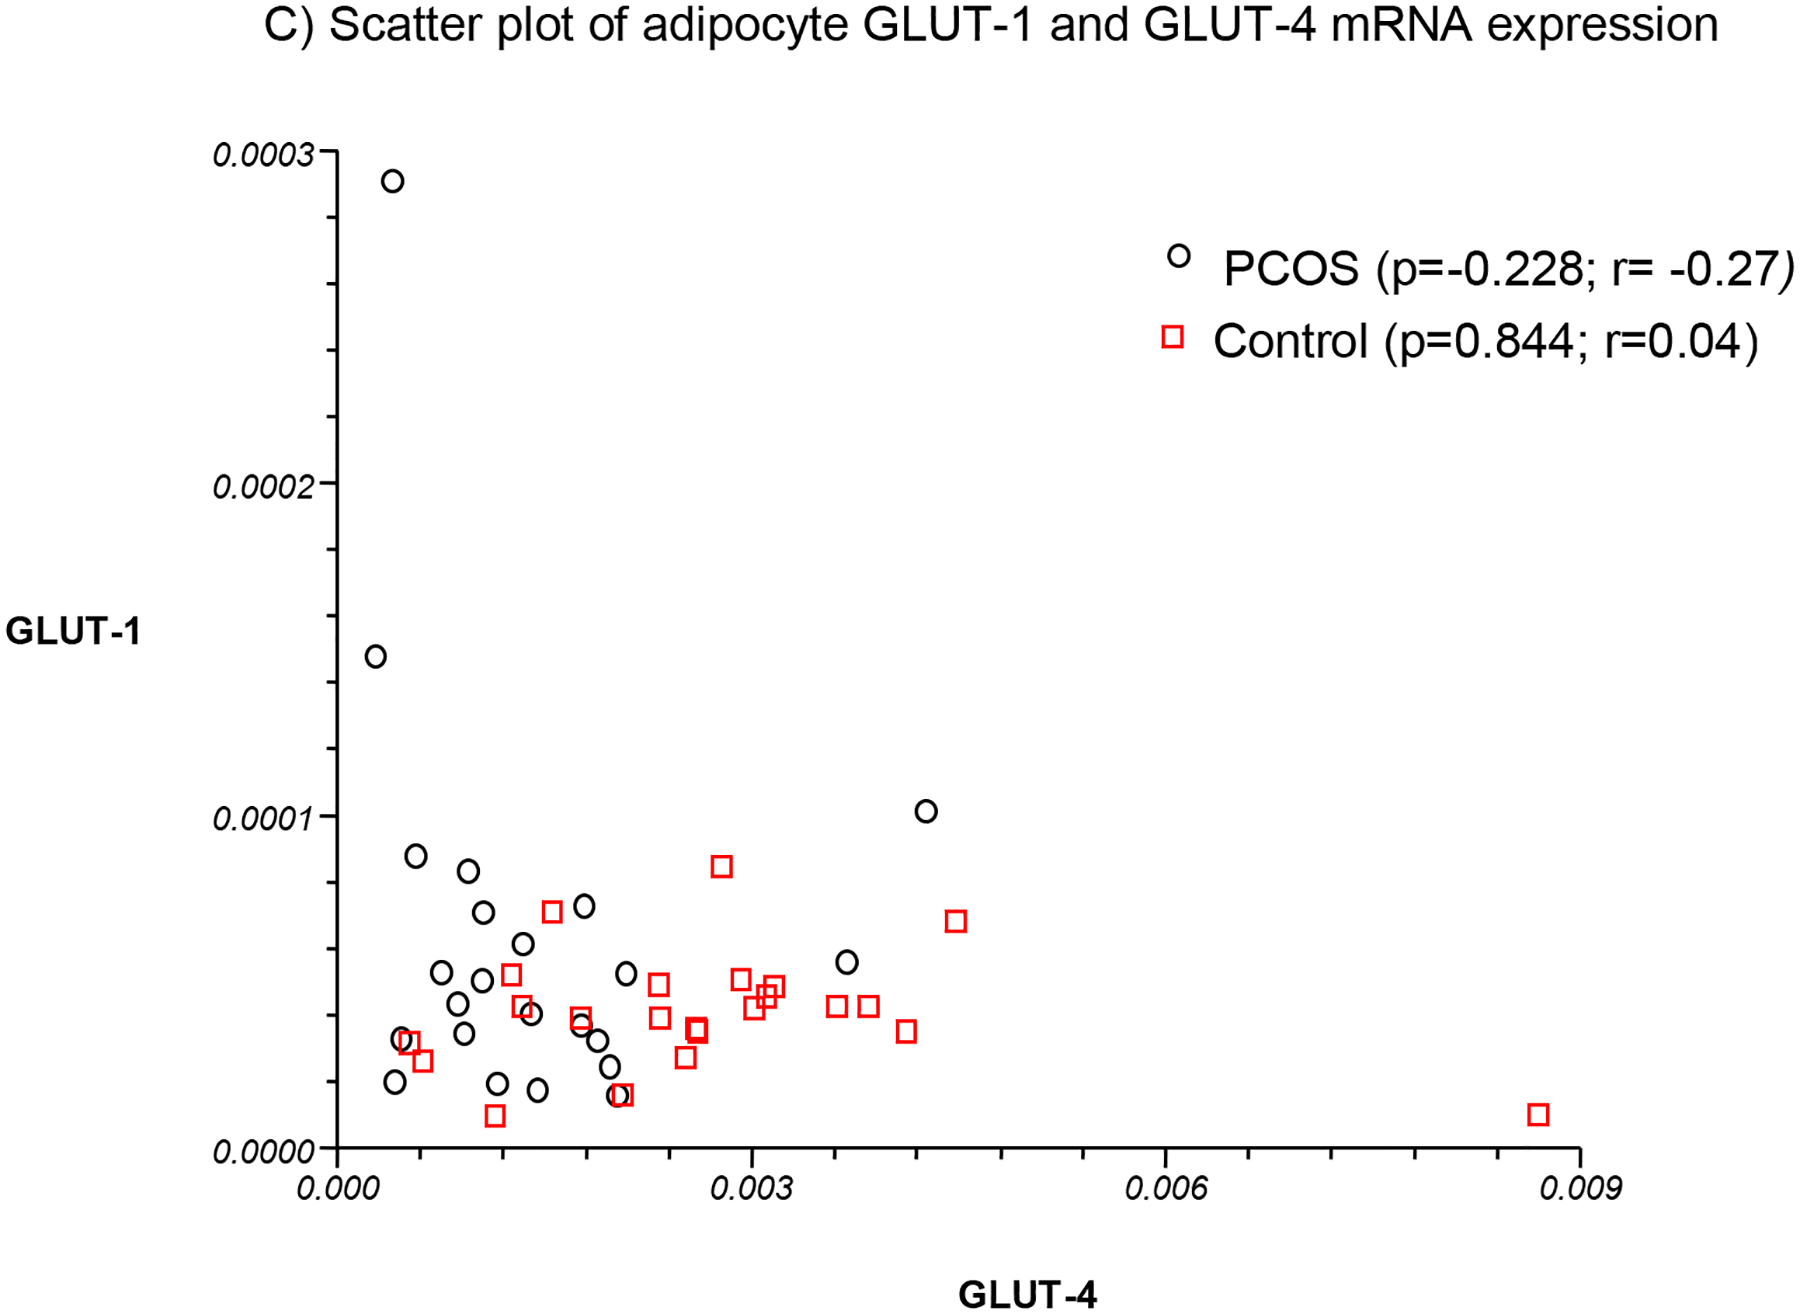
GLUT4 mRNA expression was decreased in PCOS relative to control adipocytes (Fig. 1A). In contrast, no significant difference in mean GLUT-1 mRNA expression was observed between women with PCOS and controls (Fig. 1B). No association was found between GLUT-1 and GLUT-4 mRNA levels either in women with PCOS or in controls (Fig. 1C).
The relation of adipocyte GLUT-1 and GLUT-4 mRNA expression with hyperandrogenism and adiposity
In bivalent analysis, BMI was or tended to be negatively associated with GLUT-4, but not GLUT-1, expression in both PCOS and controls (Table 2). DHEAS tended to be negatively associated with GLUT-4, but not GLUT-1, expression. Alternatively, age, WHR, mF-G score, and circulating levels of free and total T demonstrated no association with either GLUT-1 or GLUT-4 adipocyte expression in either PCOS or controls.
Table 2:
Correlation of GLUT-1 and GLUT-4 mRNA expression with adiposity and hyperandrogenism in PCOS and controls
| Variables | PCOS (n=23) | Control (n=23) | ||||||
|---|---|---|---|---|---|---|---|---|
| GLUT-1 | GLUT-4 | GLUT-1 | GLUT-4 | |||||
| r | p-value | r | p-value | r | p-value | r | p-value | |
| Age (years) | −0.04 | 0.845 | 0.22 | 0.314 | −0.40 | 0.175; | 0.23 | 0.451 |
| BMI (kg/m 2 ) | 0.15 | 0.485 | −0.44 | 0.035 | −0.27 | 0.353 | −0.52 | 0.054 |
| WHR | 0.04 | 0.869 | −0.34 | 0.118 | −0.18 | 0.547 | −0.26 | 0.387 |
| mF-G score | −0.18 | 0.409 | 0.1 | 0.144 | −0.02 | 0.947 | −0.21 | 0.479 |
| Free Testosterone (pmol/L) a | 0.23 | 0.284 | −0.05 | 0.833 | 0.01 | 0.998 | 0.06 | 0.398 |
| Total Testosterone (nmol/L) a | 0.06 | 0.780 | 0.04 | 0.856 | 0.23 | 0.425 | 0.38 | 0.178 |
| DHEAS (umol/L) | −0.12 | 0.597 | 0.36 | 0.088 | 0.31 | 0.321 | −0.24 | 0.452 |
See Table 1 and text for key to abbreviations
log-transformed data
The relation of adipocyte GLUT-1 and GLUT-4 mRNA expression with measures of metabolic function
Considering the entire cohort together, GLUT-4 mRNA expression was or tended to be negatively associated with fasting insulin and glucose, HOMA-IR and HOMA-β% (Table 3 and Fig. 2). Among PCOS, GLUT-4 mRNA expression was negatively associated with fasting glucose and HOMA-IR, and among controls, GLUT-4 mRNA expression was negatively associated with fasting insulin, HOMA-IR and HOMA-β% (Table 3). Alternatively, GLUT-1 mRNA expression was not associated with any of these parameters (Table 3).
Table 3:
Correlation of GLUT-1 and GLUT-4 mRNA expression with parameters of metabolic dysfunction in basal and dynamic states
| Variables | ALL (n=46) | PCOS (n=23) | Control (n=23) | |||||||||
|---|---|---|---|---|---|---|---|---|---|---|---|---|
| GLUT-1 | GLUT-4 | GLUT-1 | GLUT-4 | GLUT-1 | GLUT-4 | |||||||
| r | p-value | r | p-value | r | p-value | r | p-value | r | p-value | r | p-value | |
| Basal State | ||||||||||||
| Fasting glucose (mmol/L) a | −0.17 | 0.341 | −0.30 | 0.082 | −0.18 | 0.432 | −0.39 | 0.0845 | −0.46 | 0.100 | −0.23 | 0.434 |
| Fasting Insulin (pmol/L) a | 0.02 | 0.910 | −0.33 | 0.052 | −0.04 | 0.852 | −0.13 | 0.563 | −0.03 | 0.920 | −0.61 | 0.019 |
| HOMA IR a | −0.02 | 0.923 | −0.43 | 0.008 | −0.07 | 0.779 | −0.44 | 0.037 | −0.18 | 0.543 | −0.58 | 0.037 |
| HOMA-β% a | 0.06 | 0.751 | −0.32 | 0.059 | −0.03 | 0.912 | −0.20 | 0.372 | 0.16 | 0.583 | −0.55 | 0.054 |
| Dynamic State (by mFSIVGTT) b | ALL (n=12) | PCOS (n=6) | Control (n=6) | |||||||||
| Si (L min−1 m −1) | 0.27 | 0.289 | 0.48 | 0.049 | −0.02 | 0.964 | 0.63 | 0.184 | 0.3 0 | 0.563 | 0.51 | 0.302 |
| AIRg (mU L−1 m −1) | −0.15 | 0.633 | −0.11 | 0.672 | −0.04 | 0.945 | 0.12 | 0.820 | 0.31 | 0.562 | −0.42 | 0.413 |
| Di | 0.09 | 0.771 | 0.54 | 0.026 | 0.09 | 0.869 | 0.77 | 0.074 | 0.25 | 0.632 | 0.33 | 0.526 |
| Sg (min −1) | 0.50 | 0.043 | −0.02 | 0.951 | 0.37 | 0.471 | −0.28 | 0.593 | 0.63 | 0.179 | −0.29 | 0.582 |
| GEZI | 0.41 | 0.099 | −0.22 | 0.496 | 0.44 | 0.382 | −0.22 | 0.675 | 0.65 | 0.161 | −0.31 | 0.571 |
| BIE | 0.28 | 0.275 | −0.11 | 0.728 | −0.93 | 0.007 | −0.34 | 0.510 | −0.09 | 0.856 | 0.03 | 0.950 |
See Table 1 and text for key to abbreviations
log-transformed data
Assessment of mFSIVGTT parameters was performed in 6 PCOS women and 6 matched controls
Fig. 2. Association between adipocyte GLUT-4 gene expression and basal state insulin sensitivity (HOMA-IR) or pancreatic β-cell function (HOMA-β%) in basal state.
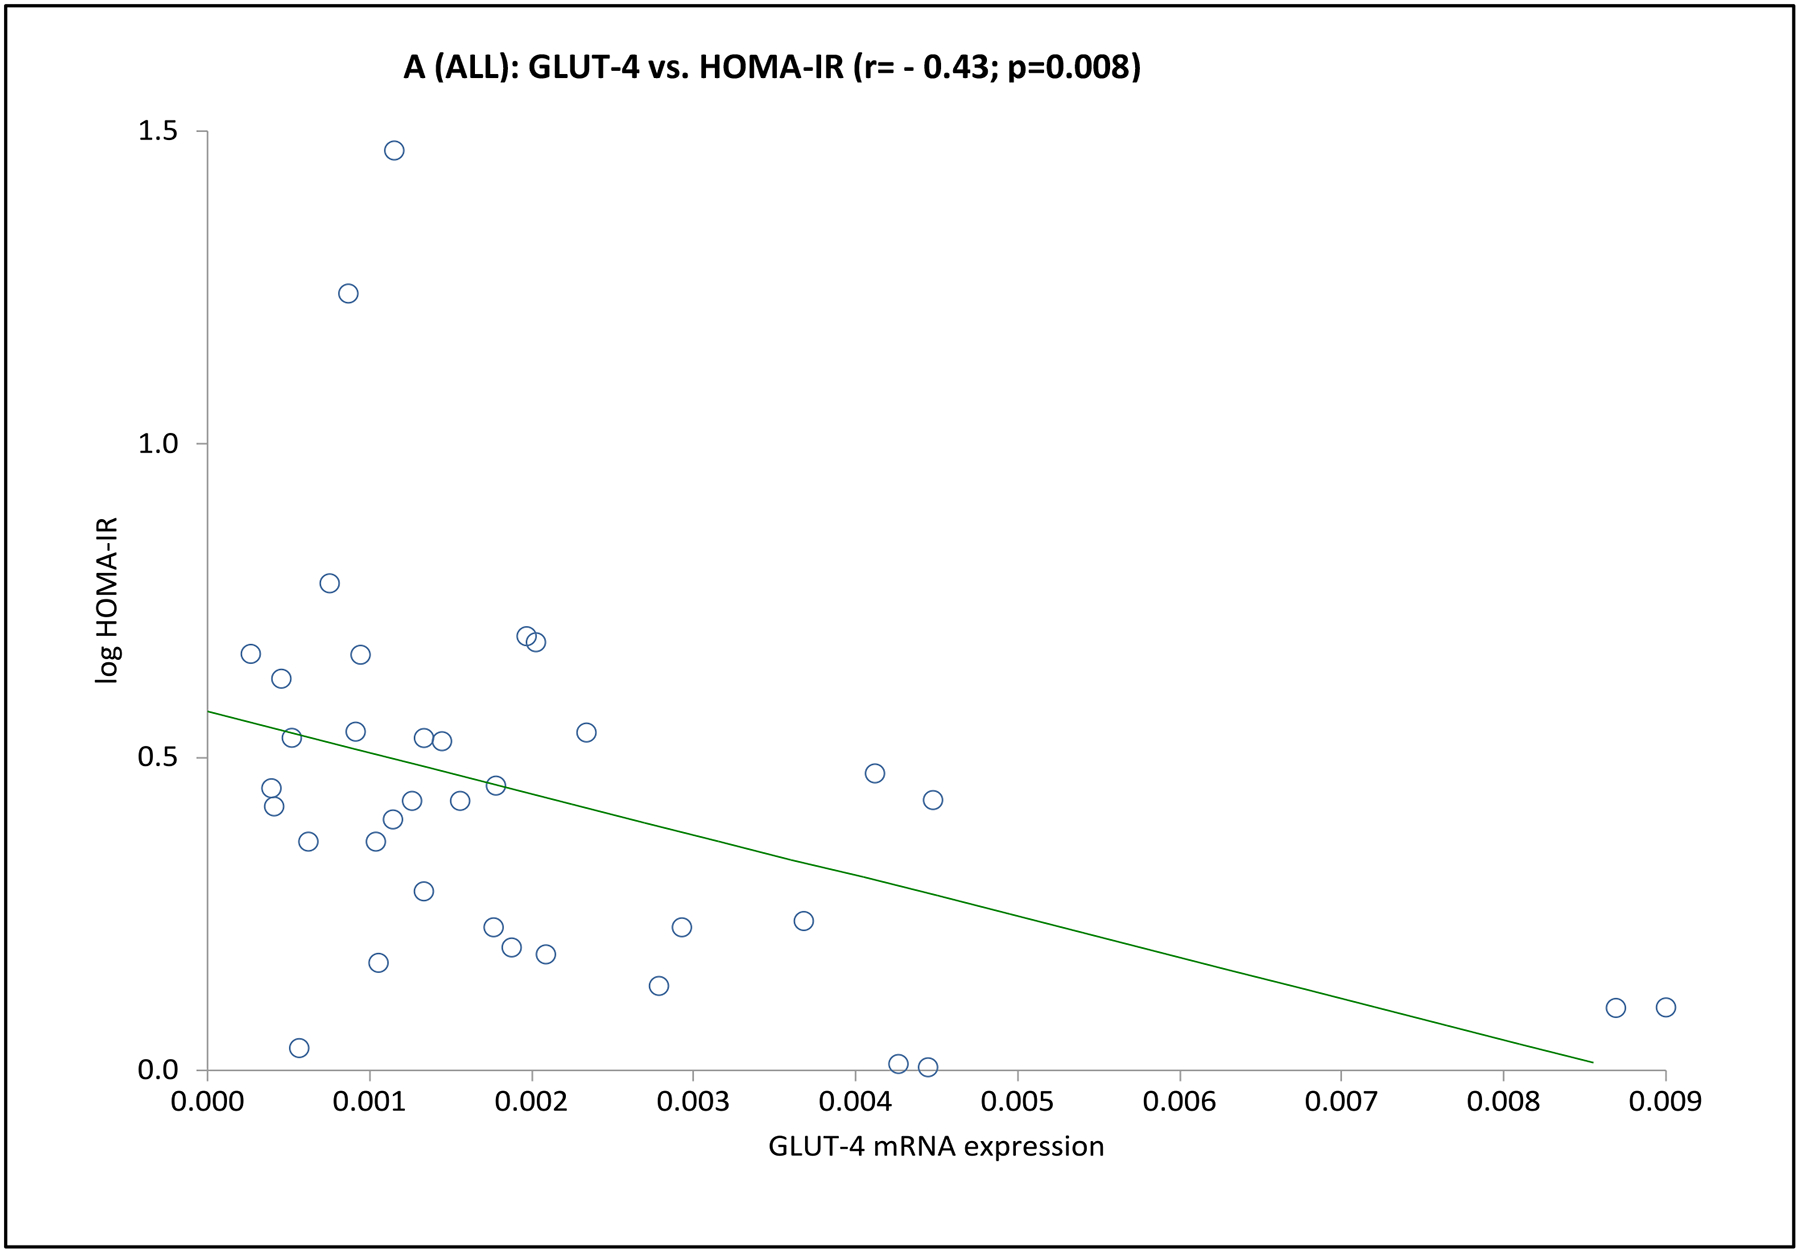
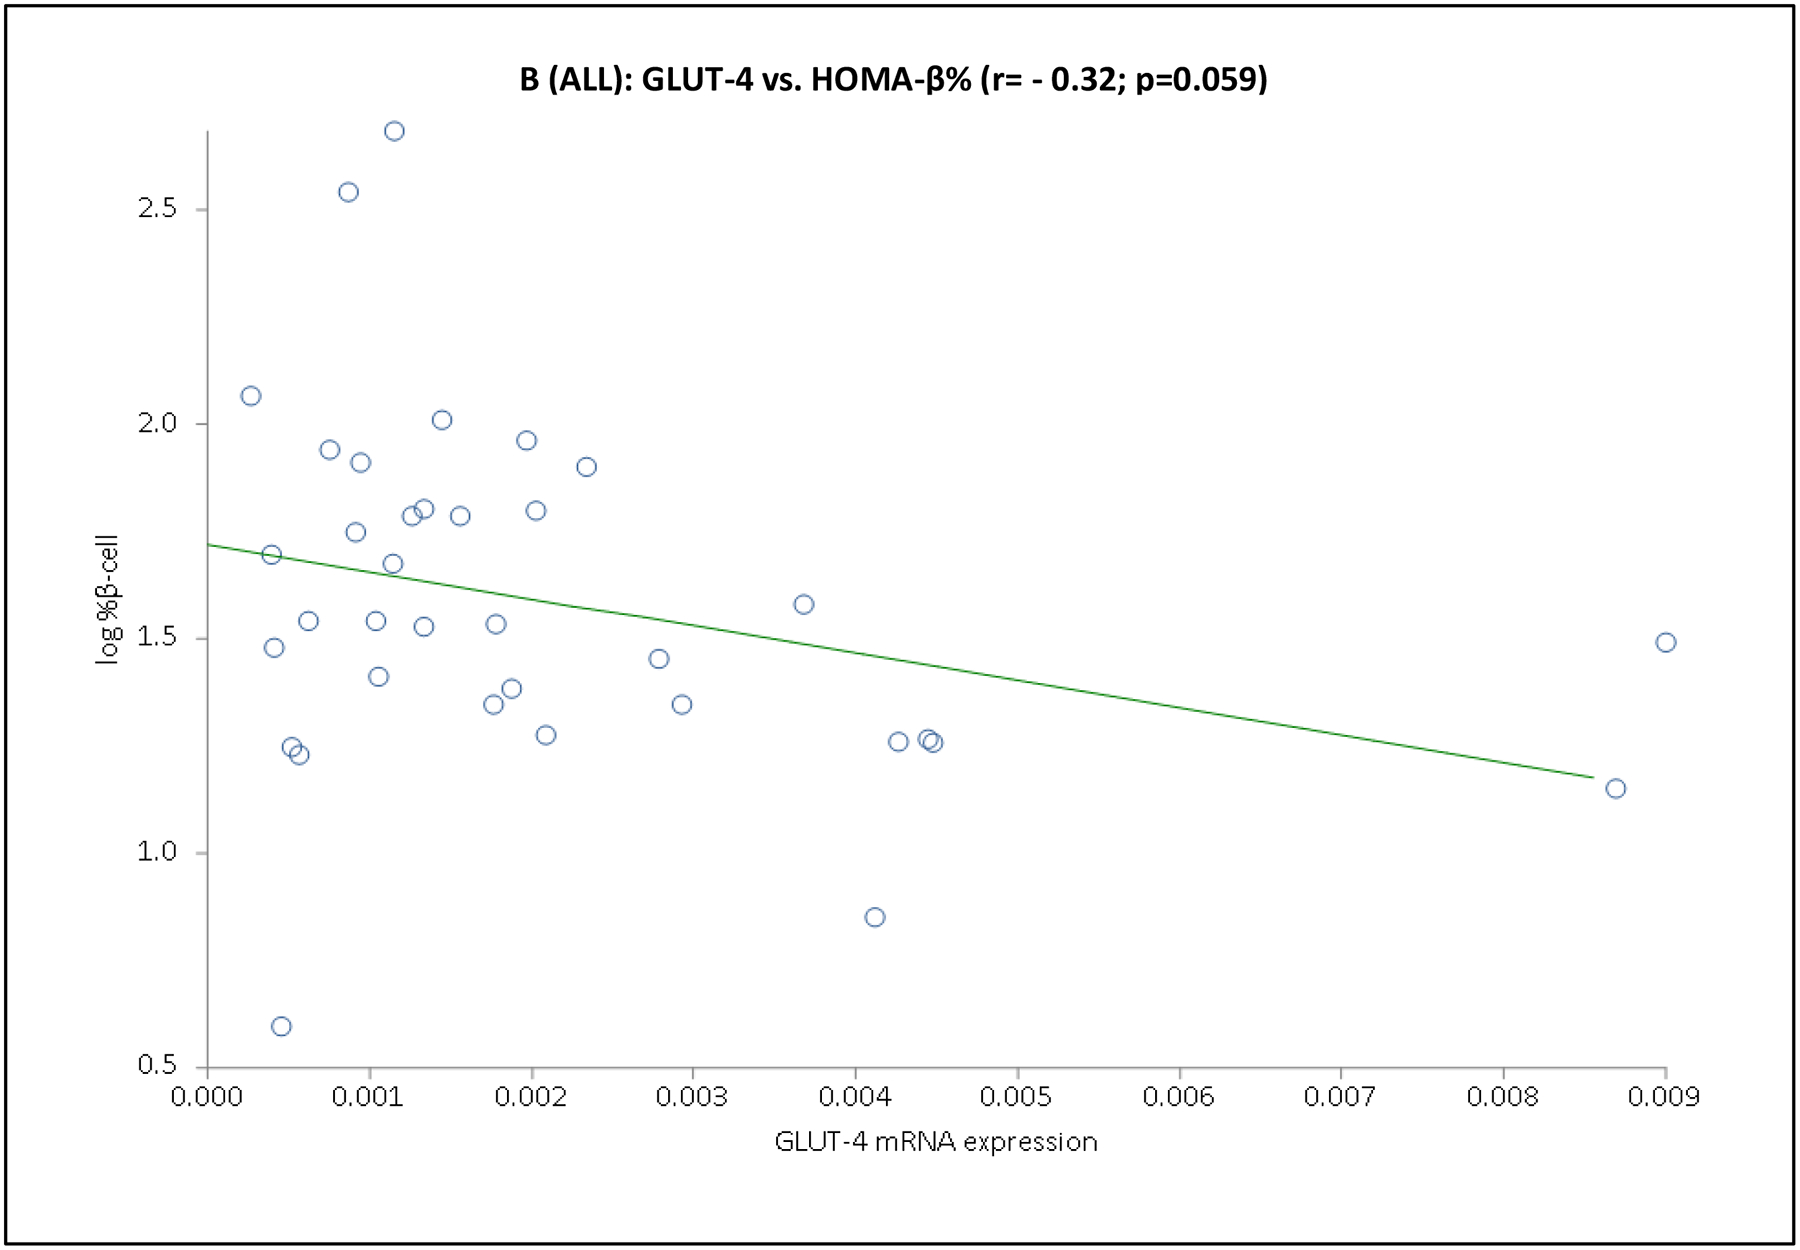
Depicted are the scatter plots of GLUT-4 mRNA expression vs. HOMA-IR (Panel A) or HOMA-β% (Panel B) values for the entire cohort.
In the subgroup of 12 subjects undergoing an mFSIVGTT, when considering the entire cohort together GLUT-4 mRNA expression was positively associated with Si and Di, and GLUT-1 was positively associated with Sg (Table 3 and Fig. 3). Associations when considering the PCOS or control groups separately were less clear, likely due to the small number of subjects in this part of the analysis. In PCOS subjects GLUT-1 mRNA expression was negatively associated with BEI; there were no obvious associations of GLUT-4 or GLUT-1 mRNA expression with mFSIVGTT results among controls in this subgroup (Table 3 and Fig. 3).
Fig. 3. Association of adipocyte GLUT gene expression with dynamic whole-body noninsulin-mediated glucose uptake (NIMGU), insulin-mediated glucose uptake (IMGU), or insulin secretion in PCOS and control women combined (n=12).
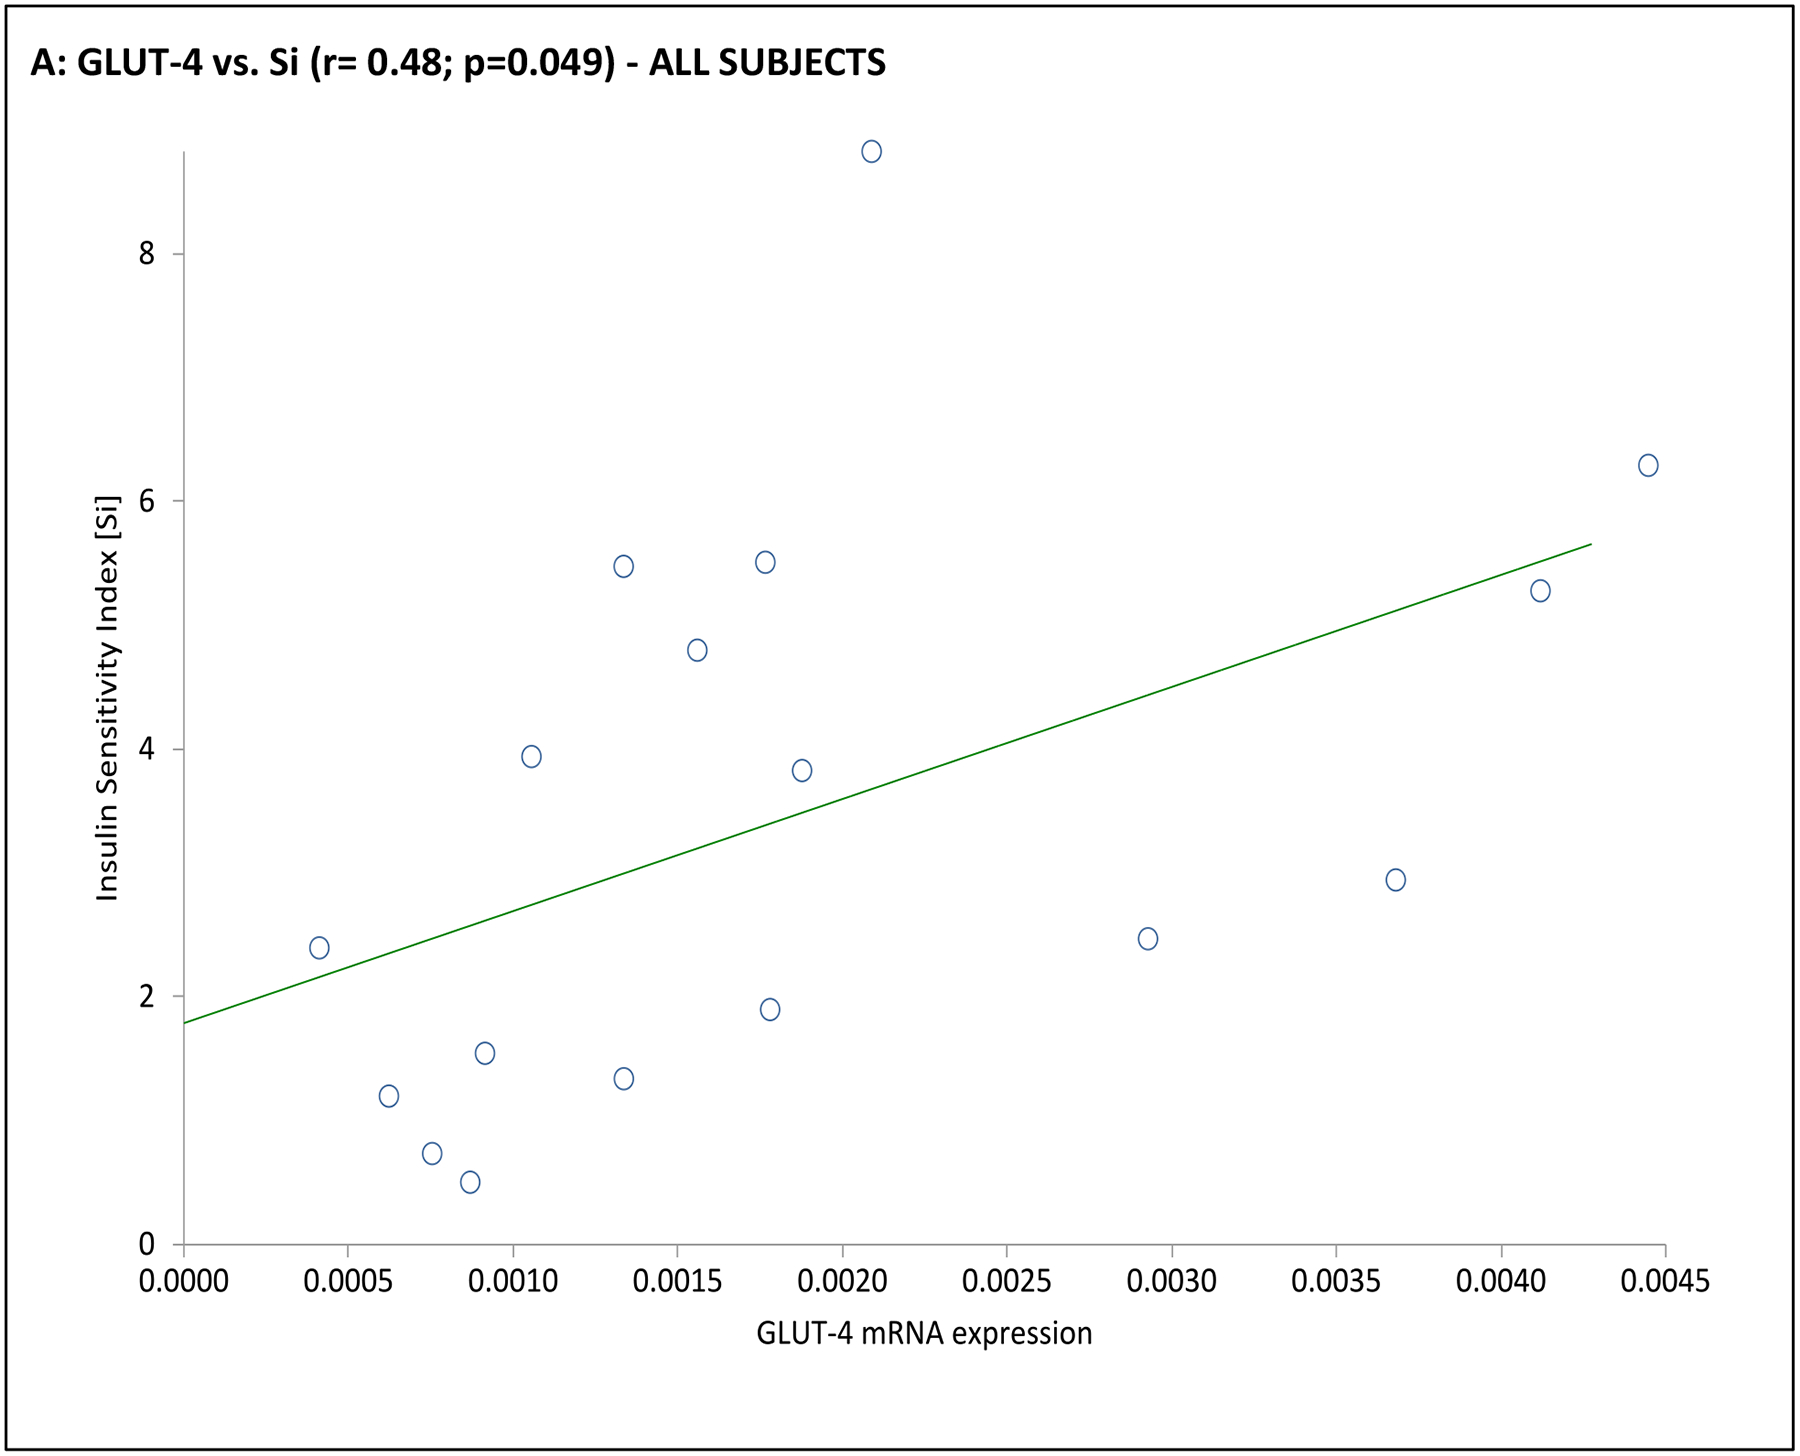
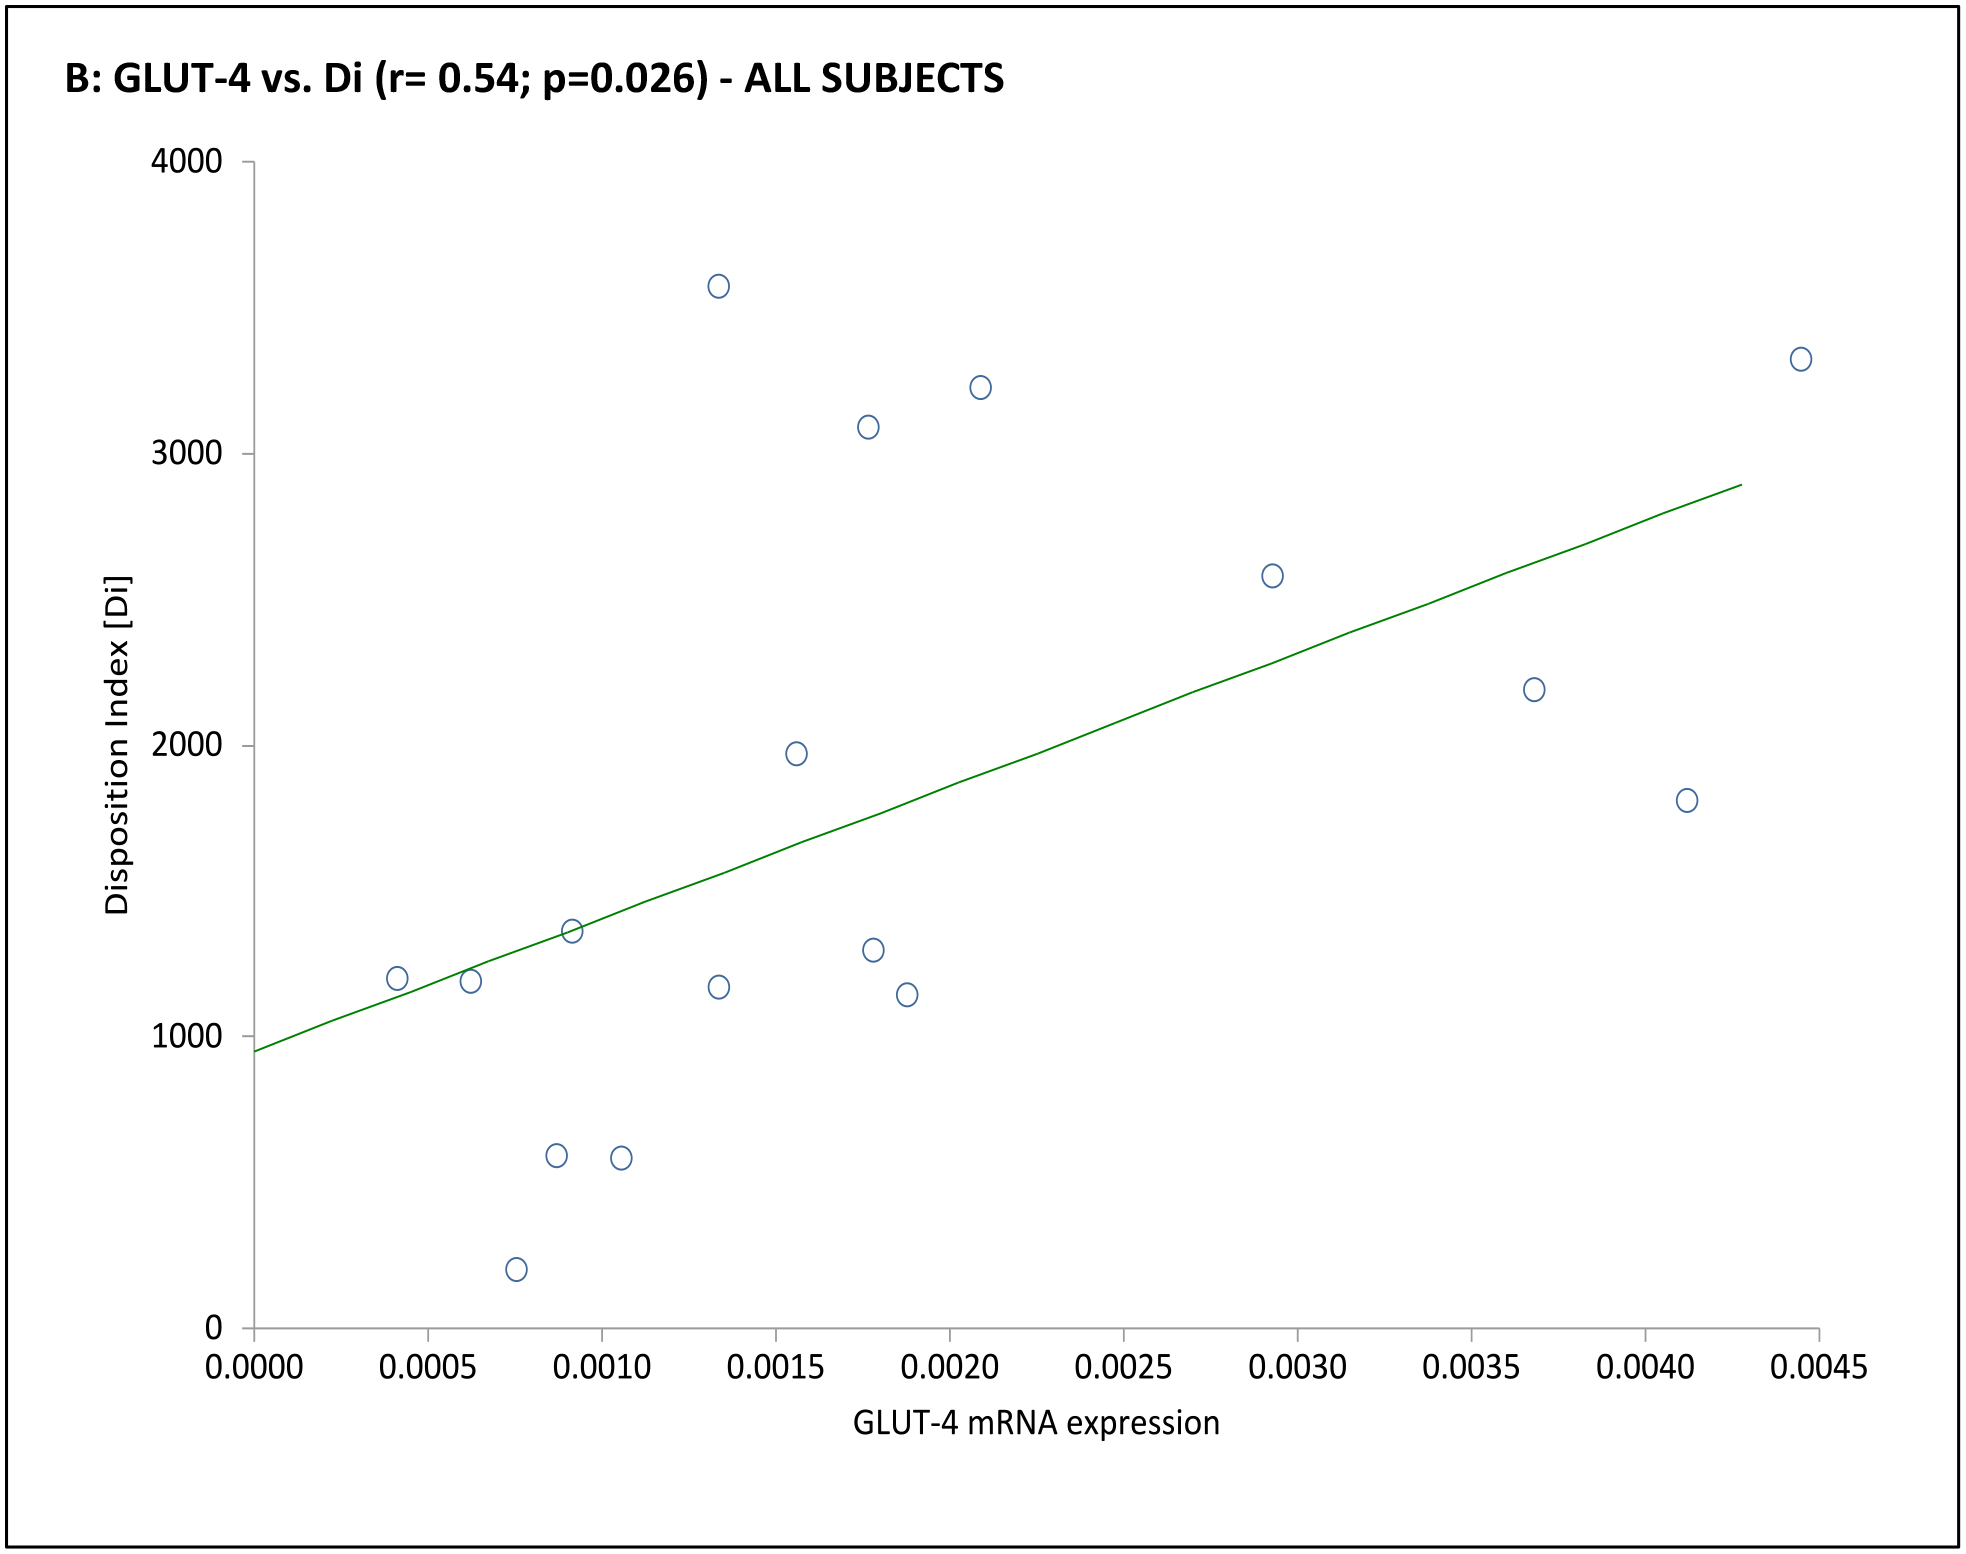
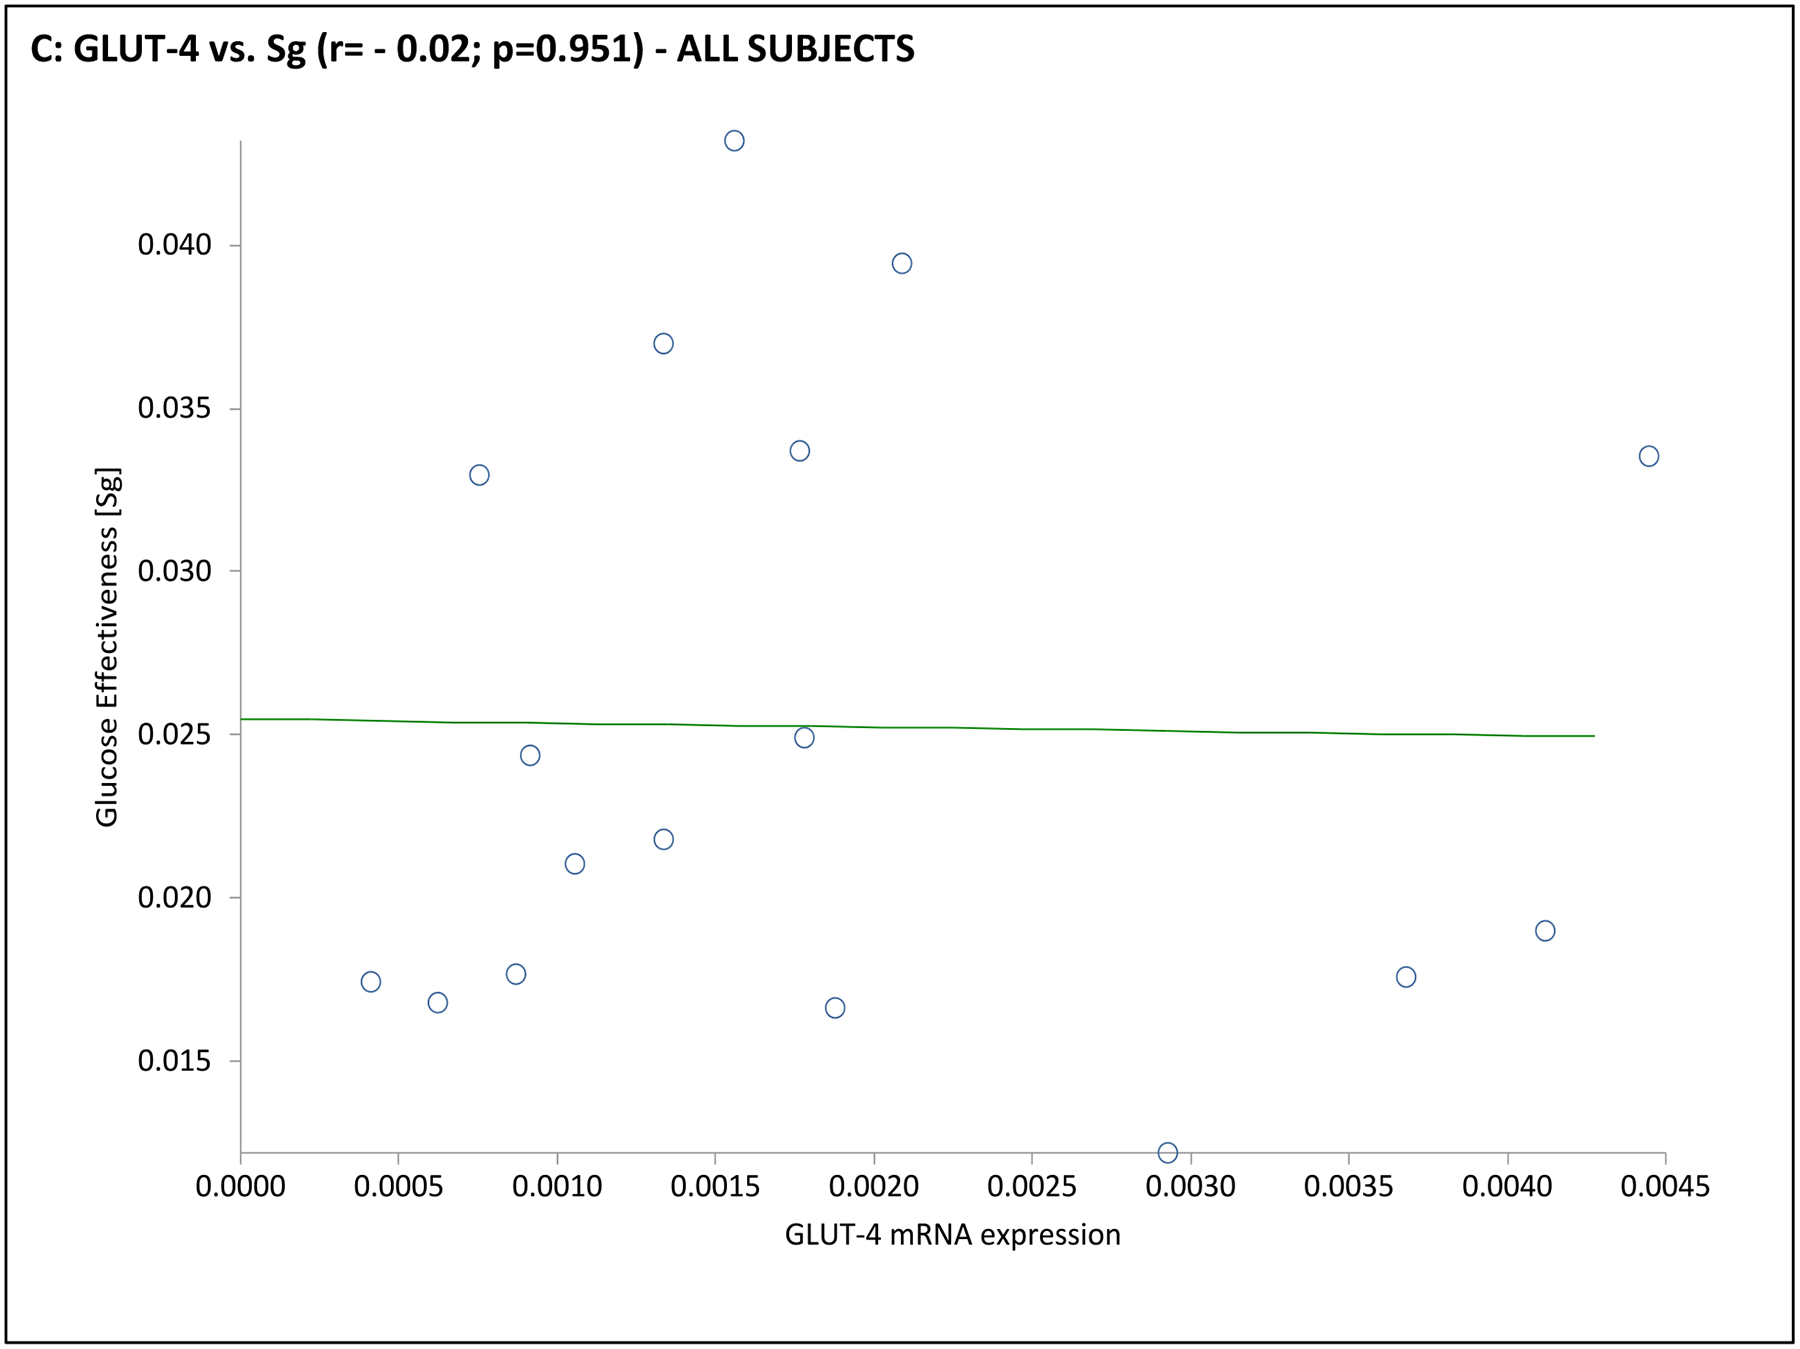
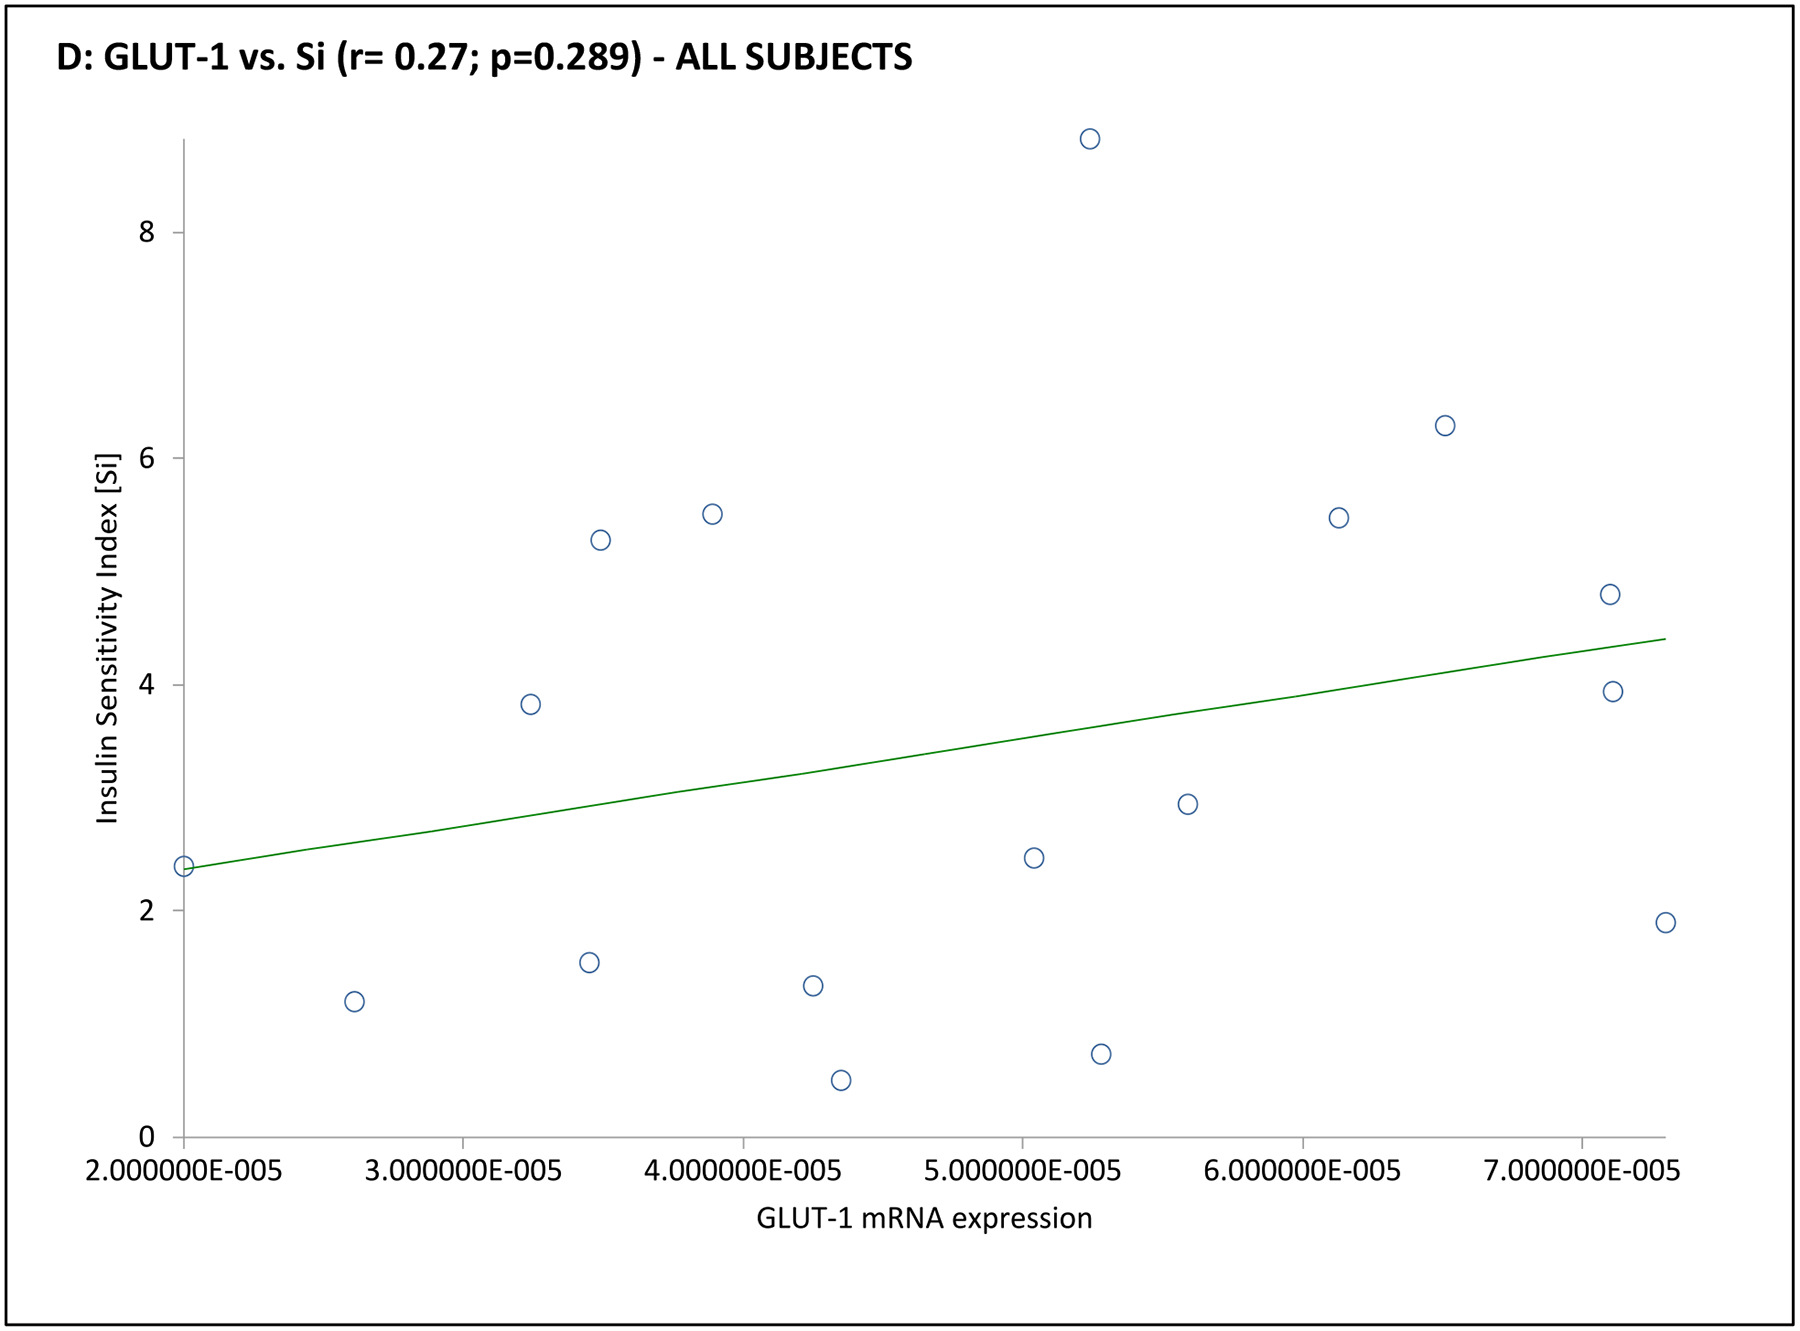
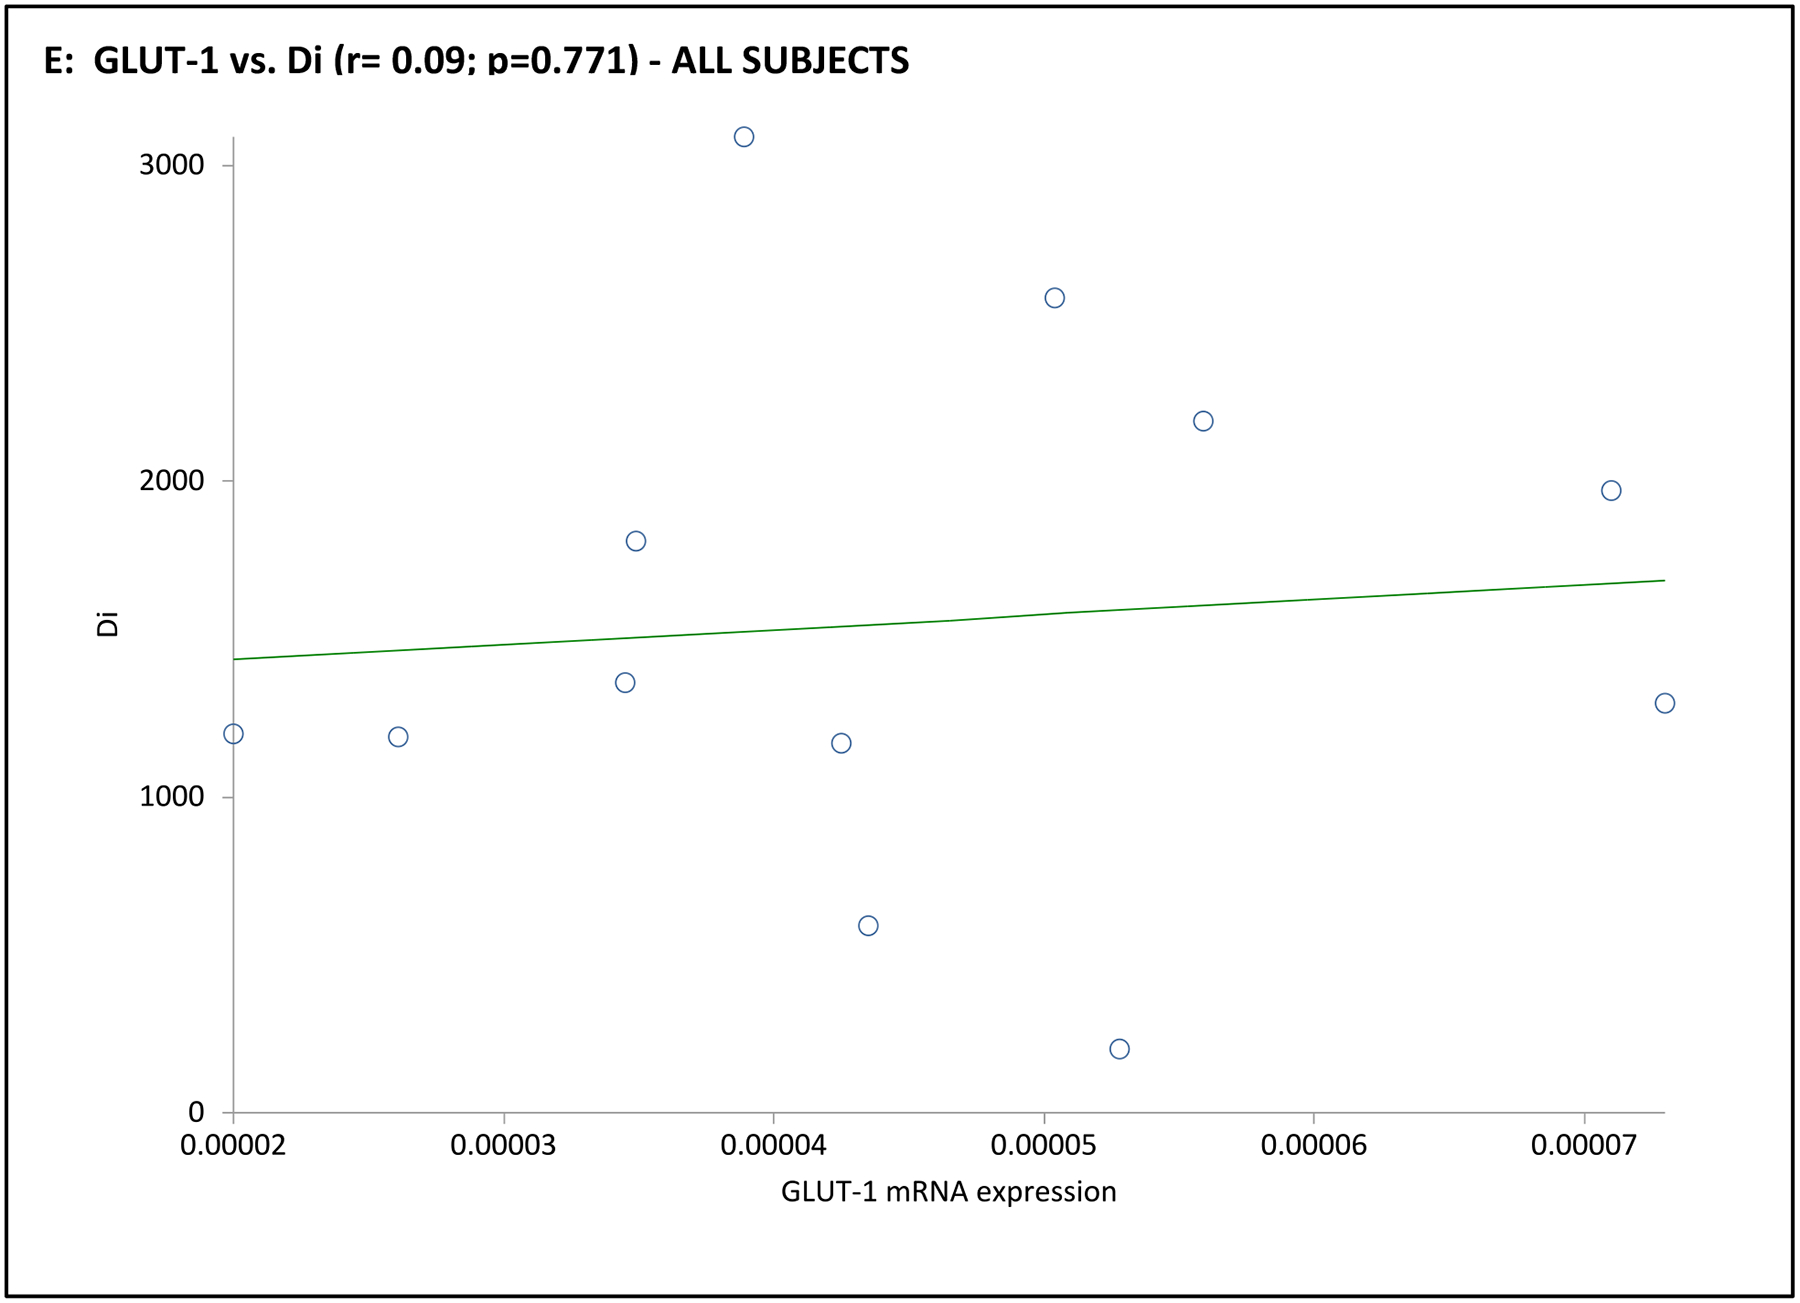
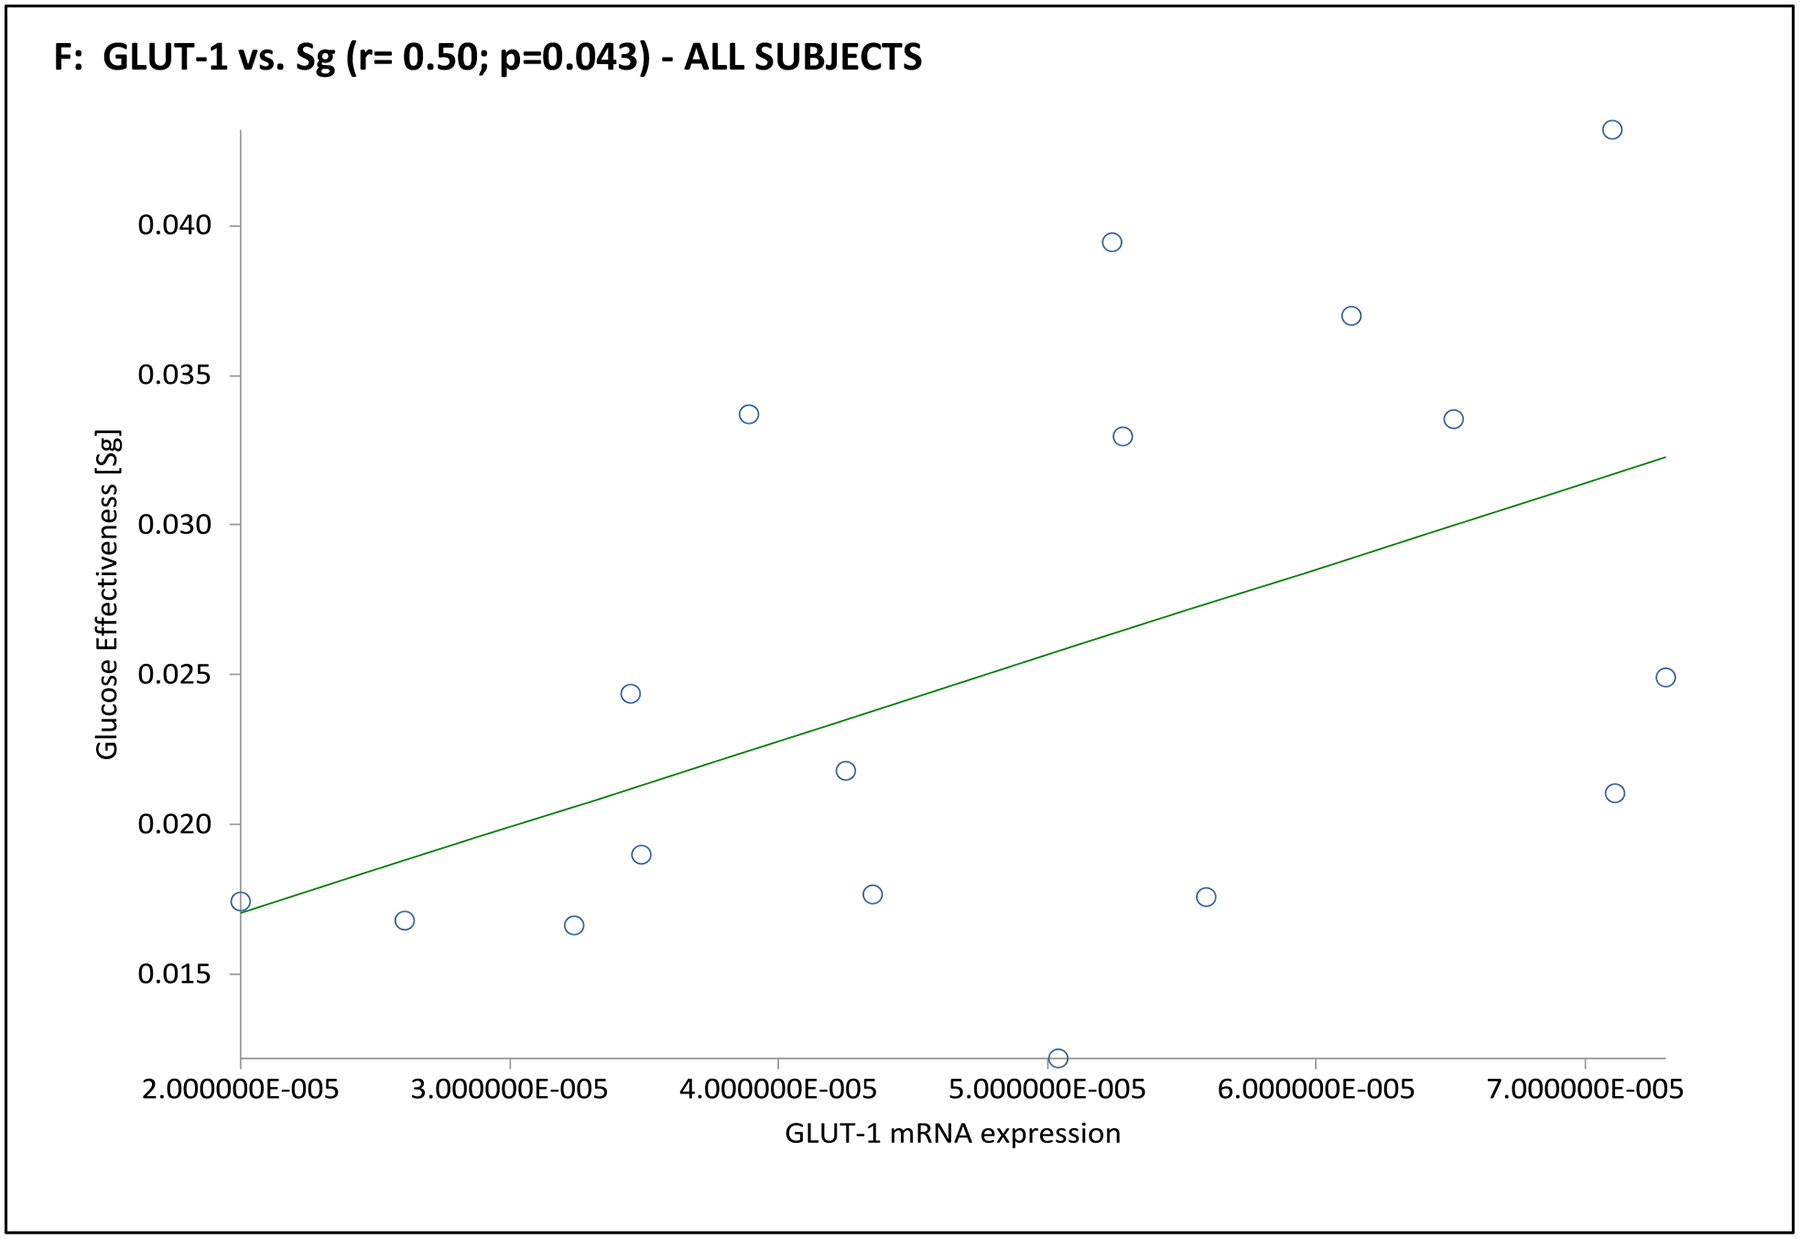
NIMGU was assessed by the Sg value, IMGU by the Si value, and insulin secretion by the DI values, estimated from the mFSIVGTT. Scatter plots of GLUT-4 and GLUT-1 expression vs. Si, DI, and Sg are depicted in Panels A through C, and Panels D through F, respectively.
DISCUSSION
While in some insulin-resistant states, NIMGU increases as IMGU declines,7, 8 we previously demonstrated that in women with PCOS decreased IMGU was not accompanied by a compensatory increase in NIMGU.3 These data suggest that the absence of a compensatory increase in NIMGU may exacerbate the IR of PCOS. In the current study we explored the hypothesis that the lack of a compensatory increase in NIMGU in PCOS could be related to a similar absence in GLUT-1 upregulation.
Our data first confirmed that GLUT-4 expression is reduced in PCOS adipocytes compared to controls, and that this reduction is associated with markers of decreased whole-body insulin sensitivity and/or enhanced compensatory insulin secretion, as has been previously described by ourselves2, 3, 10, 13, 24 and others.11, 25, 26, 27 We also found that GLUT-1 adipocyte expression was positively associated with Sg, but not Si, confirming the importance of this glucose transporter in determining NIMGU, but not IMGU.
However, our data also indicated that in contrast to the deficit in GLUT-4 mRNA expression observed, we did not observe any significant difference in GLUT-1 expression in the adipocytes of our PCOS subjects compared to controls. These data support the concept that the absence of a compensatory increase in NIGMU in PCOS results, at least in part, from the absence of compensatory increase in GLUT-1, in contrast to what has been observed in some IR animal models.13 We can further suggest that the absence of a compensatory increase in GLUT-1 and its resulting NIMGU, in part or in whole, accounts for the exaggerated IR observed in PCOS.
Furthermore, as GLUT-1 expression does not track with the deficiency in GLUT-4, these data suggest that the defect in GLUT-4 gene expression observed in PCOS adipocytes by others11 and ourselves10 is a specific defect, and does not reflect a generalized defect in glucose transporters. These molecular data are also consistent with studies of skeletal muscle in patients with T2DM, which found that GLUT-4 mRNA expression was reduced while GLUT-1 expression was unaltered.25, 28
Finally, we began to explore the relationship between GLUT-4 gene expression and β-cell function, given the hyperbolic relationship insulin sensitivity and acute pancreatic response.18 The higher mean HOMA-β%, along with the trend towards a mean higher HOMA-IR and a mean lower Si, observed in PCOS women compared to controls in this study are consistent with previous reports of compensatory pancreatic β-cell function in response to IR reported in PCOS.26, 29 In our control women, GLUT-4 mRNA expression tended to be negatively associated with HOMA-β%, suggesting that when insulin secretion is reduced the increased expression of GLUT-4 may be enhanced in compensation. In contrast, the lack of association between GLUT-4 mRNA and HOMA-β% in our PCOS women suggests that this compensatory relationship may be compromised in women with the disorder, placing them at relatively higher risk for β-cell dysfunction29, 30 and eventual failure, consistent with their higher risk for T2DM.1, 26 It should be noted that our results do not prove the cause-effect relationship between GLUT-4 gene expression and these surrogate basal markers of β-cell function because of the cross-sectional nature of our study. Further studies are therefore needed to confirm this finding.
In line with previous findings showing deleterious effects of obesity on glucose tolerance26, and Si,3, 13, 26 the finding that increasing adiposity was associated with decreasing GLUT-4 expression is not unexpected. In contrast, we found no association between markers of hyperandrogenism and GLUT-1 or GLUT-4 expression in either PCOS or control subjects. These data support the concept that the adipocyte deficits that we and others10, 11, 27 have been observing in PCOS are independent of the hyperandrogenism of PCOS subjects.
Glucose uptake is the rate-limiting step in glucose metabolism, and the number of glucose transporter directly influence glucose disposal in target tissues.5, 6, In our study, PCOS adipocytes demonstrated a 1.7-fold decline in GLUT-4 but a parallel 1.5-fold increase in GLUT-1 gene expressions than controls, suggesting that the compensatory response to IR by GLUT-1 gene may apparently be insufficient. Nonetheless, it should be noted that, compared to GLUT-4, which is the predominant GLUT isoform in insulin sensitivity tissues, GLUT-1 normally comprise a very small percent of total glucose carriers in these tissues - adipocytes (5%), skeletal muscles (10%) and cardiomyocytes (30%).5, 6, 31 In contrast, GLUT-1 expression is relatively far more higher in some non-insulin sensitive tissues such as primate blood-brain barrier, cancers and erythrocytes than other GLUT isoforms.5, 6 Higher adipocyte GLUT-4 relative to GLUT-1 mRNA expression observed in our study is therefore not unexpected. Apart from GLUT numbers, other factors such as tissue-specific expression and kinetic characteristics of these GLUT isoforms affect glucose uptake.5, 6
This detailed and carefully conducted translational PCOS study is unique in relating an in vitro analysis of GLUT-1 and GLUT-4 receptor gene expression in adipocytes to whole-body glucose homeostasis and insulin secretion in both basal and dynamic states. Our study, however, has also a number of potential limitations. Firstly, is the small number of subjects included, due to the invasiveness of the procedures used, although our a priori power analysis indicated that we would likely have sufficient power to detect important differences.
Secondly, we are studying adipocytes rather than skeletal muscle. However, although skeletal muscle is the principle site of glucose metabolism, accounting for ~70–85% of total IMGU in the postprandial state,32 AT is a critically important endocrine organ, critical in the regulation of whole body homeostasis via the secretion of adipokines and other factors. For example, ablation of adipocyte-specific GLUT-4 in a transgenic mouse model resulted in not only decreased glucose uptake in AT, but also impaired insulin action in skeletal muscle and liver, and profound whole-body glucose intolerance.33 Furthermore, overexpression of AT-specific GLUT-4 in the AT of muscle-specific GLUT-4 deficient mice reversed whole-body glucose intolerance and diabetes, without restoring glucose transport in the muscle.34 Similar effects have been observed in clinical trials of bariatric surgery in human.35, 36 Consequently, glucose handling in AT plays a critical role in whole-body glucose homeostasis, even though AT directly accounts for only 10–20% of IMGU.37 Finally, protein expressions of GLUT- 1 and GLUT-4 were not assessed in this study. However, our previous studies indicate that GLUT-4 mRNA expression reflects protein expressions in primary adipocyte cultures and AT, in both PCOS and controls.10, 21 Our ongoing more comprehensive study of adipocyte dysfunction in PCOS will measure protein expressions of these GLUT isoforms and other adipokines in order to enable study of direct relationship between these proteins and whole-body insulin sensitivity and β-cell function.
In summary, our results indicate that GLUT-4 is a recognized determinant of IMGU while GLUT-1 seems to be a strong determinant of NIMGU, and suggests that IR in PCOS can in part be attributed to decreased adipocyte GLUT-4 gene expression, which does not appear to be accompanied by a compensatory increase in GLUT-1 gene expression. Further studies are needed to study protein expression of GLUT-1 and GLUT-4 to confirm these findings, and to compare transcriptional and posttranscriptional expression and regulation of GLUT isoforms in PCOS adipocytes and other insulin sensitive tissues.
Supplementary Material
Supplemental Fig. 1. Scatter plot of adipocyte GLUT-1 and GLUT-4 mRNA expression (by RT-PCR) in PCOS (n=23) versus controls (n=23).
Abbreviations of authors’ names, funding and Conflict of interests
This work was supported by grants from the U.S. National Institutes of Health (NIH (R01-DK073632 and R01-HD29364) and an endowment of the Helping Hand of Los Angeles, Inc. (to Ricardo Azziz [R.A.]). R.A. serves as consultant to Ansh Labs, Spruce Biosciences, Medtronics, and Latitude Capital. Uche Ezeh (UE), Ida Y-D Chen (IYDC) and Yen-Hao Chen (Y-HC) have nothing to declare.
Footnotes
Author roles
Both U.E. and R.A. designed the study, identified and phenotyped the subjects, collected the samples and researched data, contributed to discussion, wrote the manuscript, and reviewed and edited the manuscript. I.Y-D.C. analyzed the mFSIVGTTs while Y-H.C. performed the GLUT-4 and GLUT-1 expression studies. Both I.Y-D.C. and Y-H.C. were also involved in the review and editing of the manuscript. R.A. is the guarantor of this work and, as such takes responsibility for the data integrity and accuracy of the data analysis.
REFERENCES
- 1.Azziz R, Carmina E, Chen Z, Dunaif A, Laven JS, Legro RS, Lizneva D, Natterson-Horowtiz B, Teede HJ, Yildiz BO. Polycystic ovary syndrome. Nat Rev Dis Primers 2016; 2:16057. [DOI] [PubMed] [Google Scholar]
- 2.DeUgarte CM, Bartolucci AA, Azziz R. Prevalence of insulin resistance in the polycystic ovary syndrome using the homeostasis model assessment. Fertil Steril 2005; 83:1454–1460. [DOI] [PubMed] [Google Scholar]
- 3.Ezeh U, Pall M, Mathur R, Dey D, Berman D, Chen IY, Dumesic DA, Azziz R. Effects of endogenous androgens and abdominal fat distribution on the interrelationship between insulin and non-insulin-mediated glucose uptake in females. J Clin Endocrinol Metab 2013; 98:1541–1548. [DOI] [PMC free article] [PubMed] [Google Scholar]
- 4.Gottesman I, Mandarino L, Gerich J. Estimation and kinetic analysis of insulin-independent glucose uptake in human subjects. Am J Physiol 1983; 244: E632 – E635. [DOI] [PubMed] [Google Scholar]
- 5.Thorens B, Mueckler M. Glucose transporters in the 21st century. Am J Physiol Endocrinol Metab 2010; 298: E141–E145. [DOI] [PMC free article] [PubMed] [Google Scholar]
- 6.Carruthers A, DeZutter J, Ganguly A, Devaskar SU. Will the original glucose transporter 1 form please stand up! Am J Physiol Endocrinol Metab 2009; 297: E836–848. [DOI] [PMC free article] [PubMed] [Google Scholar]
- 7.Jumpertz R, Thearle MS, Bunt JC, Krakoff J. Assessment of noninsulin-mediated glucose uptake: association with body fat and glycemic status. Metabolism 2010; 59:1396–1401. [DOI] [PMC free article] [PubMed] [Google Scholar]
- 8.Fernandez-Real JM, Casamitjana R, Ricart W. Morning cortisol levels and glucose effectiveness. Metabolism 2000; 49: 305–307. [DOI] [PubMed] [Google Scholar]
- 9.Ebeling P, Koistinen HA, Koivisto VA. Insulin-independent glucose transport regulates insulin sensitivity. FEBS Lett 1998; 436: 301–303. [DOI] [PubMed] [Google Scholar]
- 10.Chen YH, Heneidi S, Lee JM, Layman LC, Stepp DW, Gamboa GM, Chen BS, Chazenbalk G, Azziz R. miRNA-93 inhibits GLUT4 and is overexpressed in adipose tissue of polycystic ovary syndrome patients and women with insulin resistance. Diabetes 2013; 62: 2278 – 2286. [DOI] [PMC free article] [PubMed] [Google Scholar]
- 11.Rosenbaum D, Haber RS, Dunaif A. Insulin resistance in polycystic ovary syndrome: decreased expression of GLUT-4 glucose transporters in adipocytes. Am J Physiol 1993; 264: E197–E202. [DOI] [PubMed] [Google Scholar]
- 12.National Institutes of Health. Evidence-based methodology workshop on polycystic ovary syndrome, December 3–5, 2012. Executive summary. Available at: https://prevention.nih.gov/docs/programs/pcos/FinalReport.pdf.
- 13.Ezeh U, Pall M, Mathur R, Azziz R. Association of fat to lean mass ratio with metabolic dysfunction in women with polycystic ovary syndrome. Hum Reprod 2014; 29: 1508–1517. [DOI] [PMC free article] [PubMed] [Google Scholar]
- 14.Azziz R, Sanchez LA, Knochenhauer ES, Moran C, Lazenby J, Stephens KS, Taylor K, Boots LR. Androgen excess in women: Experience with over 1000 consecutive patients. J Clin Endocrinol Metab 2004; 89: 453–462. [DOI] [PubMed] [Google Scholar]
- 15.Matthews DR, Hosker JP, Rudenski AS, Naylor BA, Treacher DF, Turner RC. Homeostasis model assessment: insulin resistance and β-cell function from fasting plasma glucose and insulin concentrations in man. Diabetologia 1985; 28: 412–419. [DOI] [PubMed] [Google Scholar]
- 16.Farah-Eways L , Reyna R , Knochenhauer ES , Bartolucci AA , Azziz R. Glucose action and adrenocortical biosynthesis in women with polycystic ovary syndrome. Fertil Steril 2004; 281:120–125. [DOI] [PubMed] [Google Scholar]
- 17.Bergman RN. Lilly lecture. Toward physiological understanding of glucose tolerance. Minimal-model approach. Diabetes 1989; 38: 1512–1517. [DOI] [PubMed] [Google Scholar]
- 18.Kahn SE, Prigeon RL, McCulloch DK, Boyko EJ, Bergman RN, Schwartz MW, Neifing JL, Ward WK, Beard JC, Palmer JP, Porte D Jr. Quantification of the relationship between insulin sensitivity and β-cell function in human subjects: evidence for a hyperbolic function. Diabetes 1993; 42:1663–1672. [DOI] [PubMed] [Google Scholar]
- 19.Azziz R Fat biopsy procedure with Dr. Ricardo Azziz [video online], 2012. (https://www.youtube.com/watch?v=Gy2pFUjDlDM; accessed October 13, 2018).
- 20.Neville MJ, Collins JM, Gloyn AL, McCarthy MI, Karpe F. Comprehensive human adipose tissue mRNA and microRNA endogenous control selection for quantitative real-time-PCR normalization. Obesity (Silver Spring) 2011; 19: 888–892. [DOI] [PMC free article] [PubMed] [Google Scholar]
- 21.Chazenbalk G, Bertolotto C, Heneidi S, Jumabay M, Trivax B, Aronowitz J, Yoshimura K, Simmons CF, Dumesic DA, Azziz R. Novel pathway of adipogenesis through cross-talk between adipose tissue macrophages, adipose stem cells and adipocytes: evidence of cell plasticity. PLoS ONE 2011; 6: e 17834. [DOI] [PMC free article] [PubMed] [Google Scholar]
- 22.Salameh WA, Redor-Goldman MM, Clarke NJ, Mathur R, Azziz R, Reitz RE. Specificity and predictive value of circulating testosterone assessed by tandem mass spectrometry for the diagnosis of polycystic ovary syndrome by the National Institutes of Health 1990 criteria. Fertil Steril 2014; 101:1135–1141. [DOI] [PMC free article] [PubMed] [Google Scholar]
- 23.Knochenhauer ES, Key TJ, Kahsar-Miller M, Waggoner W, Boots LR, Azziz R. Prevalence of the polycystic ovary syndrome in unselected black and white women of the southeastern United States: a prospective study. J Clin Endocrinol Metab 1998; 83: 3078 – 3082. [DOI] [PubMed] [Google Scholar]
- 24.Chang W, Goodarzi MO, Williams H, Magoffin DA, Pall M, Azziz R. Adipocytes from women with polycystic ovary syndrome demonstrate altered phosphorylation and activity of glycogen synthase kinase 3. Fertil Steril 2008; 90: 2291–2297. [DOI] [PMC free article] [PubMed] [Google Scholar]
- 25.Ciaraldi TP, Mudaliar S, Barzin A, Macievic JA, Edelman SV, Park KS, Henry RR. Skeletal muscle GLUT1 transporter protein expression and basal leg glucose uptake are reduced in type 2 diabetes. J Clin Endocrinol Metab 2005; 90: 352–358. [DOI] [PubMed] [Google Scholar]
- 26.Dunaif A Insulin Resistance and the Polycystic Ovary Syndrome: Mechanism and Implications for Pathogenesis. Endocrine Reviews 1997; 6: 774–800. [DOI] [PubMed] [Google Scholar]
- 27.Ciaraldi TP, El-Roeiy A, Madar Z, Reichart D, Olefsky JM, Yen SS. Cellular mechanisms of insulin resistance in polycystic ovarian syndrome. J Clin Endocrinol Metab 1992; 75: 577–583. [DOI] [PubMed] [Google Scholar]
- 28.Pedersen O, Bak JF, Andersen PH, Lund S, Moeller DE, Flier JS, Kahn BB. Evidence against altered expression of GLUT1 or GLUT4 in skeletal muscle of patients with obesity or NIDDM. Diabetes 1990; 39: 865–870. [DOI] [PubMed] [Google Scholar]
- 29.Dunaif A, Finegood DT. Beta-cell dysfunction independent of obesity and glucose intolerance in the polycystic ovary syndrome. J Clin Endocrinol Metab 1996; 81: 942–947. [DOI] [PubMed] [Google Scholar]
- 30.Ehrmann DA, Sturis J, Byrne MM, Karrison T, Rosenfield RL, Polonsky KS. Insulin secretory defects in polycystic ovary syndrome. Relationship to insulin sensitivity and family history of non-insulin-dependent diabetes mellitus. J Clin Invest 1995; 96: 520–527. [DOI] [PMC free article] [PubMed] [Google Scholar]
- 31.Fischer Y, Thomas J, Sevilla L, Muñoz P, Becker C, Holman G, Kozka IJ, Palacín M, Testar X, Kammermeier H, Zorzano A. Insulin-induced recruitment of glucose transporter 4 (GLUT4) and GLUT1 in isolated rat cardiac myocytes. Evidence of the existence of different intracellular GLUT4 vesicle populations. J Biol Chem 1997; 272: 7085–7092. [DOI] [PubMed] [Google Scholar]
- 32.Ferrannini E, Bjorkman O, Reichard GA, Jr Pilo A, Olsson M, Wahren J, DeFronzo RA The disposal of an oral glucose load in healthy subjects. A quantitative study. Diabetes 1985; 34: 580–588. [DOI] [PubMed] [Google Scholar]
- 33.Abel ED, Peroni O, Kim JK, Kim YB, Boss O, Hadro E, Minnemann T, Shulman GI, Kahn BB. Adipose-selective targeting of the GLUT4 gene impairs insulin action in muscle and liver. Nature 2001; 409: 729–733. [DOI] [PubMed] [Google Scholar]
- 34.Carvalho E, Kotani K, Peroni OD, Kahn BB Adipose-specific overexpression of GLUT4 reverses insulin resistance and diabetes in mice lacking GLUT4 selectively in muscle. Am. J. Physiol. Endocrinol. Metab 2005; 289; E551–E561. [DOI] [PubMed] [Google Scholar]
- 35.Albers PH, Bojsen-Møller KN, Dirksen C, Serup AK, Kristensen DE, Frystyk J, Clausen TR, Kiens B, Richter EA, Madsbad S, Wojtaszewski JF. Enhanced insulin signaling in human skeletal muscle and adipose tissue following gastric bypass surgery. Am J Physiol Regul Integr Comp Physiol 2015; 309: R510 –R524. [DOI] [PubMed] [Google Scholar]
- 36.Bojsen-Møller KN. Mechanisms of improved glycemic control after Roux-en-Y gastric bypass. Dan Med J 2015; 62: B5057. [PubMed] [Google Scholar]
- 37.Smith U Impaired (‘diabetic’) insulin signaling and action occur in fat cells long before glucose intolerance--is insulin resistance initiated in the adipose tissue? Int. J. Obes. Relat. Metab. Disord 2002: 26, 897–904. [DOI] [PubMed] [Google Scholar]
Associated Data
This section collects any data citations, data availability statements, or supplementary materials included in this article.
Supplementary Materials
Supplemental Fig. 1. Scatter plot of adipocyte GLUT-1 and GLUT-4 mRNA expression (by RT-PCR) in PCOS (n=23) versus controls (n=23).


